Embed Size (px)
Citation preview
energies
Article
Eco-Energetical Life Cycle Assessment of Materialsand Components of Photovoltaic Power Plant
Izabela Piasecka 1 , Patrycja Bałdowska-Witos 1,* , Katarzyna Piotrowska 2 andAndrzej Tomporowski 1,*
1 Faculty of Mechanical Engineering, University of Science and Technology in Bydgoszcz, 85-796 Bydgoszcz,Poland; [email protected]
2 Faculty of Mechanical Engineering, Lublin University of Technology, 20-618 Lublin, Poland;[email protected]
* Correspondence: [email protected] (P.B.-W.); [email protected] (A.T.)
Received: 12 February 2020; Accepted: 12 March 2020; Published: 16 March 2020�����������������
Abstract: During the conversion of solar radiation into electricity, photovoltaic installations do notemit harmful compounds into the environment. However, the stage of production and post-usemanagement of their elements requires large amounts of energy and materials. Therefore, thispublication was intended to conduct an eco-energy life cycle analysis of photovoltaic power plantmaterials and components based on the LCA method. The subject of the study was a 1 MWphotovoltaic power plant, located in Poland. Eco-indicator 99, CED and IPCC were used ascalculation procedures. Among the analyzed elements of the power plant, the highest level ofnegative impact on the environment was characterized by the life cycle of photovoltaic panels storedat the landfill after exploitation (the highest demand for energy, materials and CO2 emissions). Amongthe materials of the power plant distinguished by the highest harmful effect on health and the qualityof the environment stands out: silver, nickel, copper, PA6, lead and cadmium. The use of recyclingprocesses would reduce the negative impact on the environment in the context of the entire life cycle,for most materials and elements. Based on the results obtained, guidelines were proposed for thepro-environmental post-use management of materials and elements of photovoltaic power plants.
Keywords: CED; Eco-indicator 99; IPCC; LCA; photovoltaics panels; recycling; landfill
1. Introduction
Climate change has occurred many times in the history of the planet Earth. For the first time,however, the climate is changing faster than before. The natural greenhouse effect, necessary for life,has been intensified in modern times as a result of human activity, and the thermal balance has beensignificantly shaken. For the protection of the climate, the energy sector is of strategic importance asthe largest consumer of energy raw materials and emitter of pollution. A sustainable energy policyshould ensure that the social needs of current and future generations are best met by maintaininga balance between energy security, competitiveness of the economy and environmental protection,including the climate [1–4].
Modern civilization has become almost completely dependent on energy. Economic and socialanalyses indicate that the civilization changes taking place are deepening this relationship (Table 1).Energy in all forms will play an increasingly important role not only in the economic but also in thesocial sphere [5–7].
Energies 2020, 13, 1385; doi:10.3390/en13061385 www.mdpi.com/journal/energies

Energies 2020, 13, 1385 2 of 25
Table 1. Energy consumption over the centuries per person per day [7].
Key Event Historical PeriodApproximate Amount of Energy
Consumed by One Person[MJ/day]
Prehistoric man (food energy) Up to 5000 years B.C. 9–10Man after controlling the fire Approximately 5000 years B.C. 20
Man after using animals for work About 3000 years B.C. 50Man after a technical revolution End of the 17th century 200
Modern man XXI century 300–1000
With the current state of technological development, energy is most often obtained by processingenergy raw materials, such as coal, natural gas or oil, and to a lesser extent from renewable energysources (e.g., solar radiation, water, wind, biomass). Energy resources are not evenly distributedeverywhere. Some countries do not have them at all or the resources they have at their disposal do notfully meet their energy needs. For this reason, they are forced to obtain the necessary raw materialsfrom regions where they occur in excess. The problem with energy resources is further complicated bythe fact that, in the opinion of numerous experts, their resources are limited and are running out [8–10].
One of the reasons that leads to rapid environmental degradation is excessive consumption ofenergy obtained from conventional sources. Pollution caused by burning fossil fuels is associated withthe production of a very large amount of harmful compounds, which include SO2, NOx, CO2, CO, aswell as ashes and waste heat. The effects of air pollution by conventional fuel power plants include:human and animal diseases, destruction of vegetation, destruction of building structures (includinghistoric buildings), metal corrosion and increased machine wear, etc. [11–13].
The need to increase the share of renewable energy in the energy balance of each country resultsfrom the obligation to reduce CO2 and other greenhouse gas emissions as a result of the growinggreenhouse effect, the need to replace depleting fossil fuel resources with other energy sources, and thedesirability of reducing dependence on energy suppliers from other countries [14,15].
Solar installations are becoming increasingly popular around the world. The advantage ofphotovoltaic cells is undoubtedly that their long-term, trouble-free operation allows for a significantreduction of harmful emissions. However, their production is very energy-intensive, which entailsthe emission of combustion products. Due to the presence of heavy metals in PV panels, their futurerecycling may also become a problem. The advantage of this branch of energy is the ubiquity of thesun’s rays, environmental friendliness and inexhaustibility. However, disadvantages include daily andannual cyclicity, radiation dispersion and significant costs of the equipment used [16–19].
In the global literature, many analyses can be found, mainly regarding the evaluation of solarpanels with particular emphasis on the conditions of the production process. Kumar et al. (2018)indicated that the effect of shape of abrasive and silicon crystal is relevant to the yield and the lifecycle of the solar cells over 20+year lifetime. In addition, the production process and the materialsand raw materials used are very important for the quality of the solar farm. A detailed analysis ofquality and durability was carried out by Kumar et al. (2017), proving that the impact of diamond wirewear impact on surface morphology, roughness and properties of silicon wafer subsurface. Despitenumerous publications describing the stages of the production process, no studies have been found onthe impact of selected system elements on the condition and development of the natural environment.Therefore, the following hypothesis is worth considering: which of the analyzed elements of the solarplant show the highest level of negative impact on the environment?
The pro-ecological attitude adopted by the authors is aimed at reducing gas emissions due to theoperation of PV cells, which must correspond with environmentally friendly technology for producingphotovoltaic cells. To this end, the authors made a detailed LCA (Life Cycle Assessment) analysisshowing stages throughout the life cycle of the system that have a negative impact on the environment.

Energies 2020, 13, 1385 3 of 25
Increasing care for nature leads to the development and use of increasingly complex methods thatgive control of, and the ability to counteract, the human impact on the environment. Therefore, manynew ways of assessing the impact of processes, products and industries on the environment have beencreated. One of them is the method of analysis and assessment in the context of the entire life cycleof products, i.e., their impact from the acquisition of raw materials to development. The Life CycleAssessment (LCA) method covers the environmental impact of production, operation and post-usemanagement and is in accordance with the principle of sustainable development [20–22].
Each source of energy, even classified as renewable, has a certain impact on the environment.Photovoltaics are widely regarded as a “green”, environmentally friendly energy source. Duringphotovoltaic installation exploitation, solar radiation is converted into electricity. This process doesnot cause emissions of harmful substances into the environment, unlike analogous ones, when usingconventional resources (e.g., emissions of CO2, SO2, NOx, dust, etc., as a result of burning coal). Thefact that the production and post-use development of plastics and components of photovoltaic powerplant is usually overlooked is the need for large material expenditures, for example related to theextraction of raw materials for the production of plant components or chemicals necessary for recyclingprocesses. In addition, the accompanying processes (for example production of PV cells using theCzochralski method) are extremely energy-consuming. During the entire lifecycle of a photovoltaicinstallation, many compounds and chemicals are emitted that can have a negative impact on theenvironment, and large amounts of energy are required (especially at the production stage). In view ofthe above, main target of this study is an ecological and energetical life cycle assessment of materialsand components of photovoltaic power plant.
2. Materials and Methods
2.1. Object and Plan of Analysis
The object of this study is a photovoltaic power plant with a capacity of 1 MW, situated in thenorthern Poland, which produces from 950 to 1100 MWh of electricity per year. As a reference forthe purpose of further analyses, it was assumed that the system produced 1,000 MWh per year. Thebasic elements of the parsed photovoltaic power plant are: supporting structures, photovoltaic panels,cables and straight connectors for electrical installations, container station along with the static inverters(including DC switchgear, DC/AC inverters, AC/LV switchgear, LV/MV transformer, MV switchgear,control and surveillance system, the system of measurement of energy generated).
An LCA study (in accordance with ISO 14000) consists of four stages: determination of goal and scope,life cycle inventory (LCI), life cycle impact assessment (LCIA) and interpretation (Figure 1) [23–25].
Figure 1. Life Cycle Assessment (LCA) framework.
In accordance with the mentioned ISO standards, the analysis plan consisted of four basic steps.In the first of them, the purpose of the study and its scope were determined, which are described indetail in Section 2.2. The basis for their formulation was the collection of the largest possible amountof data on the studied object. Key data for the analysis were provided by the owner of a 1 MW

Energies 2020, 13, 1385 4 of 25
photovoltaic power plant located in Poland. In addition, detailed information on the productionand operation of photovoltaic panels, inverter stations, cables and cabling accessories was obtainedfrom their manufacturers. We also managed to obtain data from a post-use PV panel managementcompany. Details on the second step of the analysis are provided in Section 2.3. The third step involvedperforming a comprehensive ecological and energetical analysis of the life cycle of the photovoltaicpower station under study. SimaPro 8.4 software (PRé Sustainability, LE Amersfoort, Netherlands)was used for this purpose. The basic calculation procedure was the Eco-indicator 99 method, whichallows the assessment of the impact of the photovoltaic power plant’s life cycle on the environment,including human health, ecosystem quality, and resources. To determine the energy demand and CO2
emissions at each stage of the life cycle, in addition the CED and the IPCC methods were used. TheIPPC method was used for CO2 emission quantitative assessment to indicate which of the materialstages of the life cycle involves the highest level of greenhouse gas emissions (CO2), the reduction ofwhich is one of the key aims of the European Union countries. The CED method was used to identifythe share of a photovoltaic power plant life stages in the energy demand from different sources. Inthis way, a comprehensive analysis of a photovoltaic power plant cycle, including important areas ofsustainable development, that is, CO2 emission (IPCC method), energy consumption (CED method),human health, ecosystem quality and resources (Eco-indicator 99 method), was provided.
The characteristics of this stage of the analysis are described in Section 2.4 and the results arepresented in Sections 3.1–3.5. The last, fourth step was the interpretation of the results of the analysis,which are presented in Sections 2.5 and 4 (“Conclusions”).
2.2. Determination of Goal and Scope
This work analyzes several single products connected in a one system—a photovoltaic powerstation. The analysis, which was conducted as part of this publication, aimed at the numericaldetermination of the value of the environmental impact related to the life cycle of a 1 MW PV powerstation. The purpose of the analysis is, most of all, to describe the existing reality (retrospectiveLCA), but also to model future changes and determine recommendations aimed at developing morepro-environmental solutions (prospective LCA). The procedure will constitute a classic process LCA,the purpose of which will be to determine the extent of the negative environmental impact of thelife cycle of the analyzed object [26–28]. For this purpose, selected elements of the solar installationwere analyzed: photovoltaic panels, supporting structures, inverter station, electrical installations.The environmental assessment included 11 impact categories: Carcinogens, Resp. Organics, Resp.Inorganics, Climate change, Radiation, Ozone layer, Ecotoxicity, Acidification / eutrophication, Landuse, Minerals, Fossil fuels. The research results are divided into four phases, described as: production,exploitation, landfill and recycling. Among the eleven categories available, categories with the highestlevel of significance were selected for which detailed emissions of compounds into the environmentwere presented.
Most of the processes performed under the analyzed stages of the life cycle of the photovoltaicpower station (production, exploitation, post-use management) take place in Europe. Therefore, thestudy scope was referenced to the European conditions. The territory of Poland was taken as thegeographical area, while the time horizon taken was 20 years (average operation time of photovoltaicsystems). Electric energy production was assumed as a function of the photovoltaic power plant. Afunctional unit was defined as a production of 1000 MWh of electric power by the relevant systemin a year. The analysis did not cover the stages of transport, sales, technical tests, and storage. Themain reason for this was the lack of appropriate data and large differences in the effects of transportdepending on the power plant location.
2.3. Life Cycle Inventory (LCI)
To collect data, special sheets were prepared. Each sheet was assigned to a specific unit process,with a division into process inputs, process performance, and process outputs (Figure 2). Process inputs

Energies 2020, 13, 1385 5 of 25
included main materials, auxiliary materials, and water; process performance involved duration andmedia consumption; process outputs included main product, waste, and emissions. Data concerningprocesses and materials less significant from the point of view of environmental impact were obtainedfrom databases included in the SimaPro 8.4 software(PRé Sustainability, LE Amersfoort, Netherlands).Due to confidentiality agreements with companies manufacturing photovoltaic power station elements,any detailed information regarding the design of the analyzed objects and process data are not subjectto disclosure in this publication [29,30].
Figure 2. The material life cycle of photovoltaic power plants.
After the data were assigned to the unit processes, they were validated through bilateral energyand mass balance. Models were constructed systematically and filled with data. The input valuewas equilibrated by the output value. This operation made data aggregation and quantification perfunctional unit and reference flows possible. By totaling environmental interventions of the same type(inputs of material, energy, waste, emissions, etc.) for all the unit processes, input–output matriceswere obtained that were referenced to the reference flows. The next step was to adapt them to aformat compatible with the SimaPro 8.4 software. This allowed us to enter data into a calculator andproceed with another stage of the analysis. Information supplied by the manufacturer allowed aprecise determination of the values of the materials and energy used in the photovoltaic power stationlife cycle [31–33].
The relevant power station was equipped with photovoltaic panel support structures made ofgalvanized steel (mainly due to economic benefits and numerous technical advantages). The supportstructure in a dual system was placed directly in the ground. Properly selected photovoltaic panels

Energies 2020, 13, 1385 6 of 25
constitute a key element of the entire photovoltaic plant. The construction of the relevant power plantneeded a system of 4170 polycrystalline photovoltaic modules with a capacity of 240 W demonstratinga performance up to 17.7%. The manufacturer’s declared performance amounts to 91.2% of ratedcapacity for the first 10 years and 80.7% for a period of another 15 years. Each single module iscomposed of 60 photovoltaic cells. The panels are made of glass, aluminum, silica, EVA (ethylene-vinylacetate copolymer), PVB (polyvinyl butyral), cadmium, lead, copper, nickel, selenium, and silver. Themodules are connected in series and are inclined at an angle of 35◦ in the southern direction (this is dueto the fact that the angle of the PV panels tilt relative to the horizon depends on the latitude (ϕ). Thelocation of the analyzed object is 54◦N. The angle of the sun above the horizon is H = 90 ◦-ϕ; therefore,for the location considered it will be 36◦. The highest efficiency is obtained with a perpendicular angleof incidence of sunlight on the panel surface. In Poland, for year-round operation, the optimal angle forplacing PV panels is about 30-40◦ and pointing southwards). To function properly, each photovoltaicsystem should be equipped with proper wires and cabling accessories. The relevant plant, locatedon the ground, employed wires with pre-terminated ends (galvanized copper conductor, internalinsulation and external sheath made of cross-linked polyolefin), control cables and wires, different typesof connectors and splitters (galvanized copper contacts), cable glands (body: PVDF—polyvinylidenefluoride and polyamide PA6; seal: silicone or neoprene) and protection hoses (modified polyamidePA12). In the relevant solution of photovoltaic power station, a central inverter substation was used.Megawatt substation constitutes a comprehensive solution dedicated for solar power plants with ahigh installed capacity. It contains the electrical equipment necessary to connect photovoltaic powerstations to a medium voltage electric power network. The station accommodates two central inverters,optimized transformer, MV switchgear, DC connections for PV modules, and a monitoring system.Made of steel, the insulated container is placed on a concrete base. The entire megawatt substationweighs nearly 20 tons, while the volume of the container amounts to almost 50 m3 (manufacturer’sdata).
2.4. Life Cycle Impact Assessment (LCIA)
Life cycle impact assessment was performed with the use of the SimaPro 8.4 calculation software.Cut-off level amounted to 0.1%. LCIA results are presented in Section 3 of this article.
2.4.1. Eco-indicator 99 method
Eco-indicator 99 method was chosen as the base calculation procedure. Eco-indicator 99 belongsto a group methods for modeling the environmental impact of environmental endpoint mechanism.The process of characterization is done for the eleven categories of impact, coming within three largergroups referred to as impact areas or categories of damages. There are the following areas of impact:human health, ecosystem quality, and resources. The results of the impact area indicators are furtheranalyzed through normalization, grouping and weighting into the final Ecolabel. Eco-indicator 99method offers 11 impact categories with a wide spectrum of analysis areas (Figure 3). The first damagecategory (carcinogens, resp. organics, resp. inorganics, climate change, radiation, ozone layer) isexpressed in DALY (Disability Adjusted Life Years)—the number of years spent in the disease or lost.Assessment of the impact on the environment was performed with the use of a scale from 0 to 1, where 0stands for a lack of impact on the human health and 1 stands for death. The damage to ecosystemquality is expressed in terms of the percentage of species that have disappeared in a certain area due tothe environmental load. Ecotoxicity covers the percentage of all species present in the environmentliving under toxic stress (PAF—Potentially Affected Fraction). Regarding acidification/eutrophicationand land use, the damage to a specific target species (vascular plants) in natural areas is modeled(PDF—Potentially Disappeared Fraction). The damage category covering resource extraction givesa value expressed in MJ surplus energy to indicate the quality of the remaining mineral and fossilresources. The final goal of the grouping and weighting analysis was to obtain environmentalfactors expressed in environmental points (Pt), constituting aggregated units enabling comparisons of

Energies 2020, 13, 1385 7 of 25
eco-balance sheets. A thousand environmental points are equal to the impact on one’s environment,the average European within a year. The value of 1 Pt (eco-point) is representative for one thousandthof the yearly environmental load of one average European inhabitant. It is calculated by dividingthe total environmental load in Europe by the number of inhabitants and multiplying it with 1000.Due to the lack of express premises for exclusions, all the impact categories functioning within theEco-indicator 99 (Eco-indicator 99 (H) V2.06/Europe EI 99 H/A) were subject to analysis [34–37].
Figure 3. Structure of LCA impact category groupings, Eco-indicator 99 method.
Due to the fact that the purpose of the research was to carry out ecological and energy life cycleanalysis of photovoltaic power plant materials and components, in addition to the Eco-indicator 99method, it was decided to additionally use two other methods—CED and IPCC. As part of Eco-indicator99, two impact categories (“minerals” and “fossil fuels”) refer to energy analyzes (value expressedin MJ surplus energy), but due to the need for expand the scope of their research with an additionalassessment of cumulative energy demand in each phase lifecycle. Therefore, the CED method wasused, as described in Section 2.4.3. Nowadays, great attention is also paid to the issue of excessive CO2emissions, which is why it was decided to use another method, IPCC, which makes it possible to assessthe impact of greenhouse gases on the increase of the greenhouse effect and obtain results for eachstage of the life cycle expressed in kg CO2 eq. As a result of this procedure, the results obtained underthe category “climate change” in the Eco-indicator 99 method are more detailed. A more detaileddescription of the IPCC method is provided in Section 2.4.2.
2.4.2. IPCC Method
The IPCC (Intergovernmental Panel on Climate Change, Global Warming Potential) method hasmade it possible to perform a quantitative assessment of the impact of particular greenhouse gasses(GHG) for the greenhouse effect, with respect to CO2. The carbon dioxide indicator in order to assessthe impact on the greenhouse effect is equal to 1 (GHG = 1). This research was conducted in accordance
Energies 2020, 13, 1385 8 of 25
with the IPCC standard: IPCC 2007 GWP 100a V1.01 (Intergovernmental Panel on Climate Change,Global Warming Potential, time horizon: 100 years) [38–41].
2.4.3. CED Method
The CED (Cumulative Energy Demand) method allows the determination of the cumulativeenergy demand. The impact indicators are divided into seven impact categories: two non-renewable(nuclear power, fossil fuels) and five renewable (biomass, water, solar, wind and geothermal energy).The research was conducted in accordance with the CED standard: Cumulative Energy DemandV1.05 [42–44].
2.5. Interpretation
During the analysis, its completeness was checked against the positive result. All the importantinformation and data necessary for interpretation were complete and obtainable directly fromthe manufacturer, the recycling company, and from the databases of the SimaPro software(PRé Sustainability, LE Amersfoort, Netherlands). Conformity was checked during the analysis.Assumptions, methods, analysis depth, specificity and precision of data for both systems are compliantwith the previously assumed goal and scope of analysis. Detailed interpretation of the results obtainedis presented in Sections 3 and 4.
3. Results and Discussion
3.1. Eco-Indicator 99
Table 2 presents the results of characterizing the environmental consequences occurring in the lifecycle of selected components of the 1 megawatt photovoltaic power plant. Impacts are presented inthe 11 categories of impact characteristic of the Eco-indicator 99 method. Two impact models weredistinguished: the first one was the life cycle, including landfill disposal as a form of post-disposalmanagement, while the second one was recycling. For all adverse effects in the area of human health,all tested groups showed the highest negative impact on the category of inorganic compounds causingrespiratory diseases (e.g., life cycle of photovoltaic panels with landfill: 0.22 DALY; inverter life cyclewith storage: 0.14 DALY). The largest quantity is formed at the stage of production of materials andelements, and the maximum share is characterized by sulfur dioxide and nitrogen oxides. Thesecompounds are poisonous to humans and animals and have a harmful effect on plants. Sulfur dioxideis a by-product of burning fossil fuels, which, for example, contributes to atmospheric pollution (smog).In turn, nitrogen oxide is a compound with high biological activity and easily penetrates biologicalmembranes. It is also created, among other things, as a result of burning fossil fuels and industrialprocesses that can cause smog. For categories affecting environmental deterioration, the ecotoxiccompounds category was the most important, for which the maximum level of harmful impact wasrecorded for photovoltaic panels deposited in landfill: 137,741 PAF·m2/a. Ecotoxic compounds aresubstances which, due to their origin, chemical, biological or other properties, constitute or maypose a direct or delayed threat to humans, animals and plants. In the life cycle of a photovoltaicpower plant, the largest amount arises from the storage of materials and components at the landfill.A particular threat is copper ion emissions, which in addition to reducing the quality of the environment,can contribute to the formation of diseases of the nervous and digestive systems in humans (forexample: mental disorders or liver damage). In the area of processes affecting the depletion of rawmaterial resources, the highest level of harmful impact was recorded in the raw materials category forthe life cycle of electrical installations with post-consumer use in the form of landfill (322,646 MJ), and inthe fossil fuels category for the life cycle of photovoltaic panels placed in landfill after use (400,584 MJ).The largest amount of fossil fuels is consumed during the plastics and materials plant productionphase. The most processes with the highest energy demand include, for e.g., the production of PVcells. Burning of conventional fuels is associated with many hazardous emissions to the atmosphere,

Energies 2020, 13, 1385 9 of 25
water and soil, which are the causes of, for examplem, diseases, increasing the greenhouse effect,ozone layer depletion or increased smog and acid rain. In most of the categories considered, there is apositive impact of the use of recycling processes, to reduce the harmful impact of particular groups ofcomponents of the analyzed photovoltaic power plant.
Table 2. Results of characterization of environmental consequences, occurring in the life cycle ofselected groups of 1 megawatt photovoltaic power plant.
Impact Category Photovoltaic Panels SupportingStructures Inverter Station Electrical
Installations Unit
Landfill Recycling Landfill Recycling Landfill Recycling Landfill Recycling
Carcinogens 0.07 -0.01 0.03 0.00 0.02 0.00 0.00 0.00 DALYResp. organics 0.00 0.00 0.00 0.00 0.00 0.00 0.00 0.00 DALY
Resp. inorganics 0.22 -0.03 0.02 0.01 0.14 0.10 0.05 0.05 DALYClimate change 0.05 -0.03 0.01 0.00 0.02 0.00 0.00 0.00 DALY
Radiation 0.00 0.00 0.00 0.00 0.00 0.00 0.00 0.00 DALYOzone layer 0.00 0.00 0.00 0.00 0.00 0.00 0.00 0.00 DALYEcotoxicity 137,741 -5015 106,619 48,706 60,968 21,959 4326 309 PAF·m2/a
Acidification/eutrophication 6650 1234 546 236 4412 3517 1179 1138 PDF·m2/a
Land use 3605 3458 657 610 4521 4485 1189 1185 PDF·m2/aMinerals 68,116 -573 1692 8 10,203 -645 322,646 322,644 MJ
Fossil fuels 400,584 32,805 25,454 13,088 79,294 24,498 24,074 22,009 MJ
The results of grouping and weighting the environmental after-effects of the existence of selectedgroups of 1 MW photovoltaic power plants are summarized in Table 3. For the life cycle of photovoltaicpanels deposited in landfill, the highest level of harmful impact was recorded in terms of: fossil fuelextraction (9534 Pt), inorganic compounds causing respiratory diseases (5729 Pt), mining of minerals(1621 Pt) and carcinogenic compounds (1822 Pt). Silicon cell production processes are associatedwith a huge demand for energy, which in the case of the analyzed power station is about 5 millionMJ. This energy is most often obtained from non-renewable sources, which causes many negativeimpacts in relation to human and animal health, and a reduction in the quality of the environment.Another problem is the excessive exploitation of raw material deposits, including silver, used in theelectrical contacts of the cells, whose extraction causes the most negative consequences in comparisonto other substances and chemical compounds used in the production of PV cells. For the life cycle ofsupporting structures, including post-use disposal, the categories were: ecotoxic compounds (832 Pt),carcinogenic compounds (827 Pt), and fossil fuel extraction (606 Pt). Supporting structures weremade mainly of galvanized steel. The galvanizing process of steel poses a threat to health and theenvironment. In thermal processes, smoke and zinc vapors (especially particles smaller than 1 µm) can,for example, get into the respiratory system, causing many diseases. In the life cycle of the inverterstation including landfill disposal, the highest levels of negative impact were reported in terms of:inorganic compounds causing respiratory disease (3725 Pt), and fossil fuel extraction (1887 Pt). In thecycle of existence of an electrical installation, which after ending its life cycle will be deposited inlandfill, the most negative influence on the environment was attributed to mineral extraction (7679 Pt)and inorganic compounds causing respiratory diseases (1327 Pt). An important element found inboth inverter station and electrical installation are electrical cables and wires. The main raw materialfor their production is copper, the extraction and processing of which is associated with very highenergy inputs, obtained from conventional sources. As a consequence, many harmful compoundsare emitted into the environment, and the resources of raw materials and fuels are depleted. Theapplication of recycling would reduce the harmful impact on the environment of all analyzed groupsof photovoltaic elements.

Energies 2020, 13, 1385 10 of 25
Table 3. Results of grouping and weighting environmental consequences, occurring in the cycle ofexistence of selected groups of 1 megawatt photovoltaic power plant [unit: Pt].
Impact Category Photovoltaic Panels Supporting Structures InverterStation Electrical Installations
Landfill Recycling Landfill Recycling Landfill Recycling Landfill Recycling
Carcinogens 1822 -359 827 79 557 68 53 1Resp. organics 7 -8 1 1 4 2 0 0
Resp. inorganics 5729 -667 431 219 3725 2703 1327 1299Climate change 1431 -810 358 25 502 63 96 88
Radiation 10 9 8 8 12 12 0 0Ozone layer 1 -2 0 0 0 0 0 0Ecotoxicity 1074 -39 832 380 476 171 34 2
Acidification/eutrophication 519 96 43 18 344 274 92 89
Land use 281 270 51 48 353 350 93 92Minerals 1621 -14 40 0 243 -15 7679 7678
Fossil fuels 9534 781 606 311 1887 583 573 524
Total 22029 -743 3197 1089 8103 4210 9947 9774
The highest total level of harmful impact on the environment is the life cycle of photovoltaicpanels ending in landfill storage (22,029 Pt), but in this case, the use of recycling processes significantlyreduces their negative impact on the environment. The key reason for this is the abovementionedvery high energy demand in the production of PV cells. Reuse of cells recovered in the recyclingprocess is associated with large savings in both energy and materials (e.g., elimination of significantmaterial losses arising during cutting silicon rollers). The lowest total damaging effect was found inthe supporting structures (1089 and 3197 Pt) (Figure 4).
Figure 4. Results of grouping and weighting of environmental impacts occurring during the material lifecycle of selected groups of 1 megawatt photovoltaic power plant for all categories of influence [unit: Pt].
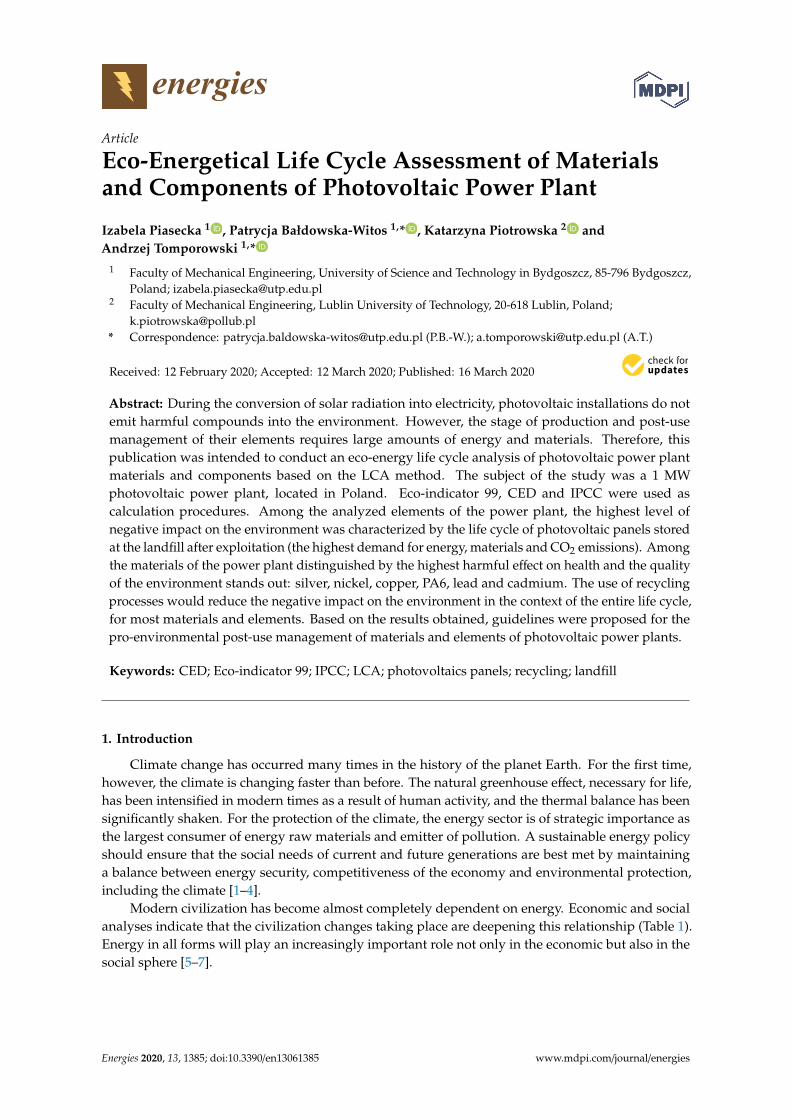
The highest level of harmful impact on the environment of 1 MW photovoltaic power plant wasobserved at the manufacturing stage. The largest category of harmful effects was characterized by thecategories of fossil fuel extraction and minerals, while the smallest – compounds causing the increaseof the ozone hole. The largest share in the negative impact on the environment was characterized bythe production processes of PV panels, which are part of the photovoltaic power plant with the highestdemand for energy and materials. The lowest level of negative impact was the exploitation stage (32 Pttotal). By comparing the received forms of post-use management, the most negative influence on theenvironment is the landfill. Carcinogenic compounds and ecotoxic compounds can be classified as themost potent adverse effects. The use of recycling processes would reduce the impact of the life cycle in
Energies 2020, 13, 1385 11 of 25
most of the impact categories analyzed. The fossil fuel mining processes and emissions of inorganiccompounds affecting respiratory diseases would be most positively affected (Figure 5).
Figure 5. Grouping and weighting results of environmental impacts occurring in the material life cyclestages of a 1 megawatt photovoltaic power plant [unit: Pt].
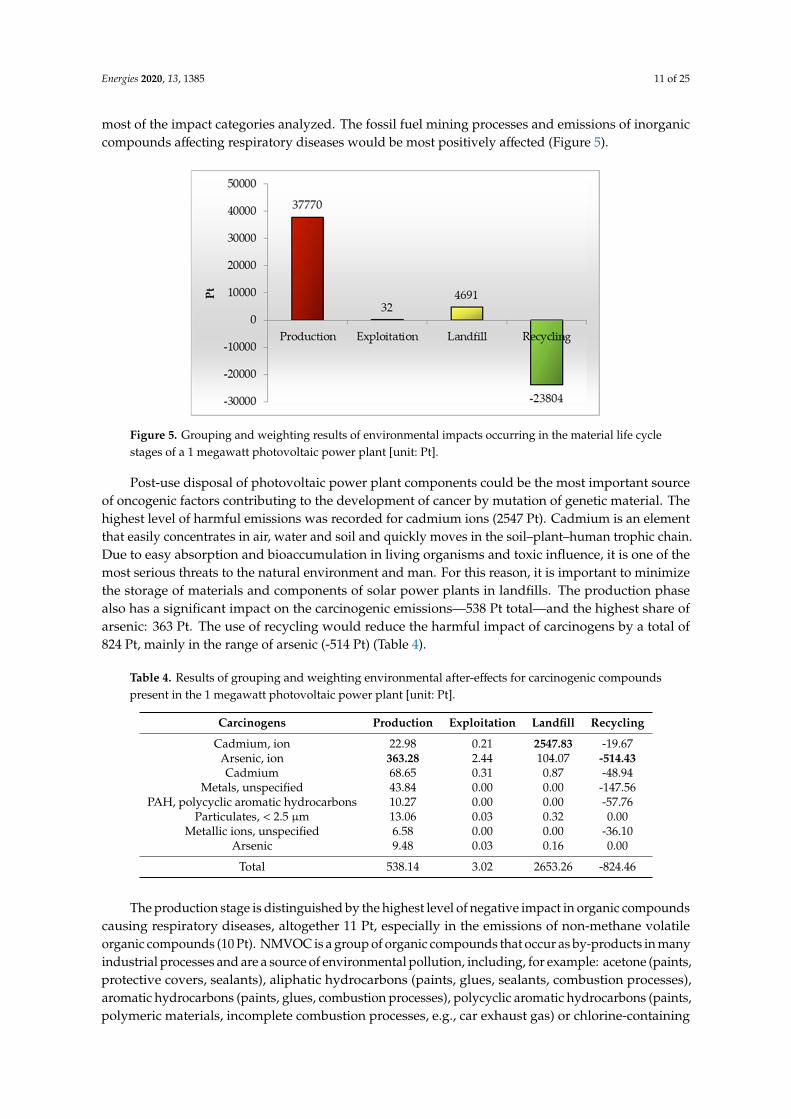
Post-use disposal of photovoltaic power plant components could be the most important sourceof oncogenic factors contributing to the development of cancer by mutation of genetic material. Thehighest level of harmful emissions was recorded for cadmium ions (2547 Pt). Cadmium is an elementthat easily concentrates in air, water and soil and quickly moves in the soil–plant–human trophic chain.Due to easy absorption and bioaccumulation in living organisms and toxic influence, it is one of themost serious threats to the natural environment and man. For this reason, it is important to minimizethe storage of materials and components of solar power plants in landfills. The production phasealso has a significant impact on the carcinogenic emissions—538 Pt total—and the highest share ofarsenic: 363 Pt. The use of recycling would reduce the harmful impact of carcinogens by a total of824 Pt, mainly in the range of arsenic (-514 Pt) (Table 4).
Table 4. Results of grouping and weighting environmental after-effects for carcinogenic compoundspresent in the 1 megawatt photovoltaic power plant [unit: Pt].
Carcinogens Production Exploitation Landfill Recycling
Cadmium, ion 22.98 0.21 2547.83 -19.67Arsenic, ion 363.28 2.44 104.07 -514.43Cadmium 68.65 0.31 0.87 -48.94
Metals, unspecified 43.84 0.00 0.00 -147.56PAH, polycyclic aromatic hydrocarbons 10.27 0.00 0.00 -57.76
Particulates, < 2.5 µm 13.06 0.03 0.32 0.00Metallic ions, unspecified 6.58 0.00 0.00 -36.10
Arsenic 9.48 0.03 0.16 0.00
Total 538.14 3.02 2653.26 -824.46
The production stage is distinguished by the highest level of negative impact in organic compoundscausing respiratory diseases, altogether 11 Pt, especially in the emissions of non-methane volatileorganic compounds (10 Pt). NMVOC is a group of organic compounds that occur as by-products in manyindustrial processes and are a source of environmental pollution, including, for example: acetone (paints,protective covers, sealants), aliphatic hydrocarbons (paints, glues, sealants, combustion processes),aromatic hydrocarbons (paints, glues, combustion processes), polycyclic aromatic hydrocarbons (paints,polymeric materials, incomplete combustion processes, e.g., car exhaust gas) or chlorine-containing

Energies 2020, 13, 1385 12 of 25
compounds (varnishes, solvents). During storage of the power plant components in landfill, biogenicmethane may be the greatest risk: 1 Pt. Recycling processes would reduce the damaging impact of thetotal lifetime by 17 Pt, including non-methane volatile organic compounds by 16 Pt (Table 5).
Table 5. Results of grouping and weighting of environmental after-effects for organic compoundscausing respiratory diseases, occurring in the 1 megawatt photovoltaic power plant [unit: Pt].
Resp. Organics Production Exploitation Landfill Recycling
NMVOC, non-methane volatile organic compounds 10.08 0.00 0.11 -16.69Methane, biogenic 0.01 0.00 0.59 0.00
Hydrocarbons, unspecified 0.32 0.00 0.00 0.00Methane, fossil 0.20 0.00 0.03 0.00
Methane 0.16 0.00 0.00 -0.31Ethane 0.20 0.00 0.00 0.00
Hydrocarbons, aromatic 0.03 0.00 0.00 -0.11Pentane 0.03 0.00 0.00 0.00Propane 0.02 0.00 0.00 0.00
PAH, polycyclic aromatic hydrocarbons 0.02 0.00 0.00 -0.09
Total 11.10 0.00 0.73 -17.21
The highest level of harmful impact on the environment of respiratory organisms caused byrespiratory diseases occurring during the 1 MW photovoltaic power plant cycle was recorded for theproduction stage–10,837 Pt in total. The highest share was in sulfur dioxide (3194 Pt) and nitrogen oxide(3091 Pt). Recycling would allow a total reduction of harmful effects of 7423 Pt, mainly in the sulfuroxide (-3274 Pt) and particulates in total (-2521 Pt). A key negative health role is played by atmosphericaerosols or particulate matter (PM). They are drops or solid particles of natural or anthropogenic origin(impurities). PM 2.5 (particle size 2.5 µm or smaller) is the most harmful because prolonged exposureto it results in a reduction in life expectancy, while short-term exposure to high concentrations causesan increase in deaths from respiratory and circulatory diseases and increases the risk of emergenciesthat require hospitalization (for example: worsening of asthma, decreased lung function), because dustenters the blood directly through the lungs. Atmospheric aerosols also contribute to smog (Table 6).
Table 6. Results of grouping and weighting of environmental after-effects for inorganic compoundscausing respiratory diseases, occurring in the 1 megawatt photovoltaic power plant [unit: Pt].
Resp. Inorganics Production Exploitation Landfill Recycling
Sulfur dioxide 3193.91 3.42 7.30 0.00Nitrogen oxides 3090.90 2.35 37.28 -1627.29
Sulfur oxides 1453.19 2.01 0.00 -3273.87Particulates, > 2.5 µm, and < 10 µm 1214.04 0.21 3.14 0.00
Particulates 531.42 0.03 0.00 -2520.56Particulates, < 2.5 µm 1023.94 2.53 23.95 0.00
Ammonia 196.78 0.00 0.39 -1.18Particulates, < 10 µm (stationary) 82.79 0.06 0.00 0.00
Nitrogen dioxide 27.70 0.00 0.00 0.00Particulates, < 10 µm (mobile) 22.70 0.00 0.00 0.00
Total 10837.39 10.61 72.07 -7422.90
The highest level of emissions of substances causing climate change is the production of materials,and components, which results in a total of 2049 Pt, mainly composed of carbon dioxide (891 Pt).Over the past two centuries there has been a marked acceleration of climate change. The basic factorshaping the speed of these changes is the emission of carbon dioxide and other greenhouse gases,which arise, for example: during the exploitation of fossil fuels, used in the life cycle of a photovoltaicpower plant most often for obtaining electricity for various processes, including the energy most

Energies 2020, 13, 1385 13 of 25
intensive—PV cell production. Landfill disposal can result in total negative emissions of 292 Pt,primarily biogenic methane (201 Pt). Recycling, as a form of post-use management, would allow thereduction of dangerous emissions by a total of 2685 Pt, mainly in carbon dioxide (-1947 Pt) (Table 7).
Table 7. Results of grouping and weighting of environmental after-effects for compounds causingclimate change, occurring in the 1 megawatt photovoltaic power plant [unit: Pt].
Climate Change Production Exploitation Landfill Recycling
Carbon dioxide 890.86 0.30 0.00 -1946.84Carbon dioxide, fossil 878.77 2.89 13.97 0.00
Methane, biogenic 2.03 0.00 201.40 0.00Tetrafluoromethane, CFC-14 122.12 0.00 0.00 -606.04
Methane, tetrafluoro-, CFC-14 40.81 0.03 65.20 0.00Carbon dioxide, biogenic 67.46 0.15 10.73 0.00
Methane, fossil 54.93 0.01 0.00 -107.33Methane 22.61 0.00 0.67 0.00
Carbon monoxide 13.47 0.00 0.00 -25.05Carbon dioxide, in air -44.27 -0.04 -0.08 0.00
Total 2048.80 3.35 291.90 -2685.26
Radioactive compounds are characterized by possessing nuclear nuclei with radioactive decay,most commonly associated with alpha particle emission, beta particles, and gamma radiation. Thehighest number of such elements in the 1 MW photovoltaic power plant cycle was noted for theproduction phase (total 28 Pt). It is associated with the processes of extracting mineral resources andfossil fuels, during which there are not only emissions of dust and gases containing many harmfulsubstances (e.g., sulfur and nitrogen oxides, chlorine, fluorine, heavy metals), but also radioactiveelements such as uranium, thorium, and potassium, and their breakdown products, for example:radium and radon. In this case, these are mainly radon isotopes—222Ra (21 Pt)—and carbon—14C(7 Pt) (Table 8).
Table 8. Results of grouping and weighting of environmental after-effects for radioactive compounds,occurring in the 1 megawatt photovoltaic power plant [unit: Pt].
Radiation Production Exploitation Landfill Recycling222 Radon 20.95 0.02 0.42 0.0014 Carbon 6.52 0.00 0.22 0.00
137 Cesium 0.56 0.00 0.00 0.0060 Cobalt 0.07 0.00 0.00 0.00
134 Cesium 0.05 0.00 0.00 0.0085 Krypton 0.04 0.00 0.00 0.00
Total 28.19 0.02 0.64 0.00
The ozone hole is a phenomenon of a decrease in the concentration of ozone (O3) in the stratosphere,resulting in a decrease in the level of absorption of ultraviolet radiation reaching the Earth fromthe Sun. It is, therefore, a threat to living organisms. During the processes of producing materials,and components of the plant under investigation, harmful substances causing the ozone hole to increasein total 2 Pt are formed, mainly bromotrifluoromethane (1,5 Pt). Halon 1301 may have a toxic effect onthe central nervous system and other bodily functions (Table 9).

Energies 2020, 13, 1385 14 of 25
Table 9. Results of grouping and weighting of environmental after-effects for ozone-increasingcompounds, occurring in the 1 megawatt photovoltaic power plant [unit: Pt].
Ozone Layer Production Exploitation Landfill Recycling
Methane, bromotrifluoro-, Halon 1301 1.48 0.00 0.01 -1.17Methane, bromochlorodifluoro-, Halon 1211 0.30 0.00 0.00 0.00
Methane, tetrachloro-, CFC-10 0.15 0.00 0.00 0.00Ethane, 1,2-dichloro-1,1,2,2-tetrafluoro-, CFC-114 0.06 0.00 0.00 0.00
Methane, chlorodifluoro-, HCFC-22 0.03 0.00 0.00 0.00
Total 2.03 0.00 0.01 -4.17
Comparing all phases of the life cycle, particularly high levels of harmful impact of waste disposalin the form of waste landfills are visible in the category of ecotoxic compounds (a total of 1503 Pt). Themost significant level of negative emissions was copper ions (1200 Pt). The high level of emissions ofecotoxic substances is also characterized by the production phase (total 837 Pt), which consists mainlyof the harmful effects of nickel (280 Pt) and zinc (263 Pt). Recycling could significantly reduce emissionsby a total of -397 Pt, primarily in terms of minimizing the negative impact of nickel (-212 Pt). Nickel isused in the manufacture of many materials and components of a photovoltaic power plant, rangingfrom steel elements to resistors. The main source of nickel in the environment is the combustion ofconventional fuels (especially coal and oil), as well as steel production and electroplating processes.The absorption of nickel into the body is primarily through the respiratory system. Nickel tends toaccumulate in the lungs. With wind and rain, it gets into soil and groundwater. It is also one of thecomponents of smog (Table 10).
Table 10. Results of grouping and weighting of environmental after-effects for ecotoxic compounds,occurring in the 1 megawatt photovoltaic power plant [unit: Pt].
Ecotoxicity Production Exploitation Landfill Recycling
Copper, ion 7.91 0.05 1199.53 -8.44Zinc 263.02 0.36 1.04 -20.11
Nickel 280.00 0.04 0.51 -211.57Zinc, ion 0.40 0.00 120.31 0.00
Nickel, ion 16.93 0.05 102.76 -8.33Chromium 128.99 0.02 1.37 -7.28
Lead 61.60 0.04 26.34 30.08Cadmium, ion 0.10 0.00 51.01 0.00
Metals, unspecified 40.87 0.00 0.00 -161.86Copper 20.32 0.03 0.17 1.21
Cadmium 12.54 0.07 0.00 -10.48
Total 836.87 0.67 1503.04 -396.76
Acidification of the environment is a phenomenon of progressive decrease in the pH value ofits individual components. It can be caused by anthropopressure, for example: by emissions of airpollutants (e.g., SO2, NOx, NH3) as a result of combustion of conventional fuels. Eutrophication, onthe other hand, consists of enriching the environment with biophilic elements, mainly phosphorus,which causes an excessive increase in their trophic (biological productivity). Materials and elements ofa 1 megawatt photovoltaic power plant can be distinguished primarily by nitrogen oxide (596 Pt) andsulfur dioxide (182 Pt). The total negative impact of the production stage is 975 Pt. Recycling processeswould minimize harmful emissions by a total of 502 Pt, including 314 Pt for nitrogen oxide and 187 forsulfur oxide (Table 11).
The highest level of negative impact of land use category was characterized by the productionstage (total of 1551 Pt), including primarily the processes related to the transformation to mineralextraction site (338 Pt). A significantly lower level of adverse impact is the potential for landfill

Energies 2020, 13, 1385 15 of 25
disposal—a total of 35 Pt. Extraction of mineral resources is an area of economic activity with one ofthe highest harmful impacts on human health and the quality of the environment. It is associated withenvironmental destruction, especially serious in the case of open pit mines. It is characterized by theconsumption of huge amounts of water, often causing shortages, and at the same time results in thecontamination of surface and groundwater, as well as a reduction in their level by up to several meters(Table 12).
Table 11. Results of grouping and weighting of environmental after-effects for acidifying/ eutrophicationcompounds, occurring in the life cycle of 1 megawatt photovoltaic power plant [unit: Pt].
Acidification/Eutrophication Production Exploitation Landfill Recycling
Nitrogen oxide 596.32 0.45 7.19 -313.95Sulfur dioxide 182.40 0.20 0.42 0.00
Ammonia 107.97 0.00 0.22 -0.65Sulfur oxides 82.99 0.11 0.00 -186.97
Nitrogen dioxide 5.34 0.00 0.00 0.00
Total 975.03 0.77 7.83 -501.57
Table 12. Results of grouping and weighting of after-effects of environmental land use processes,occurring in the 1 megawatt photovoltaic power plant [unit: Pt].
Land Use Production Exploitation Landfill Recycling
Transformation, to mineral extraction site 338.36 0.04 13.77 0.00Occupation, dump site 275.99 0.07 13.15 0.00
Transformation, to arable, non-irrigated 221.31 0.02 0.45 0.00Transformation, to unknown 142.92 -0.09 0.01 0.00
Transformation, to urban, continuously built 118.14 0.00 0.00 0.00Occupation, mineral extraction site 111.45 0.02 4.14 0.00
Transformation, to dump site 63.54 0.02 0.03 0.00Transformation, to industrial area 59.30 0.03 0.02 0.00
Transformation, to water bodies, artificial 47.46 0.01 3.16 0.00Land use II-III 47.27 0.09 0.00 0.00
Occupation, forest, intensive, normal 41.16 0.10 0.10 0.00
Total 1550.96 0.37 64.41 0.00
Economic development entails an increase in demand for various types of natural resources,resulting in the depletion of non-renewable resources. Although their deposits are limited,their exploitation continues to grow. The stage of production of 1 megawatt photovoltaic power plant,characterized by the highest value of harmful influence in the mineral mining sector, is the productionphase (total 9453 Pt), mainly in the field of tin mining (6610 Pt) and copper (2230 Pt). Due to its physicaland chemical properties, tin is very important for industry. Its use in the metallurgical industry isthe largest. In addition, this element is used for solders alloys. Tin is also used to coat other metals,e.g., steel, with a thin anti-corrosive layer. Recycling would minimize the pervasive effects analyzed,a total of 1889 Pt, mainly in the field of bauxite mining (-1835 Pt) (Table 13).
The highest level of harmful impacts in the category of fossil fuel extraction processes ischaracterized by a production phase (total of 12,159 Pt), which consists primarily of processesrelated to extraction of natural gas (5509 Pt) and crude oil (2366 Pt). This is connected to the highenergy demand of production processes, in particular PV cells. Recycling as a form of post-disposalmanagement would reduce several adverse effects by a total of 10,095 Pt, mainly in the oil-relatedprocesses (-7794 Pt). However, landfill disposal would result in an increase in the unfavorable impacton the life cycle of the tested power plant by 137 Pt (Table 14).

Energies 2020, 13, 1385 16 of 25
Table 13. Results of grouping and weighting of after-effects of environmental processes related tomineral extraction, occurring in the 1 megawatt photovoltaic power plant [unit: Pt].
Minerals Production Exploitation Landfill Recycling
Tin, in ground 6609.87 0.00 0.00 0.00Copper, in ground 2230.23 8.73 0.00 0.00Bauxite, in ground 367.14 0.00 0.00 -1834.86Nickel, in ground 70.80 0.00 0.00 0.00
Nickel, 1.13% in sulfide, Ni0.76% and Cu 0.76% incrude ore, in ground
68.90 0.00 0.00 0.00
Iron, in ground 50.70 0.00 0.00 -53.67Nickel, 1.98% in silicates,
1.04% in crude ore, inground
18.46 0.00 1.13 0.00
Total 9452.86 8.73 1.15 -1888.53
Table 14. Results of grouping and weighting of after-effects of environmental processes related to theextraction of fossil fuels, occurring in the 1 megawatt photovoltaic power plant [unit: Pt].
Fossil Fuels Production Exploitation Landfill Recycling
Gas, natural, in ground 5508.88 0.64 21.28 0.00Oil, crude, in ground 2365.64 0.62 114.85 0.00
Oil, crude, 42.6 MJ per kg, in ground 2166.59 0.96 0.00 -7794.46Gas, natural, 36.6 MJ per m3, in ground 822.65 0.00 0.00 -1476.15
Oil, crude, 42.7 MJ per kg, in ground 660.69 0.09 0.00 0.00Coal, 18 MJ per kg, in ground 204.68 0.03 0.00 -346.74
Gas, natural, 30.3 MJ per kg, in ground 170.19 0.07 0.00 0.00Gas, natural, 35 MJ per m3, in ground 140.89 0.72 0.00 -244.92
Oil, crude, 41 MJ per kg, in ground 65.70 0.00 0.00 -232.32
Total 12158.95 3.88 136.56 -10094.60
3.2. IPCC
The analyzed groups of photovoltaic power plant components were also subjected to an IPCCanalysis to determine greenhouse gas emissions in kilograms CO2 equivalents. The results are shownin Figure 6. It follows from that that the largest amount of greenhouse gases is generated in the lifecycle of photovoltaic panels that end in landfill storage (269,099 kg CO2 eq). However, if they arerecycled, there is the possibility of significantly reducing the volume of the emissions in question. Thelowest greenhouse gas emissions were recorded for post-consumption in recycling cycles (supportstructures: 3880 Pt, inverter 10,017 Pt, electrical installation: 16,091 Pt). The sources of CO2 emissionsthroughout the life cycle include, above all, the burning of fossil fuels to obtain electricity. Its highestdemand was observed during the production of photovoltaic cells.

Energies 2020, 13, 1385 17 of 25
Figure 6. Results of the characterization of environmental consequences for cumulative greenhousegas (GHG) emissions occurring in the cycle of existence of selected groups of 1 megawatt photovoltaicpower plant [unit: kg CO2 eq].
3.3. CED
The last factor considered was the energy consumption of the life cycle of individual groups ofphotovoltaic power plants, which was estimated using the CED method. Sustainable developmentof technical facilities, in addition to having the lowest demand for materials and the least harmfulenvironmental impact of the life cycle, also includes the maximum reduction of energy consumptionwithin its individual stages (which also translates into improving the quality of the environment,especially considering the fact that the main source of energy are conventional fuels). The largestamount of energy is needed to produce photovoltaic panels (e.g., to produce silicon with proper purity),a life cycle that covers the production, operation and management of panels in the form of landfill,consumes nearly 5 million MJ. Similarly, the case of an inverter station represents over 800 thousandMJ, and for supporting structures, a further more than 1 million MJ, and with regard to the electricalinstallation, almost 250 thousand MJ. The use of recycling processes reduces the energy consumptionof all groups of components of the power plant in question. Reuse of photovoltaic cells recovered inrecycling processes would minimize energy and material consumption (Figure 7).
Figure 7. Results of the characterization of environmental consequences, in relation to cumulativeenergy demand (in MWh), occurring in the cycle of existence of selected groups of 1 megawattphotovoltaic power plant [unit: MJ].

Energies 2020, 13, 1385 18 of 25
3.4. Recapitulation
Figure 8 shows the results of grouping and weighting the environmental consequences of 1000 kgof selected plastics and materials that are part of the photovoltaic farm components. The highest levelof harmful influence on the environment is distinguished by silver (20,512 Pt/1 Mg), nickel (3842 Pt/1Mg), copper (2363 Pt/1 Mg), PA 6 (656 Pt/1 Mg), lead (638 Pt/1 Mg) and cadmium (586 Pt/1 Mg). Themost widely used in photovoltaic panels are: silver, nickel, lead, cadmium, EVA, selenium, silicon, andaluminum; in supporting structures: nickel and steel; in inverter stations: copper, PA6, PVDF, rubber,and steel; and in electrical installations: copper, PA6, PVDF, and rubber.
Figure 8. Results of grouping and weighting the environmental consequences of 1,000 kg of selectedplastics and materials included in photovoltaic elements for all categories of influence [unit: Pt].
3.5. Other Energy Sources
Using the databases available in the SimaPro software and calculations made previously for a1 MW photovoltaic power plant, a comparison was made of the environmental impact of the processesof obtaining electricity from photovoltaics with selected, commonly used conventional energy sourcesand with the structure of the mixed energy characteristic of Poland, mainly based on hard and browncoal (approximately 80%).
The analyzed photovoltaic power station, during its 20-year life cycle, is able to produce about20,000 MWh of electricity, which value was taken as a reference value. The degree of impact on thesurroundings resulting from the combustion of an amount of hard coal, brown coal, and heating oilnecessary to obtain the same amount of electricity was analyzed. In addition, an analogous analysiswas carried out when 20,000 MWh of energy was obtained in Poland.
Table 15 summarizes the results of the characterization of the environmental after-effects arisingfrom the generation of 20,000 MWh of electricity from the selected energy sources. The highest level ofharmful impact of the analyzed energy sources is visible in the area of emissions of compounds havinga negative impact on the quality of the environment (category: ecotoxic compounds, compoundscausing acidification/eutrophication, land use) and in processes related to the depletion of raw materialresources (categories: mineral extraction, extraction of fossil fuels). This is characteristic of energyextraction processes, especially from conventional sources.

Energies 2020, 13, 1385 19 of 25
Table 15. Results of the characterization of environmental consequences arising as a result of thegeneration of 20,000 MWh of electricity from selected energy sources.
ImpactCategory
PV PowerPlant
(Recycling)
PV PowerPlant
(Landfill)
HardCoal
BrownCoal
NaturalGas
HeatingOil
PolishEnergy Mix Unit
Carcinogens 0 0 5 4 0 0 4 DALYResp. organics 0 0 0 0 0 0 0 DALY
Resp.inorganics 0 0 13 14 11 5 12 DALY
Climatechange 0 0 5 5 6 1 5 DALY
Radiation 0 0 0 0 0 0 0 DALYOzone layer 0 0 0 0 0 0 0 DALYEcotoxicity 58,446 303,071 717,677 2671,933 218,750 0 1463,288 PAF·m2/a
Acidification/Eutrophication 6092 12,623 335,746 284,690 174,296 163,673 300,669 PDF·m2/a
Land use 8751 8984 192,997 32,729 90,967 0 128,362 PDF·m2/aMinerals 319,481 398,914 33,221 18,763 19,079 0 28,350 MJ
Fossil fuels 92,339 520,697 3634,140 307,570 2097,723 10360,976 3844,863 MJ
The results of grouping and weighting environmental consequences arising as a result of generating20,000 MWh of electricity from selected energy sources are presented in Table 16. The highest valueof harmful impact on the environment was noted in the following categories: inorganic compoundscausing respiratory diseases (from 3437 to 357,703 Pt), compounds that cause climate change (from2351 to 163,556 Pt), and the extraction of fossil fuels (from 2198 to 246,591 Pt).
Table 16. Results of grouping and weighting of environmental consequences arising as a result ofgenerating 20,000 MWh of electricity from selected energy sources [unit: Pt].
Impact CategoryPV Power
Plant(Recycling)
PV PowerPlant
(Landfill)
HardCoal
BrownCoal
NaturalGas
HeatingOil
PolishEnergy Mix
Carcinogens −249 3230 123768 102,354 8331 0 104,557Resp. organics −6 12 62 24 1265 406 69
Resp. inorganics 3437 10,932 327,703 356,043 286,288 130,653 321,832Climate change −627 2351 123,308 121,536 163,556 35,811 119,398
Radiation 28 29 210 121 142 0 297Ozone layer −2 2 2 1 13 0 5Ecotoxicity 456 2364 5598 20,841 1706 0 11,414
Acidification/eutrophication 475 985 26,188 22,206 13,595 12,766 23,452
Land use 683 701 15,054 2553 7095 0 10,012Minerals 7604 9494 791 447 454 0 675
Fossil fuels 2198 12,393 86,493 7320 49,926 246,591 91,508
Total 13,997 42,492 709,177 633,445 532,371 426,228 683,220
The highest total level of harmful impact on the environment was from the production of20,000 MWh of electricity was determined to be from hard coal (709,17 Pt) and brown coal (633,445 Pt).A high degree of negative impact on the environment was also noted for the Polish energy mix(683,220 Pt), due to the fact that it is mainly based on the burning of brown and hard coal. Obtainingenergy from solar radiation possessed the lowest level of adverse impact on the environment, with thistype of installation exerting an impact from 13,997 (recycling) to 42,492 Pt (storage) throughout itsentire life cycle, depending on the form of post-use management. Despite some expenditure of energyand materials in the production and post-use management phase, the use of a renewable energy source,i.e., photovoltaics, causes the least negative environmental consequences compared to conventionalenergy sources (Figure 9).

Energies 2020, 13, 1385 20 of 25
Figure 9. Results of grouping and weighting environmental consequences arising as a result ofgenerating 20,000 MWh of electricity from selected energy sources [unit: Pt].
Additionally, the amount of greenhouse gas emissions resulting from the production of 20,000 MWhof electricity was analyzed from the same energy sources using the IPCC method. The highest level ofGHG emissions was found when obtaining energy from natural gas (29,989 Mg CO2 eq), hard coal(22,872 Mg CO2 eq), and brown coal (22,241 Mg CO2 eq). In the case of photovoltaic power plants,the emission level was the lowest and amounted to about 400 Mg CO2 eq. The obtained results confirmthat photovoltaic power plants can be a source of energy enabling the reduction of greenhouse gasemissions, and hence are one of the ways of reducing the greenhouse effect (Figure 10).
Figure 10. The results of the characterization of the environmental after-effects in relation to cumulatedgreenhouse gas (GHG) emissions arising from the production of 20,000 MWh of electricity from selectedenergy sources [unit: Pt].
As a result of these considerations it was found that the total highest level of harmful impact on theenvironment is the life cycle of post-consumer photovoltaic panels when stored in landfill (22,029 Pt).The largest amount of greenhouse gases generated during the post-consumer life cycle of photovoltaicpanels is from storage in landfill (269,099 kg CO2 eq). The greatest amount of energy absorbed duringthe life cycle of photovoltaic panels is from the use of this form of storage—nearly 5 million MJ. Theuse of recycling processes reduces the energy consumption of all groups of components of the power

Energies 2020, 13, 1385 21 of 25
plant in question. Silver, nickel, copper, PA 6, lead, and cadmium are among the materials with themost harmful influence on the environment.
An additional element of the analysis was the comparison of the environmental impact of theprocesses of obtaining electricity from photovoltaics with selected, most commonly used conventionalenergy sources and with the structure of the mixed energy characteristic of Poland, which is mainlybased on hard and brown coal (approximately 80%). The highest level of harmful impact of theanalyzed energy sources is visible in the area of compound emissions: ecotoxic (2,671,933 PAF·m2/abrown coal), compounds causing acidification/eutrophication (335,746 PAF·m2/a hard coal), land use(192,997 PAF·m2/a hard coal) and within processes related to the depletion of raw material resourcesincludes: mineral extraction (398,914 MJ PV power plant (landfill)), and extraction of fossil fuels(10,360,976 MJ heating oil).
4. Conclusions
Renewable energy sources, including solar energy, possess many positive environmental aspectsin terms of local, regional and national and, most importantly, global aspects. The beneficial effectof the use of alternative energy sources can be considered in three areas: continuous sustainabledevelopment, the environment protection and natural resources, and the timeless and endless natureof the raw materials used [45,46].
Energy security is understood as providing the security of energy supplied to recipients in aparticular time and place, and it is one of the priority actions in economic policy. Scattered generationensures even distribution of heat sources and energy (derived from a wide variety of energy sources,including renewable sources of energy) and have been the subject of considerable interest. Theyare considered to be important not only for increasing energy security, but also for the reduction ofgreenhouse gas emissions, particularly carbon dioxide, from burning fossil fuels. Each energy typeimpacts the quality of the environment, but not all to an identical extent [47–49]. That is why processesrelated to solar cell production have become so important in environmental assessment, determinedby assessing the surface properties, including roughness, thickness and machining [50,51].
In the opinion of society, the use of only conventional energy sources (for example coal or oil), is athreat to human health and the quality of the environment. However, the depletion of non-renewableresources concerns not only traditional ways of obtaining energy, but also alternative ones. As aconsequence, we are constantly striving to minimize negative environmental impacts, e.g., by reducingCO2 emissions [52]. Bearing in mind the future prospects of sustainable development, directions forthe environmental assessment of wind farms, small hydropower plants and solar farms have becomeattractive. This approach makes it possible to strive to meet the growing demand for electricity withoutburning fossil fuels [53,54]. Thus, this work proved that at the production stage of the elements fora photovoltaic power plant, there is also a demand for raw materials and energy. The same appliesto processes related to post-use management. Assuming that the analyzed power station producesannual energy equal to about 1000 MWh, it must work for up to about 2 years to produce an amount ofenergy equal to the demand for it throughout its entire life cycle (total energy demand for the life cyclewith post-use management in the form of storage on the dump is about 2024 MWh—Figure 7). For thisreason, it was considered justified to conduct research aimed at ecological and energetical assessmentof the life cycle of materials and components of a photovoltaic power plant, and the hypothesis adoptedin the work was confirmed.
Based on the results of the research performed and an evaluation of the material stages of the lifecycle of the analyzed PV power plant, in terms of pro-environmental, post-production use of materials,materials and elements of photovoltaic power plants, the following suggestions are proposed:
- ameliorating the detrimental effect on the environment of production process (mainly PV panels),which is the most deleterious phase of all phases in environmental life cycle, by introducing thelatest technologies, which are less energy absorbent, with lesser usage of materials and loweremissions of harmful particles and substances,

Energies 2020, 13, 1385 22 of 25
- creating the most pro-environmental algorithm for dealing with plastic materials and elementsof photovoltaic power plants after their completion, taking into account, in particular, recyclingprocesses, reducing the energy consumption, material consumption and emissions of harmfulsubstances throughout the life cycle of the power plant,
- employing more environmentally friendly construction materials while at the same timemaintaining proper technical, mechanical and qualitative characteristics for specific roles inphotovoltaic power plants, in particular limiting the use of materials with the highest levels ofnegative environmental impact such as silver, nickel, copper, PA 6, lead and cadmium,
- employing construction strategies that allow for easier separation of individual materials, makingthem easy to identify during post-consumer use,
- development of comprehensive, pro-environmental standards with respect to post-consumptionmanagement of materials and elements of photovoltaic power plants,
- popularizing the idea of research and assessment of the impact of renewable energy throughouttheir life cycle.
Author Contributions: Conceptualization, I.P. and P.B.-W.; methodology, I.P. and P.B.-W.; software, I.P.; validation,I.P., P.B.-W. and K.P.; formal analysis, I.P, P.B.-W, K.P. and A.T..; investigation, I.P. and P.B.-W.; resources, I.P.; datacuration, I.P.; writing—original draft preparation, I.P.; writing—review and editing, I.P, P.B.-W, K.P. and A.T.;visualization, I.P.; supervision, I.P, P.B.-W, K.P. and A.T.; project administration, P.B.-W. All authors have read andagreed to the published version of the manuscript.
Funding: This research received no external funding.
Conflicts of Interest: The authors declare no conflict of interest.
References
1. Corcelli, F.; Ripa, M.; Ulgiati, S. End-of-life treatment of crystalline silicon photovoltaic panels.An emergy-based case study. J. Clean. Prod. 2017, 9, 1129–1142. [CrossRef]
2. Goe, M.; Gaustad, G. Strengthening the case for recycling photovoltaics: An energy payback analysis.Appl. Energy 2014, 5, 41–48. [CrossRef]
3. McLellan, B. Sustainable Future for Human Security. In Environment and Resources; Springer: Singapore,2018; pp. 37–68. [CrossRef]
4. Singh, R.; Kumar, S. Green Technologies and Environmental Sustainability; Springer: Cham, Switzerland, 2017;pp. 157–178. [CrossRef]
5. Andersen, O. Unintended Consequences of Renewable Energy; Springer: London, UK, 2013; pp. 81–89. [CrossRef]6. Coulson, N.E.; Wang, Y.; Lipscomb, C.A. Energy Efficiency and the Future of Real Estate; Palgrave Macmillan:
New York, NY, USA, 2017; pp. 83–89. [CrossRef]7. Gronowicz, J. Ochrona Srodowiska w Transporcie Ladowym; Biblioteka problemów eksploatacji, Instytut
Technologii Eksploatacji–PIB: Radom, Poland, 2004; pp. 11–32. ISBN 83-7204-374-4.8. Granata, G.; Pagnanelli, F.; Moscardini, E.; Havlik, T.; Toro, L. Recycling of photovoltaic panels by physical
operations. Sol. Energy Mater. Sol. Cells 2014, 6, 239–248. [CrossRef]9. Kruszelnicka, W.; Bałdowska-Witos, P.; Kasner, R.; Flizikowski, J.; Tomporowski, A.; Rudnicki, J. Evaluation
of emissivity and environmental safety of biomass grinders drive. Przem. Chem. 2019, 10, 1494–1498.[CrossRef]
10. Tao, J.; Yu, S. Review on feasible recycling pathways and technologies of solar photovoltaic modules.Sol. Energy Mater. Sol. Cells 2015, 10, 108–124. [CrossRef]
11. Demirel, Y. Energy: Production, Conversion, Storage, Conservation and Coupling; Springer: Cham, Switzerland,2016; pp. 441–484. [CrossRef]
12. Merkisz, J.; Rymaniak, Ł. The assessment of vehicle exhaust emissions referred to CO2 based on theinvestigations of city buses under actual conditions of operation. Eksploat. Niezawodn. 2017, 19, 522–529.[CrossRef]
13. Wang, Z.; Wu, J.; Liu, C.; Gu, G. Integrated Assessment Models of Climate Change Economics; Springer: Singapore,2017; pp. 1–19. [CrossRef]

Energies 2020, 13, 1385 23 of 25
14. Dahlquist, E.; Hellstrand, S. Natural Resources Available Today and in the Future: How to Perform ChangeManagement for Achieving a Sustainable World; Springer: Cham, Switzerland, 2017; pp. 245–268. [CrossRef]
15. Heshmati, A.; Abolhosseini, S.; Altmann, J. The Development of Renewable Energy Sources and Its Significance forthe Environment; Springer: Singapore, 2015; pp. 7–29. [CrossRef]
16. Bauer, G.H. Photovoltaic Solar Energy Conversion; Springer: Berlin, Germany, 2015; pp. 5–37. [CrossRef]17. Dincer, I.; Midilli, A.; Kucuk, H. Progress in Sustainable Energy Technologies: Generating Renewable Energy;
Springer: Cham, Switzerland, 2014; pp. 339–353. [CrossRef]18. Márquez, F.P.G.; Karyotakis, A.; Papaelias, M. Renewable Energies; Springer: Berlin, Germany, 2018; pp. 1–15.
[CrossRef]19. Rigatos, G.G. Intelligent Renewable Energy Systems: Modelling and Control; Springer: Cham, Switzerland, 2016;
pp. 339–409. [CrossRef]20. Hossain, J.; Mahmud, A. Renewable Energy Integration: Challenges and Solutions; Springer: Singapore, 2014;
pp. 69–95. [CrossRef]21. Toke, D. Ecological Modernization and Renewable Energy; Palgrave Macmillan: New York, NY, USA, 2011;
pp. 167–179. [CrossRef]22. Traverso, M.; Asdrubali, F.; Francia, A.; Finkbeiner, M. Towards life cycle sustainability assessment:
An implementation to photovoltaic modules. Int. J. Life Cycle Assess 2012, 17, 1068–1079. [CrossRef]23. Bałdowska-Witos, P.; Kruszelnicka, W.; Kasner, R.; Rudnicki, J.; Tomporowski, A.; Flizikowski, J. Impact of
the plastic bottle production on the natural environment. Part 1. Application of the ReCiPe 2016 assessmentmethod to identify environmental problems. Przem. Chem. 2019, 10, 1662–1667. [CrossRef]
24. Kulczycka, J.; Lelek, Ł.; Lewandowska, A.; Zarebska, J. Life Cycle Assessment of municipal solid wastemanagement—Comparison of results using different LCA models. Pol. J. Environ. Stud. 2015, 1, 125–140.[CrossRef]
25. Lelek, Ł.; Kulczycka, J.; Lewandowska, A.; Zarebska, J. Life cycle assessment of energy generation in Poland.Int. J. Life Cycle Assess 2016, 21, 1–14. [CrossRef]
26. Guineé, J. Handbook on Life Cycle Assessment: Operational Guide to the ISO Standards; Springer: Dordrecht,The Netherlands, 2002; pp. 31–108. [CrossRef]
27. Treloar, G.J.; Love, P.E.D.; Faniran, O.O.; Iyer-Raniga, U. A hybrid life cycle assessment method forconstruction. Constr. Manag. Econ. 2000, 18, 5–9. [CrossRef]
28. Ulgiati, S.; Raugei, M.; Bargigli, S. Overcoming the in adequacy of single-criterion approaches to Life CycleAssessment. Ecol. Modell. 2006, 3, 432–442. [CrossRef]
29. Guinée, J.; Heijungs, R.; Huppes, G.; Zamagni, A.; Masoni, P.; Buonamici, R.; Rydberg, T. Life CycleAssessment: Past, present, and future. Environ. Sci. Technol. 2011, 1, 90–96. [CrossRef] [PubMed]
30. Tomporowski, A.; Flizikowski, J.; Wełnowski, J.; Najzarek, Z.; Topolinski, T.; Kruszelnicka, W.; Piasecka, I.;Smigiel, S. Regeneration of rubber waste using an intelligent grinding system. Przem. Chem. 2018, 10,1659–1665. [CrossRef]
31. Klinglmair, M.; Sala, S.; Brandão, M. Assessing resource depletion in LCA: A review of methods andmethodological issues. Int. J. Life Cycle Assess 2014, 19, 580–592. [CrossRef]
32. Kłos, Z. Ecobalancial assessment of chosen packaging processes in food industry. Int. J. Life Cycle Assess 2002,7, 309. [CrossRef]
33. Rebitzer, G.; Loerincik, Y.; Jolliet, O. Input-output life cycle assessment: From theory to applications. Int. J.Life Cycle Assess 2002, 7, 174–176. [CrossRef]
34. Dreyer, L.C.; Niemann, A.L.; Hauschild, M.Z. Comparison of Three Different LCIA Methods: EDIP97,CML2001 and Eco-indicator 99. Int. J. Life Cycle Assess 2003, 8, 191–200. [CrossRef]
35. Piasecka, I.; Tomporowski, A.; Flizikowski, J.; Kruszelnicka, W.; Kasner, R.; Mrozinski, A. Life Cycle Analysisof Ecological Impacts of an Offshore and a Land-Based Wind Power Plant. Appl. Sci. 2019, 9, 231. [CrossRef]
36. Piotrowska, K.; Kruszelnicka, W.; Bałdowska-Witos, P.; Kasner, R.; Rudnicki, J.; Tomporowski, A.;Flizikowski, J.; Opielak, M. Assessment of the Environmental Impact of a Car Tire throughout Its Life CycleUsing the LCA Method. Materials 2019, 12, 4177. [CrossRef]
37. Tomporowski, A.; Flizikowski, J.; Kruszelnicka, W.; Piasecka, I.; Kasner, R.; Mrozinski, A.; Kovalyshyn, S.Destructiveness of profits and outlays associated with operation of offshore wind electric power plant. Part1: Identification of a model and its components. Pol. Marit. Res. 2018, 2, 132–139. [CrossRef]

Energies 2020, 13, 1385 24 of 25
38. Kendall, A. Time-adjusted global warming potentials for LCA and carbon footprints. Int. J. Life Cycle Assess2012, 17, 1042–1049. [CrossRef]
39. Muñoz, I.; Schmidt, J.H. Methane oxidation, biogenic carbon, and the IPCC’s emission metrics. Proposal fora consistent greenhouse-gas accounting. Int. J. Life Cycle Assess 2016, 21, 1069–1075. [CrossRef]
40. Peter, C.; Fiore, A.; Hagemann, U.; Nendel, C.; Xiloyannis, C. Improving the accounting of field emissions inthe carbon footprint of agricultural products: A comparison of default IPCC methods with readily availablemedium-effort modeling approaches. Int. J. Life Cycle Assess 2016, 21, 791–805. [CrossRef]
41. Stichnothe, H.; Schuchardt, F.; Rahutomo, S. European renewable energy directive: Critical analysis ofimportant default values and methods for calculating greenhouse gas (GHG) emissions. Int. J. Life CycleAssess 2014, 19, 1294–1304. [CrossRef]
42. Frischknecht, R.; Wyss, F.; Büsser-Knöpfel, S.; Lützkendorf, T.; Balouktsi, M. Cumulative energy demand inLCA: The energy harvested approach. Int. J. Life Cycle Assess 2015, 20, 957–969. [CrossRef]
43. Puig, R.; Fullana-Palmer, P.; Baquero, G.; Riba, J.R.; Bala, A. A Cumulative Energy Demand indicator (CED),life cycle based, for industrial waste management decision making. Waste Manag. 2013, 12, 2789–2797.[CrossRef]
44. Scipioni, A.; Niero, M.; Mazzi, A.; Manzardo, A.; Piubello, S. Significance of the use of non-renewable fossilCED as proxy indicator for screening LCA in the beverage packaging sector. Int. J. Life Cycle Assess 2013, 18,673–682. [CrossRef]
45. Tiwari, G.N.; Mishra, R.K. Advanced Renewable Energy Sources; Royal Society of Chemistry: Cambridge, UK,2012; pp. 46–71. ISBN 978-1-84973-380-9.
46. Zacher, L.W. ; Technology, Society and Sustainability: Selected Concepts, Issues and Cases; Springer: Basel,Switzerland, 2017; pp. 203–221. [CrossRef]
47. Solmes, L.A. Energy Efficiency: Real Time Energy Infrastructure Investment and Risk Management; Springer:Dordrecht, The Netherlands, 2009; pp. 1–34. [CrossRef]
48. Twidell, J.; Weir, T. Renewable Energy Resources; Routledge: London, UK, 2015; pp. 151–202. [CrossRef]49. Yang, M.; Yu, X. Energy Efficiency: Benefits for Environment and Society; Springer: London, UK, 2015; pp. 11–42.
[CrossRef]50. Kumar, A.; Melkote, S.N. Diamond Wire Sawing of Solar Silicon Wafers: A Sustainable Manufacturing
Alternative to Loose Abrasive Slurry Sawing. Procedia Manuf. 2018, 21, 549–566. [CrossRef]51. Kumar, A.; Melkote, S.N.; Kaminski, S.; Arcona, C. Effect of grit shape and crystal structure on damage in
diamond wire scribing of silicon. J. Am. Ceram. Soc. 100 2017, 4, 1350–1359. [CrossRef]52. Bai, A.; Popp, J.; Peto, K.; Szoke, I.; Harangi-Rákos, M.; Gabnai, Z. The Significance of Forests and Algae in
CO2 Balance: A Hungarian Case Study. Sustainability 2017, 9, 857. [CrossRef]53. Tremeac, B.; Meunier, F. Life cycle analysis of 4.5 MW and 250 W wind turbines. Renew. Sustain. Energy Rev.
2009, 13, 2104–2110. [CrossRef]54. Verán-Leigh, D.; Vázquez-Rowe, I. Life cycle assessment of run-of-river hydropower plants in the Peruvian
Andes: A policy support perspective. Int. J. Life Cycle Assess 2019, 24, 1376–1395. [CrossRef]
© 2020 by the authors. Licensee MDPI, Basel, Switzerland. This article is an open accessarticle distributed under the terms and conditions of the Creative Commons Attribution(CC BY) license (http://creativecommons.org/licenses/by/4.0/).