Embed Size (px)
Citation preview
Eco-Efficient Technologies forImproved Removal of Particulates
from SurfacesResults of the European Union project
REPART
Ulrika Bark Uwe Fortkamp B1590
July 2004
RAPPORTSAMMANFATTNINGReport Summary
Organisation/Organization
IVL Svenska Miljöinstitutet ABIVL Swedish Environmental Research Institute Ltd.
Projekttitel/Project title
RepartAdress/address
Box 21060100 31 Stockholm Anslagsgivare för projektet/
Project sponsorTelefonnr/Telephone
08 598 563 00 European Commission
Rapportförfattare/author
Ulrika Bark Uwe Fortkamp
Rapportens titel och undertitel/Title and subtitle of the report
Eco-Efficient Technologies for Improved Removal of Particulates from SurfacesResults of the European Union project REPARTSammanfattning/Summary
Industrial cleaning and rinsing procedures are often resource demanding and money consumingprocesses. Through closing up systems and minimising the water and chemicals used, economy aswell as quality and environmental aspects can be improved in many cases. This report is a summaryof studies made within the EU project REPART. In one part of the project different methods forseparation of particles are compared technically and economically. Also cleaning formulations aretested regarding their treatment possibilities on membrane filtration. Calcium has been identified asa trouble causing parameters in membrane filtration of rinse water and investigations have beenmade to show how to avoid the problems. A small study for determination of the desired rinse waterquality was made.There are often large profits to gain through closing up processes, but since almost each process iscomplex and unique, studies have to be made on-site before installing the new technique.Nyckelord samt ev. anknytning till geografiskt område eller näringsgren /Keywords
Separation, membrane filtration, Metal cleaning, rinsing, filter, hydrocyclone, particles,membran, metallrengöring, yta, partiklarBibliografiska uppgifter/Bibliographic data
IVL Rapport/report B1590Rapporten beställs via /The report can be ordered viaHemsida: www.ivl.se, e-mail: [email protected], fax: 08-598 563 90 eller IVL,Box 210 60, 100 31 Stockholm.
Repart, Improved Removal of Particulate from surfaces to increase IVL rapport B1590functionality and appearance of products, Work package 5: Eco-efficient processes
Table of content
1. Introduction ............................................................................................................... 1
2. Description of work...................................................................................................... 22.1 Separation of particles ........................................................................................ 22.2 Recovery of cleaners .......................................................................................... 32.3 Definition of rinsing requirements ..................................................................... 42.4 Recovery of the chemicals and water from the rinsing system.......................... 4
Appendix 1. Comparison of different methods for removing particles from acleaning process...................................................................................... 8
Appendix 2. Membrane filtration of degreasing bath - multivariateevaluation of experiments in laboratory scale ...................................... 20
Appendix 3. Evaluation of different parameters of cleaning formulations incorrelation with membrane filtration.................................................... 30
Appendix 4. Rinsing requirement - a small test in lab scale ..................................... 36Appendix 5. Membrane filtration of rinse water after degreasing -
How to attain a successful process ....................................................... 44
Repart, Improved Removal of Particulate from surfaces to increase IVL rapport B1590functionality and appearance of products, Work package 5: Eco-efficient processes
1
1. IntroductionWithin the frames of the European union project Repart (Improved REmoval ofPARTiculate from surfaces to increase functionality and appearance of products) aseries of studies on eco-efficient processes has been performed. The studies arecompiled here, but also presented in separate reports, found as appendixes to this report.
A main objective of the project was to increase eco-efficiency of particle removalprocesses by closing up cleaning and rinsing systems, saving water and chemicals and alsotesting the compatibility of process chemicals and separation technologies.
A large number of pilot-scale membrane filtration tests have been performed.
• Separation of particles – comparison of techniques
• Ultra filtration for recycling of cleaners. Are the cleaners well compatible with theseparation methods available? Some different parameters are studied.
• Rinsing requirements – the cleanliness of the rinse water contra quality of the goods.
• Nanofiltration for recovery of chemicals and reuse of water from the rinsingsystem.
The tests have lead to valuable knowledge about what parameters causing trouble whileinstalling recycle techniques on cleaning and rinsing systems.
Repart, Improved Removal of Particulate from surfaces to increase IVL rapport B1590functionality and appearance of products, Work package 5: Eco-efficient processes
2
Cleaningbath
Rinsingsystem
Particleseparation
Recycling ofchemicals
Improvedquality ofgoods andbath
Recycling ofwaterExtension of
length of bathlife
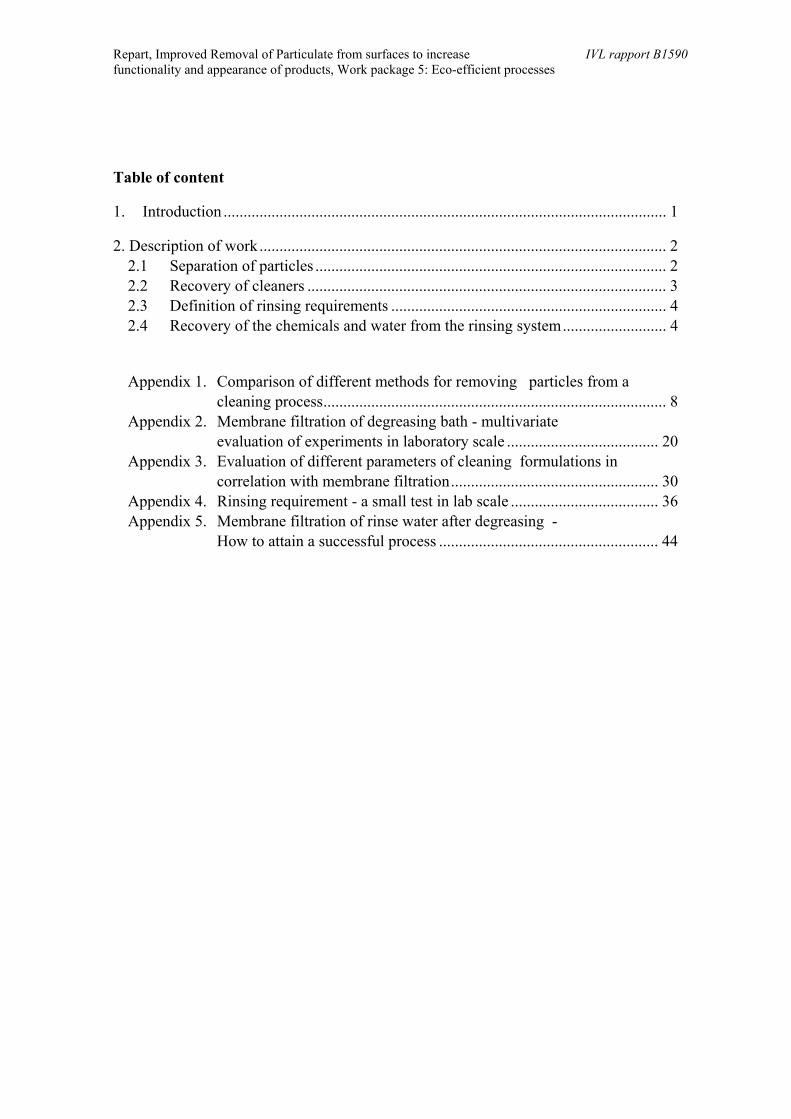
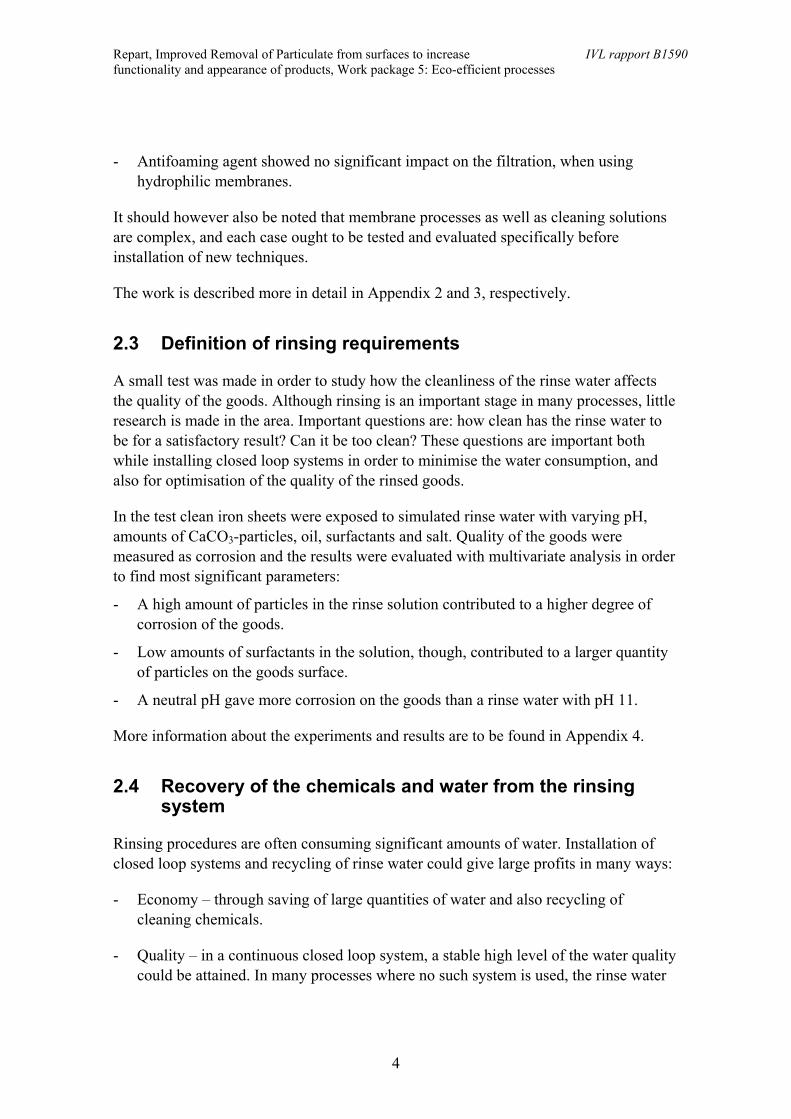
Figure 1. Illustration of the objectives for the project.
2. Work description and results
2.1 Separation of particles
Four different techniques for separation of particles from a cleaning process were tested.The techniques were evaluated in terms of efficiency, maintenance and economics. Thetechniques tested were:
- Microfiltration- Bag filter- Hydrocyclone- Centrifugation / separation
The tests were performed on site at a cleaning process, where the particles wererepresented by silica carbide (SiC), aluminium and iron.
Microfiltration showed the best separation ability in the test. A ceramic membranewith 0,2µm cut off was used. Membrane technique, though, demands some maintenanceand produces a liquid concentrate.
Repart, Improved Removal of Particulate from surfaces to increase IVL rapport B1590functionality and appearance of products, Work package 5: Eco-efficient processes
3
The bag filter tested had a pore size of 1µm. The method is very simple, but in this testthe separation of particles were almost none. Advantages for the techniques are, besidesthe simplicity, the price, the ease of exchanging filters and also that the particlesseparated are gathered in the bag so that the waste comes in a solid form. The techniqueis however restricted to processes with rather low concentration of particles, since thebags otherwise gets full and needs frequent exchanging.
The hydrocyclone separated particles larger than 250µm and was easy to maintain. Theparticles were separated in a sludge container, easy to remove and empty.
Centrifugation showed a fairly good separation in the test, but the equipment neededmanual cleaning and was rather expensive for this purpose. The technique is moresuitable if the three phases oil, water and particles have to be separated.
More information about the experiments and results are to be found in Appendix 1.
2.2 Recovery of cleaners
In order to minimise the chemicals and water used in cleaning processes, closed loopsystems are being introduced in many processes. Membrane filtration is a commonlyused technique for this purpose, providing the right membrane is chosen and thecleaning formulation is compatible with the membrane process. Problems couldhowever occur, fouling of the membranes causes lower flow rates, but also depletion ofcertain chemicals from the cleaning solution.
A series of tests on membrane filtration of cleaning solutions was made, where anumber of different parameters were studied with respect to the membrane filtrationcompatibility.
- A hydrophilic membrane surface is preferable for attaining a high capacity of themembrane, a good recovery of chemicals and a good separation of oil and dirt.
- Silicates in the solution showed no negative effects of the membrane filtration. Onthe contrary silicates seemed to contribute to higher flux and better recovery. Earlierstudies have, though, pointed out silicates as troublemakers in membrane filtrationprocesses.
- Low concentrations of surfactants in the cleaning agent showed a positive effect onflux and recovery rate.
- High pH correlated with good recovery and high flux through the membrane.
Repart, Improved Removal of Particulate from surfaces to increase IVL rapport B1590functionality and appearance of products, Work package 5: Eco-efficient processes
4
- Antifoaming agent showed no significant impact on the filtration, when usinghydrophilic membranes.
It should however also be noted that membrane processes as well as cleaning solutionsare complex, and each case ought to be tested and evaluated specifically beforeinstallation of new techniques.
The work is described more in detail in Appendix 2 and 3, respectively.
2.3 Definition of rinsing requirements
A small test was made in order to study how the cleanliness of the rinse water affectsthe quality of the goods. Although rinsing is an important stage in many processes, littleresearch is made in the area. Important questions are: how clean has the rinse water tobe for a satisfactory result? Can it be too clean? These questions are important bothwhile installing closed loop systems in order to minimise the water consumption, andalso for optimisation of the quality of the rinsed goods.
In the test clean iron sheets were exposed to simulated rinse water with varying pH,amounts of CaCO3-particles, oil, surfactants and salt. Quality of the goods weremeasured as corrosion and the results were evaluated with multivariate analysis in orderto find most significant parameters:
- A high amount of particles in the rinse solution contributed to a higher degree ofcorrosion of the goods.
- Low amounts of surfactants in the solution, though, contributed to a larger quantityof particles on the goods surface.
- A neutral pH gave more corrosion on the goods than a rinse water with pH 11.
More information about the experiments and results are to be found in Appendix 4.
2.4 Recovery of the chemicals and water from the rinsingsystem
Rinsing procedures are often consuming significant amounts of water. Installation ofclosed loop systems and recycling of rinse water could give large profits in many ways:
- Economy – through saving of large quantities of water and also recycling ofcleaning chemicals.
- Quality – in a continuous closed loop system, a stable high level of the water qualitycould be attained. In many processes where no such system is used, the rinse water
Repart, Improved Removal of Particulate from surfaces to increase IVL rapport B1590functionality and appearance of products, Work package 5: Eco-efficient processes
5
is dumped at a certain time, and replaced with new fresh water. By this method thequality of the water – and of the goods produced varies significantly.
- Environmentally – savings of resources - minimisation of water and chemicals usedin the process.
Recycling of rinse water is however a complex process and problems with fouling ofmembranes often occur. Through a series of experiments in lab scale and pilot scalesome trouble-causing parameters have been identified.
The membranes used in the tests were spiral wound nano-filtration membranes and thechemicals used were fatty alcohol polyetoxylate, sodium zylolsulphonat and potassiumtetraborate.
Parameters that were varied and studied through the test were:
- Ageing of the cleaning bath- Air exposure of the bath- Tap water contra using de-ionised water- Content of calcium- content of oil- pH- Addition of complexing agent
All experiments were performed at 40°C and at a pressure of 15 Bar. The membranefiltration is driven step-wise up to VRF 10 (volume reduction factor 10) i. e. one tenthof the solution is left in the concentrate.
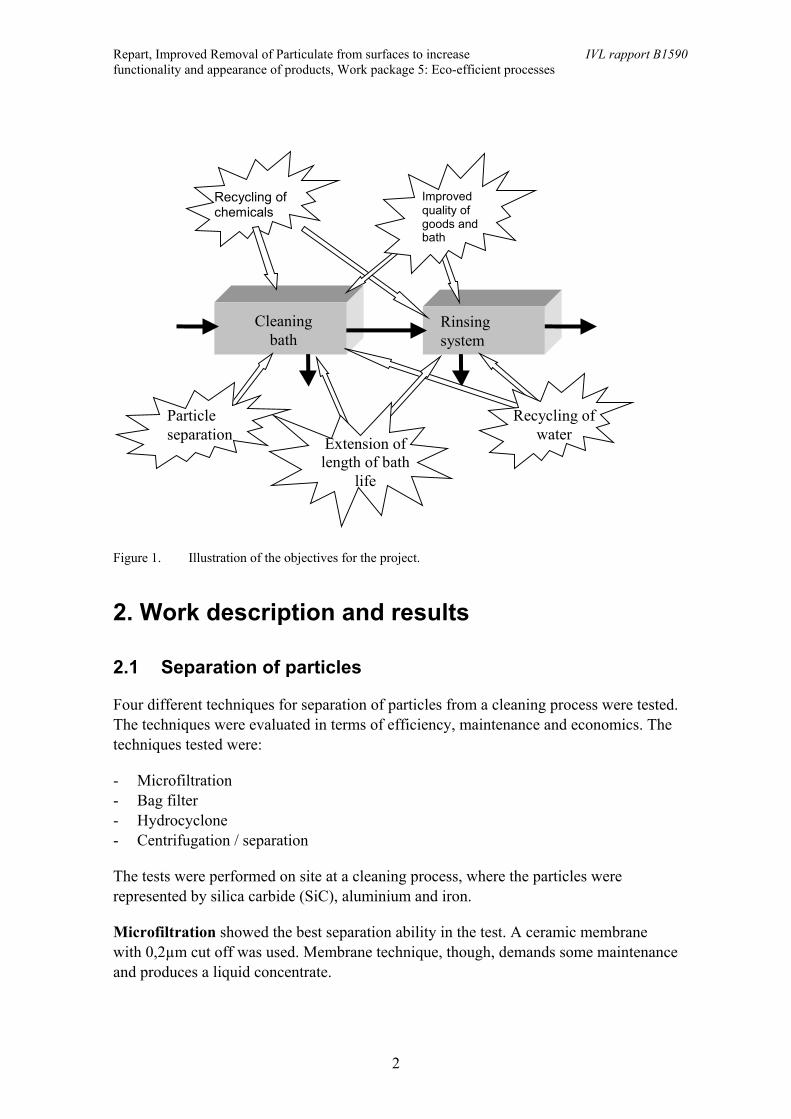
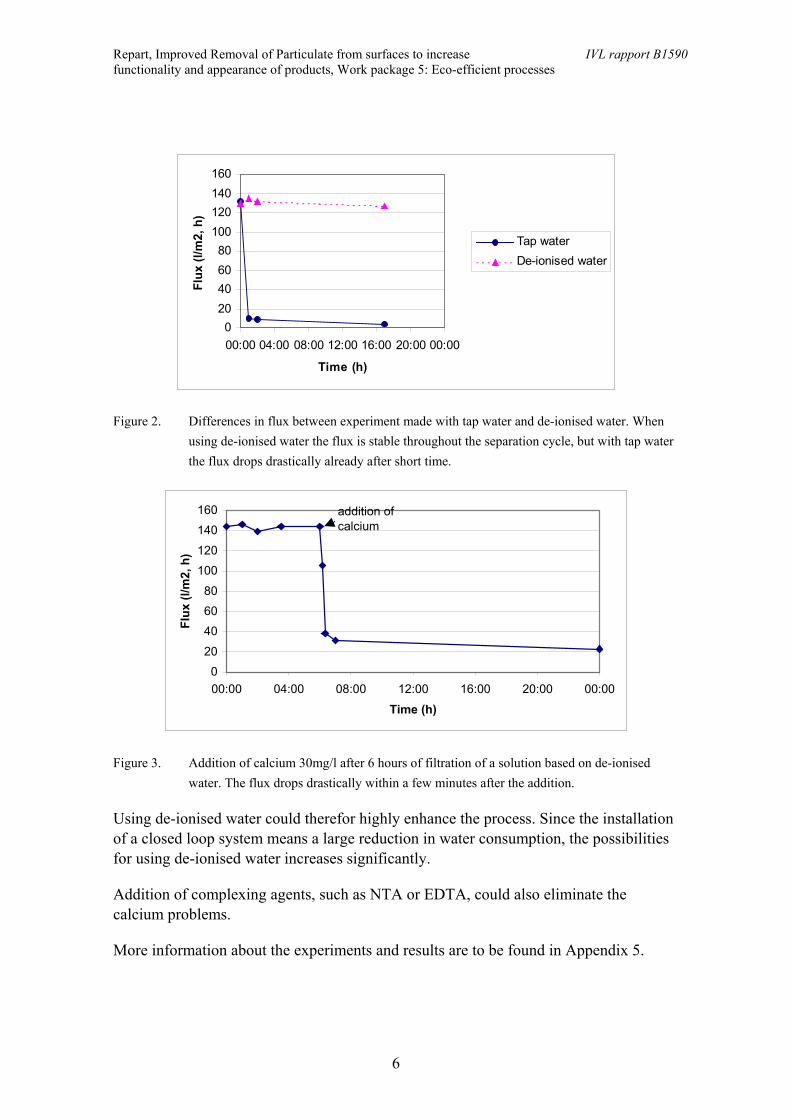
In this solution, calcium in the water showed out to have a devastating effect on themembrane filtration ability. Such low concentrations as 20mg/l drastically decreased theflux through the membrane.
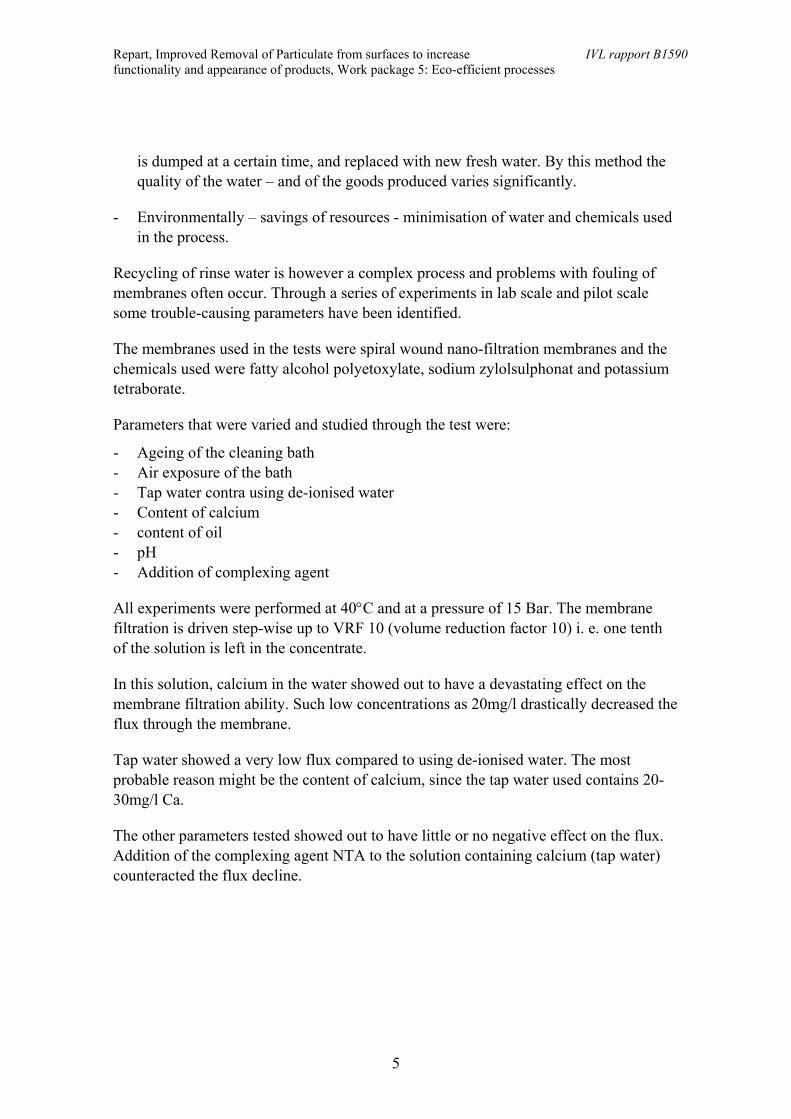
Tap water showed a very low flux compared to using de-ionised water. The mostprobable reason might be the content of calcium, since the tap water used contains 20-30mg/l Ca.
The other parameters tested showed out to have little or no negative effect on the flux.Addition of the complexing agent NTA to the solution containing calcium (tap water)counteracted the flux decline.
Repart, Improved Removal of Particulate from surfaces to increase IVL rapport B1590functionality and appearance of products, Work package 5: Eco-efficient processes
6
020406080
100120140160
00:00 04:00 08:00 12:00 16:00 20:00 00:00
Time (h)
Flux
(l/m
2, h
)
Tap waterDe-ionised water
Figure 2. Differences in flux between experiment made with tap water and de-ionised water. Whenusing de-ionised water the flux is stable throughout the separation cycle, but with tap waterthe flux drops drastically already after short time.
020
406080
100120
140160
00:00 04:00 08:00 12:00 16:00 20:00 00:00
Time (h)
Flux
(l/m
2, h
)
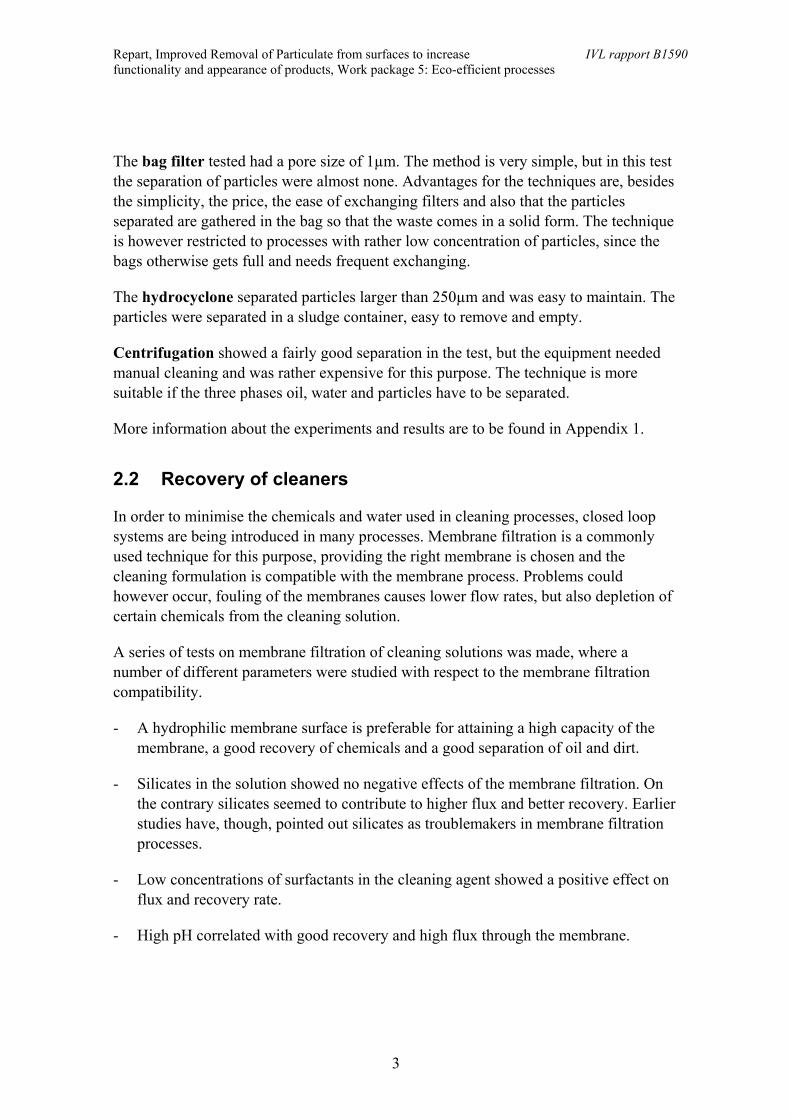
addition of calcium
Figure 3. Addition of calcium 30mg/l after 6 hours of filtration of a solution based on de-ionisedwater. The flux drops drastically within a few minutes after the addition.
Using de-ionised water could therefor highly enhance the process. Since the installationof a closed loop system means a large reduction in water consumption, the possibilitiesfor using de-ionised water increases significantly.
Addition of complexing agents, such as NTA or EDTA, could also eliminate thecalcium problems.
More information about the experiments and results are to be found in Appendix 5.
Repart, Improved Removal of Particulate from surfaces to increase IVL rapport B1590functionality and appearance of products, Work package 5: Eco-efficient processes
7
3. ConclusionsThe studies show large possibilities for savings of water and chemicals within cleaningas well as rinsing processes. It is however important that each process is studiedseparately, since no system is exactly like another. Membrane filtration is a goodseparation method for many applications, but which membrane to choose is also strictlybound to the specific process of question. It is also important to state the demands of theprocess – how clean must the rinse water be in order to reach a proper quality?
Through closing up systems, there are many profits to make; economical andenvironmental through minimisation of water and chemicals, but also in terms ofquality. Installation of a closed loop system mean a more stable process bath, since themomentary exchanges of whole baths are replaced by a continuous drag out of pollutingagents.
For extending the life length of a process bath, it is in many cases necessary to keep thebath free from particles, but also keeping it free from oil and other impurities. Theremoval of particles can be made by a number of different techniques depending onwhat quality is demanded on the process. Micro filtration is a well-defined process forhigh demands, while a simple bag filter may be sufficient where the level of particles islow and the quality demands are lower.
Repart, Improved Removal of Particulate from surfaces to increase IVL rapport B1590functionality and appearance of products, Work package 5: Eco-efficient processes
8
Appendix 1. Comparison of different methods for removingparticles from a cleaning process
1. Introduction
Within the frames of the European Union project Repart, a minor investigation has beenmade in order to evaluate different methods for removing particles from a cleaningprocess in a metal industry. The different methods tested are compared in terms ofcleanliness of the outgoing water from each technique and the parameters analysed areparticle size, suspended solids, dry weight (dw) and ignition residue.
The techniques tested and compared are:
- Microfiltration
– Bag filtration
– Hydrocyclone
– Centrifugation/separation
Each technique was tested in situ and run constantly for 14 days and between each testperiod was a time lag of minimum 14 days in order to obtain the same conditions foreach test. The rinse water was new from the start of each technique. Unfortunately thecleaning solution was exchanged only once during the total experimental time, in thetime lag between the third and the forth (between hydrocyclone and centrifugation)technique tested. Therefore the solution is more heavily contaminated during the test ofthe hydrocyclone, than during the microfiltration.
Since the different equipment is of different scale, it is hard to draw any conclusionsfrom looking at the quality of the bulk water. More relevant in this case is to look at thedata on the outgoing water; the permeate or filtrate from each technique.
Other factors to take under consideration while comparing the different techniques arefor example investment costs of the equipment, energy consumption and managementof the equipment. In the evaluation of the techniques, an interview with processmanager on site has been made, in order to get a better idea of the general impressionsand the management of the equipment.
The goods cleaned in the process consist of iron and aluminium and have undergonelapping with silica carbide (SiC), and such particles are likely to be left on the goodsand released in the cleaning procedure.
Repart, Improved Removal of Particulate from surfaces to increase IVL rapport B1590functionality and appearance of products, Work package 5: Eco-efficient processes
9
2. Technique/Equipment
2.1 Microfiltration
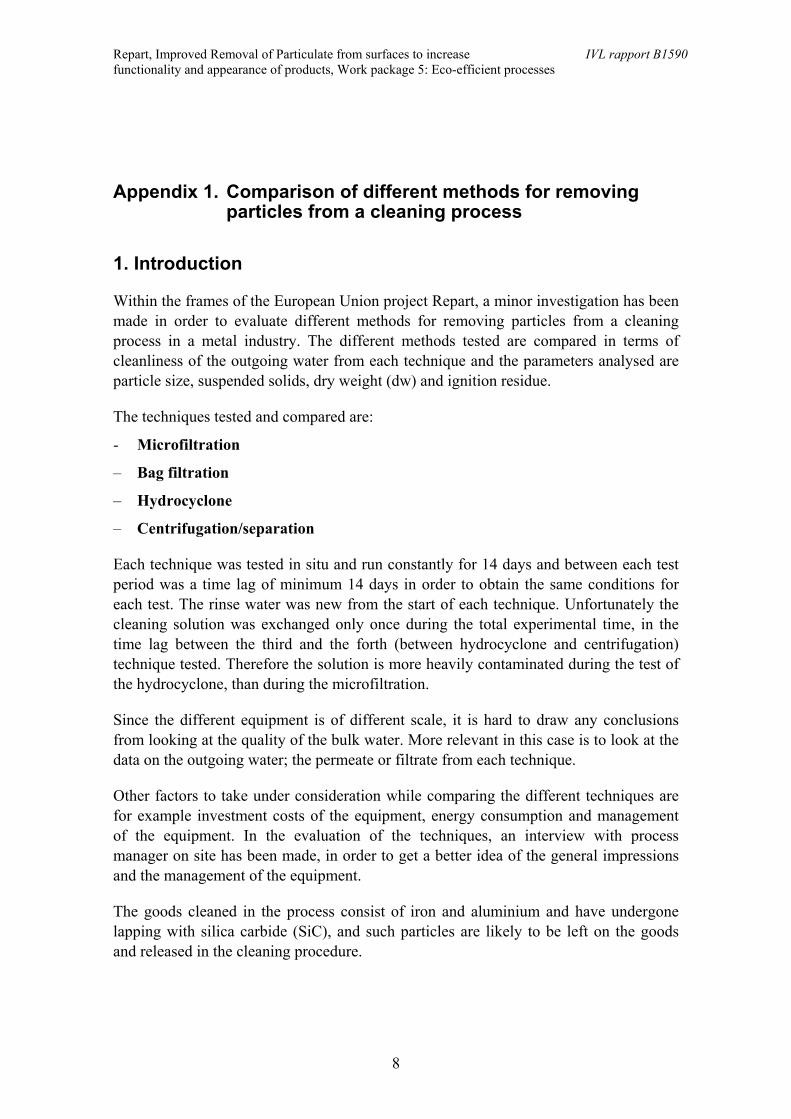
Membrane filtration involves a solution being forced under pressure through a semi-permeable membrane. A low-molecular fraction passes through the membrane duringthis process, the so-called permeate, while high-molecular compounds are recovered ina concentrate. Unlike ordinary filtration the flow direction of the fluid is parallel withthe membrane surface. The principle is called cross-flow filtration. When the velocity ofthe fluid is high enough a turbulent flow is attained, that is important to avoid fouling ofthe membrane (see figure 2:1 below).
The separation properties of the membrane are indicated as its cut-off. The term ‘cut-off’ denotes the molecular weight of the least sized molecule which is held back by themembrane. In practice, a different cut-off from that specified is often achieved, whichis due to the value being determined under idealised conditions. Membrane filtration issubdivided into various types of filtration depending on the imperviousness of themembrane:
• Microfiltration (MF) • Ultrafiltration (UF)
• Nanofiltration (NF) • Reverse osmosis filtration (RO)
Microfiltration has a cut-off between 0,05-2µm. The working pressure is often 0.1 - 0.5MPa (IVL).
Concentrate
flow
Permeate
Membrane
Large moleculesand particles
Small molecules andions
Figure 2.1 The membrane principle, where a cross-flow mechanism is illustrated.
In this test a ceramic membrane with 0,2µm cut-off was used. The unit used wasmanually controlled test equipment with 0,2 sqm membrane surface. Investment cost fora simple microfiltration unit would be around 5000 €. With automatic functions such asstart, stop, alarms, washing etc the prize could be the double.
Repart, Improved Removal of Particulate from surfaces to increase IVL rapport B1590functionality and appearance of products, Work package 5: Eco-efficient processes
10
2.2 Bagfilter
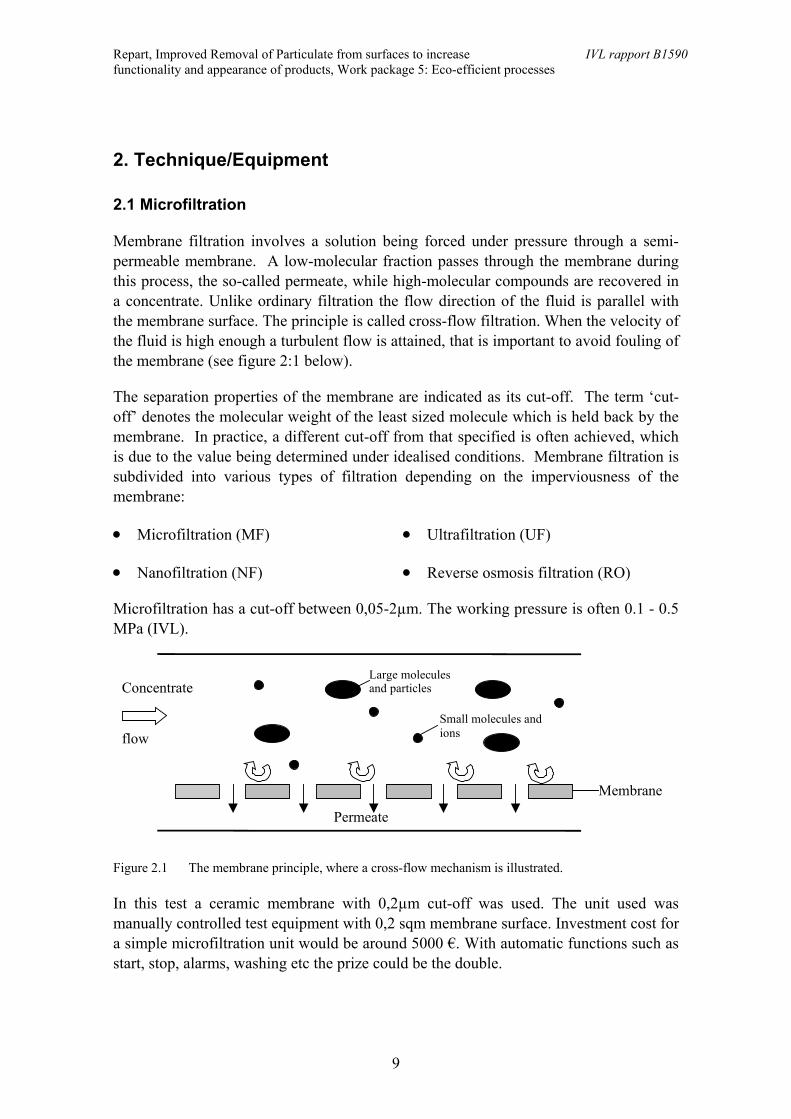
Particles can be removed from the cleaning liquid by filtering through pressure filtersdesigned as cartridge filters or bag filters and are placed in filter housings, figure 2.2.The filter inserts are replaced if they are saturated. Measuring the pressure drop acrossthe filter controls the replacement interval. A high particle load means relatively rapidfouling and calls for frequent filter changes.
Figure 2.2 Cartridge- and bag filter principle.
Normally, filters are connected in parallel in order to cope with shutdowns for servicingand filter changes during operation. Filters can also be connected in series with arelatively coarse mesh size in the first filter housing and then with more fine-meshedfilters. Common mesh sizes range between 50 and 150 µm (IVL 1998).
In this case a polypropylene filter from IFAB with 1µm pore size was used (BPONG001 P2S filterbag). Filter price is around 100 €. Equipment in this case is included in thecleaning process, otherwise a simple equipment cost may be about 2000 €.
2.3 Hydrocyclone
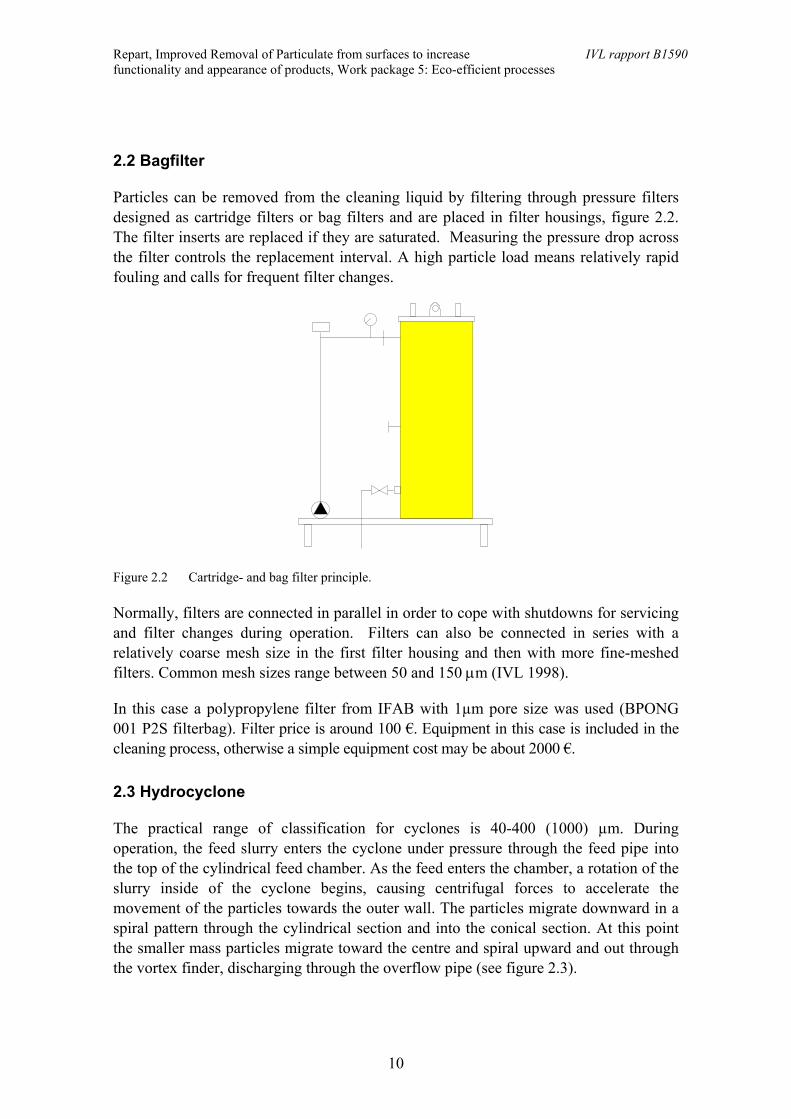
The practical range of classification for cyclones is 40-400 (1000) µm. Duringoperation, the feed slurry enters the cyclone under pressure through the feed pipe intothe top of the cylindrical feed chamber. As the feed enters the chamber, a rotation of theslurry inside of the cyclone begins, causing centrifugal forces to accelerate themovement of the particles towards the outer wall. The particles migrate downward in aspiral pattern through the cylindrical section and into the conical section. At this pointthe smaller mass particles migrate toward the centre and spiral upward and out throughthe vortex finder, discharging through the overflow pipe (see figure 2.3).
Repart, Improved Removal of Particulate from surfaces to increase IVL rapport B1590functionality and appearance of products, Work package 5: Eco-efficient processes
11
This product, which contains the finer particles and the majority of the water, is termedthe overflow and should be discharged at of near atmospheric pressure. The higher massparticles remain in a downward spiral path along the walls of the conical section andgradually exit through the apex orifice. This product is termed the underflow and alsoshould be discharged at or near atmospheric pressure (Arterburn R.A).
Figure 2.3 The figure shows the principle of a hydrocylone (Arterburn R. A).
In this experimental set-up, a Mercatus hydrocyclone model F 60 with a capacity ofaround 5400 L/h was used. This capacity well covers the needs for this application andthe investment costs is around 1600 €.
2.4 Centrifugation / separation
Centrifugal separation is like the hydrocyclone a gravimetric separating method. Theseparating properties of the components in the solution are reinforced by the influenceof centrifugal force. Pollutants or substances with higher density than the ambientsolution are pressed towards the side, where it is separated through a valve. The rest of
Repart, Improved Removal of Particulate from surfaces to increase IVL rapport B1590functionality and appearance of products, Work package 5: Eco-efficient processes
12
the solution is taken out in the middle of the centrifuge. Centrifugal separation oftenworks on separation of 3 phases; liquid (water, cleaning solution for example), liquid(oil or grease) and particles. High G-forces (5-8000g) make the separation of particleseffective (Alfa Laval).
The equipment used in this test was an Alfa Laval model Alfie 400 with a flow rate ofaround 400 L/h. Prize approximately 9000 €.
3. Results
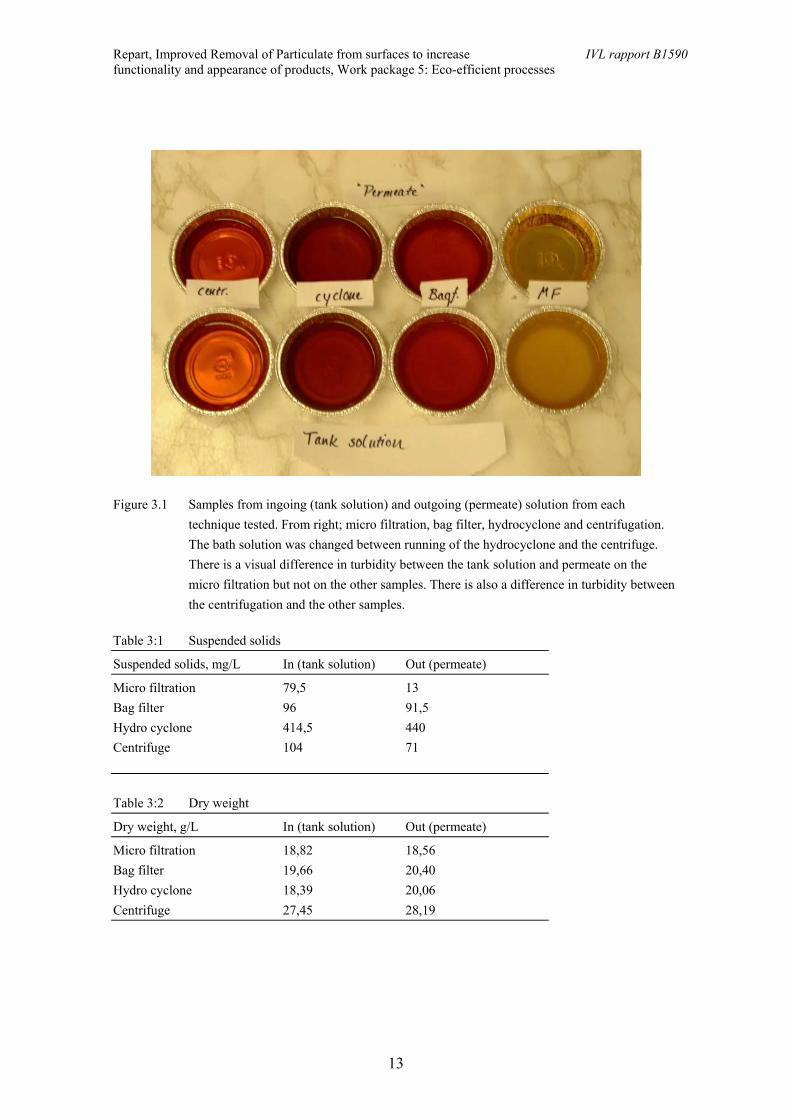
Looking at suspended solids, microfiltration shows the largest separation of around84%. The centrifuge shows a slight separation of 32%. The two other techniques tested,bag filter and hydrocyclone do not show any separation at all (see table 3:1).
The parameters dry weight and ignition residues show no separation for any of thetechniques tested (see table 3:2 and 3:3).
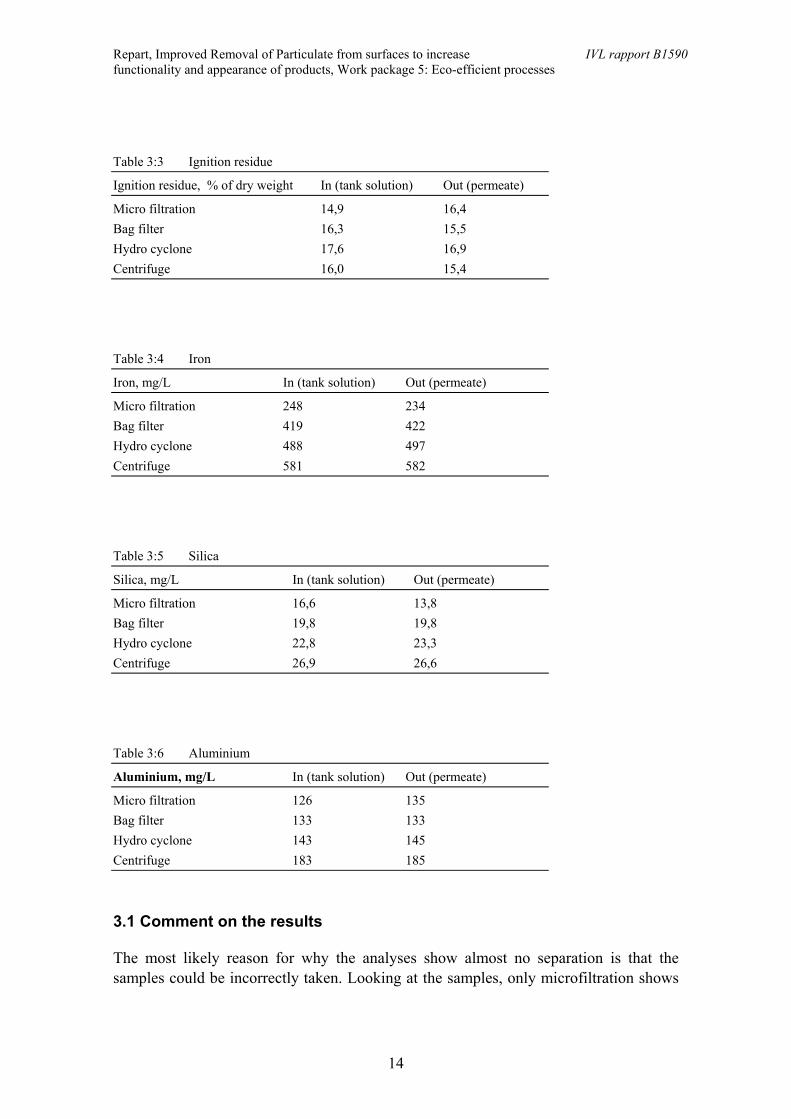
Iron, silica and aluminium were analysed in order to see if there were some particlesseparated that thereafter had dissolved into the solution. Iron has about the sameconcentration in the tank solutions as in the filtrates for all techniques tested. (Aseparation of 6% for microfiltration). Silica shows a separation of 17% formicrofiltration and no separation at all for the rest of the samples. For aluminium noseparation at all is seen for any of the four techniques tested (see table 3:4, 3:5 and 3:6).
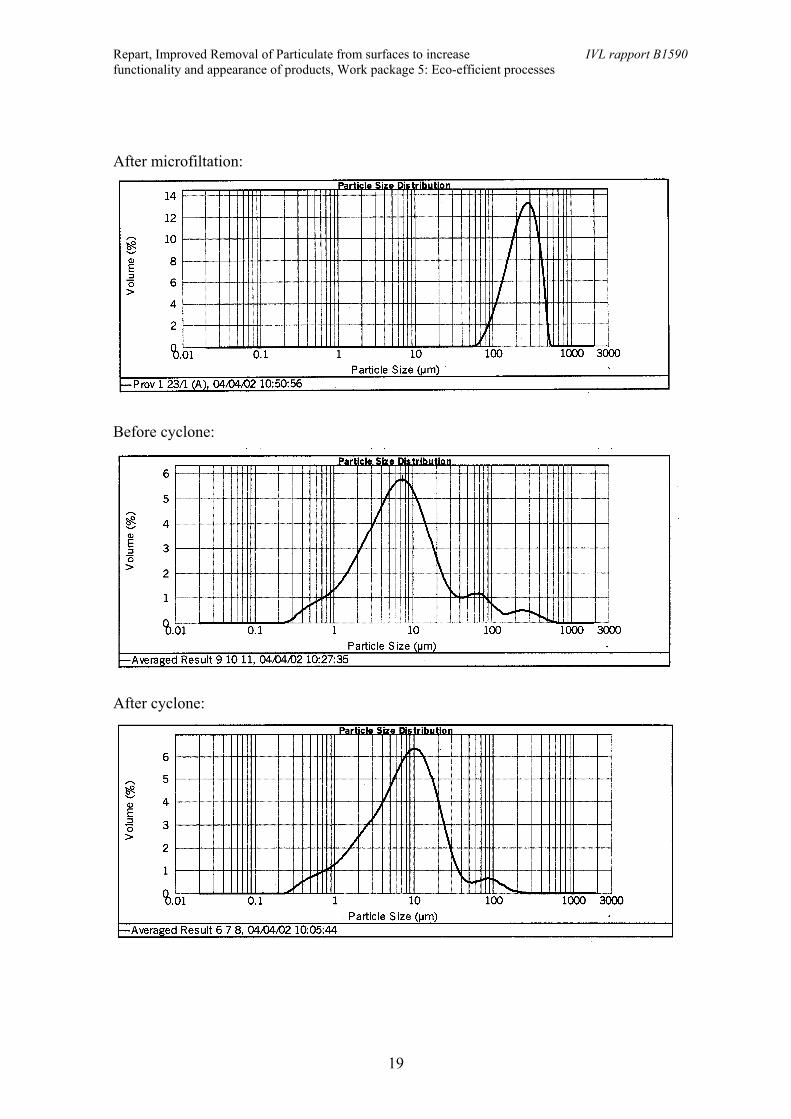
The particle size analyses made by YKI show, when studying the charts, a missing peakof particles >250µm in the filtrate from the hydrocyclone sample. This indicates aseparation of larger particles with the hydrocyclone technique. No such difference inparticle size distribution is seen for the samples from microfiltration and bag filter.Looking at the table, there are not enough particles to get a value for the microfiltrationpermeate. This indicates a separation of particles with the microfiltration technique (seeappendix 1). The last technique tested, centrifugation, was not analysed with thismethod.
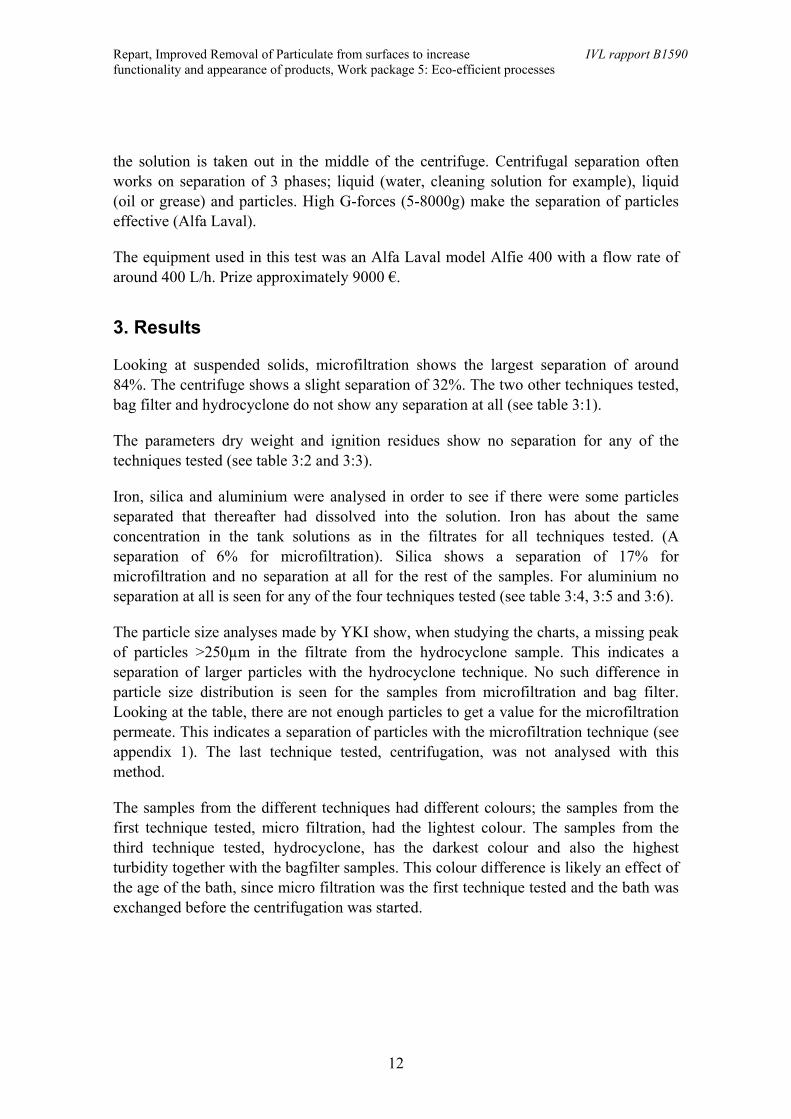
The samples from the different techniques had different colours; the samples from thefirst technique tested, micro filtration, had the lightest colour. The samples from thethird technique tested, hydrocyclone, has the darkest colour and also the highestturbidity together with the bagfilter samples. This colour difference is likely an effect ofthe age of the bath, since micro filtration was the first technique tested and the bath wasexchanged before the centrifugation was started.
Repart, Improved Removal of Particulate from surfaces to increase IVL rapport B1590functionality and appearance of products, Work package 5: Eco-efficient processes
13
Figure 3.1 Samples from ingoing (tank solution) and outgoing (permeate) solution from eachtechnique tested. From right; micro filtration, bag filter, hydrocyclone and centrifugation.The bath solution was changed between running of the hydrocyclone and the centrifuge.There is a visual difference in turbidity between the tank solution and permeate on themicro filtration but not on the other samples. There is also a difference in turbidity betweenthe centrifugation and the other samples.
Table 3:1 Suspended solids
Suspended solids, mg/L In (tank solution) Out (permeate)
Micro filtration 79,5 13Bag filter 96 91,5Hydro cyclone 414,5 440Centrifuge 104 71
Table 3:2 Dry weight
Dry weight, g/L In (tank solution) Out (permeate)
Micro filtration 18,82 18,56Bag filter 19,66 20,40Hydro cyclone 18,39 20,06Centrifuge 27,45 28,19
Repart, Improved Removal of Particulate from surfaces to increase IVL rapport B1590functionality and appearance of products, Work package 5: Eco-efficient processes
14
Table 3:3 Ignition residue
Ignition residue, % of dry weight In (tank solution) Out (permeate)
Micro filtration 14,9 16,4Bag filter 16,3 15,5Hydro cyclone 17,6 16,9Centrifuge 16,0 15,4
Table 3:4 Iron
Iron, mg/L In (tank solution) Out (permeate)
Micro filtration 248 234Bag filter 419 422Hydro cyclone 488 497Centrifuge 581 582
Table 3:5 Silica
Silica, mg/L In (tank solution) Out (permeate)
Micro filtration 16,6 13,8Bag filter 19,8 19,8Hydro cyclone 22,8 23,3Centrifuge 26,9 26,6
Table 3:6 Aluminium
Aluminium, mg/L In (tank solution) Out (permeate)
Micro filtration 126 135Bag filter 133 133Hydro cyclone 143 145Centrifuge 183 185
3.1 Comment on the results
The most likely reason for why the analyses show almost no separation is that thesamples could be incorrectly taken. Looking at the samples, only microfiltration shows
Repart, Improved Removal of Particulate from surfaces to increase IVL rapport B1590functionality and appearance of products, Work package 5: Eco-efficient processes
15
a visual difference between the in- and out-sample (see figure 3.1). The processengineer on site visually saw differences of the bath before and after every one of thedifferent cleaning techniques tested.
4. Evaluation and comparison of the different techniques
The different techniques tested have been evaluated and compared in terms of costs,efficiency and other advantages and disadvantages of the different techniques. In orderto catch the basic impressions of working with the different techniques an interviewwith the operator on site at Volvo Eskilstuna has also been made.
4.1 Microfiltration
+ Well defined separation ability
+ Reliable and robust technique
+ Good at low levels of particles and small particles
+ Good at applications with high demands on cleanliness
- Needs sometimes cleaning with chemicals
- High investment costs
- Produces a liquid concentrated waste
- The pump consumes energy
The impressions of the microfiltration by the operator is that it is a well functioningtechnique, perhaps better suited for laboratory applications though, since it demands alot of maintenance. The equipment tested on site, however, was a manual testequipment, not at all automated.
4.2 Bagfilter
+ Easy to handle
+ Simple and cheap investment
+ Produces a solid waste
+ Good at low levels of particles
- Needs frequent replacement in heavy particle loaded applications
- A simple technique not suitable for applications with high demands on cleanliness
Repart, Improved Removal of Particulate from surfaces to increase IVL rapport B1590functionality and appearance of products, Work package 5: Eco-efficient processes
16
Operator’s comment: A simple technique already existing in the tested installation. Easyto handle, but needs change when it gets clogged.
4.3 Hydrocyclone
+ Easy managenement – emptying of the sludge once in a while
+ Small volumes of waste (sludge)
+ Good at high concentrations of particles
+ Low investment costs
+/- Gravimetric method that separates particles with a certain density and size
- The pump consumes energy
The operator on site appointed the hydrocyclone to the best of the four equipmentstested since it showed a good (visual) separation and was easy to handle.
4.4 Centrifuge
+ Good for separation of 3 phases; liquid – liquid – particles.
+/- Gravimetric method that separates particles with a certain density and size
- Require time for maintenance of the equipment.
- The pump consumes energy
According to the operator on site, this technique had several disadvantages. It demandsa lot of service and cleaning management and is time consuming.
5. Acknowledgements
IVL and the Repart project would like to thank Mats Björkman, operator at VolvoEskilstuna, for valuable practical help and comments on the different techniques.
The project would also like to thank Mercatus and Alfa Laval for letting us use theirequipment.
6. ReferencesIVL – Internal information and course material
Arterburn R. A. “The sizing and selection of hydrocyclones” www.krebs.comwww.alfalaval.com + information
Repart, Improved Removal of Particulate from surfaces to increase IVL rapport B1590functionality and appearance of products, Work package 5: Eco-efficient processes
17
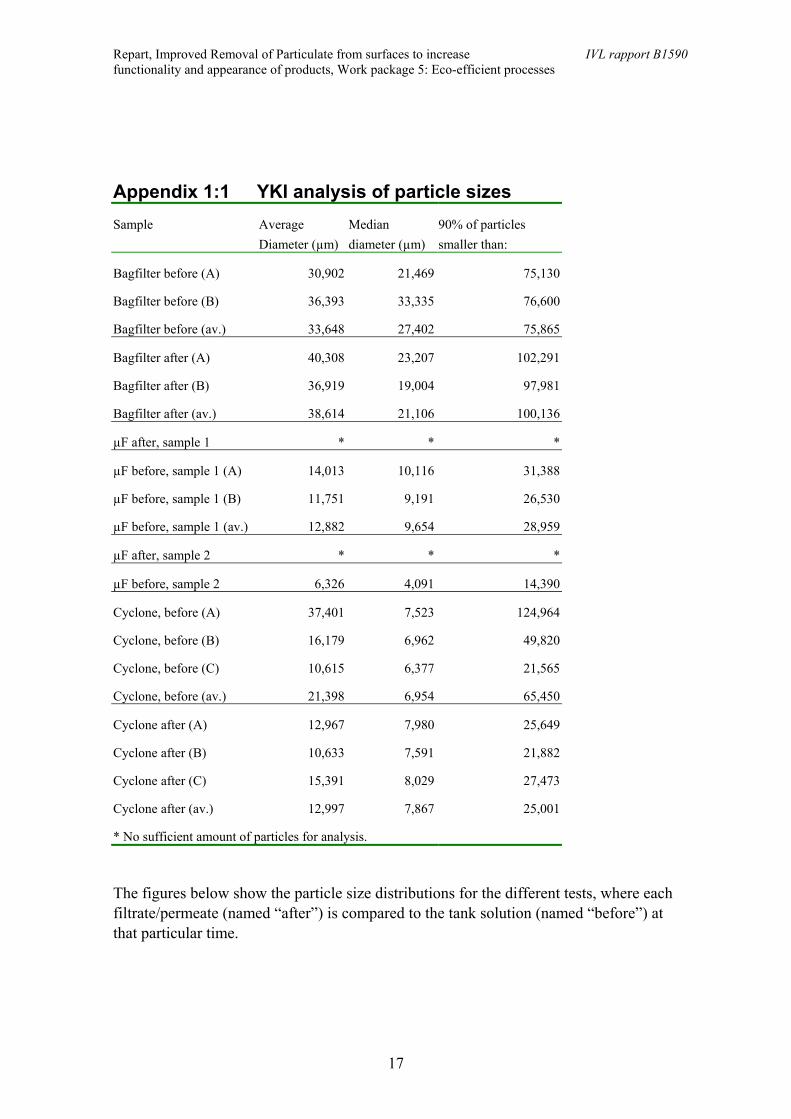
Appendix 1:1 YKI analysis of particle sizesSample Average
Diameter (µm)Mediandiameter (µm)
90% of particlessmaller than:
Bagfilter before (A) 30,902 21,469 75,130
Bagfilter before (B) 36,393 33,335 76,600
Bagfilter before (av.) 33,648 27,402 75,865
Bagfilter after (A) 40,308 23,207 102,291
Bagfilter after (B) 36,919 19,004 97,981
Bagfilter after (av.) 38,614 21,106 100,136
µF after, sample 1 * * *
µF before, sample 1 (A) 14,013 10,116 31,388
µF before, sample 1 (B) 11,751 9,191 26,530
µF before, sample 1 (av.) 12,882 9,654 28,959
µF after, sample 2 * * *
µF before, sample 2 6,326 4,091 14,390
Cyclone, before (A) 37,401 7,523 124,964
Cyclone, before (B) 16,179 6,962 49,820
Cyclone, before (C) 10,615 6,377 21,565
Cyclone, before (av.) 21,398 6,954 65,450
Cyclone after (A) 12,967 7,980 25,649
Cyclone after (B) 10,633 7,591 21,882
Cyclone after (C) 15,391 8,029 27,473
Cyclone after (av.) 12,997 7,867 25,001
* No sufficient amount of particles for analysis.
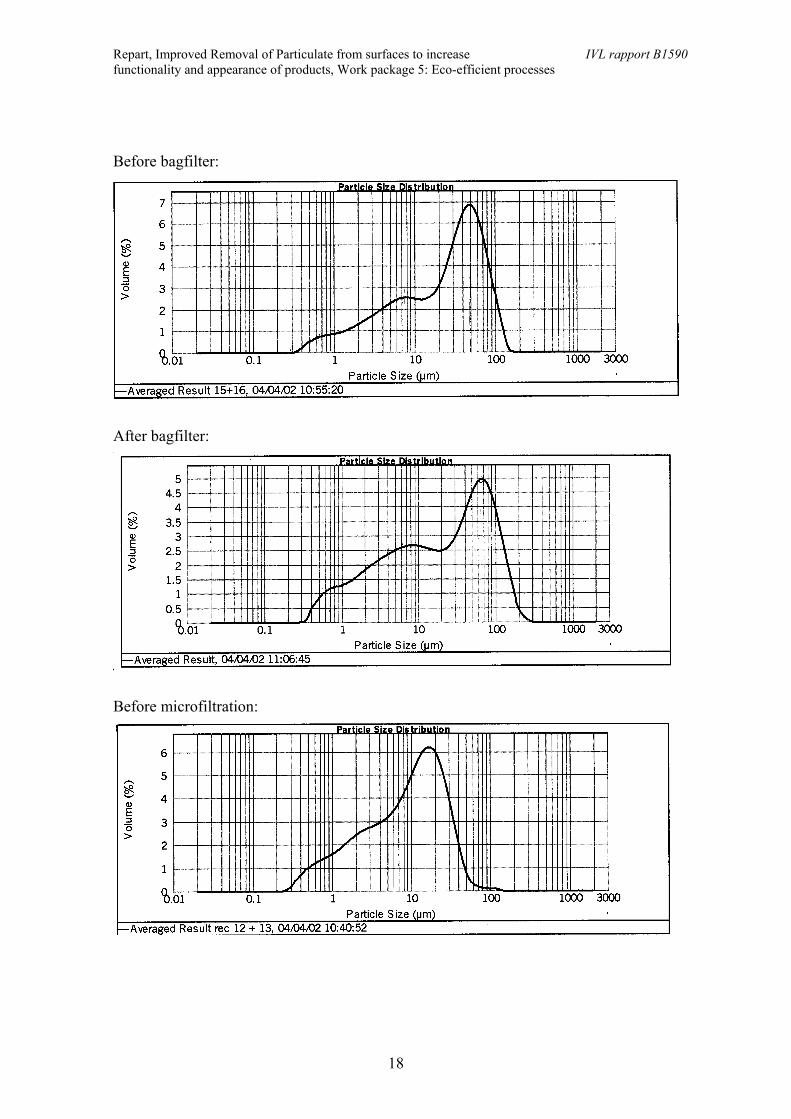
The figures below show the particle size distributions for the different tests, where eachfiltrate/permeate (named “after”) is compared to the tank solution (named “before”) atthat particular time.
Repart, Improved Removal of Particulate from surfaces to increase IVL rapport B1590functionality and appearance of products, Work package 5: Eco-efficient processes
18
Before bagfilter:
After bagfilter:
Before microfiltration:
Repart, Improved Removal of Particulate from surfaces to increase IVL rapport B1590functionality and appearance of products, Work package 5: Eco-efficient processes
19
After microfiltation:
Before cyclone:
After cyclone:
Repart, Improved Removal of Particulate from surfaces to increase IVL rapport B1590functionality and appearance of products, Work package 5: Eco-efficient processes
20
Appendix 2. Membrane filtration of degreasing bath - multivariateevaluation of experiments in laboratory scale
1. Background
Cleaning and rinsing are common processes in the industry today and since nocompletely closed systems exist yet, different kinds of waste products are produced bythese processes. Membrane filtration is a technique to reduce the quantity of waste andto minimize the resource consumption from the rinsing and cleaning processes throughrecycling of both process water and the chemicals used in the processes.
Membrane filtration is used in many different applications and is widely used in theengineering industry. The most common cleaning chemicals used today are based onsurfactants and there is a growing need for developing closed systems, where oil andparticles can be removed from the system in order to reuse surfactant chemicals withgood quality. For this purpose membrane filtration could be a good choice.
To motivate the investment of membrane filtration equipment economically andtechnically, certain parameters are decisive:
- The degree of removal of oil and particles
- The degree of surfactants returned to the system
- The flux through the membrane
All these parameters have big influences on the treatment costs and the environmentalimpacts of the process. An optimal membrane filtration process results in high reductionof oil, low reduction of surfactants and a high flux through the membrane. A lowreduction of surfactants results in minimized use of chemicals, which is favourable bothin economical and environmental aspects.
The investment cost for a membrane filtration application is high. Therefore it isdesirable to maintain a high flux through the membrane. Membrane filtration is also anenergy consuming process and it is important to counteract fouling of the membrane.
Membrane filtration is a complex process that is influenced by many parameters such asthe properties of the membrane, the structure and composition of the surfactant, contentof polluting agents in the solution and interactions between these and other processparameters. This complexity makes it difficult to maintain a high degree of recycling ofthe surfactants and a high flux through the membrane.
Repart, Improved Removal of Particulate from surfaces to increase IVL rapport B1590functionality and appearance of products, Work package 5: Eco-efficient processes
21
More knowledge and understanding are needed to get a well-functioning technique forclosing up industrial cleaning systems. This study is an attempt to highlight theimportance of different parameters in the process.
2. Purpose
The purpose of this study is to understand the complexity of membrane filtrationprocesses better. The influence of certain parameters and interactions between them arestudied and evaluated through multivariate methods. An optimized process could meanboth lower costs and environmental improvements.
3. Methodology
To achieve a maximum of information about how certain process parameters andinteraction effects influence the filtration result, a selection of parameters are studied inan experimental set-up in factorial design. Properties of membranes, surfactants andprocess parameters are studied. First a number of parameters were chosen, theexperiments were performed and the results were evaluated with multivariate methods.
The test solutions, simulated cleaning baths, were prepared at IVL´s laboratory throughaddition of oil and surfactants to water.
3.1 Experiments
To get a maximum of information out of the project, the experiments were planned witha factorial design.
3.1.1.1 Parameters
The independent parameters chosen for this study have all in previous studies beenidentified to have big influence on the cleaning systems.
SaltThe concentration of electrolyte in the solution has a big influence for colloidal systems.The electrolyte destabilizes the systems since it minimizes the so-called energy barrier.The electrolyte neutralizes the repulsive electrostatic double layer. This destabilizationmakes the micelles easier fall apart. A secondary effect of this destabilization could bethat the micelles to a higher degree could pass through a membrane. In theseexperiments sodium chloride is used as electrolyte. The concentration varies at twolevels and the levels have been chosen on the basis of information from industrieshaving degreasing bath in their processes. The conductivity in the test solution varies
Repart, Improved Removal of Particulate from surfaces to increase IVL rapport B1590functionality and appearance of products, Work package 5: Eco-efficient processes
22
between 16-21,5 mS/cm due to the concentration added. The concentration added isrespectively 3 and 8,75 g/l.
SilicaIt is not an established fact that silica effects the flux of the membrane. The complexbinder sodium meta-silicate is varied in the experiments to investigate its influence onthe flux. The compound has also got alkali and surface hydrophilic properties. Theconcentration added to the experimental solution is 1 and 2 g/l respectively.
SurfactantThe concentration of surfactant in the solution have been varied to investigate its effecton the separation and flux capacities on the membranes. The surfactant used in theexperiments is a blend of non-ionic and cationic surfactants for waterborne degreasingand has a good cleaning and degreasing capacity on hard surfaces. The product has beendiluted according to the instructions for use in industrial cleaning processes. Theconcentrations used in the experiments are respectively 2,5 and 4,5 g/l.
TemperatureTemperature is an important factor to take into account in a cleaning process and theoptimal temperature is individual for every cleaning product. The cloud point is verysensitive for the content of tetra potassium pyrophosphate. In the experiments havetemperatures below the cloud point been used and recommended quantity of tetrapotassium pyrophosphate been added. The temperatures used in the experiments are 35and 55°C respectively.
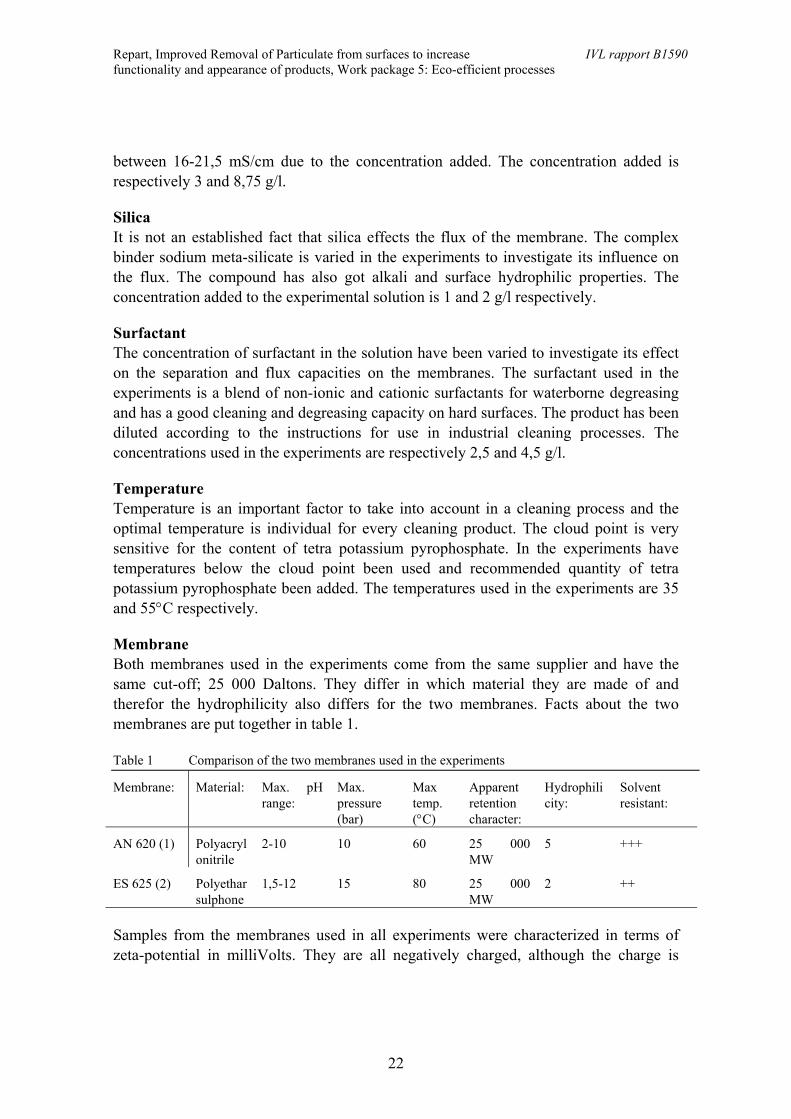
MembraneBoth membranes used in the experiments come from the same supplier and have thesame cut-off; 25 000 Daltons. They differ in which material they are made of andtherefor the hydrophilicity also differs for the two membranes. Facts about the twomembranes are put together in table 1.
Table 1 Comparison of the two membranes used in the experiments
Membrane: Material: Max. pHrange:
Max.pressure(bar)
Maxtemp.(°C)
Apparentretentioncharacter:
Hydrophilicity:
Solventresistant:
AN 620 (1) Polyacrylonitrile
2-10 10 60 25 000MW
5 +++
ES 625 (2) Polyetharsulphone
1,5-12 15 80 25 000MW
2 ++
Samples from the membranes used in all experiments were characterized in terms ofzeta-potential in milliVolts. They are all negatively charged, although the charge is
Repart, Improved Removal of Particulate from surfaces to increase IVL rapport B1590functionality and appearance of products, Work package 5: Eco-efficient processes
23
higher for the AN 620 membrane (average -58mV for membrane AN 620 and –39mVfor membrane ES 625).
Parameters that are held constant throughout the experimentsAnother complex binding compound that is included in the cleaning formulation is tetrapotassium pyrophosphate. Since no effects on the flux due to this compound has beenindicated earlier, its level is held constant throughout the experiments. Tetra potassiumpyrophosphate has a buffering effect. To every experiment 3 g/l is added to the solution.
pH is not controlled in the experiments, though it is measured continually. This is due tothe buffering effect of tetra potassium pyrophosphate described above. Regulating of thepH in a buffering system demands large quantities of acid or base and could thereby risethe conductivity significantly. pH at start varied between 11,57 and 12,15 and at the endof the experiments between 9,72 and 11,14.
The stirring of the solution is enough since the total volume is pumped through thesystem in a minute. Industrially this is a very important factor to take into consideration.
The content of oil in the solution is based on the contents in a typical metal cleaningbath; i.e. approximately 2 % weight oil. In these experiments the mineral oil QuackerMP-2 is used. The oil was emulsified into the solution and the sizes of the particles weremeasured. Mean particle size was between 1-100 µm in diameter.
The pressure is held constant at 8 bar at the entrance of the system.
3.2 Evaluation of the experiments
The experiments were performed under similar conditions and many parameters weremeasured; permeate flux at certain times, foam magnitude, pH, flux of pure waterbefore and after each experiment, conductivity, surface charge, concentration of oil inthe permeate and COD. Surfactant concentration in the permeates are calculated fromthe amount of total extracted alifates subtracted by the amount of non-polar alifates(oil).
The results of the experiments were analyzed through multivariate methods to evaluatewhich parameters have most influence on the process and which interaction effectsexist.
4. Results
The most important single parameter in this study showed out to be which membranethat was used. The flux was over all very much higher in the experiments made with
Repart, Improved Removal of Particulate from surfaces to increase IVL rapport B1590functionality and appearance of products, Work package 5: Eco-efficient processes
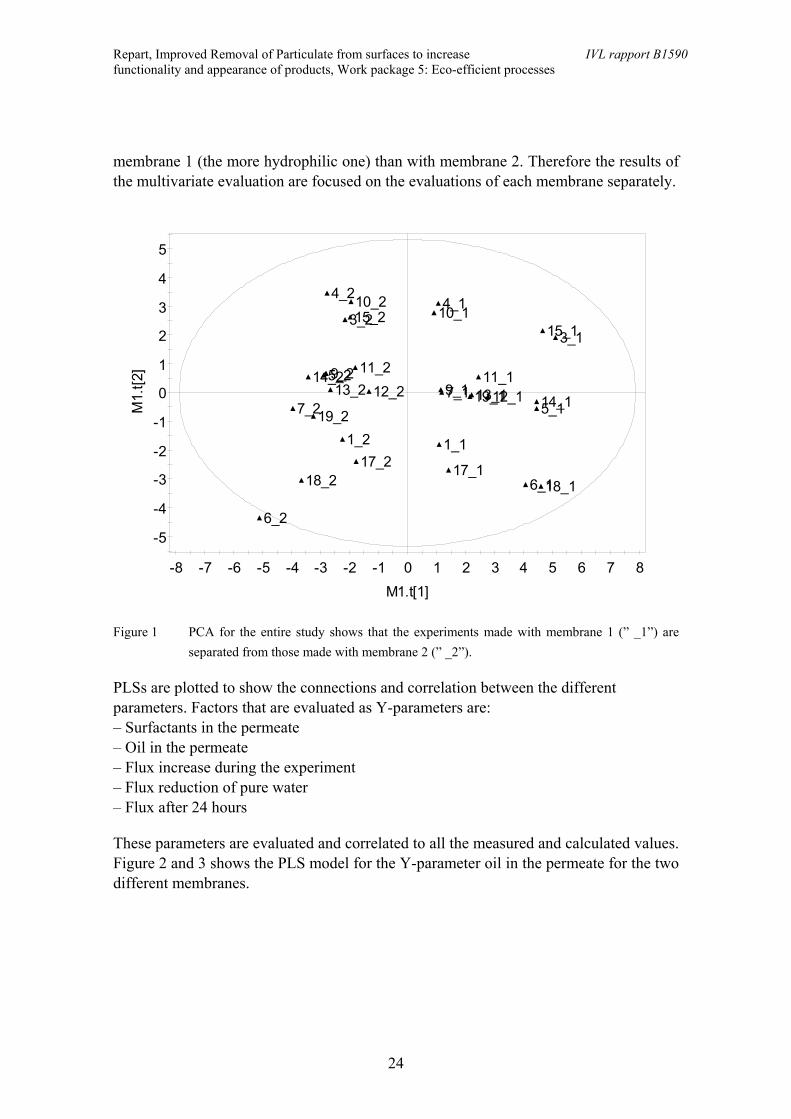
24
membrane 1 (the more hydrophilic one) than with membrane 2. Therefore the results ofthe multivariate evaluation are focused on the evaluations of each membrane separately.
-5
-4
-3
-2
-1
0
1
2
3
4
5
-8 -7 -6 -5 -4 -3 -2 -1 0 1 2 3 4 5 6 7 8
M1.
t[2]
M1.t[1]
4_14_2
15_115_2
14_1
14_2
10_110_2
3_13_2
12_112_2 9_19_2
17_117_26_1
6_2
11_111_2
5_1
5_2
1_11_2
18_118_2
13_113_2 19_119_2
7_17_2
Figure 1 PCA for the entire study shows that the experiments made with membrane 1 (” _1”) areseparated from those made with membrane 2 (” _2”).
PLSs are plotted to show the connections and correlation between the differentparameters. Factors that are evaluated as Y-parameters are:– Surfactants in the permeate– Oil in the permeate– Flux increase during the experiment– Flux reduction of pure water– Flux after 24 hours
These parameters are evaluated and correlated to all the measured and calculated values.Figure 2 and 3 shows the PLS model for the Y-parameter oil in the permeate for the twodifferent membranes.
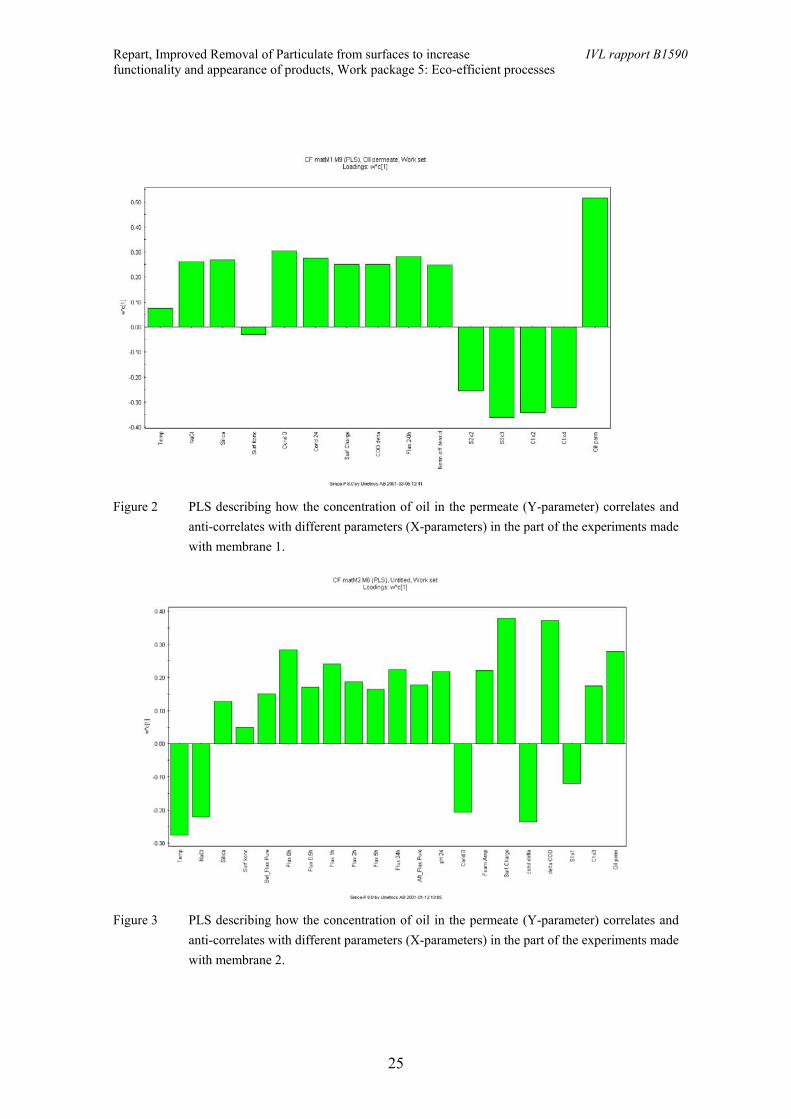
Repart, Improved Removal of Particulate from surfaces to increase IVL rapport B1590functionality and appearance of products, Work package 5: Eco-efficient processes
25
Figure 2 PLS describing how the concentration of oil in the permeate (Y-parameter) correlates andanti-correlates with different parameters (X-parameters) in the part of the experiments madewith membrane 1.
Figure 3 PLS describing how the concentration of oil in the permeate (Y-parameter) correlates andanti-correlates with different parameters (X-parameters) in the part of the experiments madewith membrane 2.
Repart, Improved Removal of Particulate from surfaces to increase IVL rapport B1590functionality and appearance of products, Work package 5: Eco-efficient processes
26
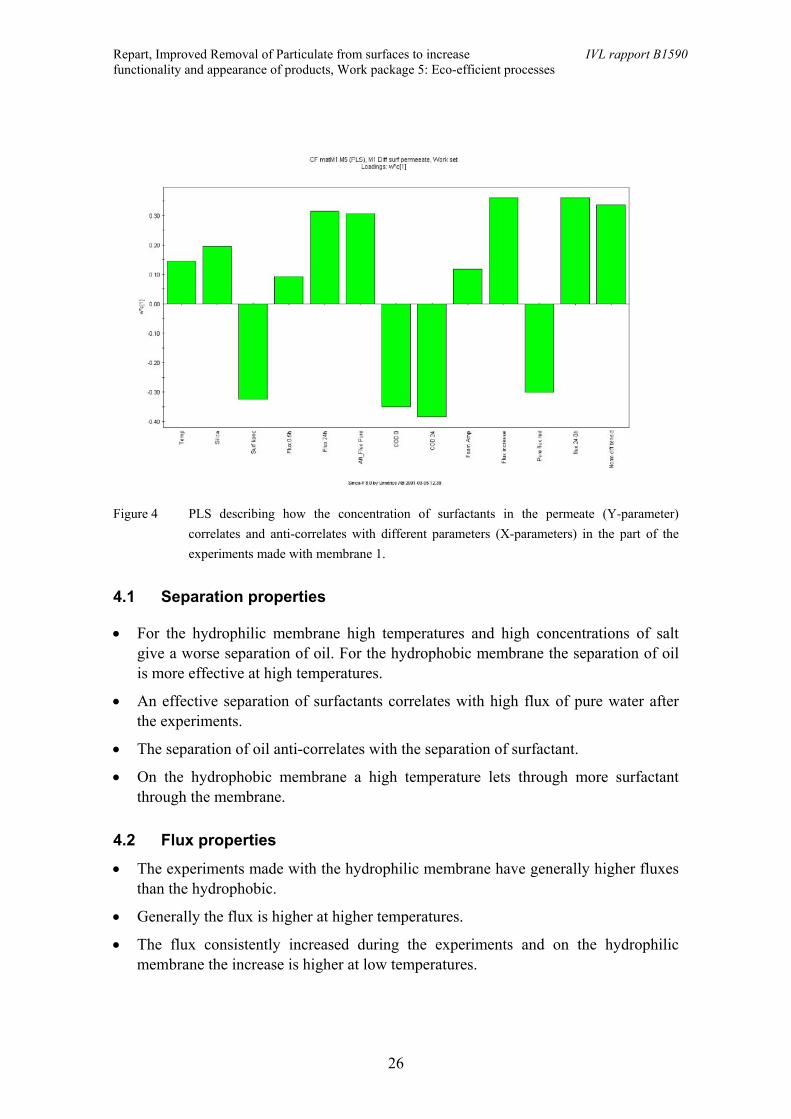
Figure 4 PLS describing how the concentration of surfactants in the permeate (Y-parameter)correlates and anti-correlates with different parameters (X-parameters) in the part of theexperiments made with membrane 1.
4.1 Separation properties
• For the hydrophilic membrane high temperatures and high concentrations of saltgive a worse separation of oil. For the hydrophobic membrane the separation of oilis more effective at high temperatures.
• An effective separation of surfactants correlates with high flux of pure water afterthe experiments.
• The separation of oil anti-correlates with the separation of surfactant.
• On the hydrophobic membrane a high temperature lets through more surfactantthrough the membrane.
4.2 Flux properties
• The experiments made with the hydrophilic membrane have generally higher fluxesthan the hydrophobic.
• Generally the flux is higher at higher temperatures.
• The flux consistently increased during the experiments and on the hydrophilicmembrane the increase is higher at low temperatures.
Repart, Improved Removal of Particulate from surfaces to increase IVL rapport B1590functionality and appearance of products, Work package 5: Eco-efficient processes
27
• Silica seems to counteract the flux increase on the hydrophilic membrane
• For both membrane types there is a connection between high flux and high amountsof oil and surfactants in the permeate.
• High concentrations of silica and high pHs deteriorate the flux of pure water afterthe experiments.
• There is a connection between separation of oil and flux of pure water after theexperiment – bad separation correlates with bad flux for the hydrophilic membrane.A corresponding connection exists between separation of surfactant and flux for thehydrophobic membrane.
4.3 Influence of the different parameters
Salt: High amounts of salt leads to a deteriorated separation of oil.
Silica: Silica contributes to lower the flux. It also seems to enhance the throughletting of both oil and surfactant through the membrane.
Surfactant: High amounts of surfactants counteract high flux increases for theexperiments made with the hydrophobic membrane.
Temperature: A high temperature contributes to higher flux for the hydrophilicmembrane. For the hydrophobic membrane the situation is the opposite.The separation of surfactants is enhanced by high temperature for theexperiments made with the hydrophilic membrane, and the separation ofoil is enhanced by high temperatures for the hydrophobic membrane.
4.4 Differences between the two membranes
4.4.1Membrane 1 (620)
- Hydrophilic.- Oil in permeate correlates with temperature and salt.- Flux increase during experiment correlates with surfactants in the concentrate.- Flux increase during experiment anti-correlates with temp, silica- Flux reduction in pure water after the experiment correlates with pH at 24 h, fluxincrease, oil in permeate- Flux reduction in pure water after the experiment anti-correlates with temp and temp,salt, silica, surfactant conc. squared.- Flux after 24h correlates with temp, delta conductivity, interaction between silica andsurface conc.- Flux after 2 h correlates with temp, silica, interaction between salt and silica
Repart, Improved Removal of Particulate from surfaces to increase IVL rapport B1590functionality and appearance of products, Work package 5: Eco-efficient processes
28
4.4.2Membrane 2 (625)
- Hydrophobic- Surfactants in permeate correlate with temp- Oil in permeate correlate with flux, surface charge- Oil in permeate anti-correlate with temp, salt, conductivity at start, delta conductivity- Flux increase during experiment anti-correlates with surfactants in concentrate, temp,salt and silica squared- Flux reduction in pure water after the experiment correlates with temp, surfaceconcentration in the permeate- Flux after 24h correlates with pure water flux, delta COD- Flux after 24h anti-correlates with temp, surfactants in permeate, delta conductivity,interaction between temp and salt, interaction between silica and surfactants inconcentrate.- Flux after 2 h correlates with salt, interaction between silica and surfactants inconcentrate.- Flux after 2 h anti-correlates with temp.
4.4.3 Similiarities – results that are the same for both membranes
-Surfactants in the permeate correlated with COD in the permeates, surfactants in theconcentrate.- Surfactants in the permeate anti-correlated with pure water flux and the content of oilin the permeate.- The flux reduction of pure water after the experiments correlated with theconcentration of silica, pH and with the interaction between temp. and the surfactantconcentration and anti-correlated with flux.- The flux after 24 hours correlated with silica and oil in the permeate and anti-correlated with salt.
4. Discussion
With which membrane the experiments had been performed showed out to have a bigsignificance for the multivariate evaluation, wherefore most of the results andconclusions are built on the evaluations made for each membrane separately. Aconclusion that can be drawn from this is that it is crucial to choose the right membranefor the purpose. The membranes used in these tests have the same cut-off, but one ofthem is more hydrophilic than the other one.
Repart, Improved Removal of Particulate from surfaces to increase IVL rapport B1590functionality and appearance of products, Work package 5: Eco-efficient processes
29
Some of the correlations and anti-correlations are almost obvious, such as the surfactantconcentration in the permeate correlating with the surfactant concentration from thebeginning, while others are more unexpected.
In accordance with earlier studies, for example in the EU project “Brite Euram”, highertemperatures usually give better fluxes, but also a worse separation. The separation ofoil is highly dependent on the membrane properties though; high temperatures have theopposite effect on the separation of oil for the two different membranes.
The results of these experiments confirm the earlier statement that hydrophilicmembranes give higher fluxes in general. This conclusion is also drawn from the earlierEU project “Brite Euram”.
In accordance with “Brite Euram” the flux is normally higher at higher temperatures. Inthese experiments the flux generally increase during the tests and for the hydrophilicmembrane the increase is higher at low temperatures. Silica seems to counteract thisflux increase for the hydrophilic membrane.
A weakness in the study is the method used to measure the concentration of oil andsurfactants; the amount of surfactants are calculated from the amount of total extractablealiphatic hydrocarbons minus the amount of non-polar aliphatic hydrocarbons (=theamount of oil).
The pH in the solutions is higher than one of the membranes can manage. This factcould have influenced the results regarding parameters such as flux and the amount ofsurfactants etc in the permeate.
Repart, Improved Removal of Particulate from surfaces to increase IVL rapport B1590functionality and appearance of products, Work package 5: Eco-efficient processes
30
Appendix 3. Evaluation of different parameters of cleaningformulations in correlation with membrane filtration
1. Introduction
Within the frames of the European Union project Repart, a series of tests has been madein order to state some conditions to enhance membrane filtration of cleaningformulations. Earlier in this project and partly in another earlier European Unionprojects some knowledge in the area has been found. In this report another final testwithin this project has been made, where the earlier knowledge has been used forverifying the important parameters. At the end of this report a summary of theconclusions drawn from the project as a whole is found.
To avoid loss of surfactants during membrane filtration, a low degree of separation isdesirable. The focus has been on the use of hydrophilic membrane, which in the formerstudies has shown higher recovery rates for surfactants compared to the morehydrophobic one. The use of the hydrophobic membrane in this work is mainly toconfirm the former results.
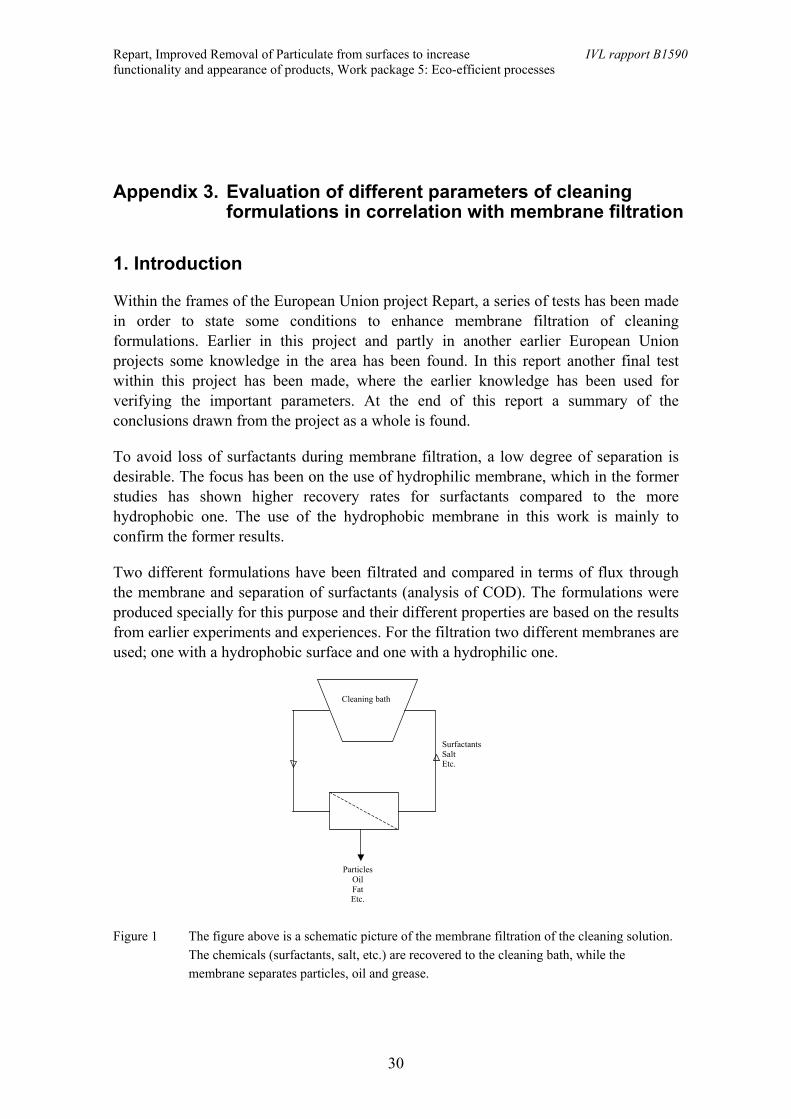
Two different formulations have been filtrated and compared in terms of flux throughthe membrane and separation of surfactants (analysis of COD). The formulations wereproduced specially for this purpose and their different properties are based on the resultsfrom earlier experiments and experiences. For the filtration two different membranes areused; one with a hydrophobic surface and one with a hydrophilic one.
Cleaning bath
SurfactantsSaltEtc.
ParticlesOilFatEtc.
Figure 1 The figure above is a schematic picture of the membrane filtration of the cleaning solution.The chemicals (surfactants, salt, etc.) are recovered to the cleaning bath, while themembrane separates particles, oil and grease.
Repart, Improved Removal of Particulate from surfaces to increase IVL rapport B1590functionality and appearance of products, Work package 5: Eco-efficient processes
31
Formulation 1 “Good” Formulation 2 “Bad”
- “Good” for membrane applications(hydrophilic membranes) according to earlierstudies.
- “Bad” for membrane applications(hydrophilic membranes) according to earlierstudies.
- High pH (around 12) - Neutral pH (7)
- Low amount of surfactants - High amount of surfactants
- High amount of silicate - Sequestering agent and corrosion inhibitor
2. Experimental set up
Castrol prepared the cleaning formulations and their content was put together accordingto results from earlier studies.
Formulation 1: Formulation 2:
0,25% Sodium silicate 0,25% Sodium NTA Complexing agents
0,05% Potassium hydroxide 0,25% Organic corrosion inhibitor (mixture ofamine – short chain acids
0,1% Non-ionic surfactant 0,4% Non-ionic surfactant (same as formulation 1)
Water Water
Two different tubular membranes from PCI were used:
FP 100 AN 620
Pore size MW 100 000 MW 25 000
Hydrophilicity + +++++
The permeate was lead back to the bulk solution all through the experiment and noconcentration of the solution was made. Temperature during filtration was 35°C andpressure 8 Bar.
After 24 hours of filtration, 25 ml of antifoam was added to the formulation and thefiltration was continued for some hours.
Repart, Improved Removal of Particulate from surfaces to increase IVL rapport B1590functionality and appearance of products, Work package 5: Eco-efficient processes
32
3. Results
3.1 Flux properties
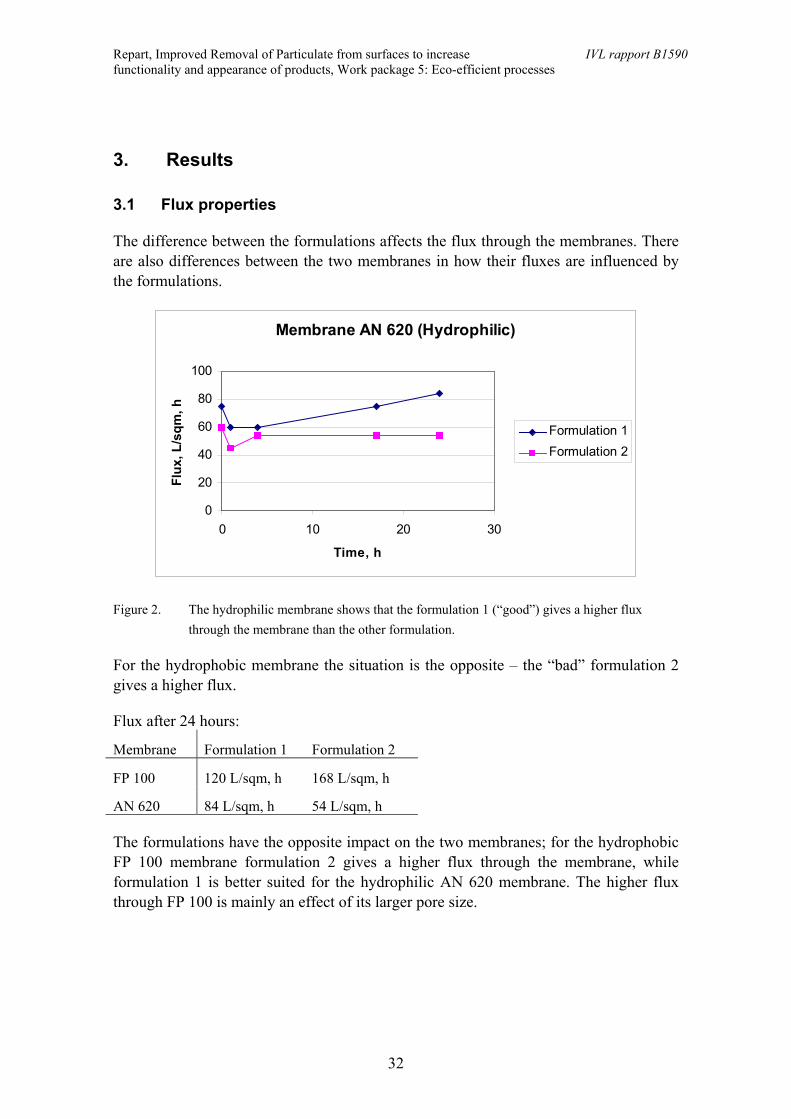
The difference between the formulations affects the flux through the membranes. Thereare also differences between the two membranes in how their fluxes are influenced bythe formulations.
Membrane AN 620 (Hydrophilic)
0
20
40
60
80
100
0 10 20 30
Time, h
Flux
, L/s
qm, h
Formulation 1Formulation 2
Figure 2. The hydrophilic membrane shows that the formulation 1 (“good”) gives a higher fluxthrough the membrane than the other formulation.
For the hydrophobic membrane the situation is the opposite – the “bad” formulation 2gives a higher flux.
Flux after 24 hours:
Membrane Formulation 1 Formulation 2
FP 100 120 L/sqm, h 168 L/sqm, h
AN 620 84 L/sqm, h 54 L/sqm, h
The formulations have the opposite impact on the two membranes; for the hydrophobicFP 100 membrane formulation 2 gives a higher flux through the membrane, whileformulation 1 is better suited for the hydrophilic AN 620 membrane. The higher fluxthrough FP 100 is mainly an effect of its larger pore size.
Repart, Improved Removal of Particulate from surfaces to increase IVL rapport B1590functionality and appearance of products, Work package 5: Eco-efficient processes
33
3.1.1Addition of antifoam
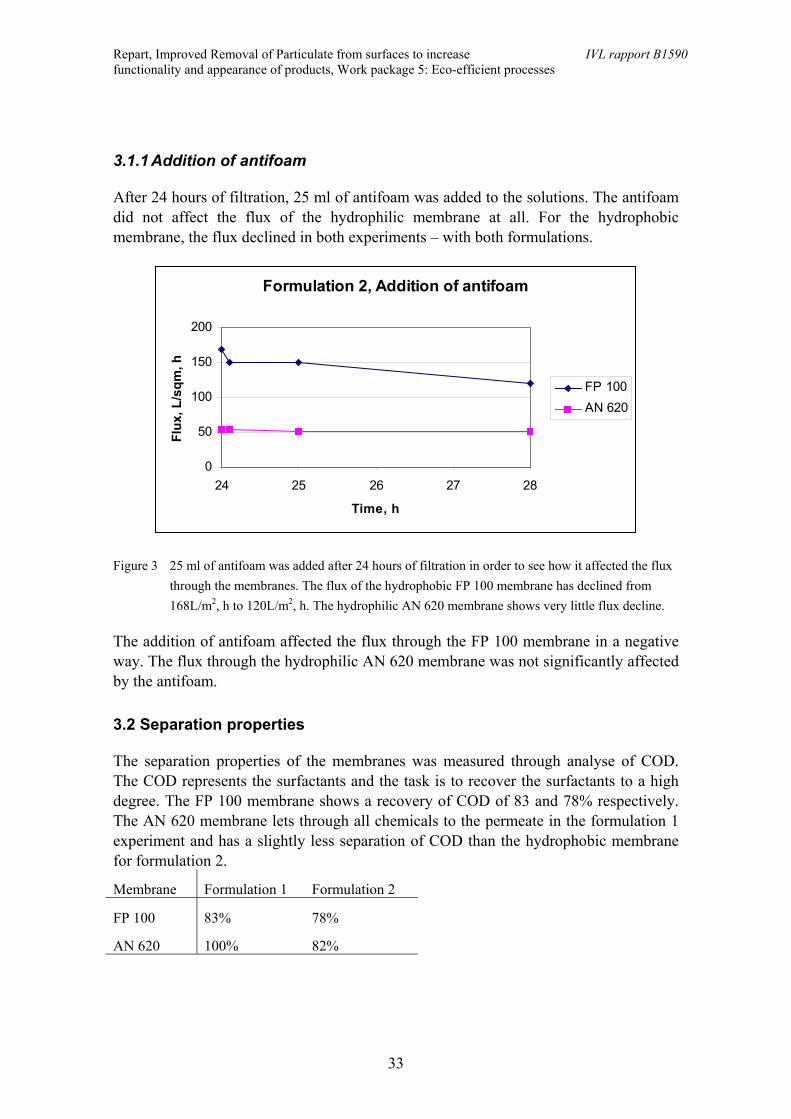
After 24 hours of filtration, 25 ml of antifoam was added to the solutions. The antifoamdid not affect the flux of the hydrophilic membrane at all. For the hydrophobicmembrane, the flux declined in both experiments – with both formulations.
Formulation 2, Addition of antifoam
0
50
100
150
200
24 25 26 27 28
Time, h
Flux
, L/s
qm, h
FP 100AN 620
Figure 3 25 ml of antifoam was added after 24 hours of filtration in order to see how it affected the fluxthrough the membranes. The flux of the hydrophobic FP 100 membrane has declined from168L/m2, h to 120L/m2, h. The hydrophilic AN 620 membrane shows very little flux decline.
The addition of antifoam affected the flux through the FP 100 membrane in a negativeway. The flux through the hydrophilic AN 620 membrane was not significantly affectedby the antifoam.
3.2 Separation properties
The separation properties of the membranes was measured through analyse of COD.The COD represents the surfactants and the task is to recover the surfactants to a highdegree. The FP 100 membrane shows a recovery of COD of 83 and 78% respectively.The AN 620 membrane lets through all chemicals to the permeate in the formulation 1experiment and has a slightly less separation of COD than the hydrophobic membranefor formulation 2.
Membrane Formulation 1 Formulation 2
FP 100 83% 78%
AN 620 100% 82%
Repart, Improved Removal of Particulate from surfaces to increase IVL rapport B1590functionality and appearance of products, Work package 5: Eco-efficient processes
34
The hydrophobic FP 100 membrane has retained the chemicals to a higher degree thanthe hydrophilic AN 620 membrane, although the FP 100 membrane has a larger pore size.
4. Discussion and conclusions
Looking at the hydrophilic membrane (AN 620) formulation 1 gives a better flux throughthe membrane than formulation 2 (84 and 54 L/m2, h respectively). This supports thethesis from the earlier work done within the project. An interesting result is that for thehydrophobic membrane (FP 100) the situation is the opposite i.e. formulation 2 gives abetter flux through the membrane (120 and 168L/m2, h respectively).
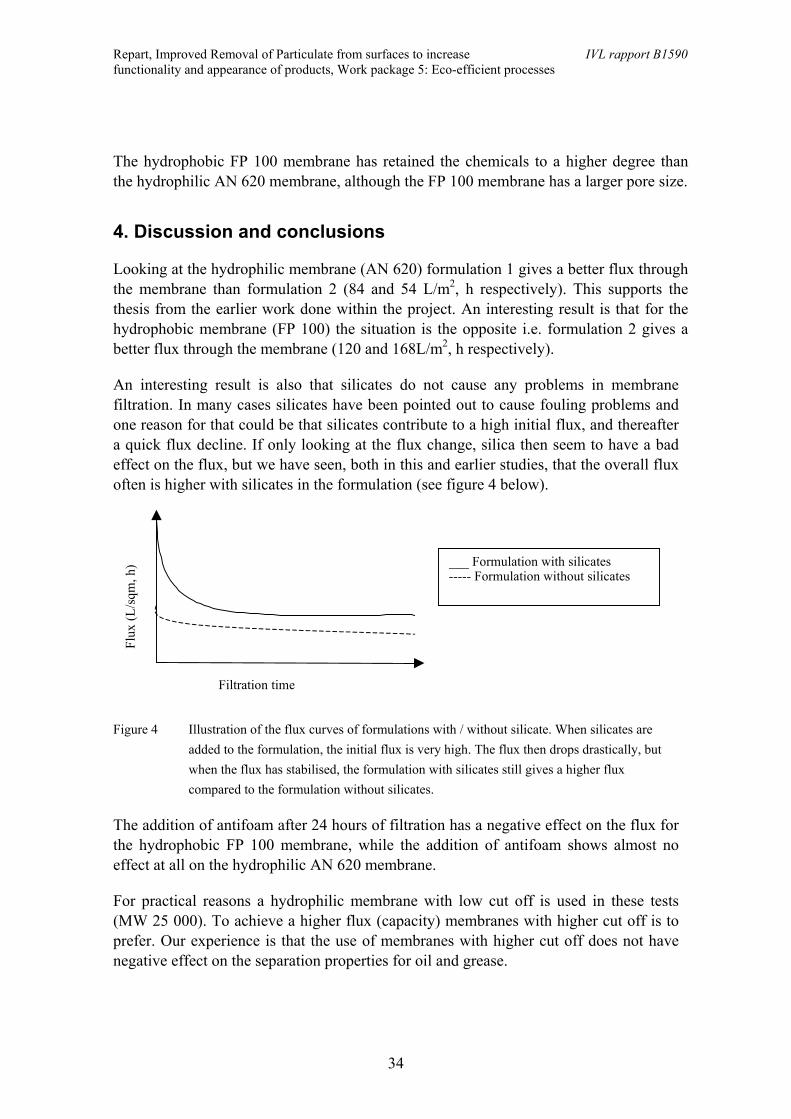
An interesting result is also that silicates do not cause any problems in membranefiltration. In many cases silicates have been pointed out to cause fouling problems andone reason for that could be that silicates contribute to a high initial flux, and thereaftera quick flux decline. If only looking at the flux change, silica then seem to have a badeffect on the flux, but we have seen, both in this and earlier studies, that the overall fluxoften is higher with silicates in the formulation (see figure 4 below).
Flux
(L/s
qm, h
)
Filtration time
___ Formulation with silicates----- Formulation without silicates
Figure 4 Illustration of the flux curves of formulations with / without silicate. When silicates areadded to the formulation, the initial flux is very high. The flux then drops drastically, butwhen the flux has stabilised, the formulation with silicates still gives a higher fluxcompared to the formulation without silicates.
The addition of antifoam after 24 hours of filtration has a negative effect on the flux forthe hydrophobic FP 100 membrane, while the addition of antifoam shows almost noeffect at all on the hydrophilic AN 620 membrane.
For practical reasons a hydrophilic membrane with low cut off is used in these tests(MW 25 000). To achieve a higher flux (capacity) membranes with higher cut off is toprefer. Our experience is that the use of membranes with higher cut off does not havenegative effect on the separation properties for oil and grease.
Repart, Improved Removal of Particulate from surfaces to increase IVL rapport B1590functionality and appearance of products, Work package 5: Eco-efficient processes
35
The results show that the choice of cleaning formulation highly affect the ability toextend the life length of the bath through membrane filtration. It is important to chosethe right combination of cleaning formulation and membrane, since this study showsthat different membrane qualities (hydrophilicity) is suitable for different types ofchemical formulations.
Summary of conclusions drawn from this study and earlier work done:Flux properties Recovery rate
Membrane Hydrophilic membrane superior Hydrophilic membrane superiorSurfactants Low concentrations gives better flux Low concentrations gives better
recovery rateSilicates Silicates in formulation gives higher
fluxSilicates contribute to betterrecovery rates.
Antifoam Usually no problem when usinghydrophilic membranes
No effects seen
High pH A high pH often correlates with higherflux
A high pH correlates with a goodrecovery rate
Biocides and wetting agents have shown to counteract flux decline.
These conclusions are valuable information and useful knowledge at the installation ofnew recycling techniques. In most cases we still recommend to use pilot scale tests toavoid a lot of problems after installation in full scale.
Repart, Improved Removal of Particulate from surfaces to increase IVL rapport B1590functionality and appearance of products, Work package 5: Eco-efficient processes
36
Appendix 4. Rinsing requirement - a small test in lab scale
1. Introduction
Within the frames of the European Union project Repart, a minor lab scale test has beenperformed in order to get a clue of how the cleanliness of the rinse water influences thequality of degreased metal goods.
Usually large efforts are made on cleaning processes, trying to optimise the cleaningformulations with respect to the demands on cleanliness of the goods. Very fewreferences has been found concerning the impact of the rinse water; the stage whichalmost always follows after a cleaning process, and of course also has a large impact onthe quality of the goods. How clean must the rinse water be to reach a satisfactoryquality of the product? Could the rinse water be too clean? Some earlier studies indicatethat too clean rinse water could cause problems on the goods surface, just like a toodirty solution. To mention one example, the use of de-ionised water in one case causeda larger degree of corrosion compared to rinsing with ordinary tap water. Whatparameters are important in this context? Should the rinse solution contain a certainamount of some chemicals? Are there any other components that should be strictlyavoided? This work is a little effort in order to get a clue about these things.
The experiment was performed with a factorial design, and the results were evaluatedwith multivariate methods. The factors that represent the quality parameters in the testare the amount of organic carbon at the surface, the amount of particulate CaCO3 on thesurface (analysed with IMC) and the relative corrosion on the surface of the goods(visual comparison of the different test pieces).
All experiments were made on clean iron sheets and the parameters varied in the rinsewaters are:
• Amount of particles• pH• Concentration of surfactants• Concentration of salt• Concentration of oil in the solution
2. Materials and methods
All parameters are varied at two levels and the clean iron sheets are pre-washed beforethe test through dipping in a strong alkaline cleaning solution containing mild steel
Repart, Improved Removal of Particulate from surfaces to increase IVL rapport B1590functionality and appearance of products, Work package 5: Eco-efficient processes
37
corrosion inhibitor. For each experimental set-up, 3 iron sheets were attached to aholder with a rubber band and vertically put down into a beaker with the test solution.The sheets were exposed for the tempered (40°C) test solution for 2 minutes before theywere taken up vertically and put in a drying cabinet before the analyses.
Mild steel was used for test material. Specifically a special reference material was useddenoted "Q-panel type R-36" from "Q-panel lab products". This is cold rolled andannealed mild steel that is suitable for deep drawing. The surface, with dull, mattsurface texture, is protected by light corrosion protection oil.
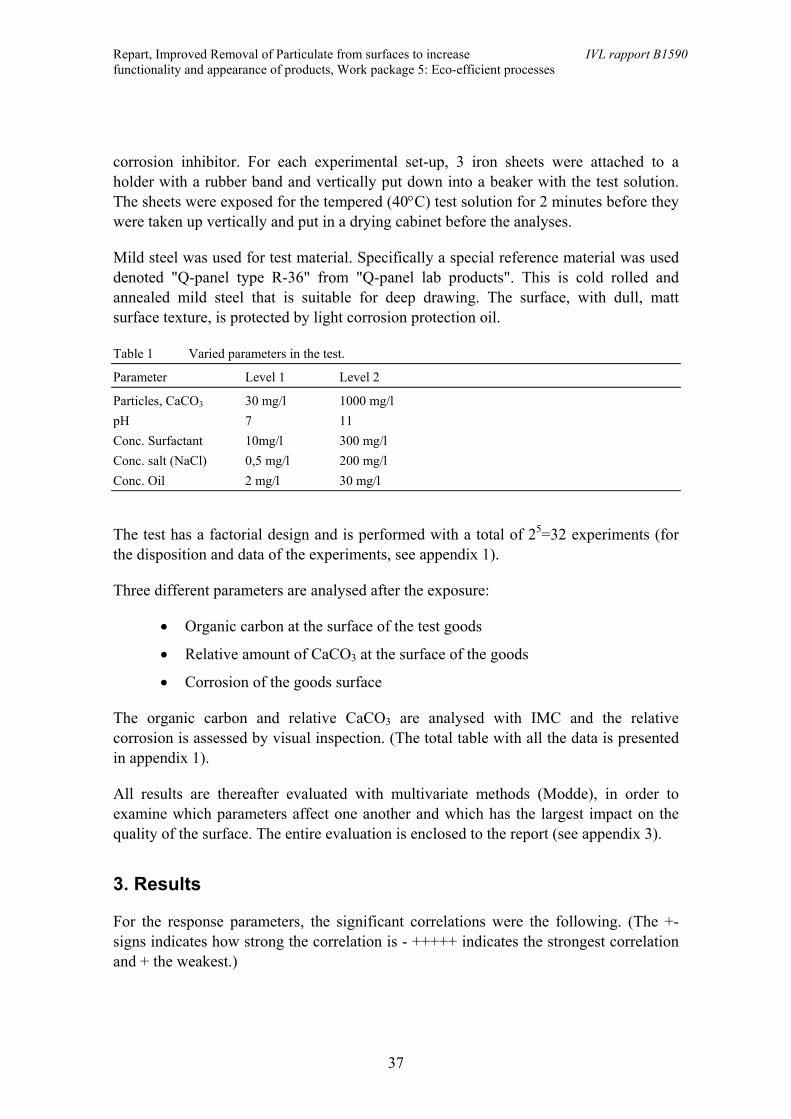
Table 1 Varied parameters in the test.
Parameter Level 1 Level 2
Particles, CaCO3 30 mg/l 1000 mg/lpH 7 11Conc. Surfactant 10mg/l 300 mg/lConc. salt (NaCl) 0,5 mg/l 200 mg/lConc. Oil 2 mg/l 30 mg/l
The test has a factorial design and is performed with a total of 25=32 experiments (forthe disposition and data of the experiments, see appendix 1).
Three different parameters are analysed after the exposure:
• Organic carbon at the surface of the test goods
• Relative amount of CaCO3 at the surface of the goods
• Corrosion of the goods surface
The organic carbon and relative CaCO3 are analysed with IMC and the relativecorrosion is assessed by visual inspection. (The total table with all the data is presentedin appendix 1).
All results are thereafter evaluated with multivariate methods (Modde), in order toexamine which parameters affect one another and which has the largest impact on thequality of the surface. The entire evaluation is enclosed to the report (see appendix 3).
3. Results
For the response parameters, the significant correlations were the following. (The +-signs indicates how strong the correlation is - +++++ indicates the strongest correlationand + the weakest.)
Repart, Improved Removal of Particulate from surfaces to increase IVL rapport B1590functionality and appearance of products, Work package 5: Eco-efficient processes
38
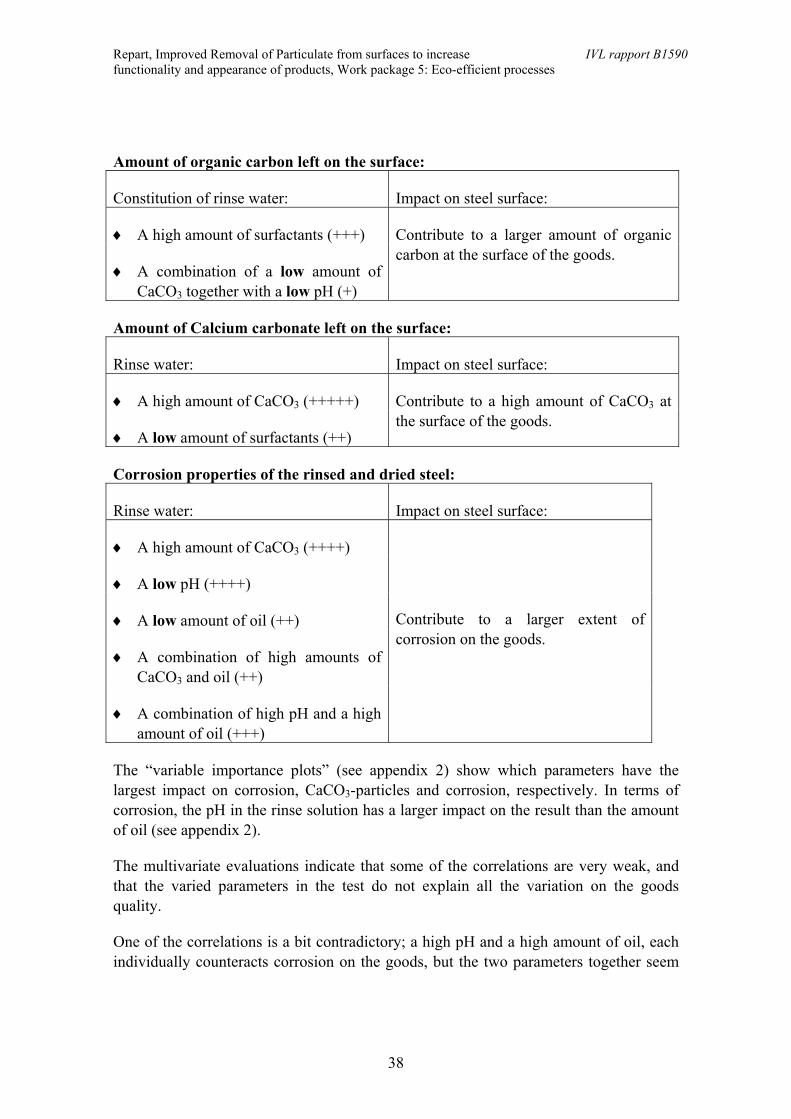
Amount of organic carbon left on the surface:
Constitution of rinse water: Impact on steel surface:
♦ A high amount of surfactants (+++)
♦ A combination of a low amount ofCaCO3 together with a low pH (+)
Contribute to a larger amount of organiccarbon at the surface of the goods.
Amount of Calcium carbonate left on the surface:
Rinse water: Impact on steel surface:
♦ A high amount of CaCO3 (+++++)
♦ A low amount of surfactants (++)
Contribute to a high amount of CaCO3 atthe surface of the goods.
Corrosion properties of the rinsed and dried steel:
Rinse water: Impact on steel surface:
♦ A high amount of CaCO3 (++++)
♦ A low pH (++++)
♦ A low amount of oil (++)
♦ A combination of high amounts ofCaCO3 and oil (++)
♦ A combination of high pH and a highamount of oil (+++)
Contribute to a larger extent ofcorrosion on the goods.
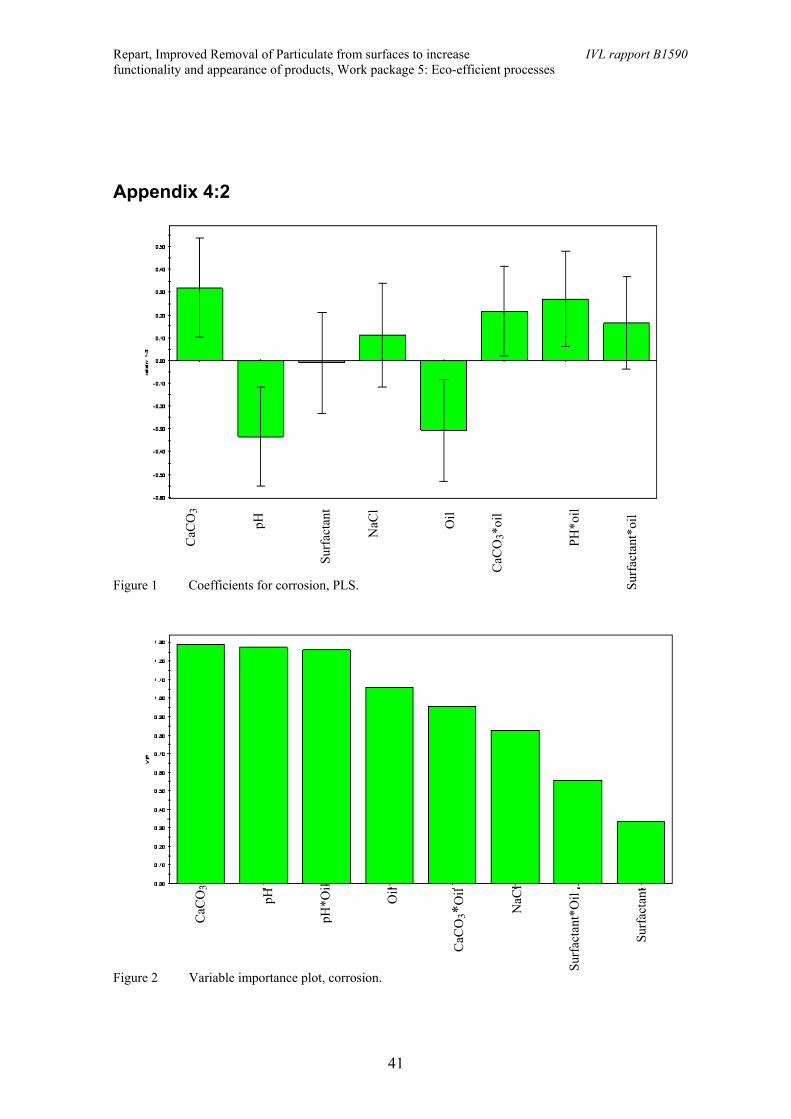
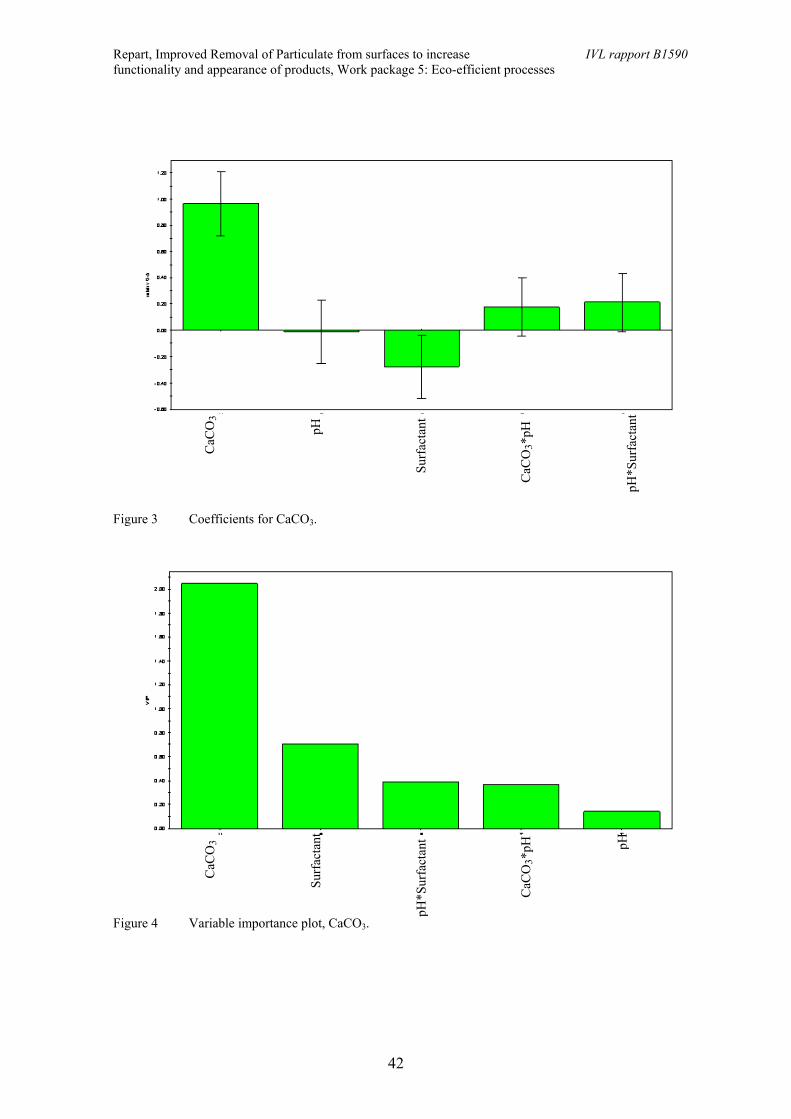
The “variable importance plots” (see appendix 2) show which parameters have thelargest impact on corrosion, CaCO3-particles and corrosion, respectively. In terms ofcorrosion, the pH in the rinse solution has a larger impact on the result than the amountof oil (see appendix 2).
The multivariate evaluations indicate that some of the correlations are very weak, andthat the varied parameters in the test do not explain all the variation on the goodsquality.
One of the correlations is a bit contradictory; a high pH and a high amount of oil, eachindividually counteracts corrosion on the goods, but the two parameters together seem
Repart, Improved Removal of Particulate from surfaces to increase IVL rapport B1590functionality and appearance of products, Work package 5: Eco-efficient processes
39
to have the opposite effect. The pH, though, has a larger impact on the rinse result thanhas the amount of oil.
The multivariate evaluation shows that the varied and analysed parameters in theexperiment do not explain all variation. There could for instance be a variation of thequality of the test pieces from the beginning.
4. Conclusions
Since this is only a small-scale test, one can only get some indications of how theconstitution of rinse water could affect the quality of the steel after degreasing. As whatis true for all processes, it is hard to generalise a rinsing process. All degreasingprocesses have its unique composition of steel quality, surfactants, corrosion inhibitorsetc. There are also different demands for different applications and a “general perfectrinse water” does not exist.
For the system studied in this work, some conclusions can be drawn. Surfactants in therinse water contribute to a higher amount of organic carbon at the surface of the goods.It is interesting to notice that the amount of oil varied in the test has no significantimpact on the organic carbon of the goods surface. Neither has the concentration of saltaffected the goods quality according to these analyses.
In terms of corrosion, the higher pH, and the larger amount of oil in the rinse solution,individually but not together, has had a good impact on the goods with less corrosion.
The main focus of the project is particles on surfaces, and the best results attaining aparticle free surface of the goods (CaCO3-free) is to keep the content of CaCO3-particlesin the rinse solution as low as possible and have a certain amount of surfactants in therinse water.
This supports the thesis that a "too clean" rinse solution could have negative effect onthe quality of degreased steel. Surfactants in the solution could for instance enhance runoff of water with particles from the goods after rinsing. This results in lower amounts ofparticles left on the surface.
Repart, Improved Removal of Particulate from surfaces to increase IVL rapport B1590functionality and appearance of products, Work package 5: Eco-efficient processes
40
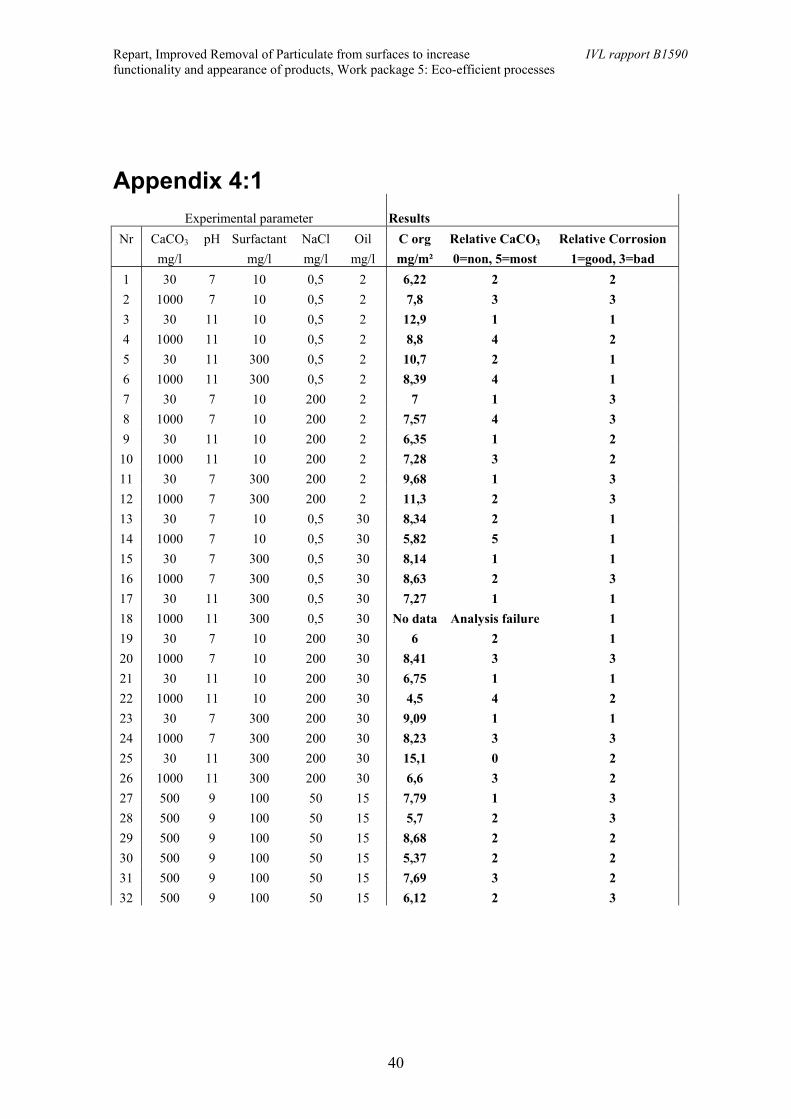
Appendix 4:1Experimental parameter Results
Nr CaCO3 pH Surfactant NaCl Oil C org Relative CaCO3 Relative Corrosionmg/l mg/l mg/l mg/l mg/m² 0=non, 5=most 1=good, 3=bad
1 30 7 10 0,5 2 6,22 2 22 1000 7 10 0,5 2 7,8 3 33 30 11 10 0,5 2 12,9 1 14 1000 11 10 0,5 2 8,8 4 25 30 11 300 0,5 2 10,7 2 16 1000 11 300 0,5 2 8,39 4 17 30 7 10 200 2 7 1 38 1000 7 10 200 2 7,57 4 39 30 11 10 200 2 6,35 1 2
10 1000 11 10 200 2 7,28 3 211 30 7 300 200 2 9,68 1 312 1000 7 300 200 2 11,3 2 313 30 7 10 0,5 30 8,34 2 114 1000 7 10 0,5 30 5,82 5 115 30 7 300 0,5 30 8,14 1 116 1000 7 300 0,5 30 8,63 2 317 30 11 300 0,5 30 7,27 1 118 1000 11 300 0,5 30 No data Analysis failure 119 30 7 10 200 30 6 2 120 1000 7 10 200 30 8,41 3 321 30 11 10 200 30 6,75 1 122 1000 11 10 200 30 4,5 4 223 30 7 300 200 30 9,09 1 124 1000 7 300 200 30 8,23 3 325 30 11 300 200 30 15,1 0 226 1000 11 300 200 30 6,6 3 227 500 9 100 50 15 7,79 1 328 500 9 100 50 15 5,7 2 329 500 9 100 50 15 8,68 2 230 500 9 100 50 15 5,37 2 231 500 9 100 50 15 7,69 3 232 500 9 100 50 15 6,12 2 3
Repart, Improved Removal of Particulate from surfaces to increase IVL rapport B1590functionality and appearance of products, Work package 5: Eco-efficient processes
41
Appendix 4:2
Figure 1 Coefficients for corrosion, PLS.
Figure 2 Variable importance plot, corrosion.
CaC
O3
pH
Surf
acta
n t
NaC
l
Oil
CaC
O3*
oil
PH*o
il
Surf
acta
nt*o
il
CaC
O3
pH
pH*O
il
Oil
CaC
O3*
Oil
NaC
l
Surf
acta
nt*O
il
Surf
acta
n t
Repart, Improved Removal of Particulate from surfaces to increase IVL rapport B1590functionality and appearance of products, Work package 5: Eco-efficient processes
42
Figure 3 Coefficients for CaCO3.
Figure 4 Variable importance plot, CaCO3.
CaC
O3
pH
Surf
acta
nt
CaC
O3*
pH
pH*S
urfa
ctan
t
CaC
O3 pH
Surf
acta
nt
CaC
O3*
pH
pH*S
urfa
ctan
t
Repart, Improved Removal of Particulate from surfaces to increase IVL rapport B1590functionality and appearance of products, Work package 5: Eco-efficient processes
43
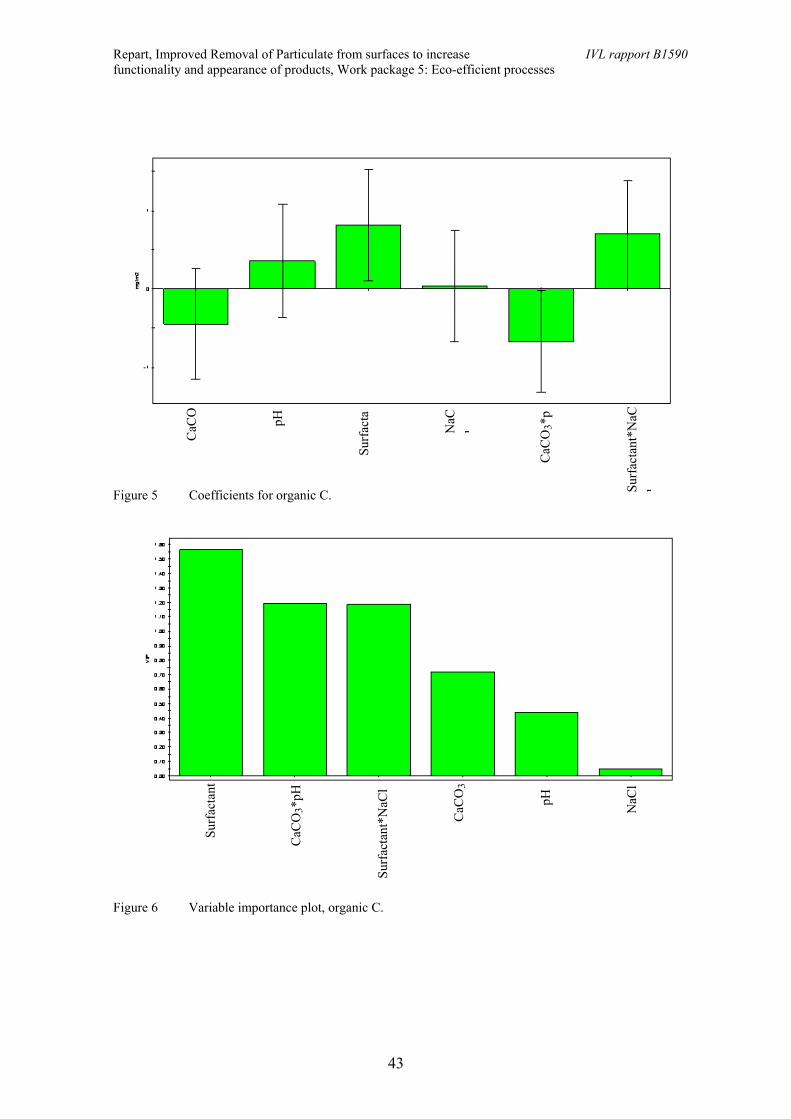
Figure 5 Coefficients for organic C.
Figure 6 Variable importance plot, organic C.
CaC
O
pH
Surf
acta
CaC
O3*
p
Surf
acta
nt*N
aCl
NaC
lC
aCO
3
pH
Surf
acta
nt
CaC
O3*
pH
Surf
acta
nt*N
aCl
NaC
l
Repart, Improved Removal of Particulate from surfaces to increase IVL rapport B1590functionality and appearance of products, Work package 5: Eco-efficient processes
44
Appendix 5. Membrane filtration of rinse water after degreasing- How to attain a successful process
1. Introduction
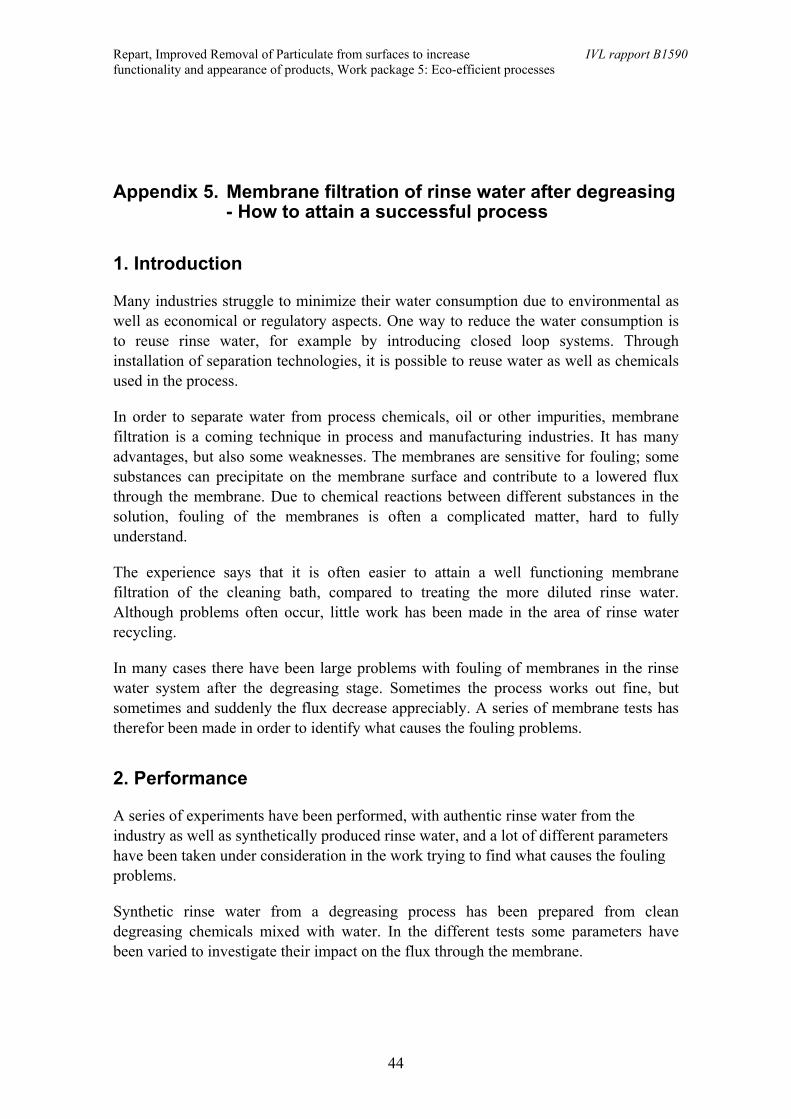
Many industries struggle to minimize their water consumption due to environmental aswell as economical or regulatory aspects. One way to reduce the water consumption isto reuse rinse water, for example by introducing closed loop systems. Throughinstallation of separation technologies, it is possible to reuse water as well as chemicalsused in the process.
In order to separate water from process chemicals, oil or other impurities, membranefiltration is a coming technique in process and manufacturing industries. It has manyadvantages, but also some weaknesses. The membranes are sensitive for fouling; somesubstances can precipitate on the membrane surface and contribute to a lowered fluxthrough the membrane. Due to chemical reactions between different substances in thesolution, fouling of the membranes is often a complicated matter, hard to fullyunderstand.
The experience says that it is often easier to attain a well functioning membranefiltration of the cleaning bath, compared to treating the more diluted rinse water.Although problems often occur, little work has been made in the area of rinse waterrecycling.
In many cases there have been large problems with fouling of membranes in the rinsewater system after the degreasing stage. Sometimes the process works out fine, butsometimes and suddenly the flux decrease appreciably. A series of membrane tests hastherefor been made in order to identify what causes the fouling problems.
2. Performance
A series of experiments have been performed, with authentic rinse water from theindustry as well as synthetically produced rinse water, and a lot of different parametershave been taken under consideration in the work trying to find what causes the foulingproblems.
Synthetic rinse water from a degreasing process has been prepared from cleandegreasing chemicals mixed with water. In the different tests some parameters havebeen varied to investigate their impact on the flux through the membrane.
Repart, Improved Removal of Particulate from surfaces to increase IVL rapport B1590functionality and appearance of products, Work package 5: Eco-efficient processes
45
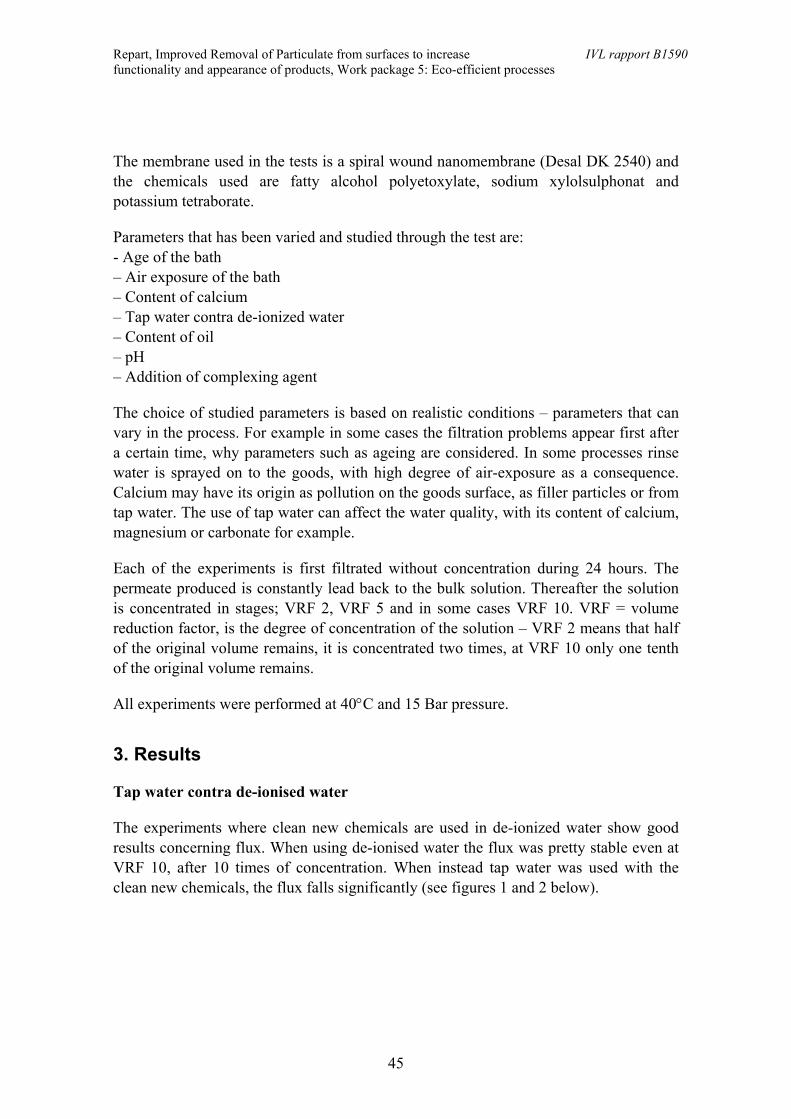
The membrane used in the tests is a spiral wound nanomembrane (Desal DK 2540) andthe chemicals used are fatty alcohol polyetoxylate, sodium xylolsulphonat andpotassium tetraborate.
Parameters that has been varied and studied through the test are:- Age of the bath– Air exposure of the bath– Content of calcium– Tap water contra de-ionized water– Content of oil– pH– Addition of complexing agent
The choice of studied parameters is based on realistic conditions – parameters that canvary in the process. For example in some cases the filtration problems appear first aftera certain time, why parameters such as ageing are considered. In some processes rinsewater is sprayed on to the goods, with high degree of air-exposure as a consequence.Calcium may have its origin as pollution on the goods surface, as filler particles or fromtap water. The use of tap water can affect the water quality, with its content of calcium,magnesium or carbonate for example.
Each of the experiments is first filtrated without concentration during 24 hours. Thepermeate produced is constantly lead back to the bulk solution. Thereafter the solutionis concentrated in stages; VRF 2, VRF 5 and in some cases VRF 10. VRF = volumereduction factor, is the degree of concentration of the solution – VRF 2 means that halfof the original volume remains, it is concentrated two times, at VRF 10 only one tenthof the original volume remains.
All experiments were performed at 40°C and 15 Bar pressure.
3. Results
Tap water contra de-ionised water
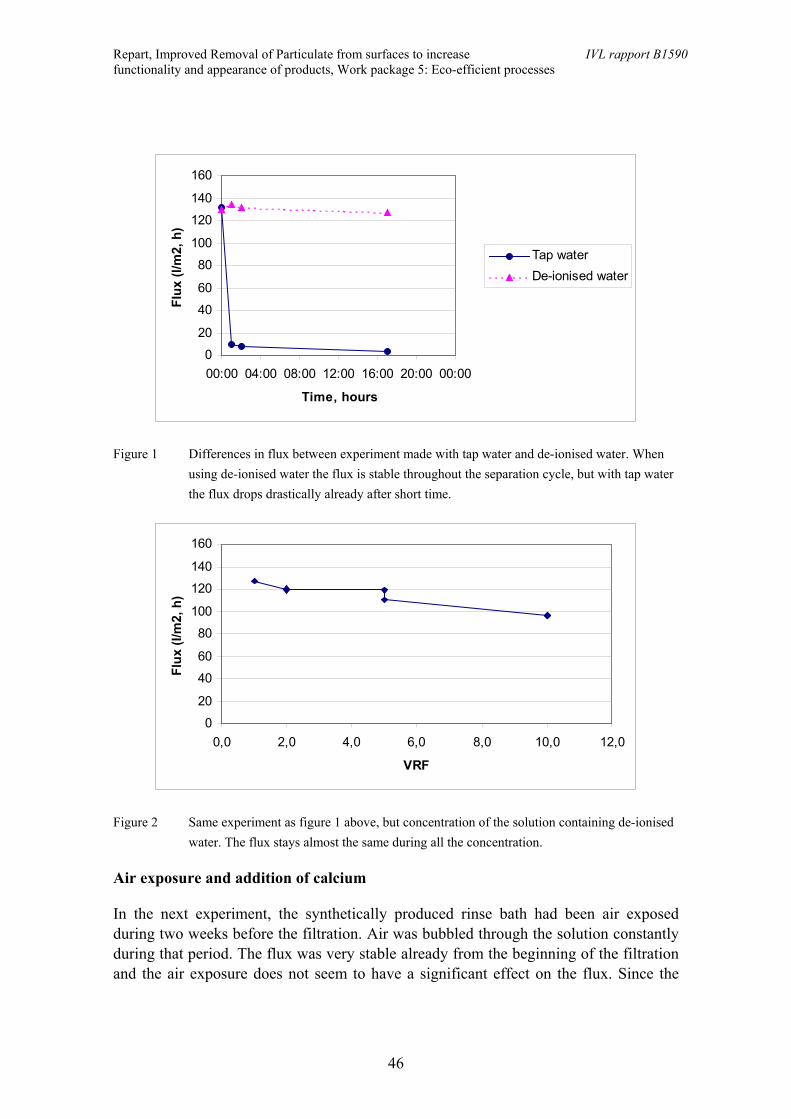
The experiments where clean new chemicals are used in de-ionized water show goodresults concerning flux. When using de-ionised water the flux was pretty stable even atVRF 10, after 10 times of concentration. When instead tap water was used with theclean new chemicals, the flux falls significantly (see figures 1 and 2 below).
Repart, Improved Removal of Particulate from surfaces to increase IVL rapport B1590functionality and appearance of products, Work package 5: Eco-efficient processes
46
0
20
40
60
80
100
120
140
160
00:00 04:00 08:00 12:00 16:00 20:00 00:00
Time, hours
Flux
(l/m
2, h
)
Tap waterDe-ionised water
Figure 1 Differences in flux between experiment made with tap water and de-ionised water. Whenusing de-ionised water the flux is stable throughout the separation cycle, but with tap waterthe flux drops drastically already after short time.
0
20
40
60
80
100
120
140
160
0,0 2,0 4,0 6,0 8,0 10,0 12,0
VRF
Flux
(l/m
2, h
)
Figure 2 Same experiment as figure 1 above, but concentration of the solution containing de-ionisedwater. The flux stays almost the same during all the concentration.
Air exposure and addition of calcium
In the next experiment, the synthetically produced rinse bath had been air exposedduring two weeks before the filtration. Air was bubbled through the solution constantlyduring that period. The flux was very stable already from the beginning of the filtrationand the air exposure does not seem to have a significant effect on the flux. Since the
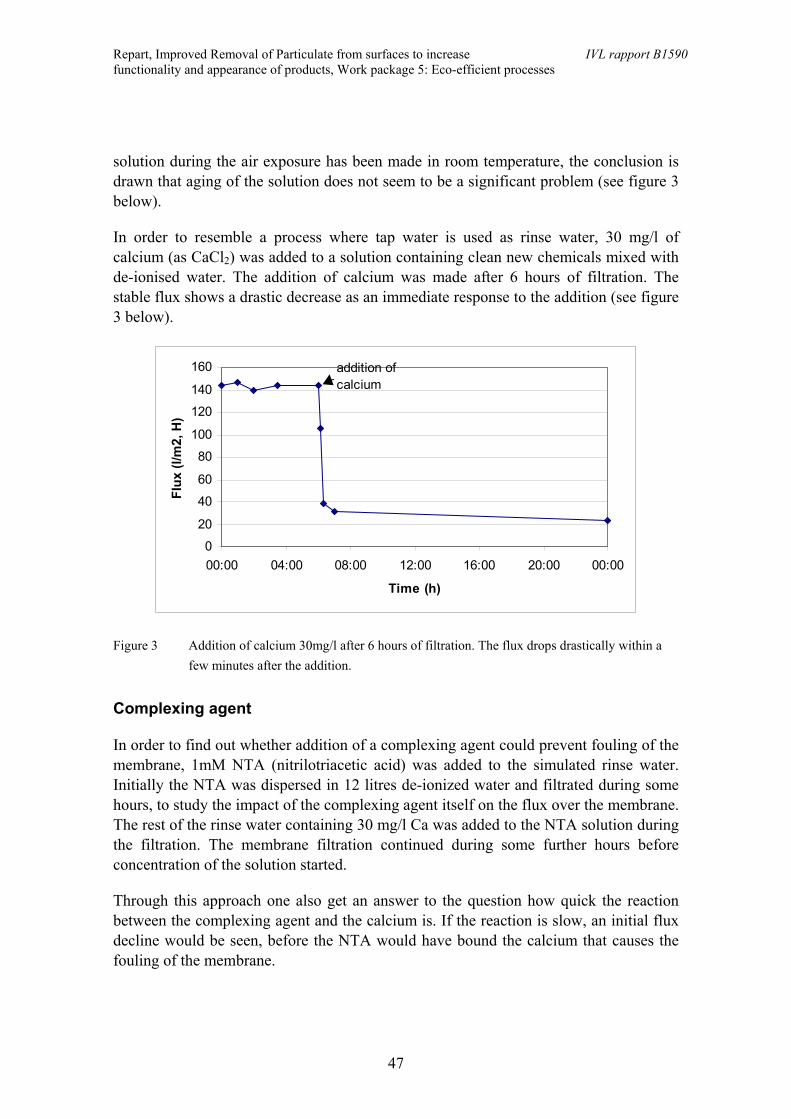
Repart, Improved Removal of Particulate from surfaces to increase IVL rapport B1590functionality and appearance of products, Work package 5: Eco-efficient processes
47
solution during the air exposure has been made in room temperature, the conclusion isdrawn that aging of the solution does not seem to be a significant problem (see figure 3below).
In order to resemble a process where tap water is used as rinse water, 30 mg/l ofcalcium (as CaCl2) was added to a solution containing clean new chemicals mixed withde-ionised water. The addition of calcium was made after 6 hours of filtration. Thestable flux shows a drastic decrease as an immediate response to the addition (see figure3 below).
0
20
40
60
80
100
120
140
160
00:00 04:00 08:00 12:00 16:00 20:00 00:00
Time (h)
Flux
(l/m
2, H
)
addition of calcium
Figure 3 Addition of calcium 30mg/l after 6 hours of filtration. The flux drops drastically within afew minutes after the addition.
Complexing agent
In order to find out whether addition of a complexing agent could prevent fouling of themembrane, 1mM NTA (nitrilotriacetic acid) was added to the simulated rinse water.Initially the NTA was dispersed in 12 litres de-ionized water and filtrated during somehours, to study the impact of the complexing agent itself on the flux over the membrane.The rest of the rinse water containing 30 mg/l Ca was added to the NTA solution duringthe filtration. The membrane filtration continued during some further hours beforeconcentration of the solution started.
Through this approach one also get an answer to the question how quick the reactionbetween the complexing agent and the calcium is. If the reaction is slow, an initial fluxdecline would be seen, before the NTA would have bound the calcium that causes thefouling of the membrane.
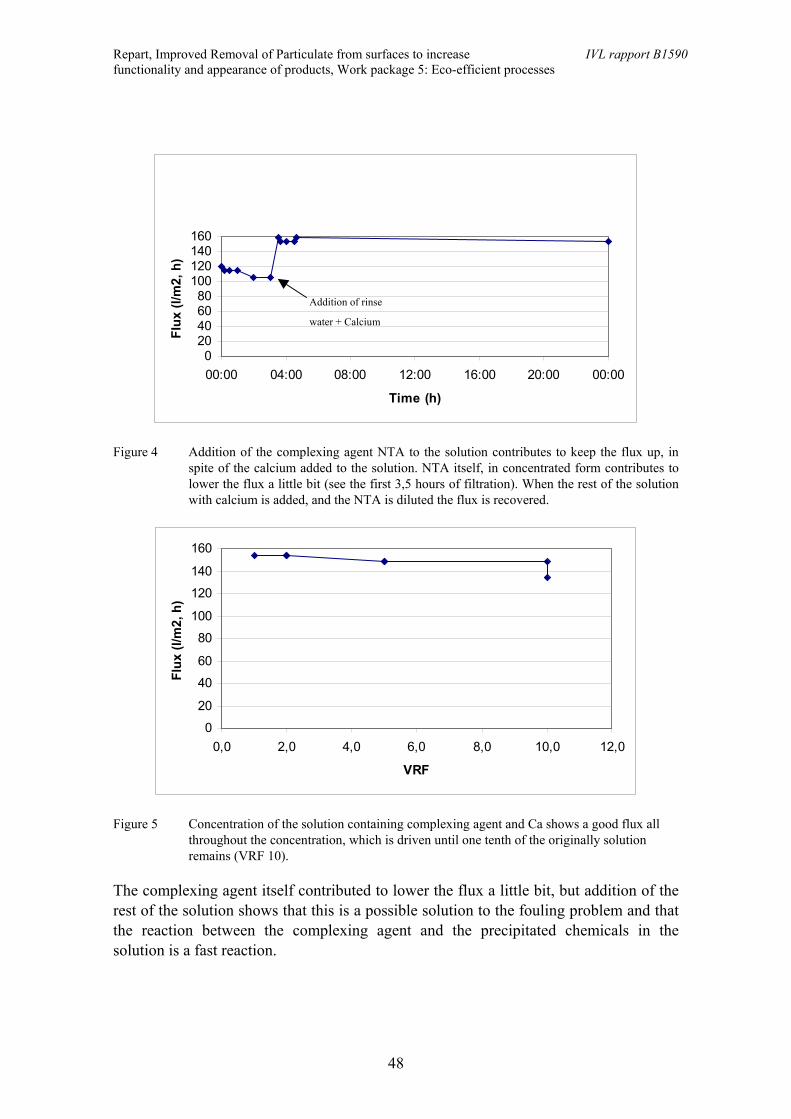
Repart, Improved Removal of Particulate from surfaces to increase IVL rapport B1590functionality and appearance of products, Work package 5: Eco-efficient processes
48
020406080
100120140160
00:00 04:00 08:00 12:00 16:00 20:00 00:00
Time (h)
Flux
(l/m
2, h
)
Figure 4 Addition of the complexing agent NTA to the solution contributes to keep the flux up, inspite of the calcium added to the solution. NTA itself, in concentrated form contributes tolower the flux a little bit (see the first 3,5 hours of filtration). When the rest of the solutionwith calcium is added, and the NTA is diluted the flux is recovered.
0
20
40
60
80
100
120
140
160
0,0 2,0 4,0 6,0 8,0 10,0 12,0
VRF
Flux
(l/m
2, h
)
Figure 5 Concentration of the solution containing complexing agent and Ca shows a good flux allthroughout the concentration, which is driven until one tenth of the originally solutionremains (VRF 10).
The complexing agent itself contributed to lower the flux a little bit, but addition of therest of the solution shows that this is a possible solution to the fouling problem and thatthe reaction between the complexing agent and the precipitated chemicals in thesolution is a fast reaction.
Addition of rinse
water + Calcium
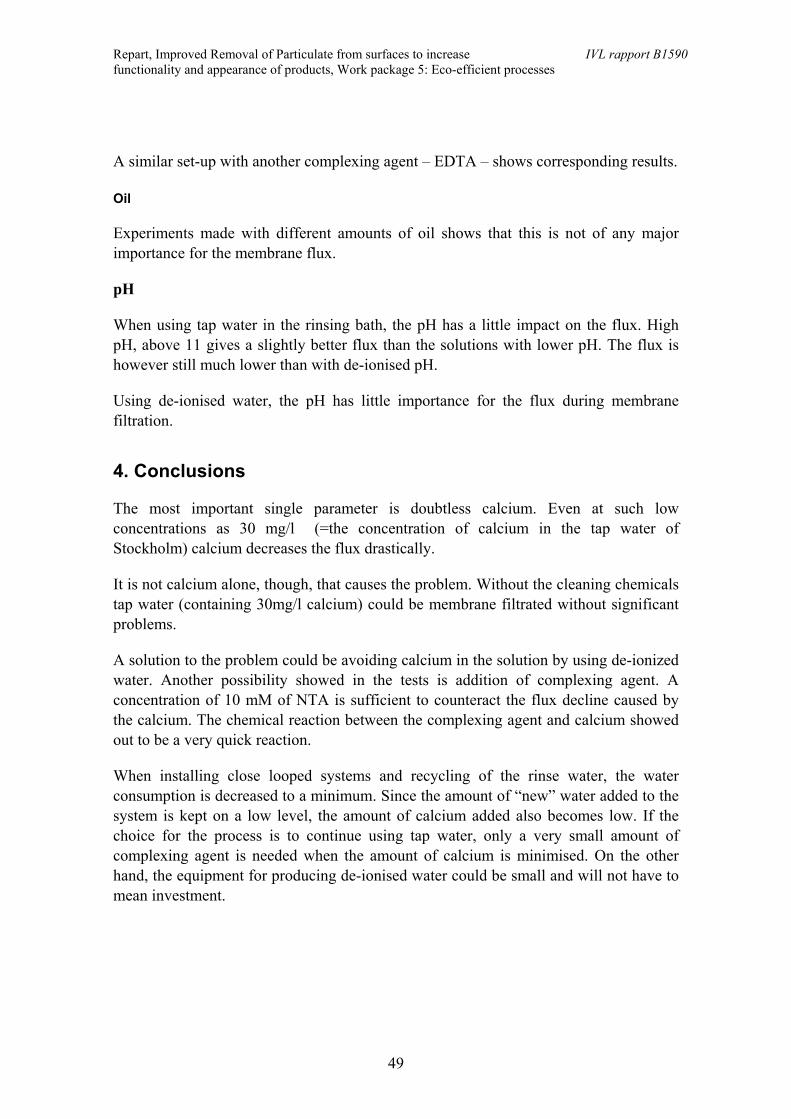
Repart, Improved Removal of Particulate from surfaces to increase IVL rapport B1590functionality and appearance of products, Work package 5: Eco-efficient processes
49
A similar set-up with another complexing agent – EDTA – shows corresponding results.
Oil
Experiments made with different amounts of oil shows that this is not of any majorimportance for the membrane flux.
pH
When using tap water in the rinsing bath, the pH has a little impact on the flux. HighpH, above 11 gives a slightly better flux than the solutions with lower pH. The flux ishowever still much lower than with de-ionised pH.
Using de-ionised water, the pH has little importance for the flux during membranefiltration.
4. Conclusions
The most important single parameter is doubtless calcium. Even at such lowconcentrations as 30 mg/l (=the concentration of calcium in the tap water ofStockholm) calcium decreases the flux drastically.
It is not calcium alone, though, that causes the problem. Without the cleaning chemicalstap water (containing 30mg/l calcium) could be membrane filtrated without significantproblems.
A solution to the problem could be avoiding calcium in the solution by using de-ionizedwater. Another possibility showed in the tests is addition of complexing agent. Aconcentration of 10 mM of NTA is sufficient to counteract the flux decline caused bythe calcium. The chemical reaction between the complexing agent and calcium showedout to be a very quick reaction.
When installing close looped systems and recycling of the rinse water, the waterconsumption is decreased to a minimum. Since the amount of “new” water added to thesystem is kept on a low level, the amount of calcium added also becomes low. If thechoice for the process is to continue using tap water, only a very small amount ofcomplexing agent is needed when the amount of calcium is minimised. On the otherhand, the equipment for producing de-ionised water could be small and will not have tomean investment.
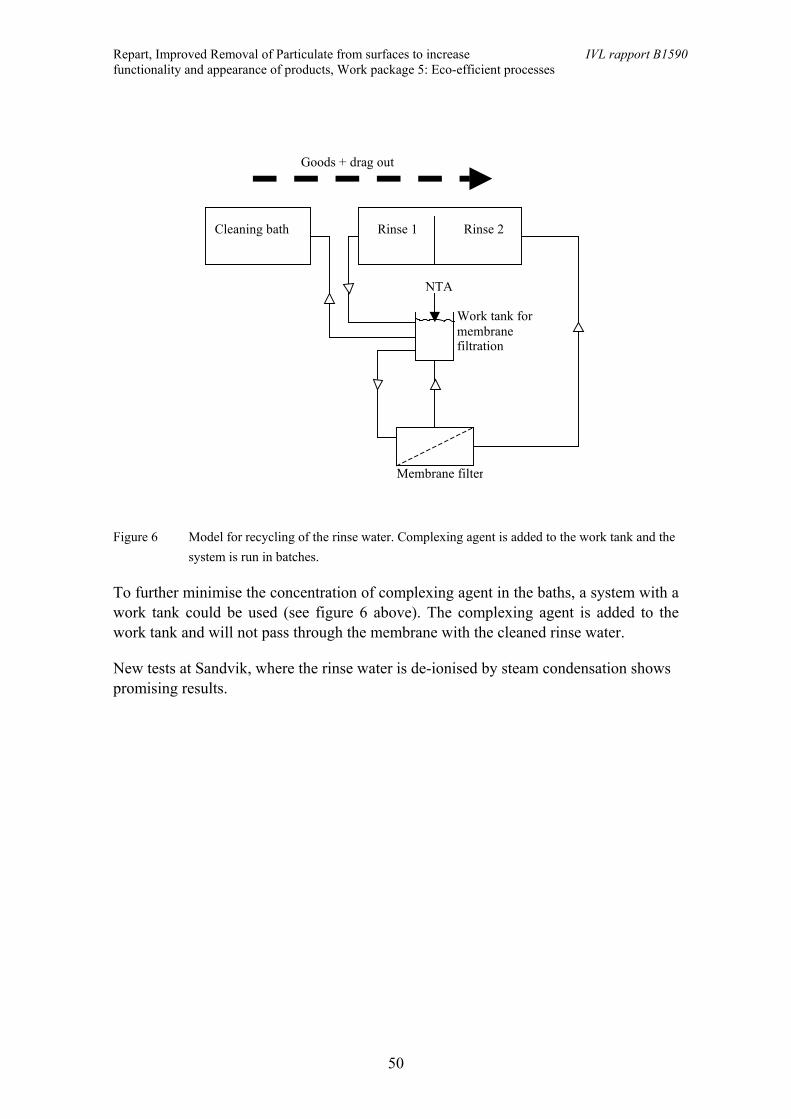
Repart, Improved Removal of Particulate from surfaces to increase IVL rapport B1590functionality and appearance of products, Work package 5: Eco-efficient processes
50
Cleaning bath Rinse 1 Rinse 2
Work tank formembranefiltration
Membrane filter
NTA
Goods + drag out
Figure 6 Model for recycling of the rinse water. Complexing agent is added to the work tank and thesystem is run in batches.
To further minimise the concentration of complexing agent in the baths, a system with awork tank could be used (see figure 6 above). The complexing agent is added to thework tank and will not pass through the membrane with the cleaned rinse water.
New tests at Sandvik, where the rinse water is de-ionised by steam condensation showspromising results.
IVL Svenska Miljöinstitutet AB IVL Swedish Environmental Research Institute Ltd
P.O. Box 210 60, SE-100 31 Stockholm P.O. Box 5302, SE-400 14 Göteborg Aneboda, SE-360 30 LammhultVisit: Hälsingegatan 43, Stockholm Visit: Aschebergssgatan 44 Aneboda, LammhultPhone: +46 8 598 563 00 Phone: +46 31 725 62 00 Phone: +46 0472 26 77 80Fax: +46 8 598 563 90 Fax: +46 31 725 62 90 Fax: +46 472 26 77 90
www.ivl.se