Embed Size (px)
Citation preview

CHAPTER 28
Echocardiographic Assessment of FunctionallySingle Ventricles after the Fontan Operation
Marc Gewillig1 and Luc Mertens2
1Pediatric Cardiology, University Hospitals Leuven, Leuven, Belgium2Cardiology, The Hospital for Sick Children, University of Toronto, Toronto, ON, Canada
Introduction
For the majority of patients with different types of function-ally univentricular hearts, the treatment goal is to achieve pallia-tion through the creation of a total cavopulmonary anastomoticconnection known as the Fontan operation [1]. This operationessentially bypasses the right heart by directing the systemicvenous return into the pulmonary circulation without passingthrough a ventricular chamber. The Fontan operation causes aunique type of circulation, which requires a specific echocardio-graphic approach. In the current chapter we will first review thespecific physiologic characteristics of a Fontan circulation fol-lowed by a discussion of the echocardiographic evaluation.
The Fontan circulation
A variety of cardiac malformations are characterized by the pres-ence of a hypoplastic ventricle that is too small to sustain oneof the circulations resulting in a functionally single ventricular(FSV) heart that has to support both circulations. During fetallife and immediately after birth the systemic and the pulmonarycirculations in a FSV are connected in parallel with one ventric-ular chamber pumping to both circulations usually by way ofthe patent ductus arteriosus (Figures 28.1a,b). In the pre-Fontanera, these patients were palliated by an aortopulmonary arteryshunt (e.g., Blalock–Taussig shunt) or pulmonary artery band-ing (both outflows unobstructed) which resulted in persistenceof the parallel circuit. This palliation caused persistent arte-rial desaturation and chronic volume loading of the FSV. Theseprocedures contributed to progressive ventricular dysfunction,leading to FSV failure, congestive heart failure and death withfew survivors beyond the fourth decade. In 1971, Francis Fontanreported on a new surgical approach [1], separating the systemic
and pulmonary circulations and redirecting the systemic venousblood directly to the pulmonary circulation. In the Fontan cir-culation, mixing of the circulations is avoided and the post-capillary energy and systemic venous pressure are used as thedriving forces to push the blood through the pulmonary circu-lation (Figure 28.1c) [2]. Advantages of a Fontan circuit includeseparation of both circulations with normalization of the arte-rial saturation, and abolishment of chronic ventricular volumeloading. The primary disadvantage is the resultant elevated sys-temic venous pressure and passive flow through the pulmonaryvascular bed which causes chronic systemic venous hyperten-sion, reduced cardiac output and a limited reserve during exer-cise (Figure 28.2).
By creating a cavopulmonary connection, a new portal sys-tem is created. In a portal system a capillary bed pools blood intoanother capillary bed through veins without passing through theheart. This is most typically seen in the normal gastrointestinalsystem where the superior mesenteric vein and splenic vein areconnected via the portal vein to the hepatic veins. The Fontanportal system pools the systemic venous blood in the pulmonarycirculation and limits the pulmonary venous return to the heartdue to different static resistances and dynamic impedances inthe circuit. The optimal Fontan circuit requires unobstructedFontan connections, good-sized branch pulmonary arterieswithout stenosis, low pulmonary vascular resistance, and unob-structed pulmonary venous connection to the atrium and lowatrial pressures. Atrial pressures are influenced by atrioven-tricular valve function and by FSV diastolic function. Goodsystolic FSV function is required to generate sufficient sys-temic output; chronic volume load (residual shunts, atrioven-tricular valve regurgitation, aortic regurgitation) and/or pres-sure load (outflow tract obstruction, residual coarctation of theaorta), even if mild can be very detrimental in patients with thisphysiology.
Echocardiography in Pediatric and Congenital Heart Disease: From Fetus to Adult, Second Edition. Edited by Wyman W. Lai, Luc L. Mertens, Meryl S. Cohen and Tal Geva.© 2016 John Wiley & Sons, Ltd. Published 2016 by John Wiley & Sons, Ltd.Companion website: www.lai-echo.com
541

542 Part V Miscellaneous Cardiovascular Lesions
(c)
(b)(a)
Figure 28.1 Schematic representation of (a) normal cardiovascular circulation, (b) shunted palliation, and (c) Fontan circulation. (a) The normalcirculation: the pulmonary circulation (P) is connected in series with the systemic circulation (S). The right ventricle (RV) is more compliant than the leftventricle keeping the right atrial (RA) pressure lower than the left atrial (LA) pressure. The RV functions at lower pressure than the LV which is related tolower pressure and resistance in the pulmonary artery (PA). (b) Parallel circulation in a univentricular heart. The systemic (S) and pulmonary (P) circuitsare connected in parallel with one dominant single ventricle (V) pumping blood into both circulations. There is complete admixture of systemic andpulmonary venous blood, causing arterial desaturation. (c) Fontan circuit. The systemic veins (CV) are connected to the pulmonary artery (PA), without asubpulmonary ventricle or systemic atrium: the lungs are hereby converted into a portal system which limits flow to the ventricle. In the absence of afenestration, there is no admixture of systemic and pulmonary venous blood, but the systemic venous pressures are generally elevated. Ao, aorta; CV, cavalveins; LA, left atrium; LV, left ventricle; PA, pulmonary artery; RV, right ventricle; V, single ventricle. Line thickness reflects output, color reflects oxygensaturation.
The functional single ventricle in a Fontancirculation
Ventricular dimensions and wall thicknessFigure 28.3 demonstrates the evolution of the FSV volume load-ing from fetal life until after completion of the Fontan circuit.During fetal life, the dominant ventricle is responsible for the
combined output of the systemic and pulmonary circulations.This causes prenatal eccentric remodeling resulting in enlargedchamber dimensions in the single ventricle at birth [3]. After theinitial neonatal palliation, (generally an aortopulmonary arteryshunt or a pulmonary artery band), the parallel circulationscause a persistent, chronic volume load. The bidirectional Glennshunt (a superior cavopulmonary anastomosis where only the

Chapter 28 Echocardiographic Assessment of Functionally Single Ventricles after the Fontan Operation 543
Exercise level
Card
iac O
utp
ut %
of nl baselin
e
Failing Fontan
Optimal Fontan
Normal
0
100
200
300
400
500
Figure 28.2 Cardiac output during exercise output: normal versus Fontancirculation. A normal subject with a biventricular circuit can increaseoutput five times compared to baseline (black line). In Fontan patientsoutput this is significantly impaired both at rest and during exercise. Inoptimal Fontan patients (green line) the output is mildly decreased at rest,with a moderately reduced capacity to increase cardiac output duringexercise. This limits exercise capacity in almost all Fontan patients. Infailing Fontan patients (red line), the output is significantly reduced at restwith very limited increase during exercise.
shunt shunt
Fontan
BFontan
C
Glenn
birth
100%
% V
olu
me loadin
g
time
A
Figure 28.3 Effect of different pre-Fontan palliative strategies on volumeloading. A: We assume a normal ventricle in a biventricular circulationfunctions on average at 100% of normal. Prior to birth the dominant singleventricle remodels and its size adjusts to the chronic volume loading. Thepatient with a UVH generally is born with an appropriate ventricular sizeadjusted for chronic volume load. Prior to the 1990s (B, red line), thevolume loading to the ventricle was augmented shortly after birth by ashunt procedure to ±150%. The patient slowly outgrows his shunt, andadapts his ventricle, thereby gradually reducing the volume overload to±100% for its size. A second shunt was created, augmenting the volumeoverload again to 150%. As this patient again outgrows his shunt, a Fontancircuit is made, acutely reducing the volume load to around 25% of thepreload it was exposed to prior to the procedure. This sudden preloadreduction was often poorly tolerated hemodynamically. This resulted inchanges in management strategy. After the 1990s (C, green line), a smallneonatal shunt was created for a short time (generally 6 months); thepatient slowly outgrows the shunt; the ventricle is progressively volumeunloaded in two separate steps: first, at the time of the bidirectional Glennshunt, and a second time, at the time of the Fontan operation. This stepwiseapproach is generally hemodynamically better tolerated.
superior vena cava is connected to the pulmonary artery andthe inferior vena cava remains connected to the right atrium)is generally performed at 4 to 8 months of age to address thisissue. After this procedure, the chronic volume load is reduced.A recent serial follow-up study using cardiac MRI in patientsscanned before the bidirectional Glenn and again before theFontan operation, demonstrated that the bidirectional Glennshunt resulted in a reduction of indexed ventricular volume withan increase in ejection fraction (i.e., reverse remodeling) [4].Quantitative measurements by cardiac MRI have also demon-strated that flow through aortopulmonary collaterals contributessignificantly to pulmonary blood flow and cardiac output afterthe bidirectional Glenn shunt [5]: up to one third of the car-diac output and up to 40% of the pulmonary blood flow comesfrom collateral flow. A higher burden of collateral flow adverselyinfluences clinical outcomes immediately after the Fontan oper-ation [5,6]. Despite the presence of collaterals, the FSV is vol-ume unloaded after the Fontan operation due to a reduction inpulmonary venous return (with a reduced preload reserve beingone of the characteristic features of the Fontan circulation). Afterthe Fontan operation, further reverse remodeling occurs butthe FSV is characterized by a detrimental decrease in ventric-ular dilation with persistence of an abnormal wall thicknessand incomplete resolution of hypertrophy (eccentric remodel-ing), often termed increased mass-to-volume ratio [7]. Concen-tric hypertrophy may also develop in the FSV in response toincreased afterload, defined as ventricular wall stress. Studieshave shown that increased afterload (i.e., outflow tract obstruc-tion, residual coarctation of the aorta or systemic hypertension)may persist after the Fontan operation [8,9]. Residual ventricularhypertrophy may contribute to diastolic dysfunction and even-tually to failure of the Fontan circulation.
Effect of loading changes on parameters ofsystolic functionThe most commonly used parameter to assess global pumpfunction is ejection fraction. This parameter is sensitive tochanges in preload and afterload. Recent serial data obtainedwith either MRI or echocardiography has demonstrated adecrease in ventricular volumes and ejection fraction imme-diately after the bidirectional Glenn shunt [4,10]. During theremodeling process a compensatory decrease in end-systolicvolumes may result in an increase in ejection fraction justprior to the Fontan procedure [4]. Despite these findings, ejec-tion fraction is generally preserved in the majority of patientsafter the Fontan operation suggesting that adaptation or fur-ther reverse remodeling occurs in the post-Fontan period [7].It also indicates that systolic dysfunction is uncommon in pedi-atric Fontan survivors. In adult patients, ventricular dysfunc-tion seems to be more common and is an important cause offailure of the Fontan circuit [11]. Systolic dysfunction may beintrinsic to the FSV or may be related to other comorbidities inadult life.

544 Part V Miscellaneous Cardiovascular Lesions
0
0
5
10
15
20
50
Ventr
icula
r E
DP
mm
Hg
Volume % of normal for BSA
100
A
C
D
B
150 200 250
Figure 28.4 Diastolic pressure–volume relationship during different stagesof palliation. A: the normal ventricle; B: shunted ventricle with chronicvolume loading resulting in enhanced compliance; C: Fontan ventricleearly after volume unloading; D: Fontan ventricle late after unloading;chronic volume unloading is thought to cause progressive stiffening of theventricle with decreased compliance.
Diastolic function of the single ventricleIn the Fontan circuit, low atrial pressure is required for a low-pressure gradient across the pulmonary vascular bed (transpul-monary gradient). Atrioventricular valve regurgitation and sin-gle ventricular diastolic function are important determinants ofatrial pressure. Diastolic function after the Fontan operation hasbeen poorly studied due to the absence of good methods forassessment of ventricular filling in patients with this physiol-ogy. Experimental data have shown that acute volume unload-ing of the ventricle results in less recoil and decreased suctionresulting in increased filling pressures (Figure 28.4) [12–15].Echocardiographic studies in Fontan patients have suggestedthat the volume reduction associated with the Fontan operationresults in early relaxation abnormalities and incoordinate wallmotion abnormalities especially affecting the isovolumic relax-ation period and early filling [13–15]. These diastolic changeshave typically been observed in FSV patients who underwenta Fontan operation without a previous bidirectional Glennshunt. In this era, the chronically volume-loaded ventricles wereacutely unloaded and the observed diastolic and systolic abnor-malities could be related to the ventricle being “too large” forthe volume immediately after the procedure. In patients afterthe Fontan procedure, chronic volume reduction seems to causea progressive decrease in ventricular compliance with a leftupward shift in the end-diastolic pressure–volume relationship[16]. Moreover, the thicker myocardium may become stiffer withage. The FSV may enter a vicious cycle whereby the volumeunloading results in adverse reverse remodeling, reduced com-pliance, reduced ventricular filling, and eventually declining car-diac output. A recent cohort study suggests that the majorityof pediatric Fontan patients have abnormal diastolic function
but the clinical and prognostic significance of these findingsis currently unknown [7]. The primary issue regarding assess-ment of diastolic function is that the conventional echocardio-graphic parameters (atrioventricular valve inflow, pulmonaryvenous flow patterns, and tissue Doppler velocities) are diffi-cult to interpret in Fontan patients. Progressive increase in ven-tricular stiffness and reduction in compliance may be one ofthe major mechanisms explaining Fontan failure with progres-sive age.
The pulmonary circulation limits cardiacoutput after the Fontan operation
A characteristic feature of the Fontan circuit is the lack ofpulsatile pulmonary blood flow through the pulmonary vas-cular bed. In the normal biventricular circulation pulmonaryblood flow is generally not a limiting factor for determiningcardiac output. In ischemic heart disease and cardiomyopathy,decreased cardiac pump function limits cardiac output. After theFontan procedure the pulmonary circulation limits the preloadreserve to the FSV and determines the cardiac output response[8,17]. This is comparable to obstructed inflow after Mustardrepair, primary pulmonary hypertension, constrictive pericardi-tis, and mitral stenosis.
Different factors influence the amount of pulmonary bloodflow and cardiac output after the Fontan operation. The firstlimiting factor is the energy loss in the surgical connections.The presence of unobstructed surgical connections between thecaval veins and the pulmonary arteries is a requirement for opti-mal Fontan function. Any degree of obstruction of the Fontanconnections will reduce cardiac output. The pulmonary arter-ies need to be good-sized and unobstructed. Pulmonary vascu-lar resistance (PVR) further determines pulmonary blood flow.Even a mild increase in PVR reduces pulmonary blood sup-ply and cardiac output [18]. Recent data have shown that pul-monary vasodilators like sildenafil positively influence cardiacoutput and exercise capacity in Fontan patients [19,20]. Pul-monary venous obstruction is another important factor deter-mining pulmonary blood flow. Some patients with FSV also haveanomalous pulmonary venous connection that requires surgicalintervention; they are at high risk for reobstruction. The extrac-ardiac Fontan conduit may also compress the adjacent rightpulmonary veins. Rarely, the left lower pulmonary vein maybecome compressed between the heart, the descending aortaand the spine.
In the Fontan circuit, pulmonary blood flow will increasewith inspiration and decrease with expiration [21]. Studying res-piratory variation in Fontan patients has provided interestingphysiologic information. Increased intrathoracic pressure dueto airway obstruction or positive pressure ventilation reducespulmonary blood flow and is detrimental for Fontan physiol-ogy [22].

Chapter 28 Echocardiographic Assessment of Functionally Single Ventricles after the Fontan Operation 545
1 2 3 4
5 6 7 8Figure 28.5 Different modifications of theFontan operation.
Fontan modifications
Since its original description, the Fontan circuit has undergoneseveral surgical modifications (Figure 28.5) [23,24]. The origi-nal Fontan operation included the hypoplastic right ventricle inthe circuit. This required a valved surgical conduit to connectthe hypoplastic ventricle with the pulmonary artery. These con-duits degenerated and conduit obstruction was a major prob-lem resulting in a high reoperation rate. This initial approachfrom Francis Fontan was quickly abandoned and was replacedby the atriopulmonary connection. This variation became themost commonly used modification as it was thought that includ-ing the right atrium in the connection would be beneficial forpulmonary hemodynamics due to the presence of the atrialkick. However, elevated atrial pressure caused progressive rightatrial dilation, reducing the energetic efficiency and becominga substrate for atrial arrhythmia. Experimental and computa-tional modeling was subsequently performed which showed thata total cavopulmonary connection (TCPC) would be hemody-namically more favorable and would result in less energy andpower loss in the conduit when compared to atriopulmonaryconnection [25,26]. In this circuit, the vena cavae are connecteddirectly to the right pulmonary artery. The superior vena cavais connected to the right pulmonary artery (bidirectional Glennshunt) and the inferior vena cava is connected through an intra-atrial (lateral tunnel) baffle or by an extracardiac conduit. Thebenefits of the lateral tunnel Fontan include use in small childrenand potential for growth. The possible drawback is that there issubstrate for atrial arrhythmia as a result of the suture line in theatrium and the exposure of atrial tissue to high pressure. To avoidthese problems, the extracardiac conduit was introduced. Thisprocedure consists of a tube graft between the inferior vena cava
and the pulmonary artery placed externally around the rightatrium. This circuit leaves the entire atrium at low pressure, hasminimal atrial suture lines, and can be performed without aorticcross-clamping. However, this tube graft has no growth poten-tial and therefore is typically offered to larger patients (generallybetween 2–3 years of life). It remains to be determined whetherthe extracardiac conduit will ameliorate the arrhythmia risk. Itis also more difficult to fenestrate (see later) this type of baffle.In most centers the extracardiac conduit is currently the pre-ferred technique though some are returning to the lateral tunnelmethod. When assessing a patient with a Fontan circulation, itis essential to know which type of connection has been made.
Current strategy towards a Fontancirculation
At birth, it is fatal to create a Fontan circulation because the pul-monary vascular resistance remains elevated for several weeksto months. Even when resistance falls, a staged approach toFontan completion is preferred, with the superior and inferiorcaval veins incorporated into the systemic venous chamber intwo separate stages. Thus, the body adapts progressively to thenew hemodynamic condition and eccentric hypertrophy, reduc-ing the overall operative morbidity and mortality. In the neona-tal period, clinical management aims at achieving unrestrictedflow to the aorta (if required: arch repair, Damus–Kaye–Stansel,Norwood procedure), appropriately limited flow to the lungs(if required: pulmonary artery band, aortopulmonary arteryshunt, stenting of the arterial duct), and unrestricted returnof blood to the ventricle (if required: balloon septostomy, pul-monary venous connection). Between 4 to 8 months of age, the

546 Part V Miscellaneous Cardiovascular Lesions
bidirectional Glenn shunt is performed. After the Glenn shunt,the patient remains mildly cyanotic because the desaturatedblood from the inferior vena cava still connects to the systemicventricle and the aorta. Between 1 to 5 years of age, the Fontancircuit is completed, incorporating the inferior vena cava intothe baffle.
Frequently a small fenestration or hole is created between thesystemic venous pathway and the pulmonary atrium, either rou-tinely or only in “high-risk” patients. The fenestration allows aresidual right-to-left shunt, thereby reducing systemic venouspressure and increasing preload of the systemic ventricle at theexpense of cyanosis. A fenestration has been shown to reduceoperative mortality and morbidity (e.g., pleural drainage). It canbe closed by a percutaneous intervention weeks or months afteradaptation of the body to the new hemodynamic condition, par-ticularly if marked cyanosis occurs with exercise.
Complications after the Fontan operation are common andrelate to the increased systemic venous pressure and chroniclow cardiac output. There may be clinical important early andlate mortality, mild to moderate exercise intolerance, ventric-ular dysfunction, rhythm and conduction abnormalities, hep-atomegaly with secondary liver dysfunction and potential fordevelopment of liver fibrosis or cirrhosis, lymphatic dysfunc-tion, protein-losing enteropathy, plastic bronchitis, thrombusformation, ascites, and peripheral edema [1,2].
Echocardiographic assessment of the Fontancirculation
Before scanning a patient who has undergone a Fontan opera-tion, it is essential to first review the underlying cardiac anatomyand previous surgical history. The ventricular morphology (left,right, or indeterminate) needs to be determined as this influ-ences measurements and interpretation of functional informa-tion. It is important to establish the type of Fontan connectionthat has been performed as well as any additional cardiac surgerybefore starting to scan. This includes information regarding archreconstruction, the presence of a Damus–Kaye–Stansel connec-tion (between the ascending aorta and the pulmonary trunk),previous valve surgery, type of previous shunt if performed(modified Blalock–Taussig shunt or other), interventions on thepulmonary arteries (patch, balloon dilatation, or stent implan-tation) and intervention on the pulmonary veins. Additionally,the echocardiographer should know the clinical indication forthe scan. When interpreting the images it helps to know thepatient’s clinical status and whether the study is being performedbecause of a concern or for routine follow-up. Some issues suchas residual cyanosis, ascites, protein-losing enteropathy, or othersigns of Fontan failure may require specific image acquisition.Access to previously performed imaging studies greatly facili-tates interpretation of findings and detection of changes. Com-parison between studies should be easy and should be routine inthe review process. To facilitate this comparison, digital storage
of clips and usage of standard scanning protocols is highly rec-ommended. As these patients have frequently undergone mul-tiple surgeries, acoustic windows may be challenging, especiallywith increasing age.
Goals of imaging1 Assessment of the Fontan pathway
a Assess for presence and size of fenestration and transfenes-tration gradient
b Assess for presence and size of thrombus in Fontan pathwayc Assess for obstruction of Fontan pathway to pulmonary
artery.2 Assessment of pulmonary venous chamber
a Assess for adequate atrial communicationb Assess for pulmonary venous obstruction.
3 Assessment of atrioventricular valve functiona Severity of atrioventricular valve regurgitation, if present.
4 Assessment of single ventricular functiona Systolic and diastolic performanceb Hypertrophy and/or dilation.
5 Assessment of outflow tracts, semilunar valve(s), ascendingaorta, and aortic archa Determine semilunar valve competencyb Assess for residual or recurrent arch obstruction.
6 Assessment of branch pulmonary arteriesa Determine narrowing, stenosis, competitive flow.
Assessment of Fontan connections, pulmonaryarteries, and pulmonary veinsTypically it is recommended to initiate the scan with subx-iphoid imaging. Coronal or subxiphoid sagittal views in par-ticular allow for visualization of the inferior vena cava and itsconnection to the Fontan baffle. Color flow imaging and pulsed-wave (PW) Doppler tracings in this view are used to assess forobstruction (Figure 28.6; Videos 28.1 and 28.2). The inferiorvena cava and hepatic veins are typically dilated and sponta-neous contrast is often noted. Flow velocities should be low (gen-erally <20–30 cm/s). For PW Doppler assessment, the sweepspeed should be reduced in order to record flow throughoutthe respiratory cycle. Normally a low-velocity continuous sys-tolic and diastolic flow pattern is detected (Figure 28.7). Usu-ally, the flow increases with inspiration and decreases duringexpiration. The presence of respiratory variation suggests thatintrathoracic pressure changes are well transmitted in the Fontanconduit, a sign that the Fontan connections are unobstructed.Absence of respiratory variation or the presence of reverse flowin the cardiac cycle is abnormal. Retrograde flow during systolemay be seen in the setting of atrioventricular valve regurgita-tion or due to the presence of significant competitive collateralflow. Flow reversal during diastole may be present in the fail-ing Fontan or in the presence of atrial arrhythmia (increasedpressure in the Fontan circuit). Lack of respiratory variationshould raise suspicion of conduit obstruction. In the intra-atrialtunnel or an extracardiac conduit, the connection between the

Chapter 28 Echocardiographic Assessment of Functionally Single Ventricles after the Fontan Operation 547
Figure 28.6 The connection between theinferior vena cava (IVC) and the extracardiacconduit (ECC). The connection between theinferior vena cava and the extracardiacconduit is demonstrated from a subxiphoidview. The IVC is dilated. The IVC–ECCconnection is widely patent as seen bytwo-dimensional imaging (left panel) withlaminar flow (right panel). The arrow pointsto a device that was used to close afenestration between the ECC and the atrium.
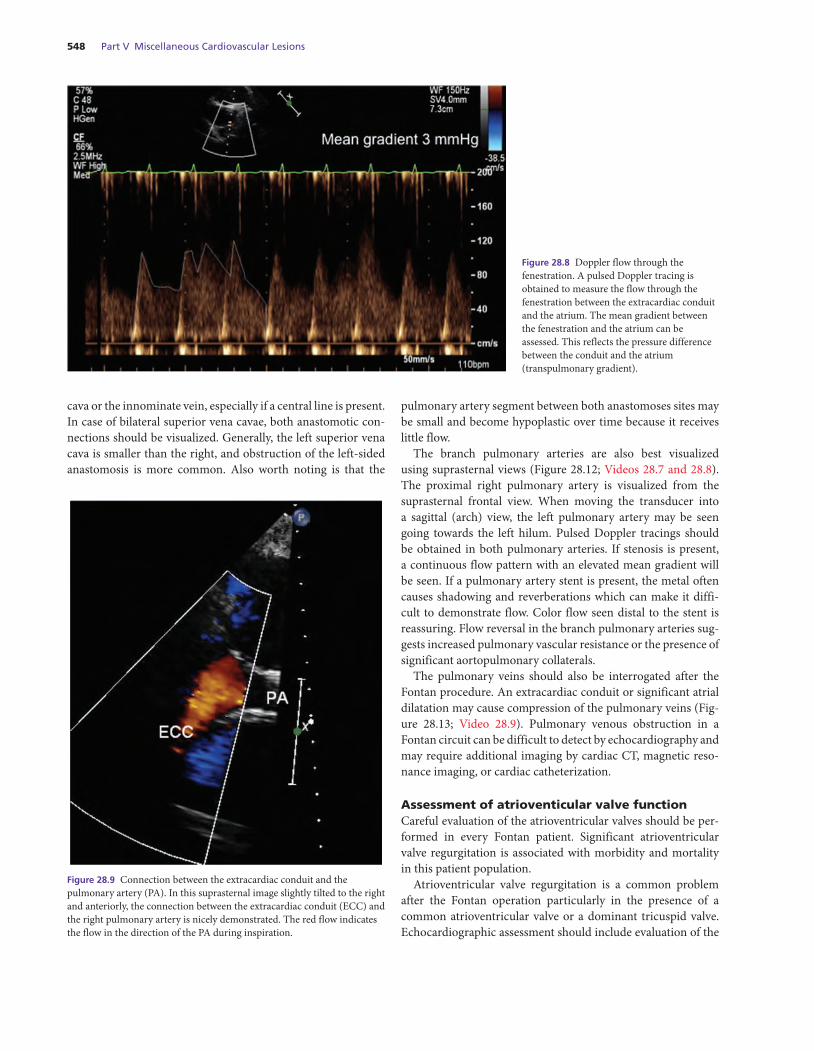
inferior vena cava may be visualized well using a subxiphoidlong- and short-axis sweep. Subxiphoid, apical and paraster-nal views should be combined to assess the Fontan baffle. Thisassessment includes looking for tunnel dilation, the presence ofclots and residual fenestration or baffle leaks (Video 28.3). If afenestration is present, a PW Doppler tracing of the fenestra-tion flow should be acquired (Figure 28.8). An estimate of thepressure gradient between the systemic and pulmonary venouschambers can be determined by obtaining the mean gradientacross the fenestration (transpulmonary gradient). If the fenes-tration has been closed with a device, the position of the deviceshould be evaluated as well as the presence of a residual shunt.
The superior connection between the tunnel/conduit and thepulmonary artery is often more difficult to image. The apicaland parasternal long-axis views but particularly the supraster-nal view are helpful in visualizing this region (Figure 28.9;Video 28.4). In the atriopulmonary Fontan, the connectionis variable depending on the anastomosis. Typically, the atri-opulmonary connection results in progressive, marked atrialdilatation with low flow velocities, spontaneous contrast andpotential for thrombus formation. Other types of connectionsinvolving valved conduits should be carefully inspected for valve
dysfunction (especially stenosis) (Figure 28.10; Video 28.5) andthrombus. Color flow using low Nyquist settings should be usedto visualize the surgical anastomosis sites of the Fontan connec-tions. In the case of obstruction, the flow pattern in the bafflebecomes continuous throughout the respiratory cycle as the gra-dient can persist during expiration. If TTE is insufficient, trans-esophageal echocardiography (TEE) may provide better imag-ing of the conduit, tunnel or atrium. Studies have demonstratedthat thrombus that is present on TEE may not be visualizedon TTE.
In patients with a lateral tunnel or extracardiac type Fontanconnection, it is also important to evaluate the connectionbetween the superior vena cava and the right pulmonary artery(Glenn anastomosis; Figure 28.11; Video 28.6). This can onlybe visualized from the suprasternal frontal view. In this view,the flow into the branch pulmonary arteries may be imagedalthough in older patients adequate images are challenging. Theflow pattern in the superior vena cava resembles those in theinferior vena cava with increased flow with inspiration anddecreased flow with expiration. If flow acceleration is noted atthe anastomosis site, a PW Doppler tracing and mean gradientcan be calculated. Thrombus may be present in the superior vena
Figure 28.7 Venous flow pattern in thehepatic veins. Flow in the hepaticvein–inferior vena cava (IVC) junction. In thispatient some systolic flow reversal can benoted which is related to a moderate to severedegree of tricuspid regurgitation.
548 Part V Miscellaneous Cardiovascular Lesions
Figure 28.8 Doppler flow through thefenestration. A pulsed Doppler tracing isobtained to measure the flow through thefenestration between the extracardiac conduitand the atrium. The mean gradient betweenthe fenestration and the atrium can beassessed. This reflects the pressure differencebetween the conduit and the atrium(transpulmonary gradient).
cava or the innominate vein, especially if a central line is present.In case of bilateral superior vena cavae, both anastomotic con-nections should be visualized. Generally, the left superior venacava is smaller than the right, and obstruction of the left-sidedanastomosis is more common. Also worth noting is that the
Figure 28.9 Connection between the extracardiac conduit and thepulmonary artery (PA). In this suprasternal image slightly tilted to the rightand anteriorly, the connection between the extracardiac conduit (ECC) andthe right pulmonary artery is nicely demonstrated. The red flow indicatesthe flow in the direction of the PA during inspiration.
pulmonary artery segment between both anastomoses sites maybe small and become hypoplastic over time because it receiveslittle flow.
The branch pulmonary arteries are also best visualizedusing suprasternal views (Figure 28.12; Videos 28.7 and 28.8).The proximal right pulmonary artery is visualized from thesuprasternal frontal view. When moving the transducer intoa sagittal (arch) view, the left pulmonary artery may be seengoing towards the left hilum. Pulsed Doppler tracings shouldbe obtained in both pulmonary arteries. If stenosis is present,a continuous flow pattern with an elevated mean gradient willbe seen. If a pulmonary artery stent is present, the metal oftencauses shadowing and reverberations which can make it diffi-cult to demonstrate flow. Color flow seen distal to the stent isreassuring. Flow reversal in the branch pulmonary arteries sug-gests increased pulmonary vascular resistance or the presence ofsignificant aortopulmonary collaterals.
The pulmonary veins should also be interrogated after theFontan procedure. An extracardiac conduit or significant atrialdilatation may cause compression of the pulmonary veins (Fig-ure 28.13; Video 28.9). Pulmonary venous obstruction in aFontan circuit can be difficult to detect by echocardiography andmay require additional imaging by cardiac CT, magnetic reso-nance imaging, or cardiac catheterization.
Assessment of atrioventicular valve functionCareful evaluation of the atrioventricular valves should be per-formed in every Fontan patient. Significant atrioventricularvalve regurgitation is associated with morbidity and mortalityin this patient population.
Atrioventricular valve regurgitation is a common problemafter the Fontan operation particularly in the presence of acommon atrioventricular valve or a dominant tricuspid valve.Echocardiographic assessment should include evaluation of the

Chapter 28 Echocardiographic Assessment of Functionally Single Ventricles after the Fontan Operation 549
Figure 28.10 Stenosis on a conduit betweenthe right atrium and a hypoplastic RV in apatient with tricuspid atresia who underwent avalved conduit insertion between the rightatrium (RA) and the hypoplastic rightventricle. This is a right parasternal view. Theconduit is located just below the sternum andcan be very difficult to image. The Dopplertracing allows to quantify the degree ofstenosis (mean gradient 5–6 mmHg). Alsonotice that there is regurgitation duringsystole. Source: Courtesy of Dr. F. Meijboom.
severity of atrioventricular valve regurgitation as well as iden-tification of the mechanism (Figure 28.14; Videos 28.10 and28.11). Evaluation of the severity of regurgitation is largely basedon qualitative assessment using color flow. Different imagingplanes should be used for assessing the size of the regurgi-tant jet in three dimensions. The jet width at the level of theleaflets generally is a good indicator of the severity of the regur-gitation. Jet width assessment becomes more challenging when
multiple jets are present. A combination of jet width, jet areaand jet length into the atrium generally allows for subjectiveassessment as mild, moderate or severe. If more than mild, iden-tifying the mechanism of regurgitation becomes important. Acommon mechanism for regurgitation is valve dysplasia withresultant valve leaflet irregularities at the zone of apposition andleaflet thickening [27]. Describing the mechanisms of regurgi-tation requires scanning the valve in multiple planes. Recent
Figure 28.11 Anastomosis between thesuperior vena cava (SVC) and the rightpulmonary artery (RPA). Suprasternal notchview demonstrating the connection betweenthe SVC and the RPA. The connection iswidely patent with laminar continuous flowincreasing with inspiration (Insp).

550 Part V Miscellaneous Cardiovascular Lesions
(a) (b)
(c) (d)
Figure 28.12 Imaging the pulmonary arteries.The suprasternal views are the best views toimage the pulmonary arteries. The leftpulmonary artery can be seen below the aortawhen tilting the probe leftwards (a). ColorDoppler is very useful for identifying thepulmonary branches (b). The right pulmonaryartery (RPA) can be viewed from thesuprasternal notch but by placing the probemore rightward. Figure (c) shows the superiorvena cava (SVC) to RPA connection, while(d) shows the more distal RPA.
studies have suggested that 3D echocardiography may provideadditional information on the atrioventricular valve in FSV [28].Further improvements in spatial and temporal resolution of thistechnique will allow better defining of leaflet abnormalities anda more detailed description of the subvalvar apparatus.
After valve repair, careful follow-up of the surgical result isrequired. In case of prosthetic valve insertion, evaluation ofprosthetic valve function is essential. Perivalvular leaks can bepresent and should be distinguished from regurgitation relatedto deficient prosthetic valve function. The low flow profilethrough the prosthetic valve makes it theoretically more proneto valve thrombosis. After valve repair, close monitoring of sin-gle ventricular function is required. The long-term outcome ofpatients undergoing atrioventricular valve repair in the contextof single ventricle palliation is worse compared to case-matchedpatients not requiring valve surgery [29].
Atrioventricular valve stenosis is rare but can be present afteratrioventricular valve repair or after prosthetic valve replace-ment. Inflow through the valve(s) should be assessed usingcolor flow and PW Doppler from the apical views. If a gra-dient is present, CW Doppler should be obtained as aliasingmay occur. The mean gradient should be calculated throughoutthe respiratory cycle. For prosthetic valves, a mean gradient iscommon and known for the specific valve types. If significant
regurgitation is present, the mean inflow gradient may be over-estimated due to increased flow.
Assessment of outflow tracts, ascending aorta,and aortic archIn FSV, the outflow tract from the dominant ventricle con-nects the ventricle to the aorta. Outflow tract obstruction, ifpresent, causes chronic pressure loading with secondary concen-tric hypertrophy, which is detrimental for the long-term preser-vation of ventricular function. It can further limit the outputfrom the FSV. The mechanism causing outflow tract obstruc-tion most commonly is subvalvar obstruction. The most typ-ical example is double-inlet left ventricle with transpositionof the great arteries where the VSD to the RV outlet cham-ber may become restrictive and thus, cause subaortic obstruc-tion. In cases where a patient is at risk for this obstruction, aDamus–Kaye–Stansel (DKS) operation connecting both outflowtracts to the aorta is performed. The outflow tract needs to beimaged in all Fontan patients, especially in those who did notundergo a DKS procedure to assure unobstructed flow. Differ-ent acoustic windows (subxiphoid, apical views, and paraster-nal long-axis views) can be used to image the outflow tracts.Color Doppler, PW and CW Doppler traces should be obtainedas well aligned with the outflow tract as possible. The peak and

Chapter 28 Echocardiographic Assessment of Functionally Single Ventricles after the Fontan Operation 551
Figure 28.13 Pulmonary venous compressionby dilated right atrium. This patient has anatriopulmonary connection with importantdilation of the right atrium (RA), causingcompression on the right upper pulmonaryvein (arrows) with turbulent flow in thepulmonary vein and a mean gradient of4–5 mmHg. Source: Courtesy of Dr. F.Meijboom.
mean gradients should be measured. If a gradient is detected,the mechanism causing the gradient should be defined. This caninclude subaortic obstruction due to a restrictive VSD, a mem-branous/fibrous ring, or valvar obstruction. In every patient theDKS connection between the ascending aorta and previous pul-monary trunk should be imaged. Obstruction at the connectionbetween the aorta and the pulmonary can compromise coro-nary artery blood flow and result in ischemia and ventriculardysfunction. Semilunar valve function should also be evaluated.When the pulmonary valve is assigned to the aortic position(neo-aorta) regurgitation is prevalent. A DKS connection candistort one or both semilunar valves and cause regurgitation.Fortunately, important semilunar valve regurgitation is unusualin FSV. There have been reported cases of valve replacement.
In patients who underwent aortic arch reconstruction orcoarctation surgery, assessment for residual arch obstruction isessential. Residual arch obstruction and coarctation of the aortacauses arterial hypertension and a significant increase in after-load to the FSV. Even a mild gradient can cause significant ven-tricular dysfunction. The suprasternal window is best to viewthe arch. Color Doppler and CW Doppler can be used to assessthe peak gradient across the arch and the descending aorta. In a
reconstructed arch, the proximal arch gradient should be incor-porated into the Bernoulli equation to achieve the most accuratearch gradient. In adults the arch can be difficult to image. A goodalternative for ruling out residual arch obstruction is obtaininga PW Doppler tracing of the abdominal aorta from the subx-iphoid views. The absence of significant diastolic anterogradeflow in the abdominal aorta rules out significant residual archobstruction.
Assessment of single ventricular functionOne of the most challenging parts of the echocardiogram inpatients after the Fontan procedure is the assessment of ventric-ular function. Application of standard methods of assessmentof the normal left ventricle to a FSV with variable ventricularmorphology is a significant challenge. The FSV operates withreduced preload reserve and the pulmonary circulation is animportant regulator of cardiac output. Assessment of ventricu-lar function requires assessment of both systolic and diastolicfunction.
Systolic performance: The most widespread technique used toassess systolic ventricular function in patients after the Fontanoperation, is subjective assessment or “eyeball technique.” Most
552 Part V Miscellaneous Cardiovascular Lesions
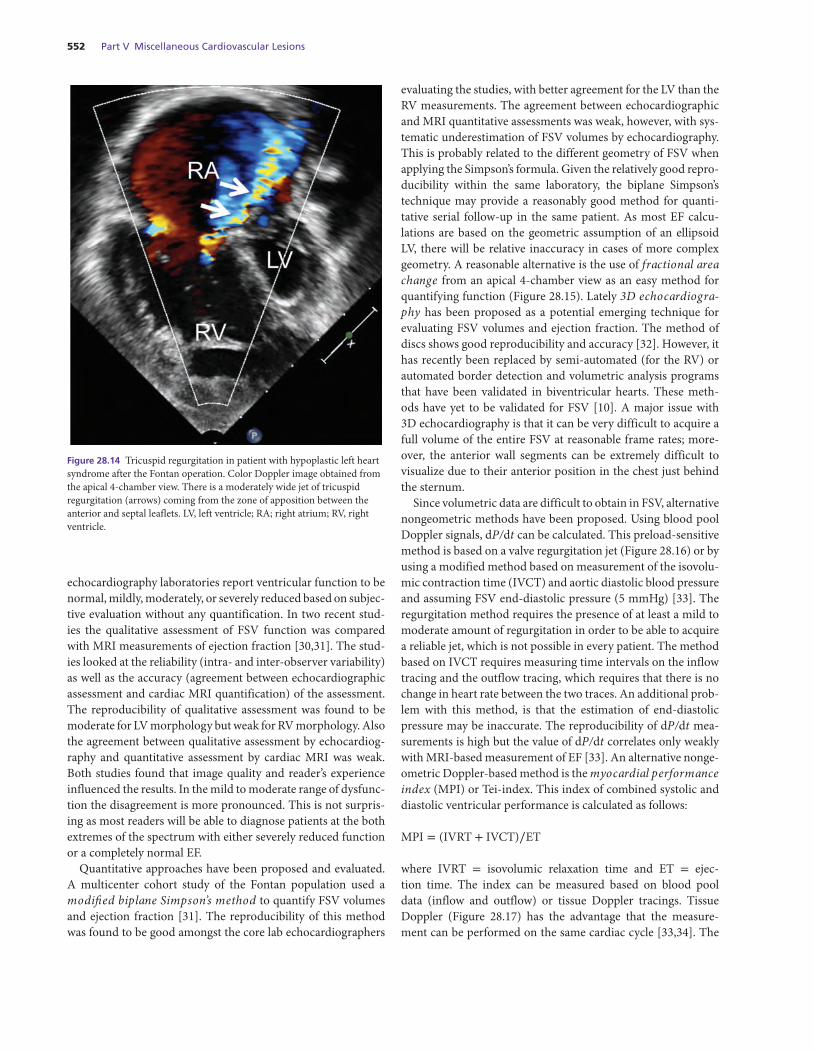
Figure 28.14 Tricuspid regurgitation in patient with hypoplastic left heartsyndrome after the Fontan operation. Color Doppler image obtained fromthe apical 4-chamber view. There is a moderately wide jet of tricuspidregurgitation (arrows) coming from the zone of apposition between theanterior and septal leaflets. LV, left ventricle; RA; right atrium; RV, rightventricle.
echocardiography laboratories report ventricular function to benormal, mildly, moderately, or severely reduced based on subjec-tive evaluation without any quantification. In two recent stud-ies the qualitative assessment of FSV function was comparedwith MRI measurements of ejection fraction [30,31]. The stud-ies looked at the reliability (intra- and inter-observer variability)as well as the accuracy (agreement between echocardiographicassessment and cardiac MRI quantification) of the assessment.The reproducibility of qualitative assessment was found to bemoderate for LV morphology but weak for RV morphology. Alsothe agreement between qualitative assessment by echocardiog-raphy and quantitative assessment by cardiac MRI was weak.Both studies found that image quality and reader’s experienceinfluenced the results. In the mild to moderate range of dysfunc-tion the disagreement is more pronounced. This is not surpris-ing as most readers will be able to diagnose patients at the bothextremes of the spectrum with either severely reduced functionor a completely normal EF.
Quantitative approaches have been proposed and evaluated.A multicenter cohort study of the Fontan population used amodified biplane Simpson’s method to quantify FSV volumesand ejection fraction [31]. The reproducibility of this methodwas found to be good amongst the core lab echocardiographers
evaluating the studies, with better agreement for the LV than theRV measurements. The agreement between echocardiographicand MRI quantitative assessments was weak, however, with sys-tematic underestimation of FSV volumes by echocardiography.This is probably related to the different geometry of FSV whenapplying the Simpson’s formula. Given the relatively good repro-ducibility within the same laboratory, the biplane Simpson’stechnique may provide a reasonably good method for quanti-tative serial follow-up in the same patient. As most EF calcu-lations are based on the geometric assumption of an ellipsoidLV, there will be relative inaccuracy in cases of more complexgeometry. A reasonable alternative is the use of fractional areachange from an apical 4-chamber view as an easy method forquantifying function (Figure 28.15). Lately 3D echocardiogra-phy has been proposed as a potential emerging technique forevaluating FSV volumes and ejection fraction. The method ofdiscs shows good reproducibility and accuracy [32]. However, ithas recently been replaced by semi-automated (for the RV) orautomated border detection and volumetric analysis programsthat have been validated in biventricular hearts. These meth-ods have yet to be validated for FSV [10]. A major issue with3D echocardiography is that it can be very difficult to acquire afull volume of the entire FSV at reasonable frame rates; more-over, the anterior wall segments can be extremely difficult tovisualize due to their anterior position in the chest just behindthe sternum.
Since volumetric data are difficult to obtain in FSV, alternativenongeometric methods have been proposed. Using blood poolDoppler signals, dP/dt can be calculated. This preload-sensitivemethod is based on a valve regurgitation jet (Figure 28.16) or byusing a modified method based on measurement of the isovolu-mic contraction time (IVCT) and aortic diastolic blood pressureand assuming FSV end-diastolic pressure (5 mmHg) [33]. Theregurgitation method requires the presence of at least a mild tomoderate amount of regurgitation in order to be able to acquirea reliable jet, which is not possible in every patient. The methodbased on IVCT requires measuring time intervals on the inflowtracing and the outflow tracing, which requires that there is nochange in heart rate between the two traces. An additional prob-lem with this method, is that the estimation of end-diastolicpressure may be inaccurate. The reproducibility of dP/dt mea-surements is high but the value of dP/dt correlates only weaklywith MRI-based measurement of EF [33]. An alternative nonge-ometric Doppler-based method is the myocardial performanceindex (MPI) or Tei-index. This index of combined systolic anddiastolic ventricular performance is calculated as follows:
MPI = (IVRT + IVCT)∕ET
where IVRT = isovolumic relaxation time and ET = ejec-tion time. The index can be measured based on blood pooldata (inflow and outflow) or tissue Doppler tracings. TissueDoppler (Figure 28.17) has the advantage that the measure-ment can be performed on the same cardiac cycle [33,34]. The

Chapter 28 Echocardiographic Assessment of Functionally Single Ventricles after the Fontan Operation 553
Figure 28.15 Quantification of singleventricular function. From an apical4-chamber view fractional area change (FAC)can be measured by tracing the end-diastolicand end-systolic area and calculating the FAC.In this patient FAC was 50%. Using theSimpson’s method volumes can be estimatedand ejection fraction can be calculated.Ejection fraction in this patient was 72%.
reproducibility of this method has been moderately good. InFontan patients, MPI has been reported to be prolonged but thedegree of prolongation does not correlate with EF as measuredby MRI. MPI is preload and afterload sensitive and this mayaffect the measure [35]. A potentially more attractive conceptis the ratio of systolic to diastolic duration [36]. This measurerequires an atrioventricular valve regurgitation jet and measur-ing the duration of the regurgitation jet as the systolic durationand the inflow duration as the diastolic duration. When ven-tricular dysfunction develops, systolic duration prolongs, short-ening diastolic inflow duration. In severe dysfunction the heartspends most of the time in systole with only a very short time
in diastole thus limiting diastolic filling. In normal children theS/D ratio varies between 0.4 and 1.6 and is largely determinedby heart rate [37]. In patients with hypoplastic left heart syn-drome the S/D ratio has been shown to be elevated and higherin patients with RV dysfunction compared to patients with nor-mal RV function [36]. When corrected for heart rate, however,the values were shown to be in the normal range [34]. All theserecent data illustrate that the use of nongeometric Doppler-derived timing parameters requires further investigation beforethey can be recommended in routine clinical practice.
Alternatively tissue Doppler velocities can be used. TissueDoppler traces are relatively easy to obtain and are generally
Figure 28.16 dP/dt as calculated from theatrioventricular valve regurgitation. In thispatient with single ventricular dysfunctiondP/dt was significantly reduced.

554 Part V Miscellaneous Cardiovascular Lesions
Figure 28.17 Measuring time intervals on tissue Doppler traces obtainedin the AV-valve annulus. (i) represents the isovolumic contraction periodwith the IVA peak, (ii) is the ejection time, (iii) is the isovolumic relaxationtime, and (iv) is the diastolic time or filling time. The myocardialperformance index can be calculated by (ICT + IRT)/ET. (Bellsham-RevellEHJ-CVI 2012)
highly reproducible. Similar to other nonvolumetric methods,peak systolic velocity (S′ wave) is dependent on ventricular size,preload, afterload, and is also influenced by atrioventricularvalve regurgitation. This can limit its use in clinical practice. Inthe Fontan population no correlation has be found between S′
and EF as measured by cardiac MRI [33]. S′ is a local parame-ter of myocardial function reflecting longitudinal contraction inthe basal part of the ventricle. Thus, regional myocardial dys-function may be present in other areas which can contributeto the lack of correlation. In serial follow-up studies, a reduc-tion in S′ suggests a reduction in ventricular longitudinal func-tion which may warrant closer follow-up or further investiga-tion. The load-dependency of tissue Doppler velocities may beovercome by measuring the acceleration of the tissue Dopplerspike present during the isovolumic contraction period [isovolu-mic acceleration (IVA)]. During this period, active force is devel-oped in the fibers resulting in a shape change in the ventricle justprior to ejection. IVA appears to be a relative load-independent
measurement of cardiac contractility. It is, however, highly heartrate dependent and difficult to measure.
Most recently, the introduction of speckle tracking technologyhas allowed the calculation of myocardial deformation or strainimaging in Fontan patients (Figure 28.18) [38]. This methodwas recently validated against myocardial strain measurementsas obtained by MRI-based myocardial tagging [39]. Similar toother methods of function, strain measurements are dependenton loading conditions. Increased preload will increase myocar-dial deformation; increased afterload will result in decreasedmyocardial deformation. Presently, there is limited informationon the clinical use of strain imaging in the Fontan populationand how it can be used in clinical practice. The main applica-tion for this technology may be its use in detecting intraventric-ular dyssynchrony in patients who develop ventricular dysfunc-tion in order to help to identify patients who might benefit fromresynchronization therapy (Video 28.12) [40,41].
Diastolic performanceThe development of diastolic dysfunction is probably one of themost important problems after Fontan palliation. Diastolic dys-function has been shown to be highly prevalent with 72% of thepatients having diastolic abnormalities in a large cohort study[7]. The study proposed a grading system for diastolic dysfunc-tion with normal diastolic function defined as E/A between 1and 2, DT ≥140 msec, and E/E′ ≤10. Impaired relaxation wasdefined on E/A ratio <1 only. Pseudonormalization was iden-tified when E/A was between 1 and 2 but DT <140 msec orE/E′
>10 or (FP <55 cm/sec). Restrictive physiology was basedon E/A >2. Of note, this grading system is extrapolated fromadult data and has never been validated against invasive pres-sure data in Fontan patients. Moreover, there are limitations ofthese modalities related to nonsinus or paced rhythm, heart rateand atrioventricular valve function.
In the aging Fontan population, progressive decrease in ven-tricular compliance and increased end-diastolic pressure is oftenobserved. This is difficult to detect using noninvasive methods.In the adult population with a biventricular circulation E/E′ has
(a) (b) (c)
Figure 28.18 Strain measurements in the single right ventricle using speckle-tracking echocardiography. From an apical 4-chamber view, longitudinalstrain can be estimated (a). From a parasternal short-axis view circumferential (b) and radial strain measurements (c) can be obtained. Peak orend-systolic strain values can be measured.

Chapter 28 Echocardiographic Assessment of Functionally Single Ventricles after the Fontan Operation 555
been proposed as a useful parameter for identifying patients withincreased filling pressures. In patients with FSV, the use of theE/E′ ratio is problematic because E velocities are influenced byatrioventricular valve size and E′ velocities are often preserved.Though diastolic dysfunction is a primary cause of Fontan fail-ure, thus far current echocardiography techniques are not capa-ble of identifying these patients based on any criteria. Identifi-cation of FSV patients with reduced compliance is one of theremaining challenges in congenital cardiology. Hopefully meth-ods will soon be developed which will provide information ontissue characteristics, such as MRI-based T1-mapping.
Conclusion
Echocardiographic imaging in patients after the Fontan oper-ation remains a significant challenge. It requires a full under-standing of the underlying complex morphology, the sur-gical techniques and the unique physiology of the cardiaccircuit. While echocardiography is the standard routine follow-up technique, patients with Fontan failure or suspected com-plications will likely require additional imaging by MRI, CT, orangiography.
Videos
To access the videos for this chapter, please go to www.lai-echo.com.
Video 28.1 The connection between the inferior vena cava (IVC)and the extracardiac conduit (ECC). The connection between theIVC and the conduit is nicely demonstrated from a subxiphoid viewby two-dimensional imaging.
Video 28.2 The connection between the inferior vena cava (IVC)and the extracardiac conduit (ECC). The color flow image showsincreased flow in the conduit with inspiration related to negativeintrathoracic pressures during inspiration with increased blood flowin the Fontan circuit.
Video 28.3 Fenestrated extracardiac Fontan. In this subxiphoidview, color Doppler imaging demonstrates the presence of a con-tinuous low-velocity jet through the fenestration.
Video 28.4 Connection between the extracardiac Fontan and thepulmonary artery. In this suprasternal image slightly tilted to theright and anteriorly, the connection between the extracardiac con-duit (ECC) and the right pulmonary artery are nicely demonstrated.The red flow indicates the flow in the direction of the pulmonaryartery during inspiration.
Video 28.5 Stenosis on a conduit between the right atrium andthe hypoplastic RV. This patient with tricuspid atresia underwenta valved conduit insertion between the significantly dilated rightatrium (RA) and the hypoplastic right ventricle which became
significantly stenotic and regurgitant. Source: Courtesy of Dr. F.Meijboom.
Video 28.6 Suprasternal notch view demonstrating the connectionbetween the superior vena cava (SVC) and right pulmonary artery(RPA). The connection is widely patent with laminar continuousflow increasing with inspiration.
Video 28.7 Imaging the left pulmonary artery (LPA). In a leftwardtilted suprasternal view the LPA can be imaged below the aorticarch. The laminar continuous antegrade low velocity flow can bedemonstrated in the proximal LPA.
Video 28.8 Imaging the right pulmonary artery (RPA) from a right-ward tilted suprasternal notch view. The continuous low-velocityflow in the proximal RPA can be seen.
Video 28.9 Pulmonary venous obstruction caused by atrial dilata-tion. Atriopulmonary connection with important dilation of theright atrium (RA), causing compression on the right upper pul-monary vein with turbulent flow in the pulmonary vein and a meangradient of 4–5 mmHg. Source: Courtesy of Dr. F. Meijboom.
Video 28.10 Tricuspid regurgitation in a patient with hypoplas-tic left heart syndrome after the Fontan operation. This clip showsa color Doppler image obtained from the apical 4-chamber view.There is a wide jet of tricuspid regurgitation coming from the zoneof apposition between the anterior and septal leaflets.
Video 28.11 Tricuspid regurgitation in a patient with hypoplas-tic left heart syndrome after the Fontan operation. This clip showsan apical 2-chamber view of the RV with an additional jet comingfrom between the anterior and inferior leaflets of the tricuspid valve.Overall the regurgitation is severe in this patient with significantright atrial dilatation.
Video 28.12 Dyssynchrony in a patient with a single ventricle.Speckle tracking was used to quantify longitudinal deformation.From the images and curves it can be observed that the left lateralwall is being stretched at the time the right lateral wall contracts.
Video 28.13 Dyssynchrony in a patient with a single ventricle. Thiscauses significant dysfunction of the single ventricle with the patientdeveloping symptoms of heart failure. Resynchronization therapyresulted in significant improvement in global ventricular functionand reverse remodeling.
References
1 Fontan F, Baudet E. Surgical repair of tricuspid atresia. Thorax1971;26:240–248.
2 Gewillig M. The Fontan circulation. Heart 2005;91:839–846.3 Brooks PA, Khoo NS, Mackie AS, Hornberger LK. Right ventricular
function in fetal hypoplastic left heart syndrome. J Am Soc Echocar-diogr 2012;25:1068–1074.
4 Bellsham-Revell HR, Tibby SM, Bell AJ, et al. Serial magnetic res-onance imaging in hypoplastic left heart syndrome gives valuable

556 Part V Miscellaneous Cardiovascular Lesions
insight into ventricular and vascular adaptation. J Am Coll Cardiol2013;61:561–570.
5 Grosse-Wortmann L, Al-Otay A, Yoo SJ. Aortopulmonary col-laterals after bidirectional cavopulmonary connection or Fontancompletion: quantification with MRI. Circ Cardiovasc Imaging2009;2:219–225.
6 Odenwald T, Quail MA, Giardini A, et al. Systemic to pulmonarycollateral blood flow influences early outcomes following the totalcavopulmonary connection. Heart 2012;98:934–940.
7 Anderson PA, Sleeper LA, Mahony L, et al. Contemporary outcomesafter the Fontan procedure: a Pediatric Heart Network multicenterstudy. J Am Coll Cardiol 2008;52:85–98.
8 Senzaki H, Masutani S, Ishido H, et al. Cardiac rest and reservefunction in patients with Fontan circulation. J Am Coll Cardiol2006;47:2528–2535.
9 Senzaki H, Masutani S, Kobayashi J, et al. Ventricular afterloadand ventricular work in Fontan circulation: comparison with nor-mal two-ventricle circulation and single-ventricle circulation withBlalock–Taussig shunts. Circulation 2002;105:2885–2892.
10 Kutty S, Graney BA, Khoo NS, et al. Serial assessment of rightventricular volume and function in surgically palliated hypoplasticleft heart syndrome using real-time transthoracic three-dimensionalechocardiography. J Am Soc Echocardiogr 2012;25:682–689.
11 Khairy P, Fernandes SM, Mayer JE, Jr., et al. Long-term survival,modes of death, and predictors of mortality in patients with Fontansurgery. Circulation 2008;117:85–92.
12 Gewillig M, Daenen W, Aubert A, Van der Hauwaert L. Abolishmentof chronic volume overload. Implications for diastolic function ofthe systemic ventricle immediately after Fontan repair. Circulation1992;86:II93–99.
13 Penny DJ, Redington AN. Diastolic ventricular function after theFontan operation. Am J Cardiol 1992;69:974–975.
14 Penny DJ, Rigby ML, Redington AN. Abnormal patterns of intra-ventricular flow and diastolic filling after the Fontan operation:evidence for incoordinate ventricular wall motion. Br Heart J1991;66:375–378.
15 Redington A, Penny D. Regional ventricular wall motion abnormal-ities in tricuspid atresia after the Fontan procedure: flawed method-ology may lead to a spurious finding of hypokinesia. J Am Coll Car-diol 1994;24:271.
16 Cheung YF, Penny DJ, Redington AN. Serial assessment ofleft ventricular diastolic function after Fontan procedure. Heart2000;83:420–424.
17 Schmitt B, Steendijk P, Ovroutski S, et al. Pulmonary vascular resis-tance, collateral flow, and ventricular function in patients with aFontan circulation at rest and during dobutamine stress. Circ Car-diovasc Imaging 2010;3:623–631.
18 Khambadkone S, Li J, de Leval MR, et al. Basal pulmonary vascu-lar resistance and nitric oxide responsiveness late after Fontan-typeoperation. Circulation 2003;107:3204–3208.
19 Giardini A, Balducci A, Specchia S, et al. Effect of sildenafil onhaemodynamic response to exercise and exercise capacity in Fontanpatients. Eur Heart J 2008;29:1681–1687.
20 Goldberg DJ, French B, Szwast AL, et al. Impact of sildenafilon echocardiographic indices of myocardial performance after theFontan operation. Pediatr Cardiol 2012;33:689–696.
21 Penny DJ, Redington AN. Doppler echocardiographic evaluation ofpulmonary blood flow after the Fontan operation: the role of thelungs. Br Heart J 1991;66:372–374.
22 Hsia TY, Khambadkone S, Redington AN, et al. Effects of respira-tion and gravity on infradiaphragmatic venous flow in normal andFontan patients. Circulation 2000;102:III148–53.
23 de Leval MR, Deanfield JE. Four decades of Fontan palliation. NatRev Cardiol 2010;7:520–527.
24 de Leval MR. Evolution of the Fontan-Kreutzer procedure. SeminThorac Cardiovasc Surg Pediatr Card Surg Annu 2010;13:91–95.
25 de Leval MR, Kilner P, Gewillig M, Bull C. Total cavopulmonaryconnection: a logical alternative to atriopulmonary connection forcomplex Fontan operations. Experimental studies and early clinicalexperience. J Thorac Cardiovasc Surg 1988;96:682–695.
26 Van Haesdonck JM, Mertens L, Sizaire R, et al. Comparison by com-puterized numeric modeling of energy losses in different Fontanconnections. Circulation 1995;92:II322–326.
27 Bharucha T, Honjo O, Seller N, et al. Mechanisms of tricuspid valveregurgitation in hypoplastic left heart syndrome: a case-matchedechocardiographic-surgical comparison study. Eur Heart J Cardio-vasc Imaging 2013;14:135–141.
28 Takahashi K, Inage A, Rebeyka IM, et al. Real-time 3-dimensionalechocardiography provides new insight into mechanisms of tricus-pid valve regurgitation in patients with hypoplastic left heart syn-drome. Circulation 2009;120:1091–1098.
29 Honjo O, Atlin CR, Mertens L, et al. Atrioventricular valve repair inpatients with functional single-ventricle physiology: impact of ven-tricular and valve function and morphology on survival and reinter-vention. J Thorac Cardiovasc Surg 2011;142:326–335 e2.
30 Bellsham-Revell HR, Simpson JM, Miller OI, Bell AJ. Subjec-tive evaluation of right ventricular systolic function in hypoplasticleft heart syndrome: how accurate is it? J Am Soc Echocardiogr2013;26:52–56.
31 Margossian R, Schwartz ML, Prakash A, et al. Comparison ofechocardiographic and cardiac magnetic resonance imaging mea-surements of functional single ventricular volumes, mass, and ejec-tion fraction (from the Pediatric Heart Network Fontan Cross-Sectional Study). Am J Cardiol 2009;104:419–428.
32 Soriano BD, Hoch M, Ithuralde A, et al. Matrix-array 3-dimensionalechocardiographic assessment of volumes, mass, and ejection frac-tion in young pediatric patients with a functional single ventricle:a comparison study with cardiac magnetic resonance. Circulation2008;117:1842–1848.
33 Rhodes J, Margossian R, Sleeper LA, et al. Non-geometric echocar-diographic indices of ventricular function in patients with a Fontancirculation. J Am Soc Echocardiogr 2011;24:1213–1219.
34 Bellsham-Revell HR, Tibby SM, Bell AJ, et al. Tissue Doppler timeintervals and derived indices in hypoplastic left heart syndrome. EurHeart J Cardiovasc Imaging 2012;13:400–407.
35 Cheung MM, Smallhorn JF, Redington AN, Vogel M. The effectsof changes in loading conditions and modulation of inotropicstate on the myocardial performance index: comparison withconductance catheter measurements. Eur Heart J 2004;25:2238–2242.
36 Friedberg MK, Silverman NH. The systolic to diastolic durationratio in children with hypoplastic left heart syndrome: a novelDoppler index of right ventricular function. J Am Soc Echocardiogr2007;20:749–755.
37 Sarnari R, Kamal RY, Friedberg MK, Silverman NH. Doppler assess-ment of the ratio of the systolic to diastolic duration in normal chil-dren: relation to heart rate, age and body surface area. J Am SocEchocardiogr 2009;22:928–932.

Chapter 28 Echocardiographic Assessment of Functionally Single Ventricles after the Fontan Operation 557
38 Friedberg MK, Mertens L. Deformation imaging in selected congen-ital heart disease: is it evolving to clinical use? J Am Soc Echocar-diogr 2012;25:919–931.
39 Singh GK, Cupps B, Pasque M, et al. Accuracy and reproducibil-ity of strain by speckle tracking in pediatric subjects with normalheart and single ventricular physiology: a two-dimensional speckle-tracking echocardiography and magnetic resonance imaging correl-ative study. J Am Soc Echocardiogr 2010;23:1143–1152.
40 Khoo NS, Smallhorn JF, Kaneko S, et al. Novel insights into RVadaptation and function in hypoplastic left heart syndrome betweenthe first 2 stages of surgical palliation. JACC Cardiovasc Imaging2011;4:128–137.
41 Friedberg MK, Silverman NH, Dubin AM, Rosenthal DN. Rightventricular mechanical dyssynchrony in children with hypoplas-tic left heart syndrome. J Am Soc Echocardiogr 2007;20:1073–1079.