Embed Size (px)
Citation preview
8/6/2019 Ece Lab Exp2
http://slidepdf.com/reader/full/ece-lab-exp2 1/13
COLLEGE OF ENGINEERING
Electronics Engineering Department
OSCILLOSCOPE Experiment no. 2
ECE 322N-1F; 1:30-4:30
Lanag, Rodney Jay E. Engr.Handig
20081126752 Professor
Date performed: July 07, 2010
Date Submitted: July 28, 2010
GRADE
8/6/2019 Ece Lab Exp2
http://slidepdf.com/reader/full/ece-lab-exp2 2/13
THEORETICAL DISCUSSION
A n oscilloscope (also known as a scope, CRO or, an O-scope) is a type of electronic test
instrument that allows observation of constantly varying signal voltages, usually as a two-dimensionalgraph of one or more electrical potential differences using the vertical or 'Y' axis, plotted as a function
of time, (horizontal or 'x' axis). A lthough an oscilloscope displays voltage on its vertical axis, any other
quantity that can be converted to a voltage can be displayed as well. In most instances, oscilloscopes
show events that repeat with either no change or change slowly.
Oscilloscopes are commonly used to observe the exact wave shape of an electrical signal. In
addition to the amplitude of the signal, an oscilloscope can show distortion, measure frequency, the
time between two events (such as pulse width or pulse rise time) and relative timing of two related
signals. Some oscilloscopes can analyze and display the frequency spectrum of a repetitive event.
These are called spectrum analyzers, and depending on the analyzer, can display spectra from audio
frequency well into the Gigahertz range.
Oscilloscopes are used in the sciences, medicine, engineering, and telecommunications
industry. General-purpose instruments are used for maintenance of electronic equipment and
laboratory work. Special-purpose oscilloscopes may be used for such purposes as analyzing an
automotive ignition system, or to display the waveform of the heartbeat as an electrocardiogram.
Originally all oscilloscopes used cathode ray tubes as their display element and linear amplifiers
for signal processing, (commonly referred to as CROs) however, modern oscilloscopes have LCD or
LED screens, fast analog-to-digital converters and digital signal processors. A lthough not as
commonplace, some oscilloscopes used storage CRTs to display single events for a limited time.
Oscilloscope peripheral modules for general purpose laptop or desktop personal computers use the
computer's display, allowing them to be used as test instruments.
8/6/2019 Ece Lab Exp2
http://slidepdf.com/reader/full/ece-lab-exp2 3/13
DISPLAY AND APPEARANCE
The basic oscilloscope is typically divided into four sections: the display, vertical controls,
horizontal controls and trigger controls. The display is usually a CRT or LCD panel which is laid out with
both horizontal and vertical reference lines referred to as the graticule. In addition to the screen, most
display sections are equipped with three basic controls, a focus knob, an intensity knob and a beam
finder button.
I.CALIBRATION
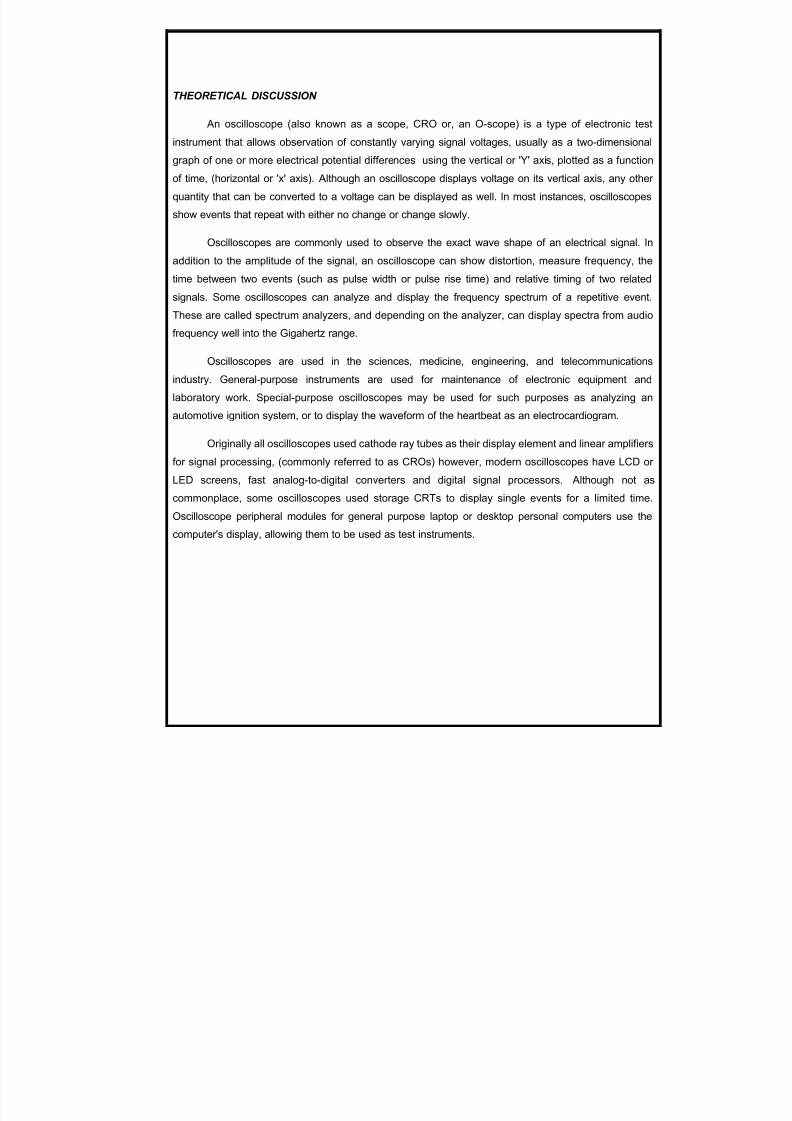
1. Oscilloscope Screen
Oscilloscopes have an x axis and a y axis. The x axis is horizontal and
represents time in seconds (s). The y axis is vertical and represents voltage in
volts (v).
2. First, set all of the buttons and switches to their normal positions. This means, all push button
switches should be in the out position, all slide switches in the up position, all rotating dials are
centered, and the TIME/DIV and VOLTS/DIV and the HOLD OFF are in the Calibrated (C A L) position.
3. Time-Div
Set the VOLTS/DIV to 1V/DIV.
4. Set the TIME/DIV control to 2s/DIV
5. Switch the power to ON. You should now see the trace moving across the screen.
6. Y-Position Control
Locate the Y-POS control. This will allow you to move the trace up or down the screen.
A djust the trace so that it runs horizontally across the center of the screen.
7. Now locate the INTENSITY and FOCUS controls. These will allow you to control how bright the trace
is and whether it is sharp or blurry.
8/6/2019 Ece Lab Exp2
http://slidepdf.com/reader/full/ece-lab-exp2 4/13
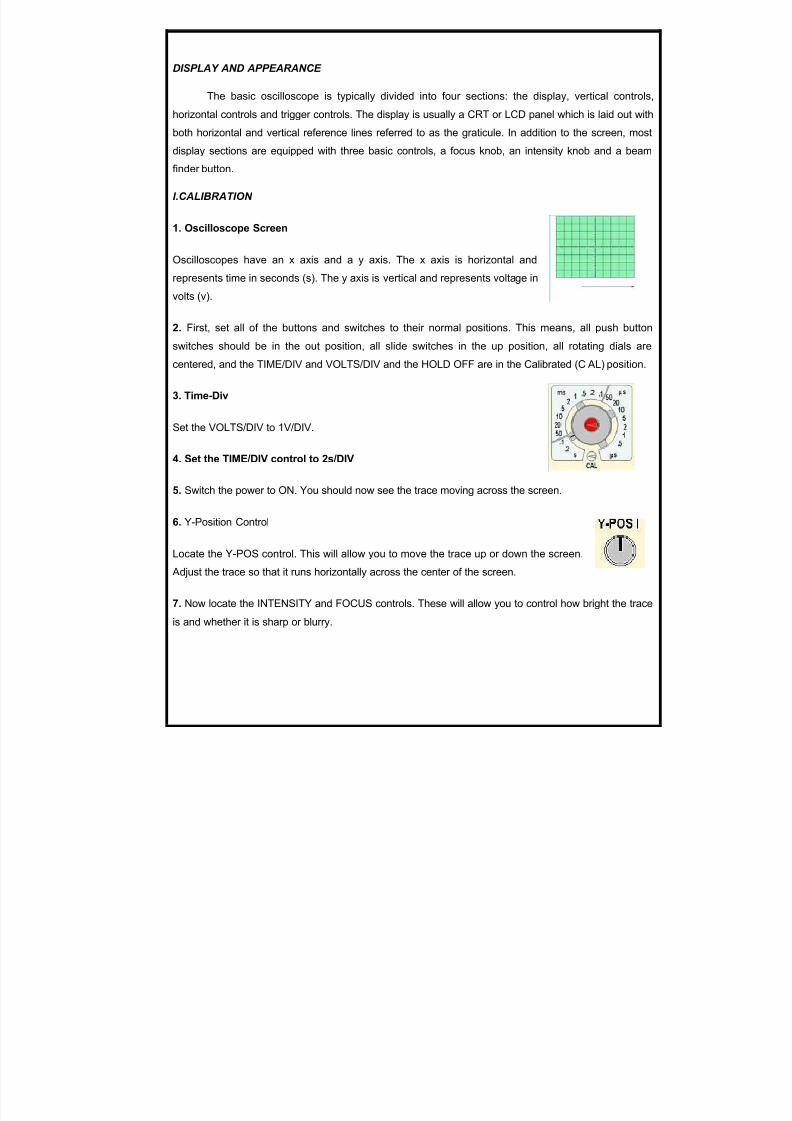
8 . Time/Div Control
The TIME/DIV will control the horizontal scale of the graph. A s you change
this setting to a smaller number, the trace will move across the screen faster.
9. The VOLTS/DIV control will determine the vertical scale of the graph. Set
the control to where you can see the entire vertical motion on the screen.
EXPERIMENTAL RESULTS/DATA
II. AC VOLTAGE MEASUREMENT
Transformer
Output
Measured
Voltage
3V 8.96V
6V 17.98V
9V 26.4V
12V 35.4V
III. SIGNAL & FREQUENCY & AMPLITUDE MEASUREMENT
FunctionGeneral
Frequency
MeasuredFrequency
Period( )
1kHz 1.176Hz 0.85
10kHz 6.932kHz 0.14
100kHz 97.09kHz 0.01
1MHz 961.5kHz 0.00104
8/6/2019 Ece Lab Exp2
http://slidepdf.com/reader/full/ece-lab-exp2 5/13
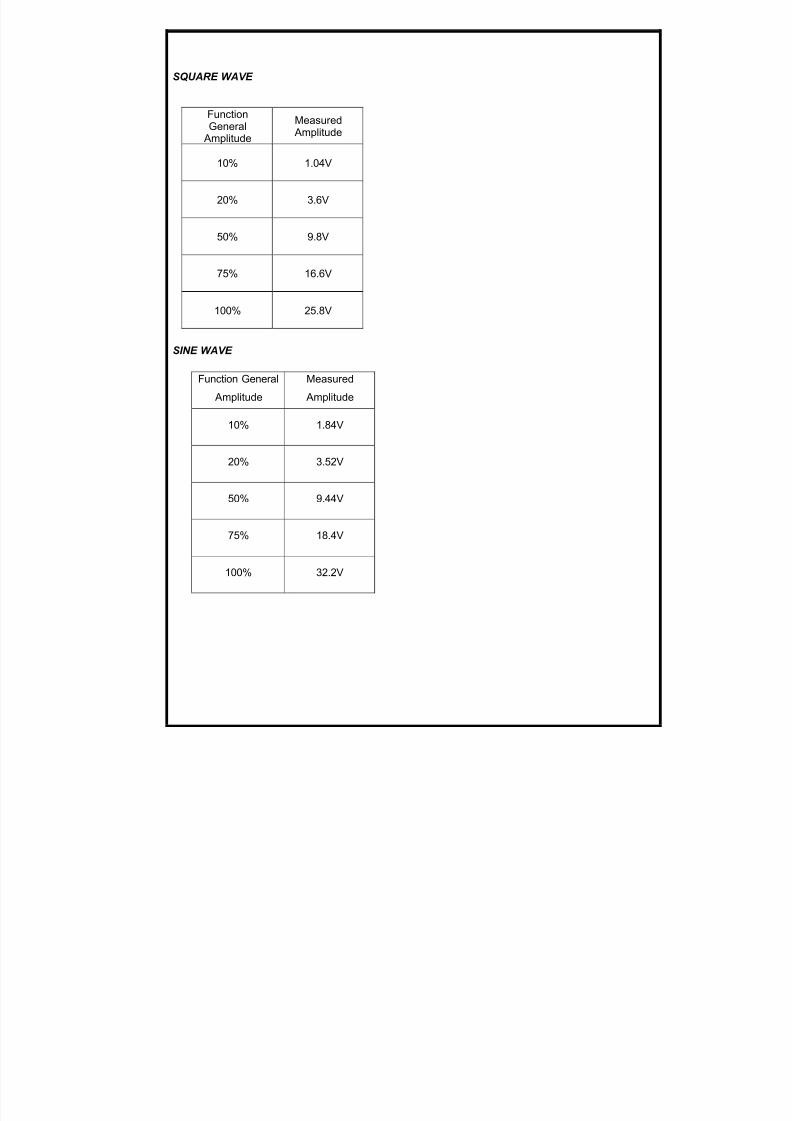
SQUARE WAVE
SINE WAVE
Function General
A mplitude
Measured
A mplitude
10% 1.84V
20% 3.52V
50% 9.44V
75% 18.4V
100% 32.2V
FunctionGeneral
A mplitude
Measured A mplitude
10% 1.04V
20% 3.6V
50% 9.8V
75% 16.6V
100% 25.8V
8/6/2019 Ece Lab Exp2
http://slidepdf.com/reader/full/ece-lab-exp2 6/13
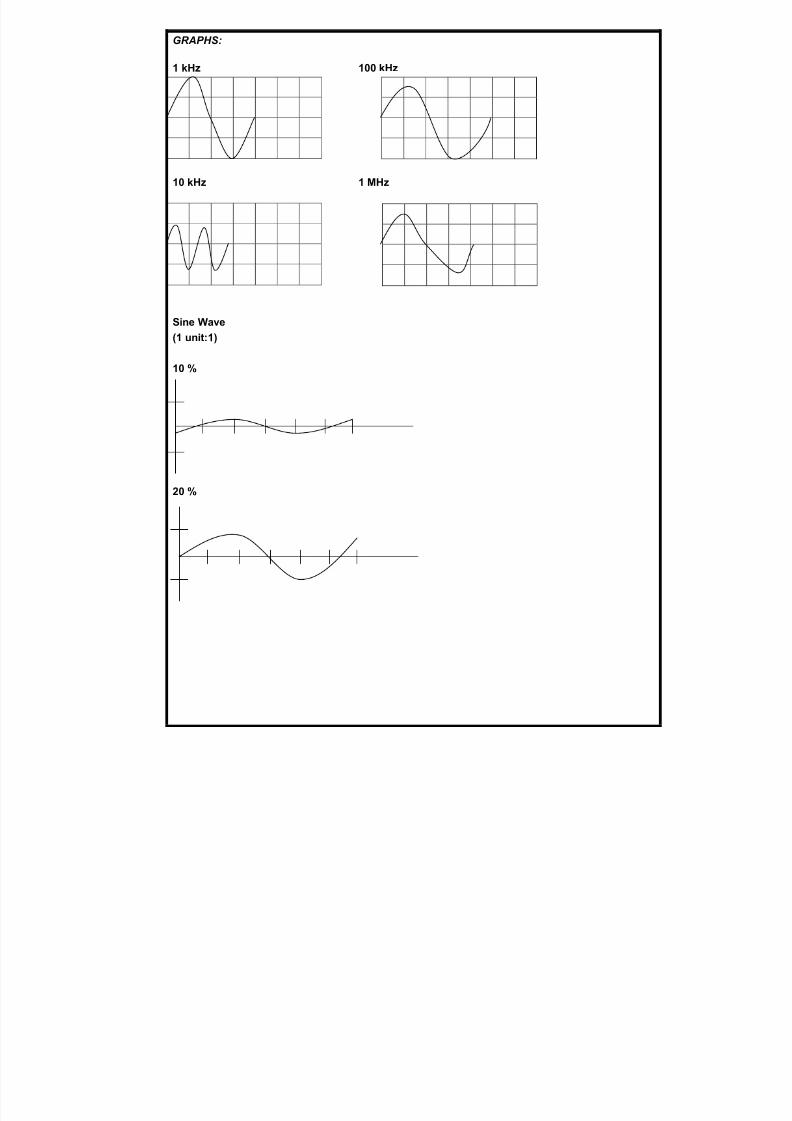
GRAPHS:
1 kHz 100 kHz
10 kHz 1 MHz
Sine Wave(1 unit: 1)
10 %
20 %
8/6/2019 Ece Lab Exp2
http://slidepdf.com/reader/full/ece-lab-exp2 7/13
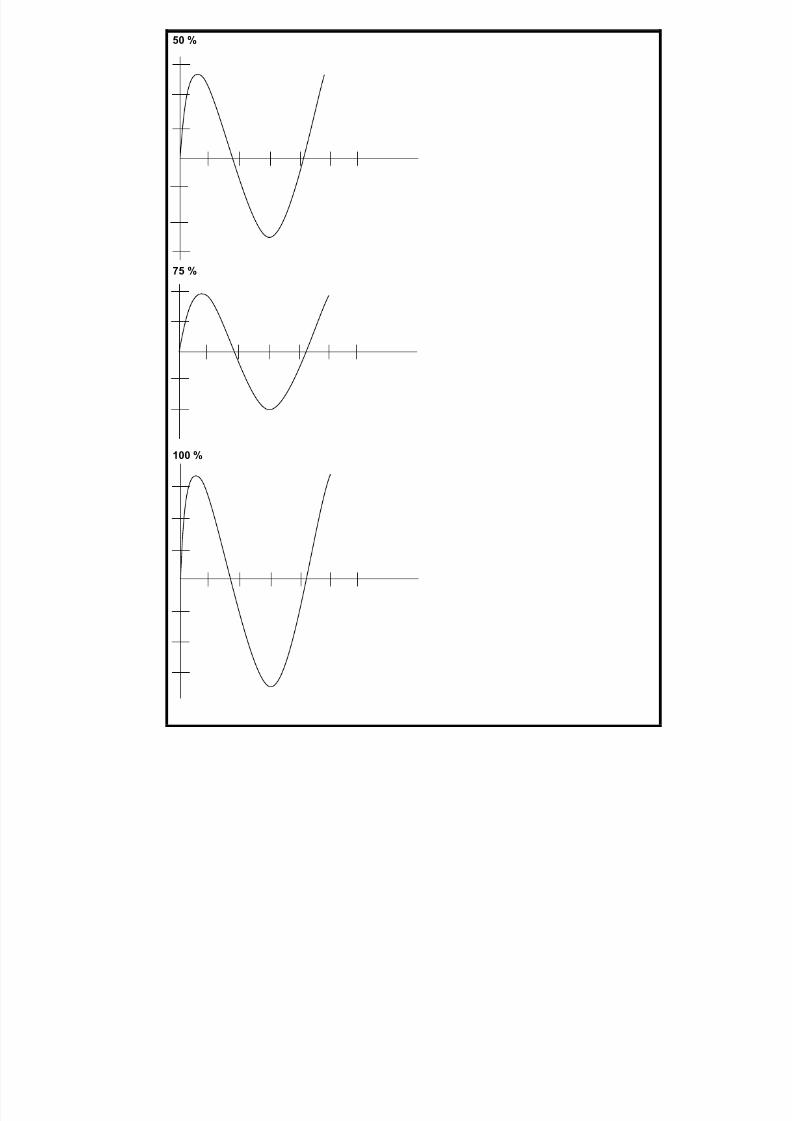
50 %
75 %
100 %
8/6/2019 Ece Lab Exp2
http://slidepdf.com/reader/full/ece-lab-exp2 8/13
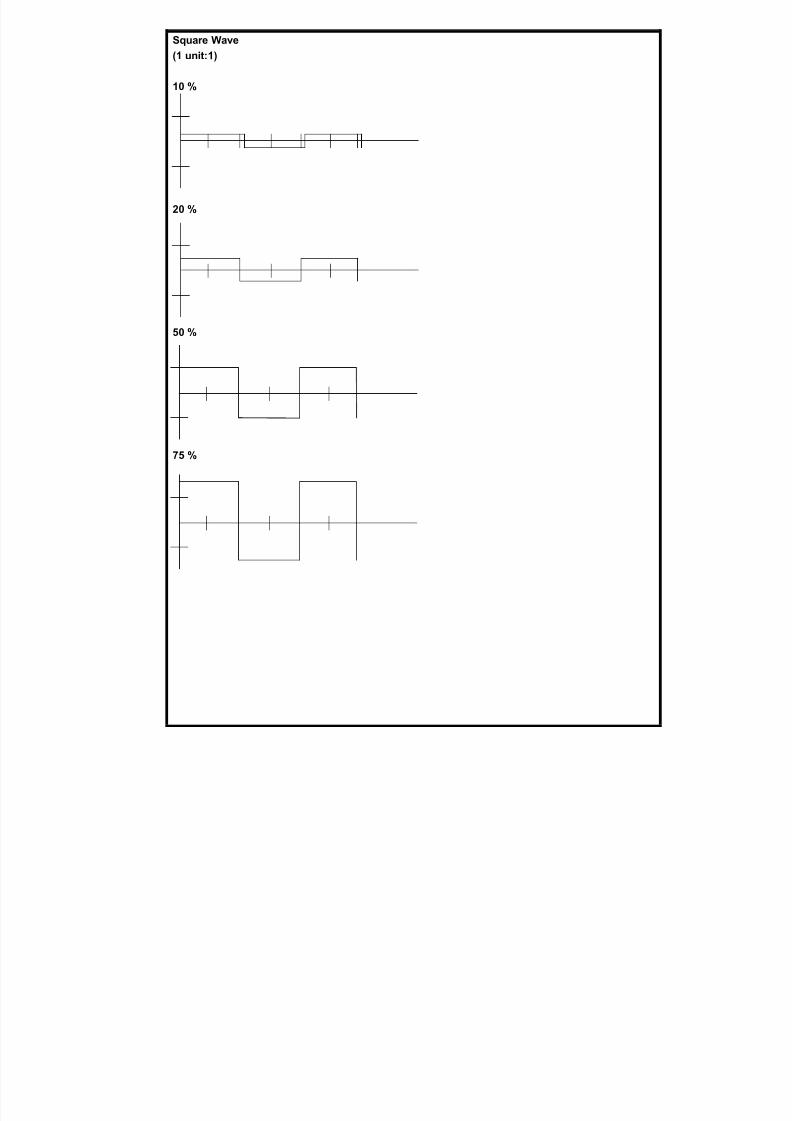
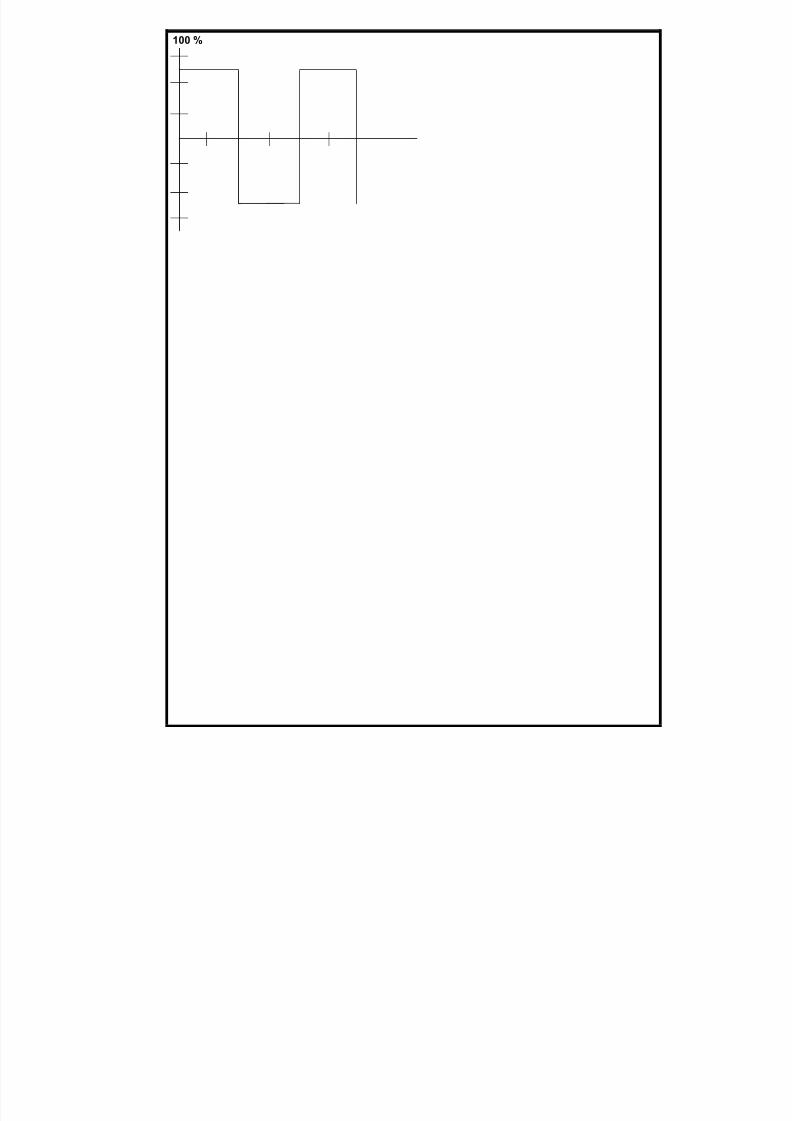
Square Wave(1 unit: 1)
10 %
20 %
50 %
75 %
8/6/2019 Ece Lab Exp2
http://slidepdf.com/reader/full/ece-lab-exp2 9/13
100 %
8/6/2019 Ece Lab Exp2
http://slidepdf.com/reader/full/ece-lab-exp2 10/13
EXPERIMENTAL DISCUSSION
The basic oscilloscope is typically divided into four sections: the display, vertical controls,
horizontal controls and trigger controls. The display is usually a CRT or LCD panel which is laid out with
both horizontal and vertical reference lines referred to as the graticule. In addition to the screen, most
display sections are equipped with three basic controls, a focus knob, an intensity knob and a beam
finder button.
The vertical section controls the amplitude of the displayed signal. This section carries a Volts-
per-Division (Volts/Div) selector knob, an A C/DC/Ground selector switch and the vertical (primary) input
for the instrument. A dditionally, this section is typically equipped with the vertical beam position knob.
The horizontal section controls the time base or ³sweep´ of the instrument. The primary control
is the Seconds-per-Division (Sec/Div) selector switch. A lso included is a horizontal input for plotting
dual X-Y axis signals. The horizontal beam position knob is generally located in this section.
The trigger section controls the start event of the sweep. The trigger can be set to automatically
restart after each sweep or it can be configured to respond to an internal or external event. The
principal controls of this section will be the source and coupling selector switches. A n external trigger
input (EXT Input) and level adjustment will also be included.
CONCLUSION
Based on our experiment, an engineering student must know how to manipulate analog and
digital oscilloscope because when we are already in our fields, we don¶t know what of those two are will
going to use.
In order to do the experiment, the team work of the group is very significant at all times,
because if there is teamwork, the possibility of determining the data¶s will achieve very fast.
RECOMMENDATION
In this experiment, I recommend that in order to make our work faster in getting data¶s in the
oscilloscope, digital oscilloscope is much better and more efficient because the data that will going to
compute are already in the screen of it. But, as an engineering student we should be able to know howto manipulate analog and digital oscilloscope.
EXPERIMENT SUMMARY
Oscilloscopes are commonly used to observe the exact wave shape of an electrical signal. In
addition to the amplitude of the signal, an oscilloscope can show distortion, measure frequency, the
time between two events (such as pulse width or pulse rise time) and relative timing of two related
signals. Some oscilloscopes can analyze and display the frequency spectrum of a repetitive event.
8/6/2019 Ece Lab Exp2
http://slidepdf.com/reader/full/ece-lab-exp2 11/13
These are called spectrum analyzers, and depending on the analyzer, can display spectra from audio
frequency well into the Gigahertz range.
The basic oscilloscope is typically divided into four sections: the display, vertical controls,
horizontal controls and trigger controls. The display is usually a CRT or LCD panel which is laid out with
both horizontal and vertical reference lines referred to as the graticule. In addition to the screen, most
display sections are equipped with three basic controls, a focus knob, an intensity knob and a beamfinder button.
8/6/2019 Ece Lab Exp2
http://slidepdf.com/reader/full/ece-lab-exp2 12/13
GLOSSARY
O scilloscope - is a type of electronic test instrument that allows observation of constantly varying signal
voltages.
X-axis - is the horizontal axis of a two-dimensional plot in Cartesian coordinates that is conventionally
oriented to point to the right (left figure). In three dimensions, the x-, y-, and z- are usually arranged so
as to form a right-handed coordinate system.
Y -axis - is the vertical axis of a two-dimensional plot in Cartesian coordinates. Physicists and
astronomers sometimes call this axis the ordinate, although that term is more commonly used to refer
to coordinates along the y-axis.
Voltage - is a short name for the electrical force that would drive an electric current between thosepoints.
- is the total energy required to move a small electric charge along that path, divided by themagnitude of the charge.
Graticule - is a transparent scale in front of a cathode-ray oscilloscope or other measuring instrument.
Cathode -ray tube - is a vacuum tube that produces images when its phosphorescent surface is struckby electron beams.
Frequency - is the number of waves that pass a fixed point per unit time; also, the number of cycles or
vibrations undergone in unit time by a body in periodic motion.
LCD (Liquid -Crystal display) - is a low-power flat-panel display used in many laptop computers,
calculators and digital watches, made up of a liquid crystal that is sandwiched between layers of glass
or plastic and becomes opaque when electric current passes through it.
LED (light -emitting diode) - A semiconductor diode that converts electric energy intoelectromagnetic radiation at a visible and near infrared frequencies when its pn junction isforward biased.
Spectrum Analyzer - is a test instrument used to show the distribution of energy contained in the
frequencies emitted by a pulse magnetron; also used to measure the Q of resonant cavities and lines,
and to measure the cold impedance of a magnetron.
8/6/2019 Ece Lab Exp2
http://slidepdf.com/reader/full/ece-lab-exp2 13/13
REFERENCES:
Answers.com
http://mathworld.wolfram.com/y-Axis.html
http://mathworld.wolfram.com/x-Axis.html
http://www.ehow.com/how_4526145_calibrate-an-oscilloscope.html
http://en .w ikipedia .org