Embed Size (px)
Citation preview
1© 2021 Kai Sun
Spring 2021Instructor: Kai Sun
ECE 522 ‐ Power Systems Analysis IISpring 2021
Course Outline

2© 2021 Kai Sun
Information• Prerequisite: ECE421 & ECE422• References
– P. Kundur, Power System Stability and Control, McGraw‐Hill, 1994 (the course covers 12 of 17 chapters)
– H. Saadat, Power System Analysis (3rd Edition), McGraw‐Hill, 2010 (text of ECE421/422; used for some homework)
– EPRI Power System Dynamics Tutorial, EPRI, Product ID: 1016042, 2009 http://www.epri.com/abstracts/Pages/ProductAbstract.aspx?ProductId=000000000001016042
3© 2021 Kai Sun
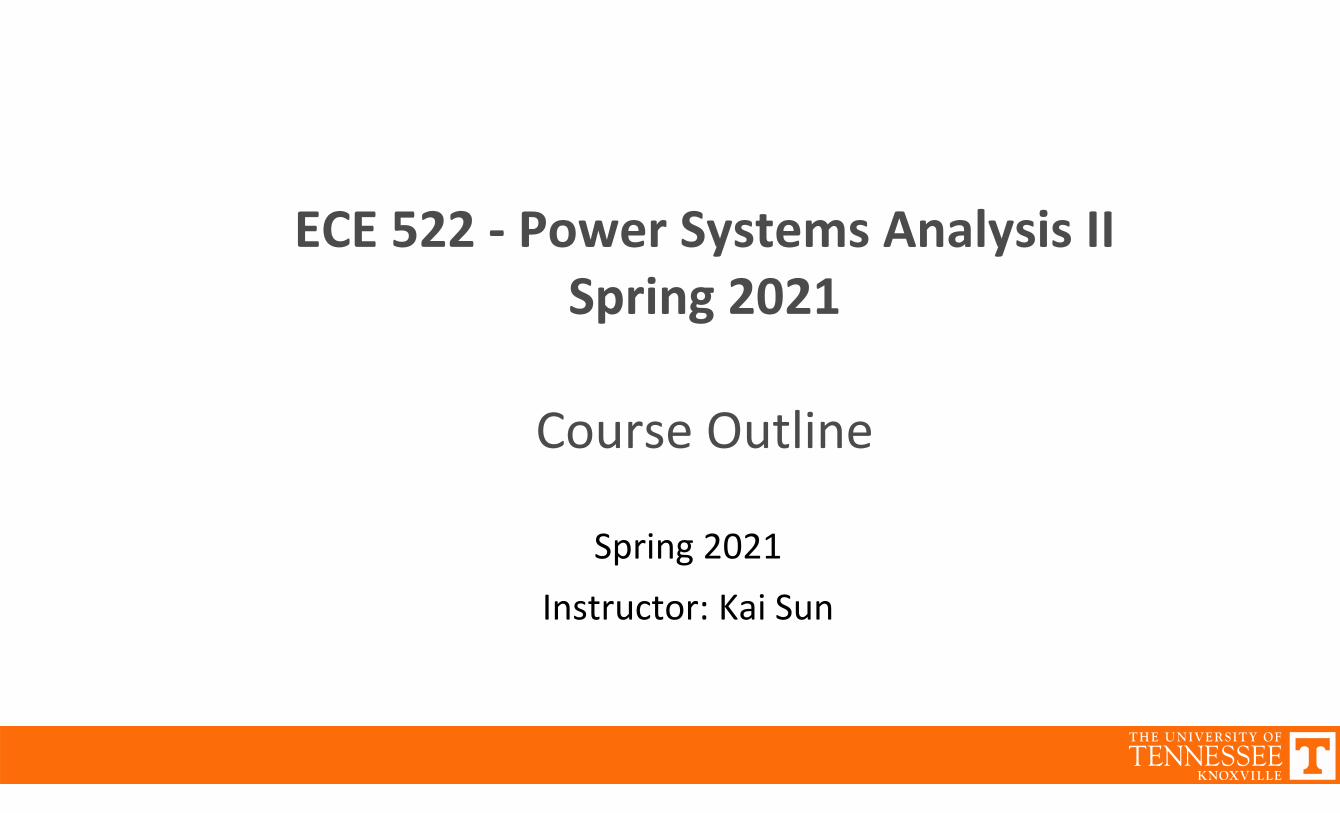
Course objectives
•An in‐depth understanding of basic approaches to modeling of power system dynamics under disturbances
•A broad familiarity with analytical methods, engineering criteria and control measures for power system stability problems, and
•Knowledge in emerging issues and techniques in planning and operating modern interconnected power systems.
4© 2021 Kai Sun
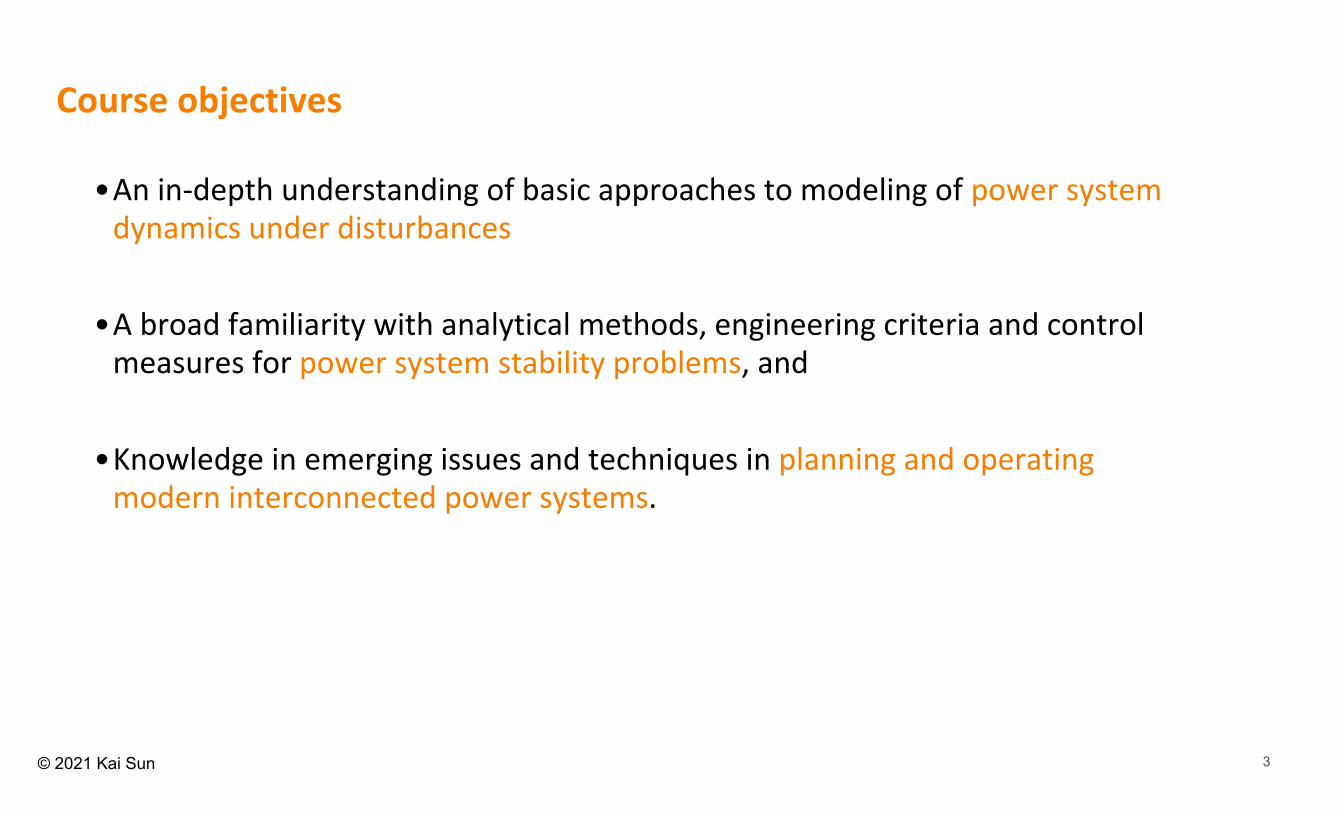
Course Outline1. General background on modern power systems (2‐3 lectures, Kundur’s Ch. 1&2)
– Overview of grid operations and planning (NERC reliability criteria)– Fundamental definitions and classification of power system stability
2. Power system modeling (7 lectures, Ch. 3‐5&7, )– Synchronous machines (Park’s transformation; equivalent circuits; classic and detailed models; equations of motion)
– Loads (static and dynamic loads; acquisition of model parameters)3. Power system control (6 lectures, Ch. 8&9): focusing on modeling of frequency and
voltage regulators/controllers– Frequency regulation and control (governing systems; AGC)– Voltage regulation and control (excitation systems; var compensators)
4. Power system stability (11 lectures, Ch. 12‐14)– Small‐signal stability (power oscillation; eigenanalysis; measurement‐based modal analysis; power system stabilizer)
– Transient stability (direct methods; numerical methods and DSA)– Voltage stability (voltage collapse; P‐V and V‐Q curves and other analysis methods; mitigation measures)
5© 2021 Kai Sun
Spring 2021Instructor: Kai Sun
ECE 522 ‐ Power Systems Analysis IISpring 2021
General Background

6© 2021 Kai Sun
General Background: Outline
•Overview of power system operations and NERC reliability guidelines•Introduction of power system stability (basic concepts, definitions and examples)
•Materials– Part I (Chapters 1&2) of Kundur’s book– IEEE/CIGRE Joint Task Force on Stability Terms and Definitions, “Definition and Classification of Power System Stability,” IEEE Transactions on Power Systems, Vol. 19, No. 2., pp. 1387 – 1401, May 2004
– Reliability Standards for the Bulk Electric Systems of North America, NERC, December 2020https://www.nerc.com/pa/Stand/Reliability%20Standards%20Complete%20Set/RSCompleteSet.pdf
7© 2021 Kai Sun
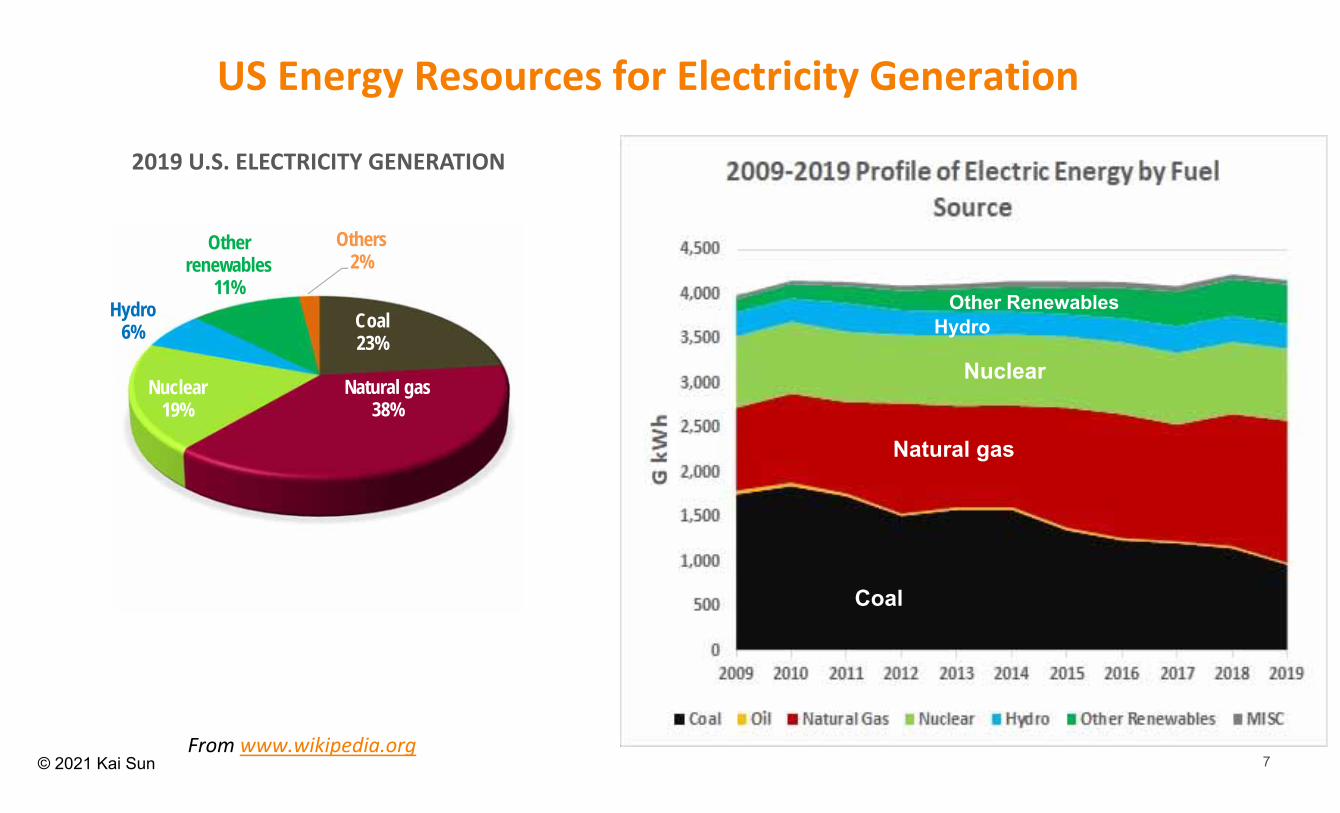
US Energy Resources for Electricity Generation
Coal23%
Natural gas38%
Nuclear19%
Hydro6%
Other renewables
11%
Others2%
2019 U.S. ELECTRICITY GENERATION
Coal
Natural gas
Nuclear
HydroOther Renewables
From www.wikipedia.org
8© 2021 Kai Sun
9© 2021 Kai Sun
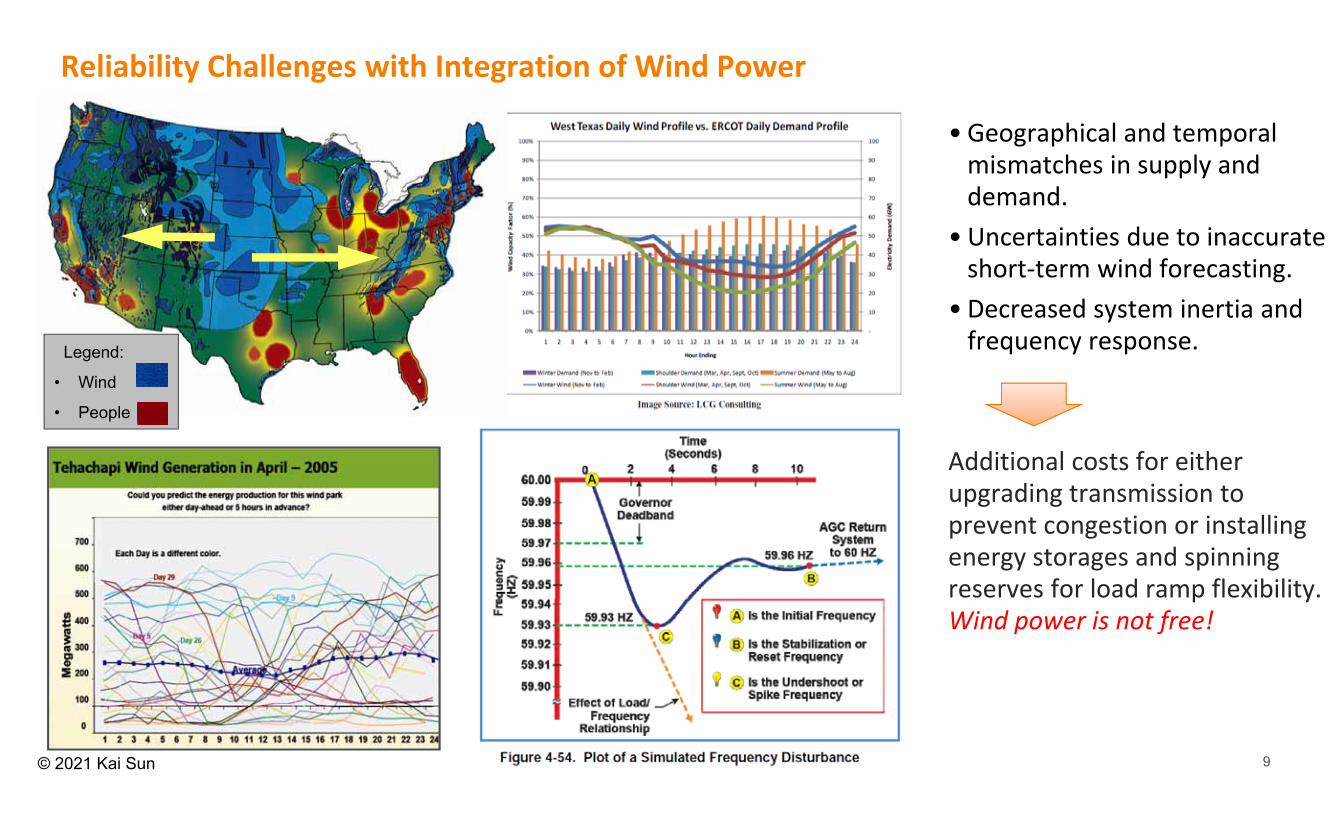
Reliability Challenges with Integration of Wind Power
• Geographical and temporal mismatches in supply and demand.
• Uncertainties due to inaccurate short‐term wind forecasting.
• Decreased system inertia and frequency response.
Additional costs for either upgrading transmission to prevent congestion or installing energy storages and spinning reserves for load ramp flexibility. Wind power is not free!
Legend:
• Wind
• People

10© 2021 Kai Sun
•“Duck Curve” in California toward a goal of 50% from renewables by 2030– Two short steep ramps ~ 3‐4GW/hrstarting around 4:00 AM and 4:00 PM
– Oversupply risk during the day with high solar irradiance.
– Decreased frequency response due to no AGC on solar power generation.
Solar power is not free!
Reliability Challenges with Integration of Solar Power
Source: “What the duck curve tells us about managing a green grid,” CAISO Fast Facts, 2016
10+ GW in 3 hrs
11© 2021 Kai Sun
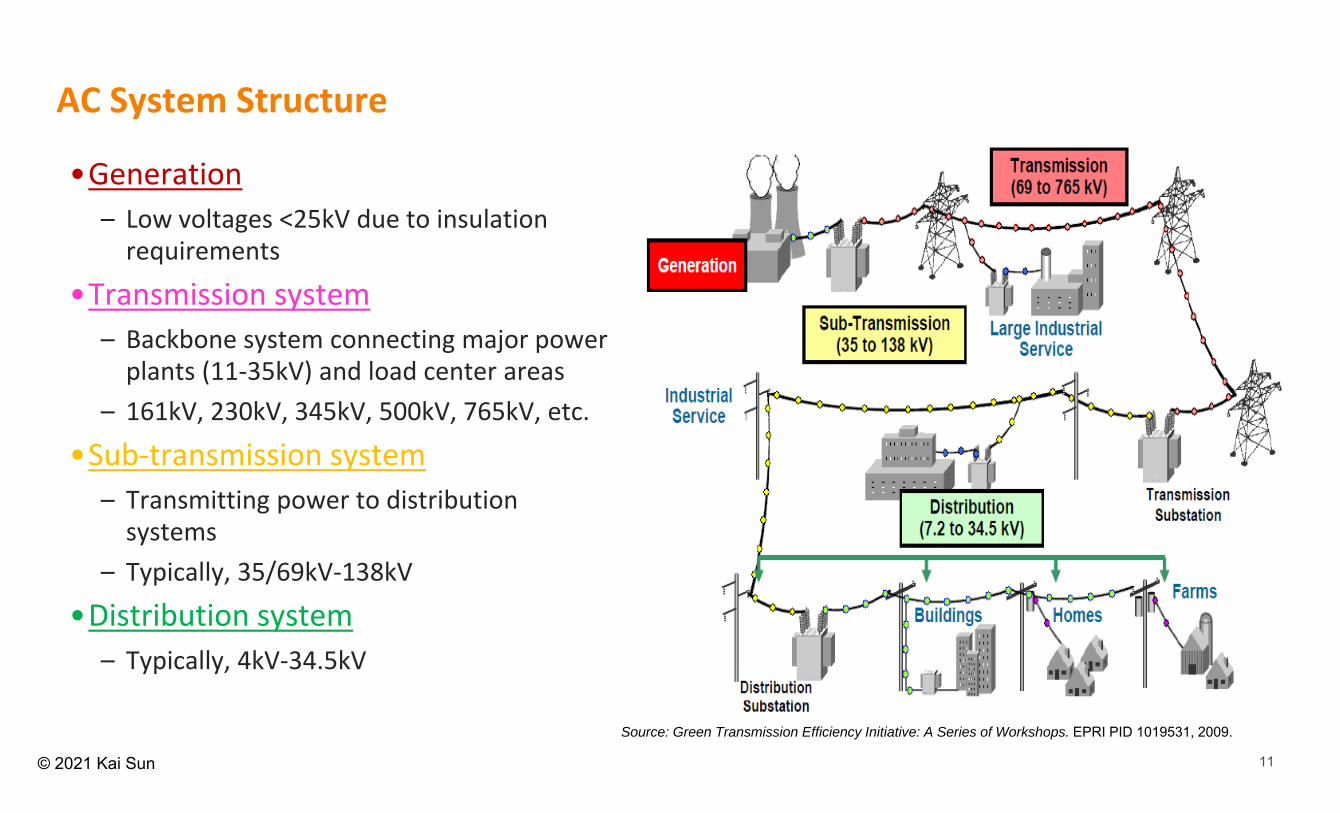
AC System Structure
•Generation– Low voltages <25kV due to insulation requirements
•Transmission system– Backbone system connecting major power plants (11‐35kV) and load center areas
– 161kV, 230kV, 345kV, 500kV, 765kV, etc.
•Sub‐transmission system– Transmitting power to distribution systems
– Typically, 35/69kV‐138kV
•Distribution system– Typically, 4kV‐34.5kV
Source: Green Transmission Efficiency Initiative: A Series of Workshops. EPRI PID 1019531, 2009.
12© 2021 Kai Sun
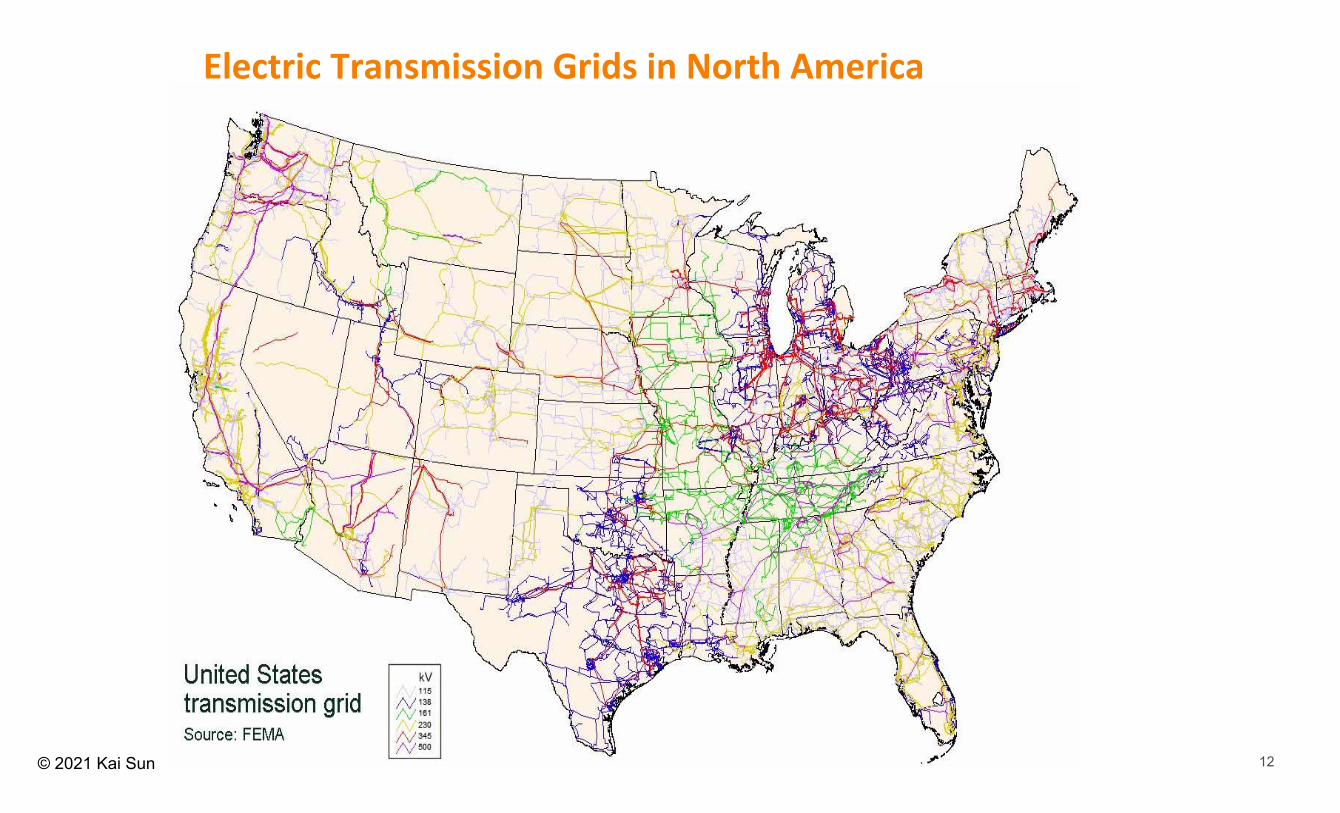
Electric Transmission Grids in North America
13© 2021 Kai Sun
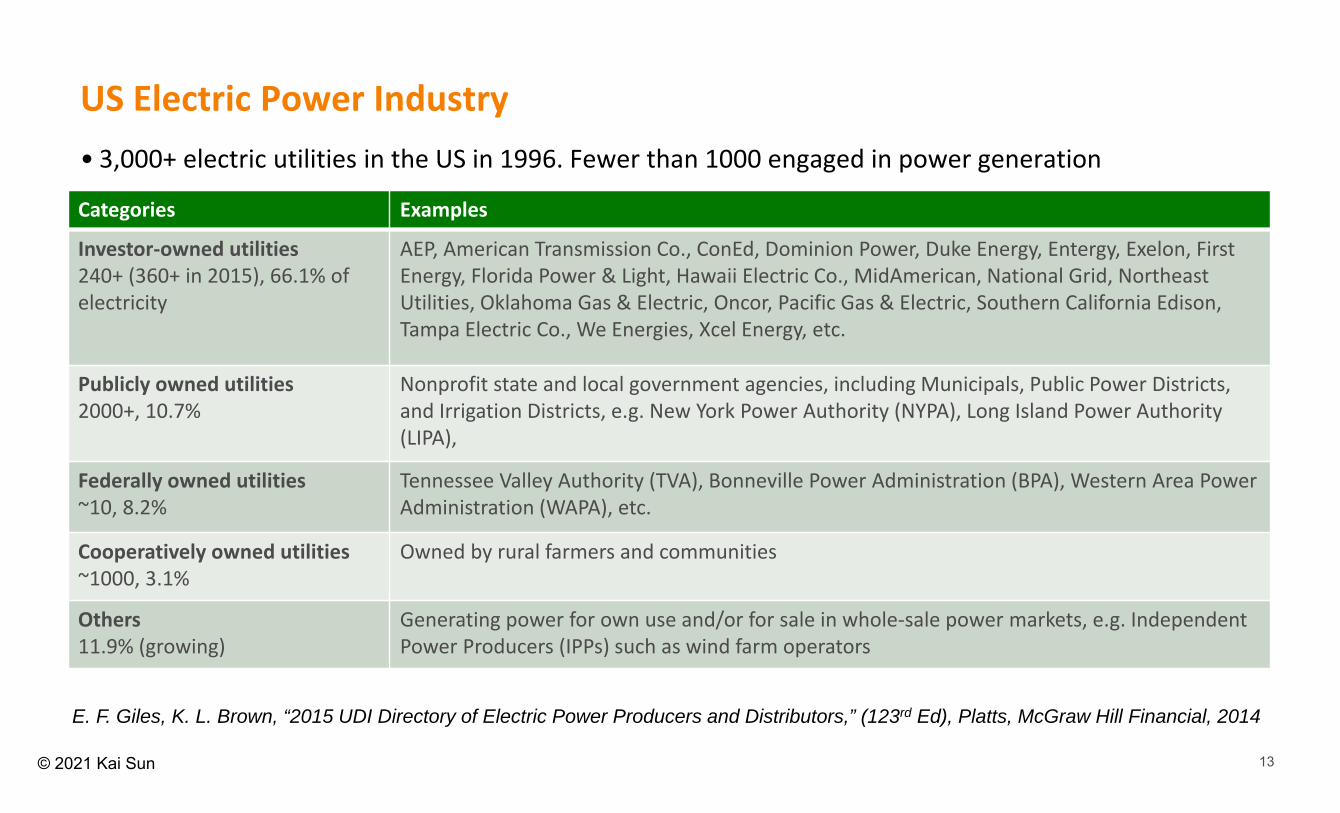
US Electric Power Industry• 3,000+ electric utilities in the US in 1996. Fewer than 1000 engaged in power generation
Categories Examples
Investor‐owned utilities 240+ (360+ in 2015), 66.1% of electricity
AEP, American Transmission Co., ConEd, Dominion Power, Duke Energy, Entergy, Exelon, First Energy, Florida Power & Light, Hawaii Electric Co., MidAmerican, National Grid, Northeast Utilities, Oklahoma Gas & Electric, Oncor, Pacific Gas & Electric, Southern California Edison, Tampa Electric Co., We Energies, Xcel Energy, etc.
Publicly owned utilities 2000+, 10.7%
Nonprofit state and local government agencies, including Municipals, Public Power Districts, and Irrigation Districts, e.g. New York Power Authority (NYPA), Long Island Power Authority (LIPA),
Federally owned utilities~10, 8.2%
Tennessee Valley Authority (TVA), Bonneville Power Administration (BPA), Western Area Power Administration (WAPA), etc.
Cooperatively owned utilities ~1000, 3.1%
Owned by rural farmers and communities
Others11.9% (growing)
Generating power for own use and/or for sale in whole‐sale power markets, e.g. Independent Power Producers (IPPs) such as wind farm operators
E. F. Giles, K. L. Brown, “2015 UDI Directory of Electric Power Producers and Distributors,” (123rd Ed), Platts, McGraw Hill Financial, 2014
14© 2021 Kai Sun
Transmission Owners
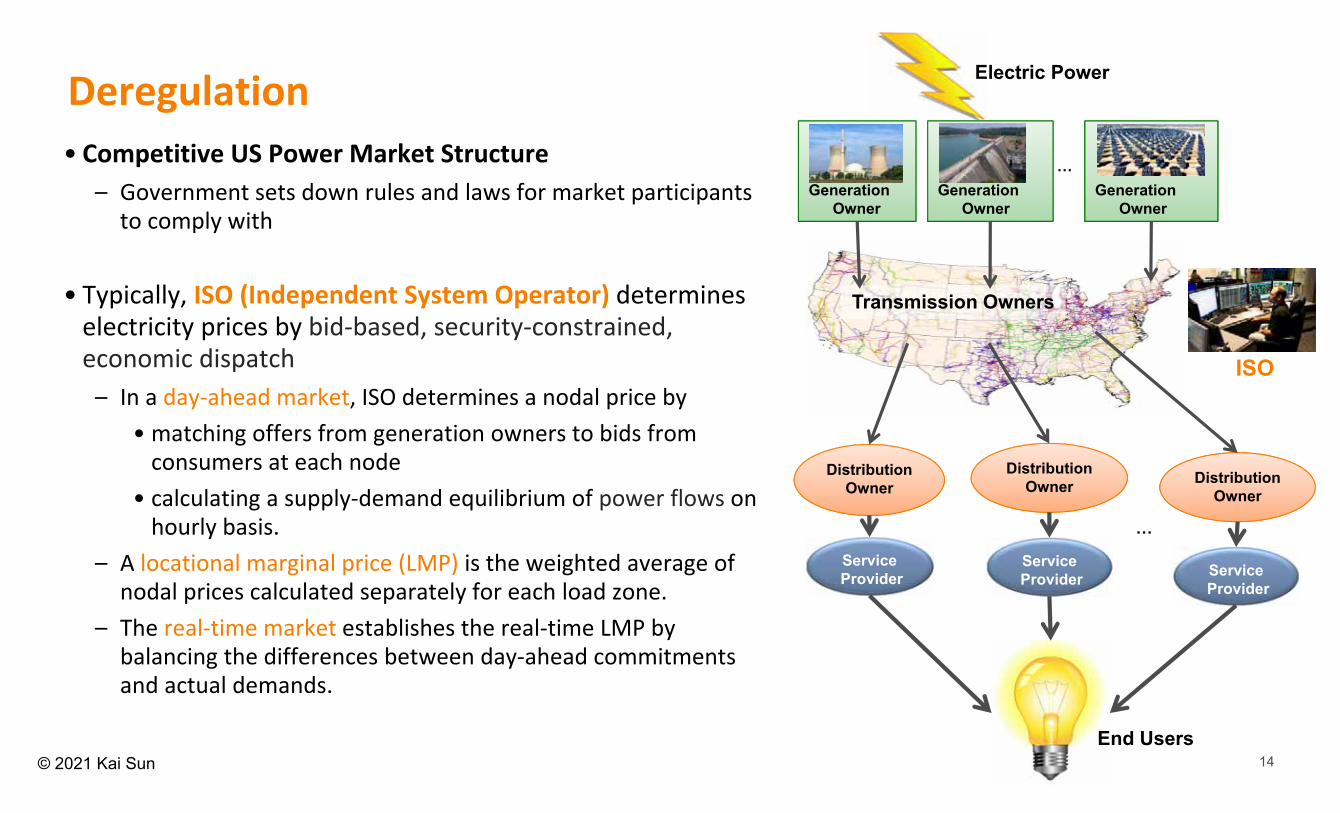
Deregulation• Competitive US Power Market Structure
– Government sets down rules and laws for market participants to comply with
• Typically, ISO (Independent System Operator) determines electricity prices by bid‐based, security‐constrained, economic dispatch – In a day‐ahead market, ISO determines a nodal price by
• matching offers from generation owners to bids from consumers at each node
• calculating a supply‐demand equilibrium of power flows on hourly basis.
– A locational marginal price (LMP) is the weighted average of nodal prices calculated separately for each load zone.
– The real‐time market establishes the real‐time LMP by balancing the differences between day‐ahead commitments and actual demands.
Distribution Owner
DistributionOwner
ServiceProvider
ServiceProvider
…
DistributionOwner
ServiceProvider
End Users
ISO
Electric Power
Generation Owner
Generation Owner
…Generation
Owner
15© 2021 Kai Sun
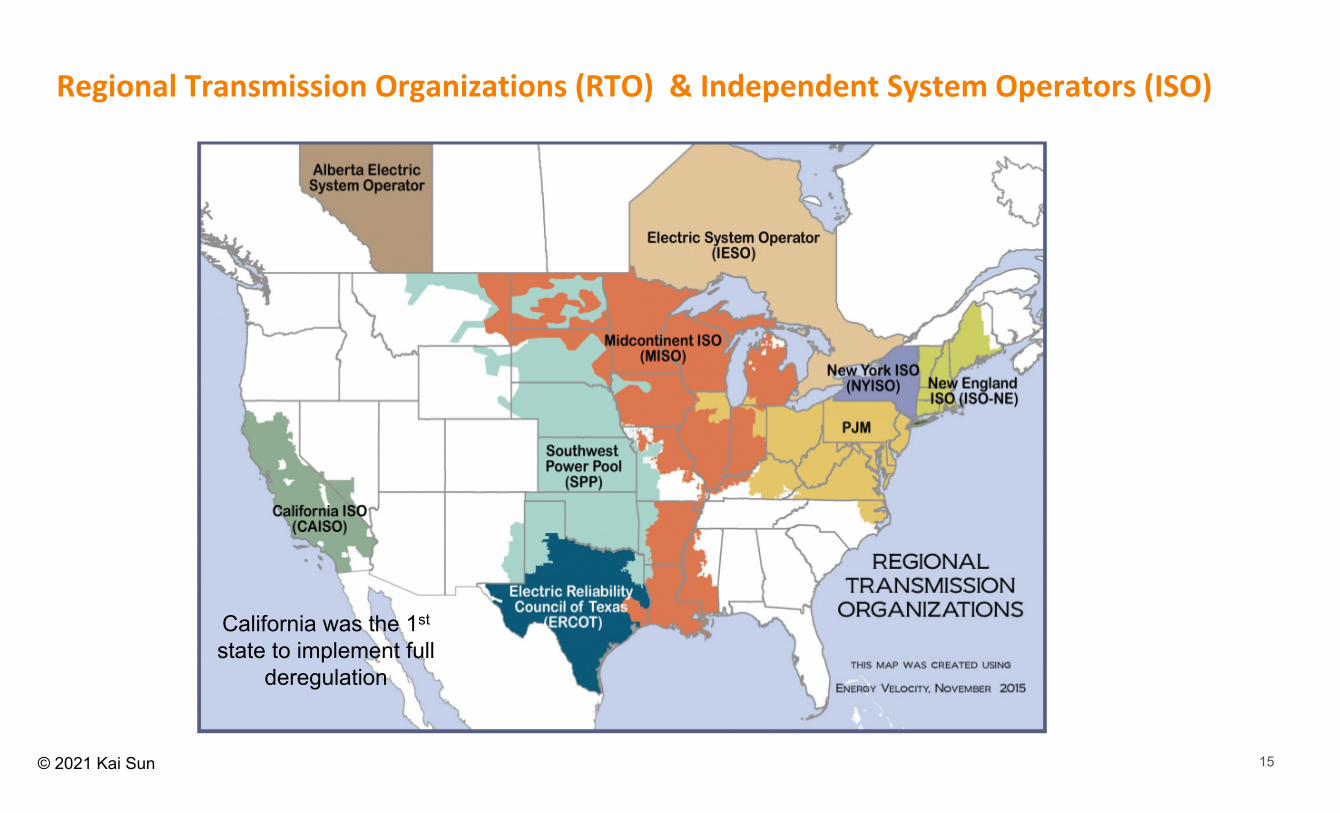
Regional Transmission Organizations (RTO) & Independent System Operators (ISO)
California was the 1st
state to implement full deregulation
16© 2021 Kai Sun
DemandSupply
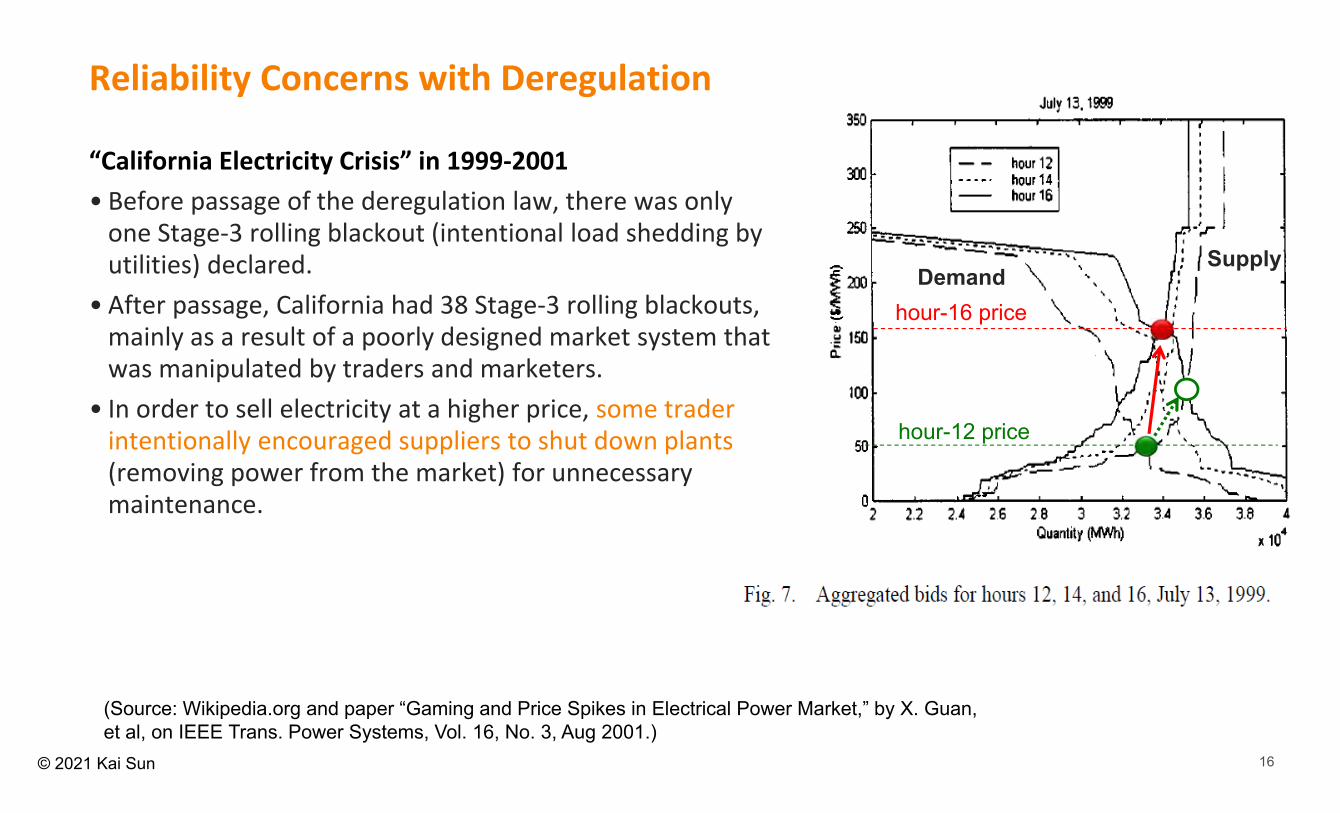
Reliability Concerns with Deregulation
“California Electricity Crisis” in 1999‐2001• Before passage of the deregulation law, there was only one Stage‐3 rolling blackout (intentional load shedding by utilities) declared.
• After passage, California had 38 Stage‐3 rolling blackouts, mainly as a result of a poorly designed market system that was manipulated by traders and marketers.
• In order to sell electricity at a higher price, some trader intentionally encouraged suppliers to shut down plants (removing power from the market) for unnecessary maintenance.
(Source: Wikipedia.org and paper “Gaming and Price Spikes in Electrical Power Market,” by X. Guan, et al, on IEEE Trans. Power Systems, Vol. 16, No. 3, Aug 2001.)
hour-12 price
hour-16 price

17© 2021 Kai Sun
•In a traditional economic dispatch, actual fuel cost function Ci of each power plant is known by the dispatcher to decide generations and prices for the equal incremental cost.
•In an electricity market, Cidepends on the bidding strategy and is unnecessarily equal to the fuel cost, so the trader/supplier can play with the bidding strategy for the maximum profit.
11
1
5.3 0.008dC PdP
22
2
5.5 0.012dC PdP
33
3
5.8 0.018dC PdP
Equal incremental cost
18© 2021 Kai Sun
NERC (North American Electric Reliability Corporation)
•As a non‐government organization, formed by the electric utility industry in 1968 to promote the reliability of bulk power systems in North America.
•Initially membership was voluntary and member systems followed the reliability criteria for planning and operating bulk power systems to prevent major system disturbances following severe contingencies
•As of June 2007, FERC (U.S. Federal Energy Regulatory Commission) granted NERC the legal authority to enforce reliability criteria with all users, owners, and operators of the bulk power systems in the U.S.
•NERC Membership is now mandatory and member systems comply with NERC’s Reliability Standards (approved by FERC) to both promote reliable operations and to avoid costly monetary penalties if caught non‐compliant. Every system operator should read, understand and follow NERC’s Reliability Standards. (Visit http://www.nerc.com for more information on NERC.)
19© 2021 Kai Sun
Bulk Power System (BPS) and Bulk Electric System (BES)• “Bulk Power System” (BPS) defined by the Energy Policy Act of 2005
– It includes “facilities and control systems necessary for operating an interconnected electric energy transmission network (or any portion thereof) and electric energy from generation facilities needed to maintain transmission system reliability, … not including facilities used in the local distribution of electric energy.”
– BPS is the term to use when generally speaking about the interconnected network or power grid, which includes “Bulk Electric System” (BES).
• “Bulk Electric System” (BES) defined by NERC– It is a term commonly applied to the portion of an electric utility system that integrates “the electrical generation resources, transmission lines, interconnections with neighboring systems, and associated equipment, generally operated at voltages of 100 kV or higher.” Radial transmission facilities serving only load with one transmission source are generally not included in this definition
– For short, a BES is the part of the transmission/sub‐transmission system connecting power plants, major substations, and HV transmission lines
– BES should be used in the context of applicability of Reliability Standards.
20© 2021 Kai Sun
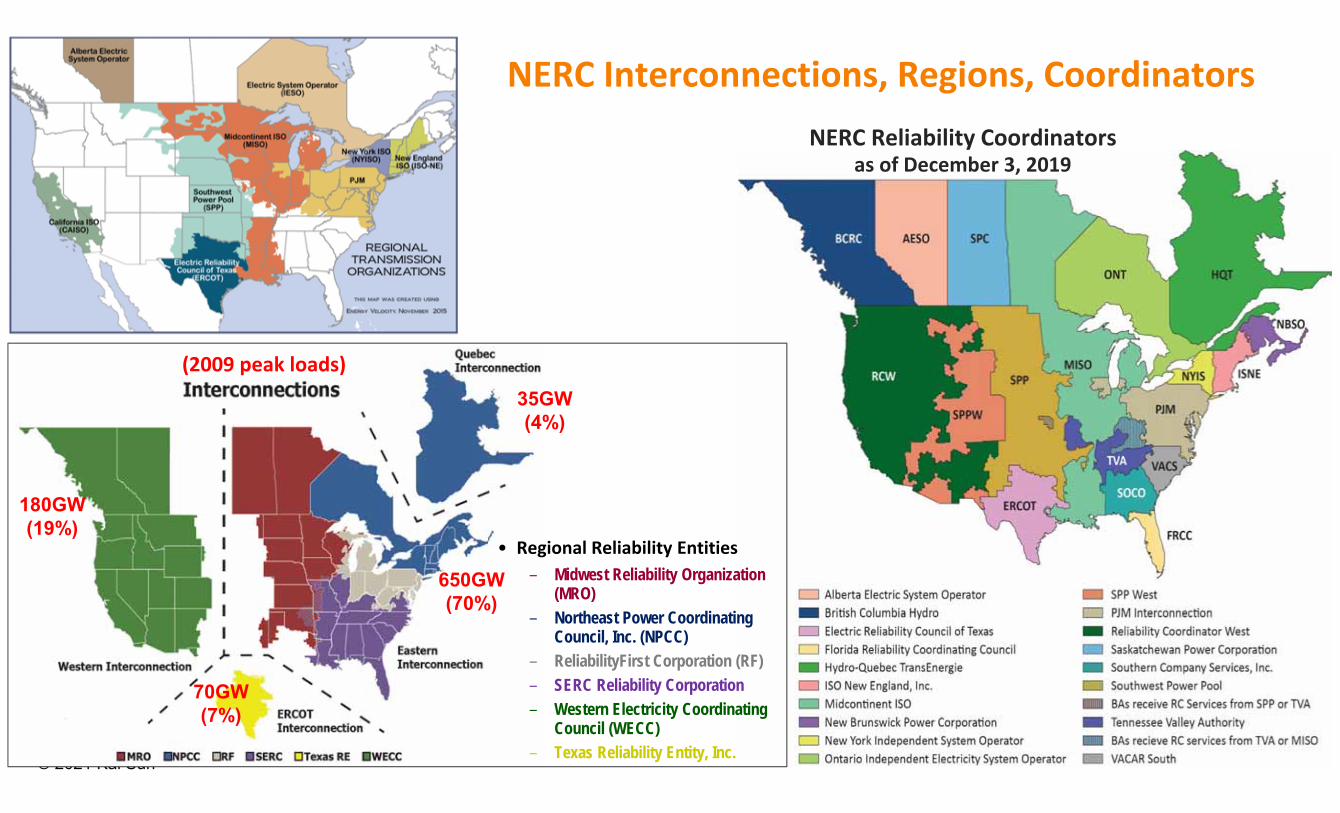
• Regional Reliability Entities– Midwest Reliability Organization
(MRO)– Northeast Power Coordinating
Council, Inc. (NPCC)– ReliabilityFirst Corporation (RF)– SERC Reliability Corporation– Western Electricity Coordinating
Council (WECC)– Texas Reliability Entity, Inc.
NERC Reliability Coordinatorsas of December 3, 2019
NERC Interconnections, Regions, Coordinators
(2009 peak loads)
650GW(70%)
180GW(19%)
70GW(7%)
35GW(4%)
21© 2021 Kai Sun
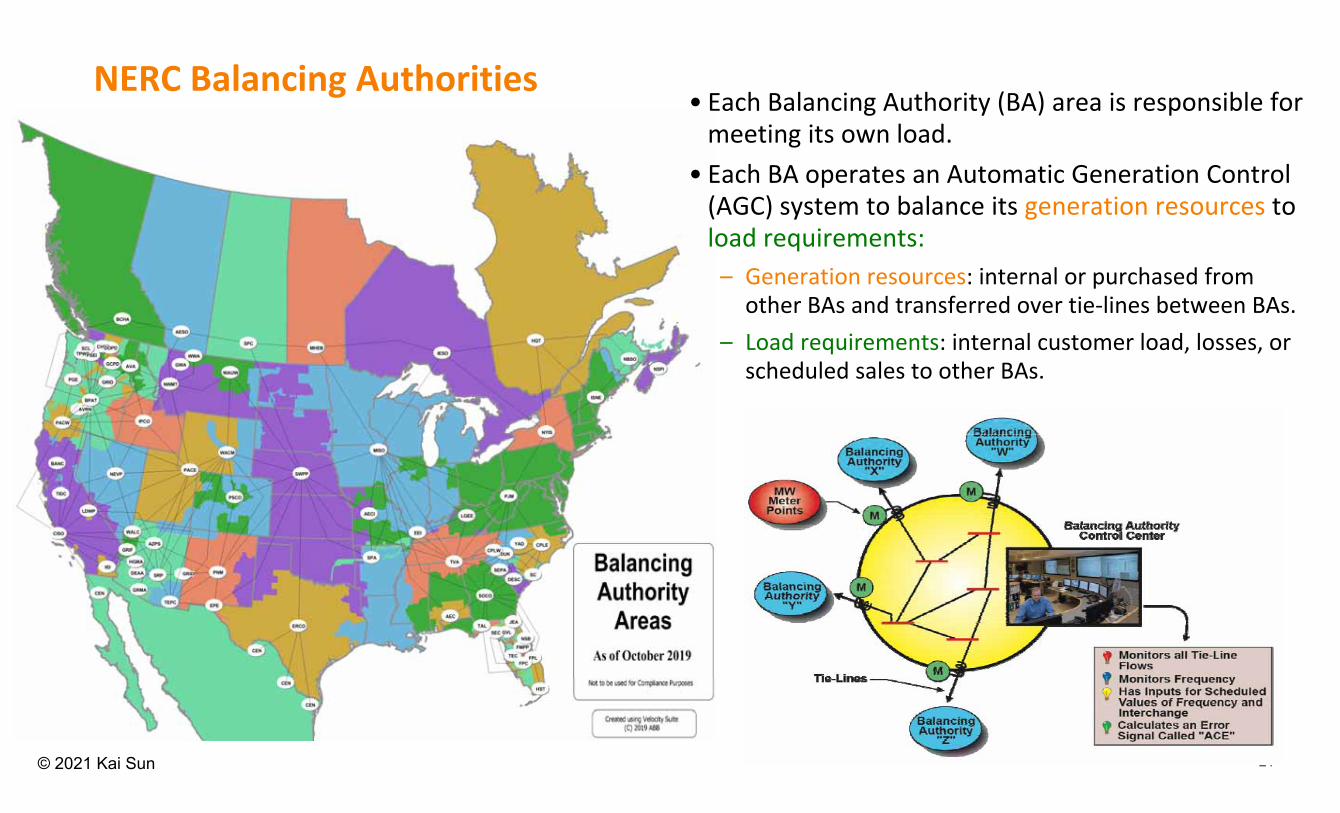
NERC Balancing Authorities • Each Balancing Authority (BA) area is responsible for meeting its own load.
• Each BA operates an Automatic Generation Control (AGC) system to balance its generation resources to load requirements:– Generation resources: internal or purchased from
other BAs and transferred over tie‐lines between BAs.– Load requirements: internal customer load, losses, or
scheduled sales to other BAs.
22© 2021 Kai Sun
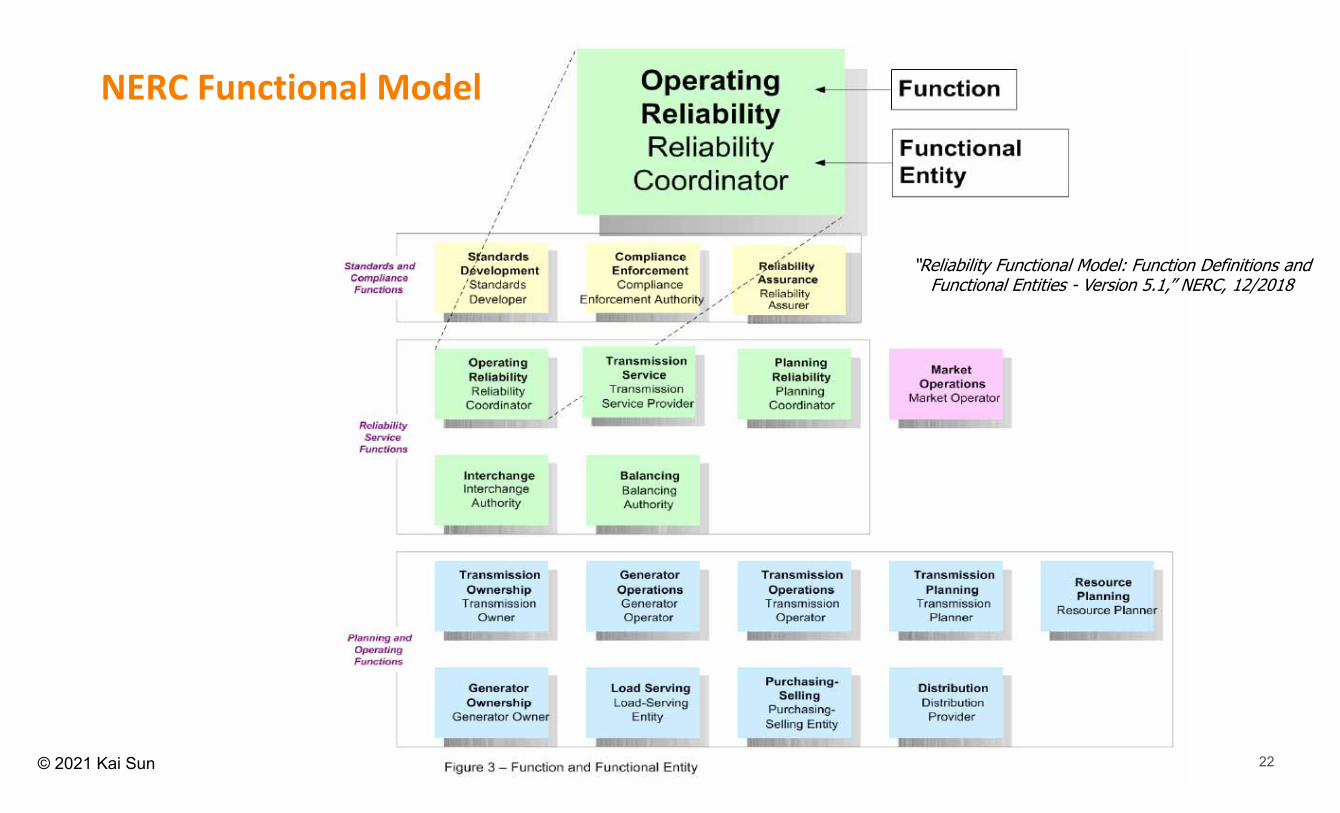
NERC Functional Model
“Reliability Functional Model: Function Definitions and Functional Entities - Version 5.1,” NERC, 12/2018
23© 2021 Kai Sun
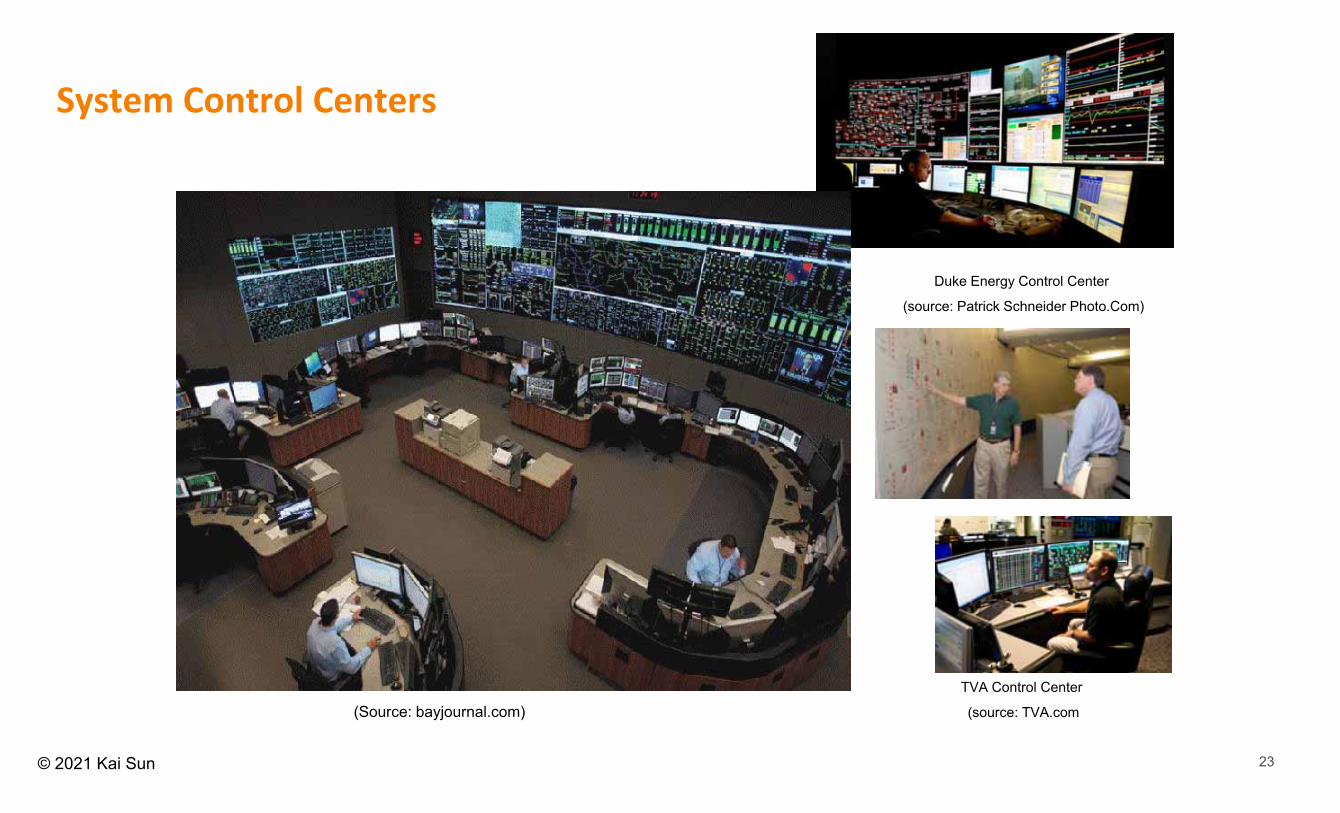
System Control Centers
(Source: bayjournal.com)
Duke Energy Control Center
(source: Patrick Schneider Photo.Com)
TVA Control Center
(source: TVA.com
24© 2021 Kai Sun
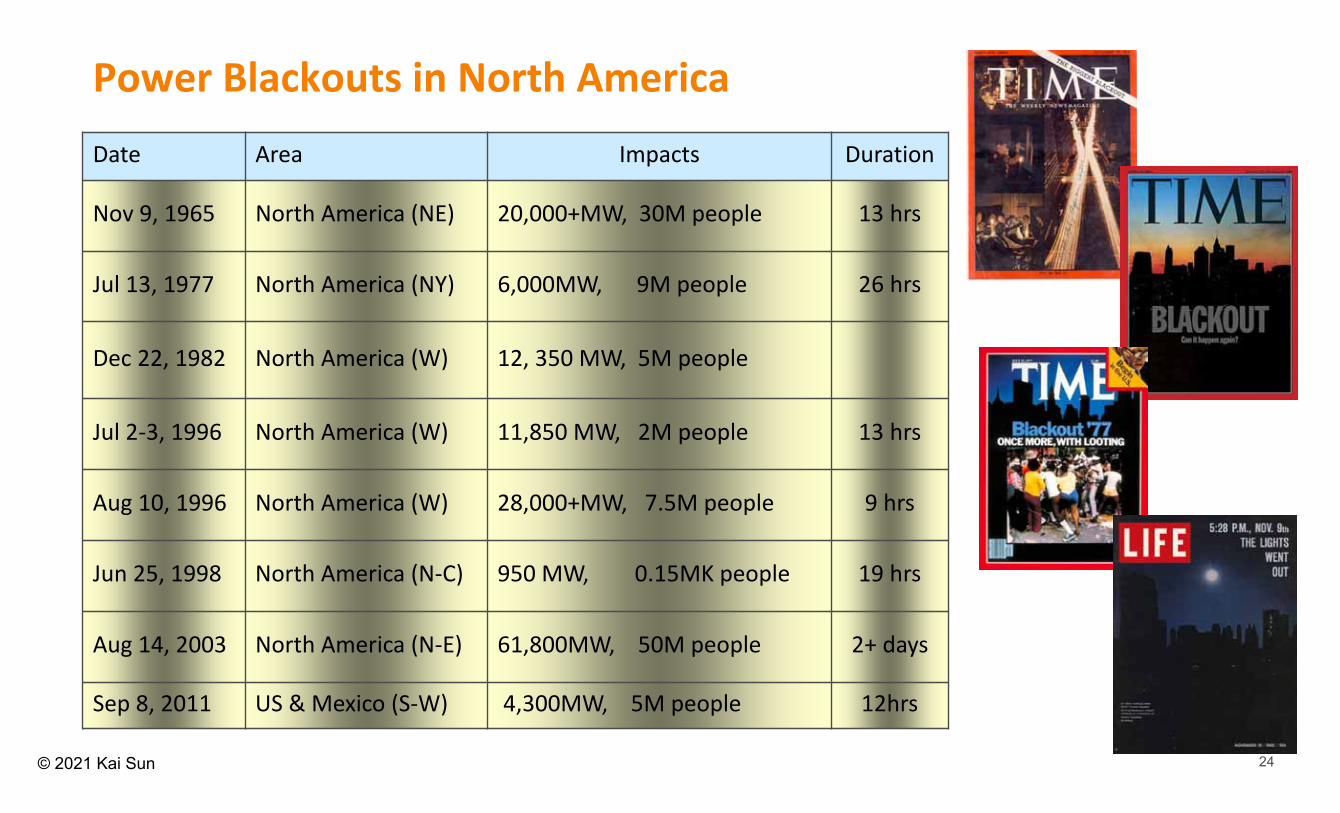
Power Blackouts in North America
Date Area Impacts Duration
Nov 9, 1965 North America (NE) 20,000+MW, 30M people 13 hrs
Jul 13, 1977 North America (NY) 6,000MW, 9M people 26 hrs
Dec 22, 1982 North America (W) 12, 350 MW, 5M people
Jul 2‐3, 1996 North America (W) 11,850 MW, 2M people 13 hrs
Aug 10, 1996 North America (W) 28,000+MW, 7.5M people 9 hrs
Jun 25, 1998 North America (N‐C) 950 MW, 0.15MK people 19 hrs
Aug 14, 2003 North America (N‐E) 61,800MW, 50M people 2+ days
Sep 8, 2011 US & Mexico (S‐W) 4,300MW, 5M people 12hrs
25© 2021 Kai Sun
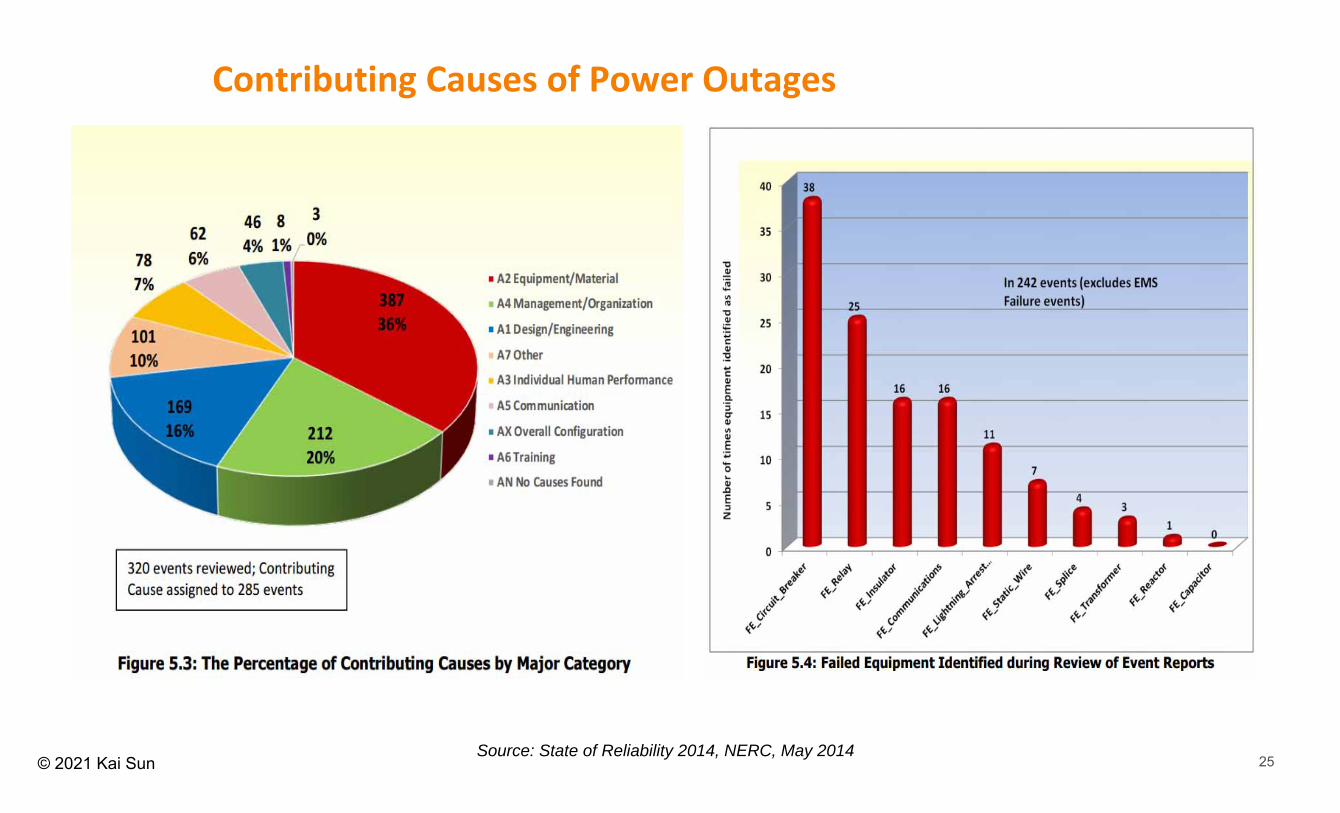
Contributing Causes of Power Outages
Source: State of Reliability 2014, NERC, May 2014

26© 2021 Kai Sun
Reliability of Bulk Electric Systems
•Power systems should be built and operated to ACHIEVE A RELIABLE ELECTRIC POWER SUPPLY AT THE MOST ECONOMICAL COST
•Reliability is defined using two terms:– Adequacy (planning): The ability of the electric systems to supply the aggregate electrical demand and energy requirements of their customers at all times, taking into account scheduled and reasonably expected unscheduled outages of system elements.
– Security (operations): The ability of the electric systems to withstand sudden disturbances such as electric short circuits or unanticipated loss of system elements
27© 2021 Kai Sun
Reliability of Bulk Electric Systems (cont’d)
•Requirements of a reliable electric power service– Voltage and frequency are held within close tolerances– Synchronous generators are kept running in parallel with adequate capacity to meet the load demand
– The “integrity” of the bulk power network (avoid cascading outages) are maintained.
•How are reliability standards used:– In Planning, reliability standards should never be violated in designing the system.– In Operations, reliability standards should never be intentionally violated although, sometimes, violations do occur due to mis‐operations or delayed awareness of the real‐time situation.
28© 2021 Kai Sun
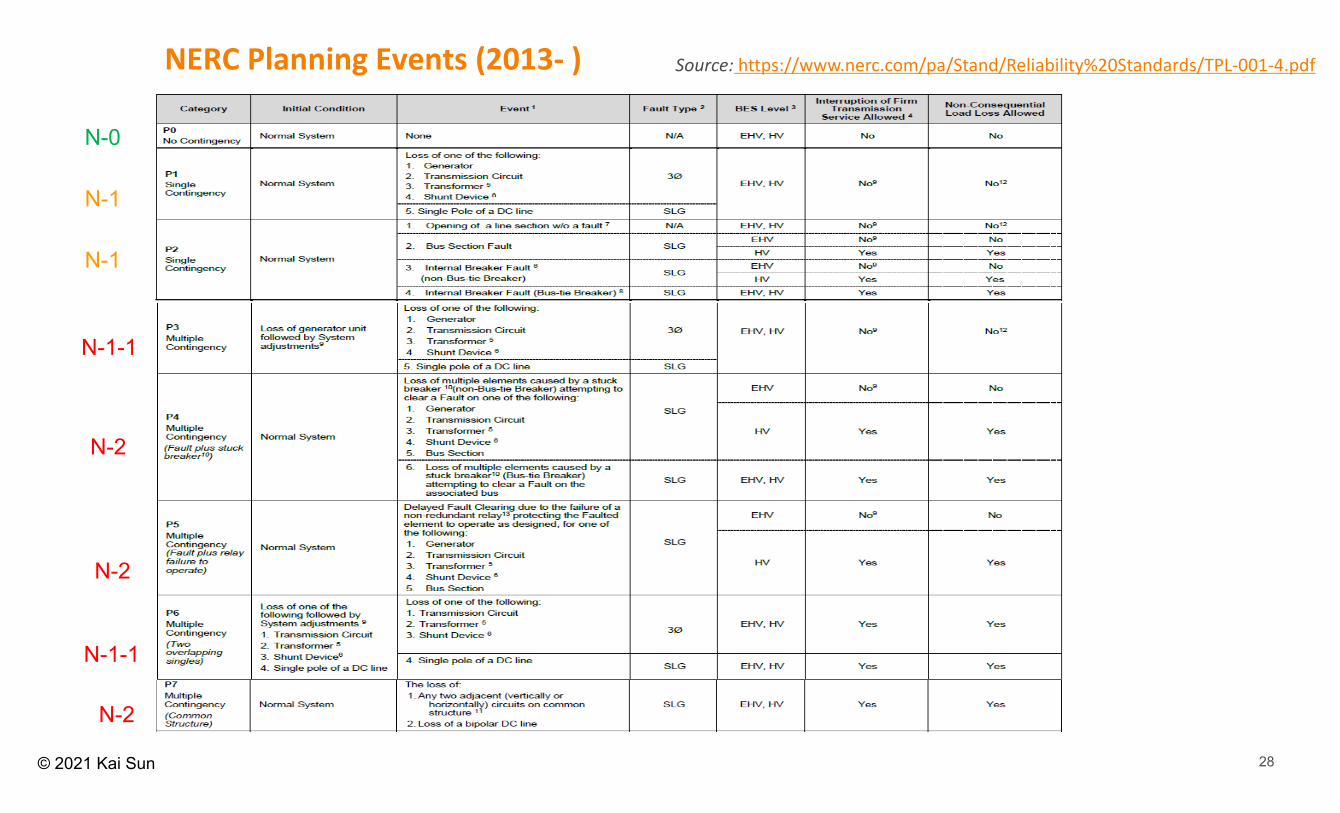
NERC Planning Events (2013‐ )
N-0
N-1
N-1
N-1-1
N-2
N-2
N-1-1
N-2
Source: https://www.nerc.com/pa/Stand/Reliability%20Standards/TPL‐001‐4.pdf

29© 2021 Kai Sun
Summary of NERC Contingencies
Category Events
P0No contingency
(~ Category A before 2013)• Normal system (N‐0)
P1‐P2Single Contingency
(~ Category B before 2013)
• Normal system losing 1 element (e.g. generator, line, transformer, shunt and bus section) with or without a fault (N‐1)
P3‐P7Multiple Contingency
(~ Category C/D before 2013)
• N‐1 system losing 1 element (N‐1‐1)• Normal system losing multiple elements (N‐k) at the same
location due to a stuck breaker or delayed fault clearing• Normal system losing 2 adjacent circuits (N‐2)
30© 2021 Kai Sun
P0P1‐P2
Credible and Acceptable
P3‐P7
Extremely
Rare Events
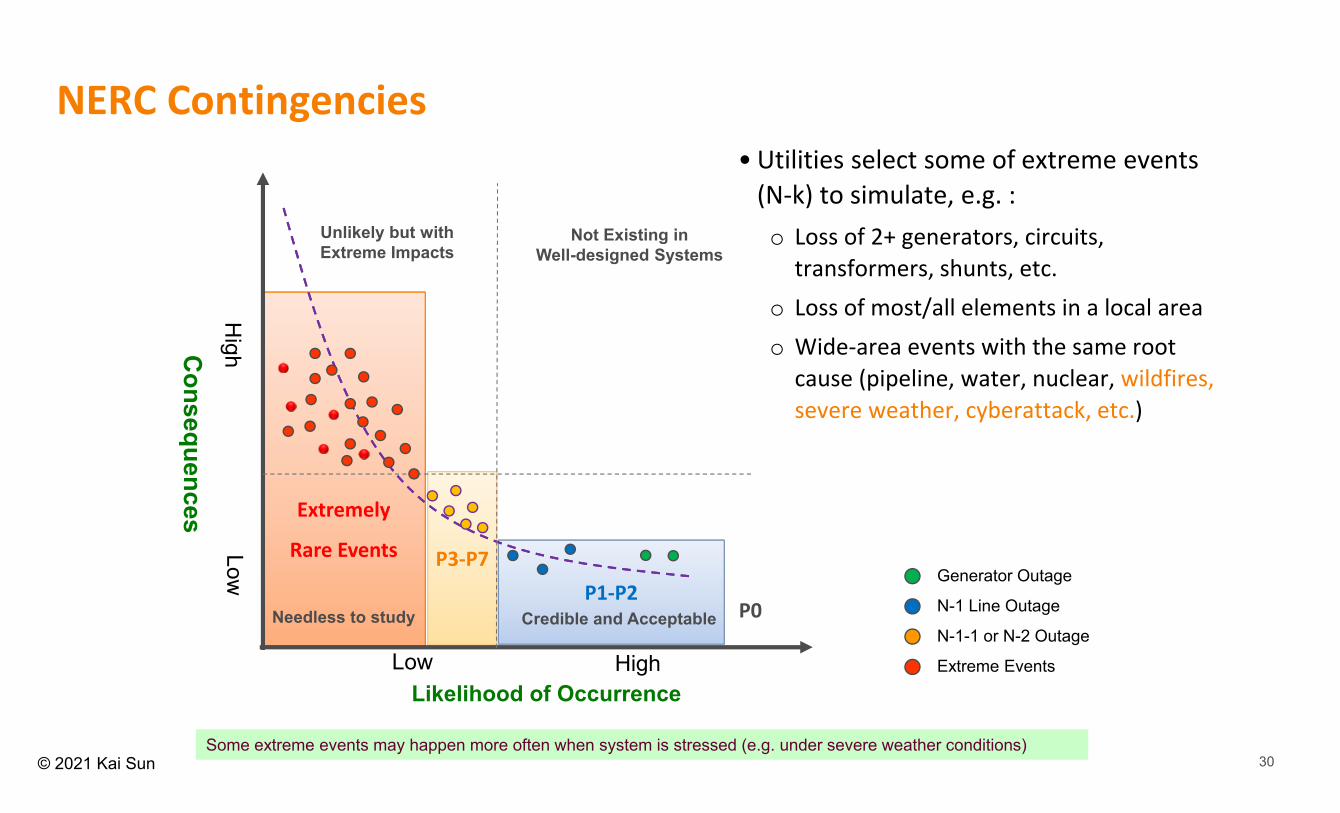
NERC Contingencies• Utilities select some of extreme events (N‐k) to simulate, e.g. :o Loss of 2+ generators, circuits,
transformers, shunts, etc.o Loss of most/all elements in a local areao Wide‐area events with the same root
cause (pipeline, water, nuclear, wildfires, severe weather, cyberattack, etc.)
Likelihood of Occurrence
Consequences
Needless to study
Not Existing in Well-designed Systems
Generator Outage
N-1 Line Outage
N-1-1 or N-2 Outage
Extreme Events
Some extreme events may happen more often when system is stressed (e.g. under severe weather conditions)
Unlikely but with Extreme Impacts
HighLow
High
Low
31© 2021 Kai Sun
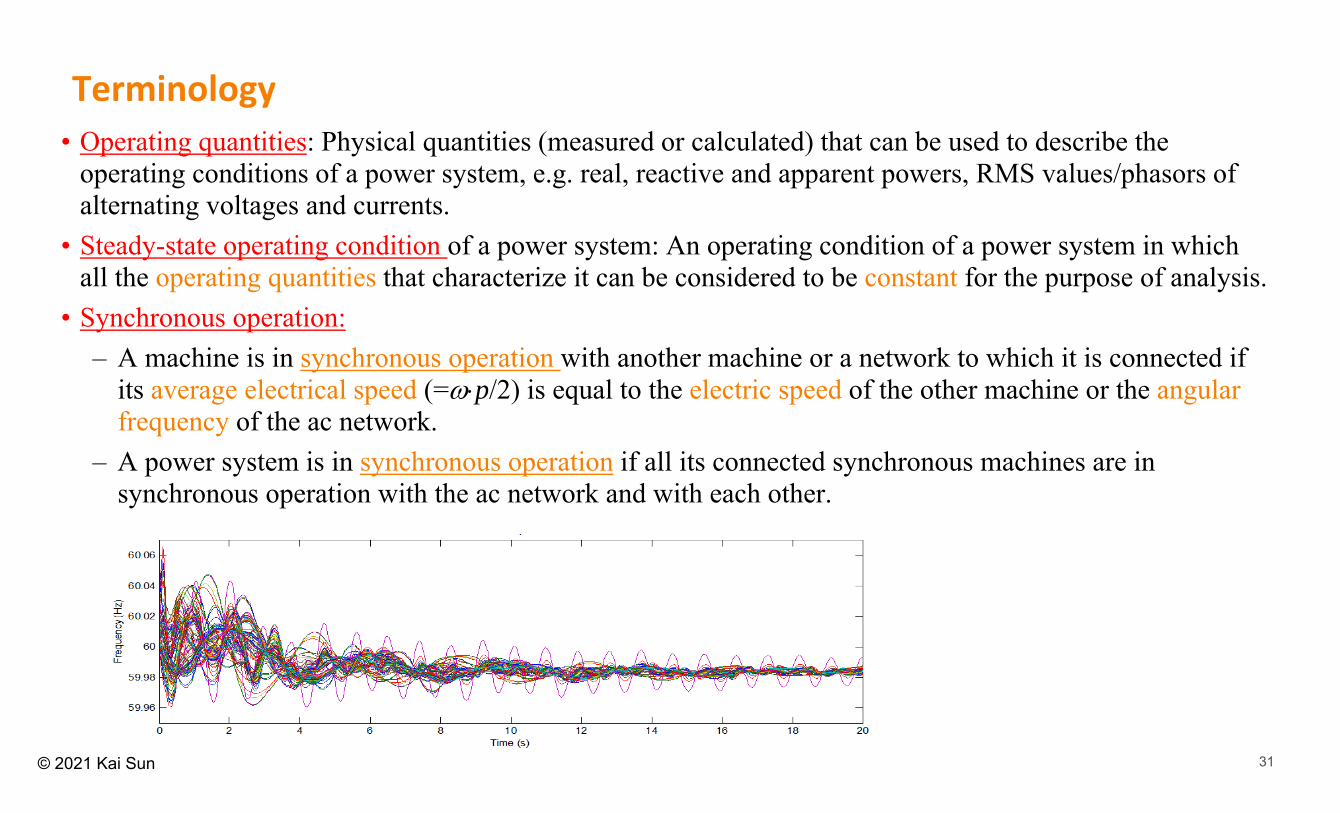
Terminology• Operating quantities: Physical quantities (measured or calculated) that can be used to describe the
operating conditions of a power system, e.g. real, reactive and apparent powers, RMS values/phasors of alternating voltages and currents.
• Steady-state operating condition of a power system: An operating condition of a power system in which all the operating quantities that characterize it can be considered to be constant for the purpose of analysis.
• Synchronous operation:– A machine is in synchronous operation with another machine or a network to which it is connected if
its average electrical speed (=p/2) is equal to the electric speed of the other machine or the angular frequency of the ac network.
– A power system is in synchronous operation if all its connected synchronous machines are in synchronous operation with the ac network and with each other.

32© 2021 Kai Sun
Stability on a General Dynamical System
Assume origin x=0 is an equilibrium, i.e.
In other words, the system variable will stay in any given small region (<) around the equilibrium point once becoming close enough (<) to that point.
The equilibrium point x=0 is stable in the sense of Lyapunov
such that
x
• Lyapunov Stability: Consider a nonlinear dynamical system
• In mathematics, stability theory addresses the stability of solutions of a set of differential equations, or in other words, stability of trajectories of a dynamical system under small perturbations of an initial condition.

33© 2021 Kai Sun
Terminology (cont’d)
• Power system stability is the ability of a power system, for a given initial operating condition, to regain an acceptable state of operating equilibrium (either original or different) after being subjected to a disturbance– Stability of a power system is concerned on the state variables that are defined.– Considering an interconnected, multi-machine power system as a whole
• its conventional stability problem is mainly to maintain synchronous operation of all synchronous machines (generators or motors)
– Considering parts of the system• A particular generator or group of generators may lose stability (synchronism)
and then be disconnected without causing instability of the main system. • Motors in particular loads may lose stability (stalling) without causing
instability of the main system.
34© 2021 Kai Sun
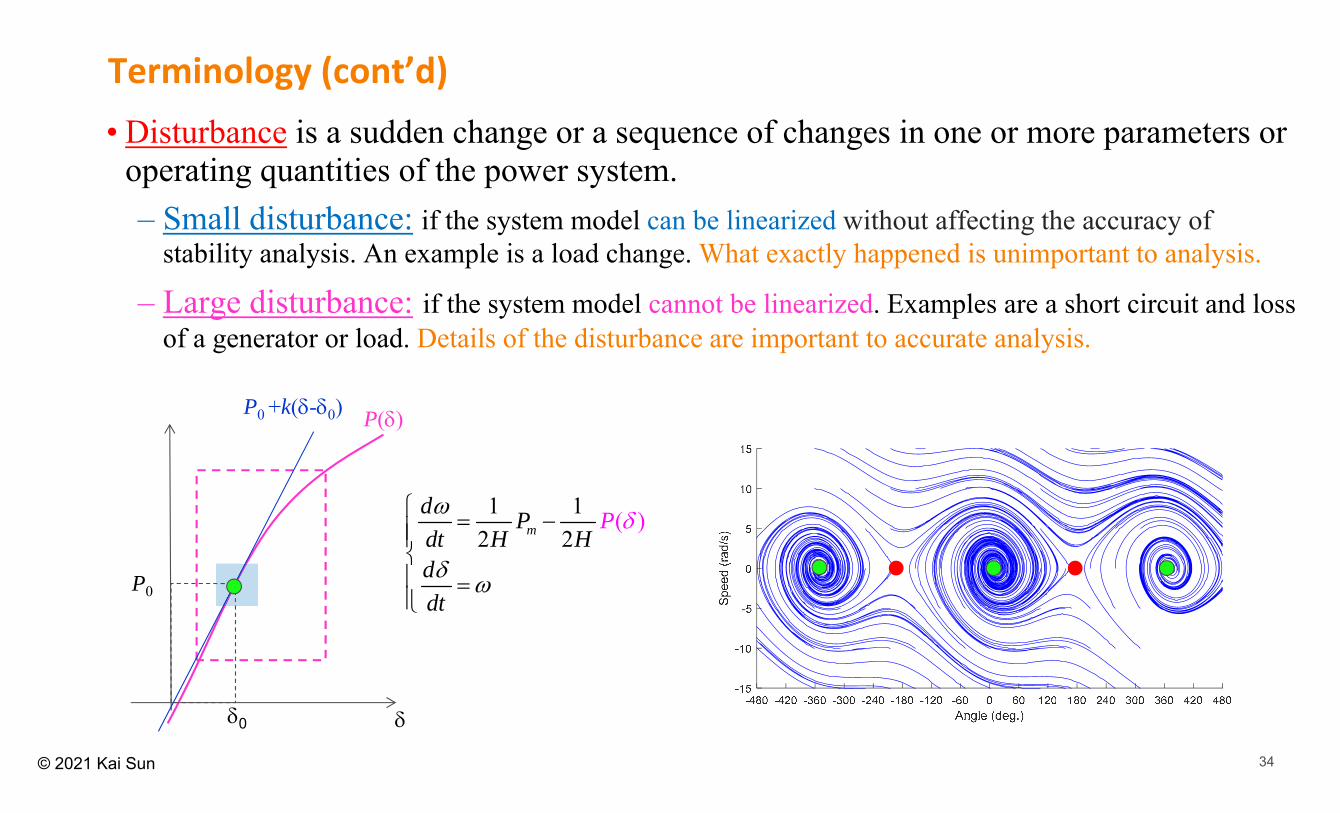
Terminology (cont’d)• Disturbance is a sudden change or a sequence of changes in one or more parameters or
operating quantities of the power system. – Small disturbance: if the system model can be linearized without affecting the accuracy of
stability analysis. An example is a load change. What exactly happened is unimportant to analysis.
– Large disturbance: if the system model cannot be linearized. Examples are a short circuit and loss of a generator or load. Details of the disturbance are important to accurate analysis.
0
P0
P()
( )1 12 2
md Pdt
PH H
ddt
P0 +k(-0)

35© 2021 Kai Sun
• In designing and operating an interconnected power system, its dynamic performance subjected to changes (i.e. contingencies, either small or large) is considered.
• It is important that when the changes are completed, the system settles to a new operating condition without violation of constraints.
• In other words, not only should the new operating condition be acceptable (as revealed by steady-state analysis) but also the system must survive the transition to the new condition. This requires dynamic analysis.
Why dynamic analysis
36© 2021 Kai Sun
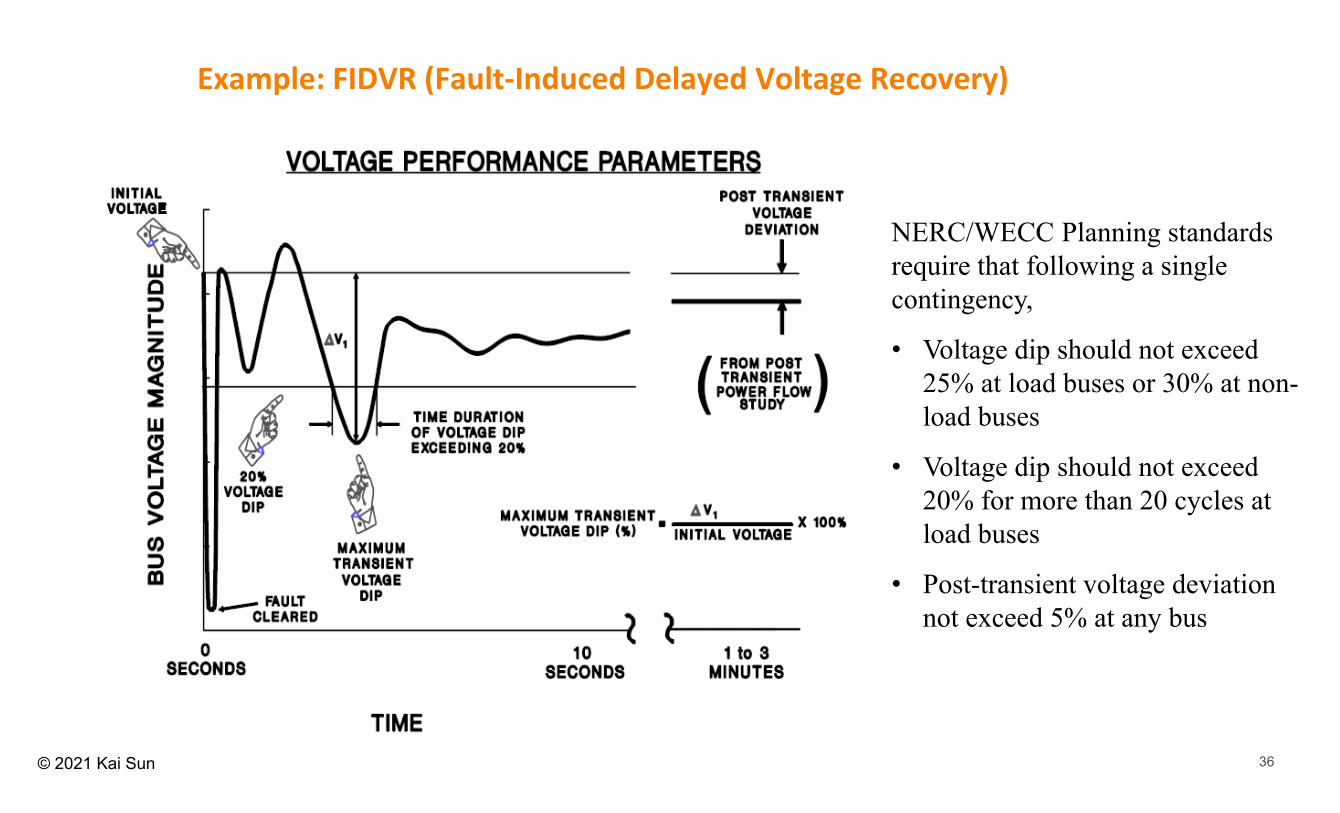
Example: FIDVR (Fault‐Induced Delayed Voltage Recovery)
NERC/WECC Planning standards require that following a single contingency,
• Voltage dip should not exceed 25% at load buses or 30% at non-load buses
• Voltage dip should not exceed 20% for more than 20 cycles at load buses
• Post-transient voltage deviation not exceed 5% at any bus
37© 2021 Kai Sun
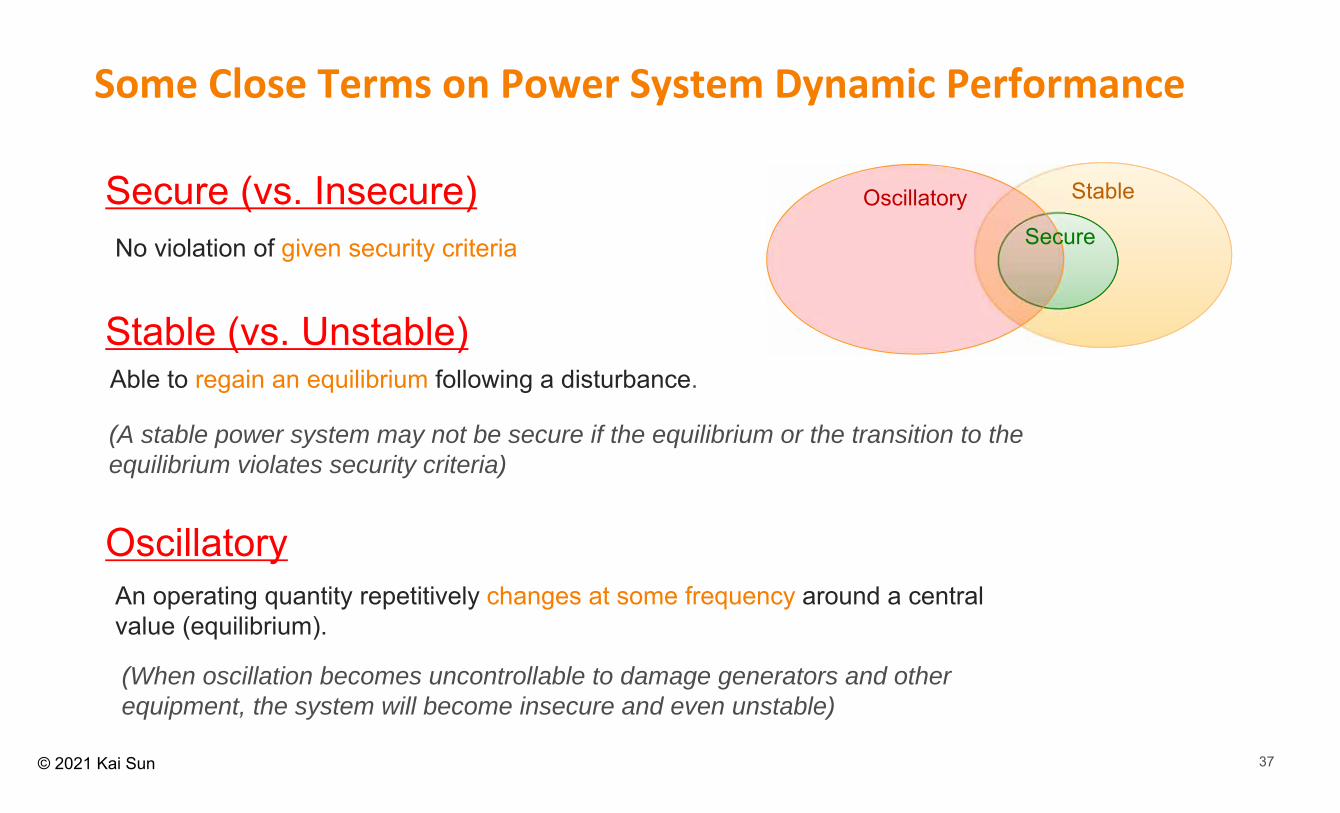
Some Close Terms on Power System Dynamic Performance
Secure (vs. Insecure)
Stable (vs. Unstable)
Oscillatory
No violation of given security criteria
Able to regain an equilibrium following a disturbance.
An operating quantity repetitively changes at some frequency around a central value (equilibrium).
(A stable power system may not be secure if the equilibrium or the transition to the equilibrium violates security criteria)
(When oscillation becomes uncontrollable to damage generators and other equipment, the system will become insecure and even unstable)
Stable
Secure
Oscillatory
38© 2021 Kai Sun
Classification of Power System Stability
• Power system stability is essentially a single, nonlinear system stability problem.
• However, the various forms of instabilities that a power system may undergo cannot be properly understood and effectively dealt with by treating it as a single problem.
• Because of high dimensionality and complexity of stability problems, it helps to make simplifying assumptions to analyze specific types of problems using an appropriate degree of detail of system representation and appropriate analytical techniques.
• Analysis of stability, including identifying key factors that contribute to instability and devising methods of improving stable operation, is greatly facilitated by classification of stability into appropriate categories
39© 2021 Kai Sun
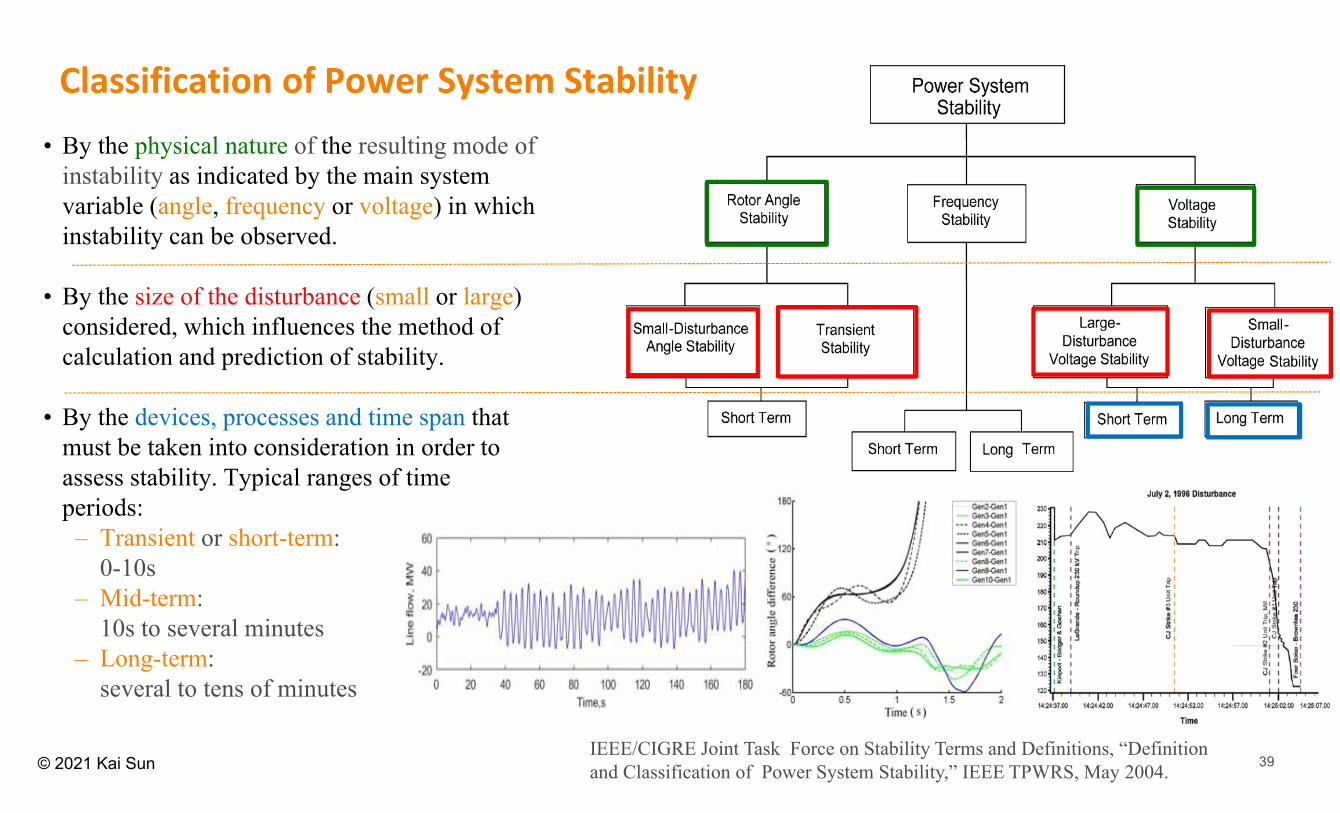
• By the physical nature of the resulting mode of instability as indicated by the main system variable (angle, frequency or voltage) in which instability can be observed.
• By the size of the disturbance (small or large) considered, which influences the method of calculation and prediction of stability.
• By the devices, processes and time span that must be taken into consideration in order to assess stability. Typical ranges of time periods:– Transient or short-term:
0-10s– Mid-term:
10s to several minutes– Long-term:
several to tens of minutes
IEEE/CIGRE Joint Task Force on Stability Terms and Definitions, “Definition and Classification of Power System Stability,” IEEE TPWRS, May 2004.
Classification of Power System Stability
40© 2021 Kai Sun
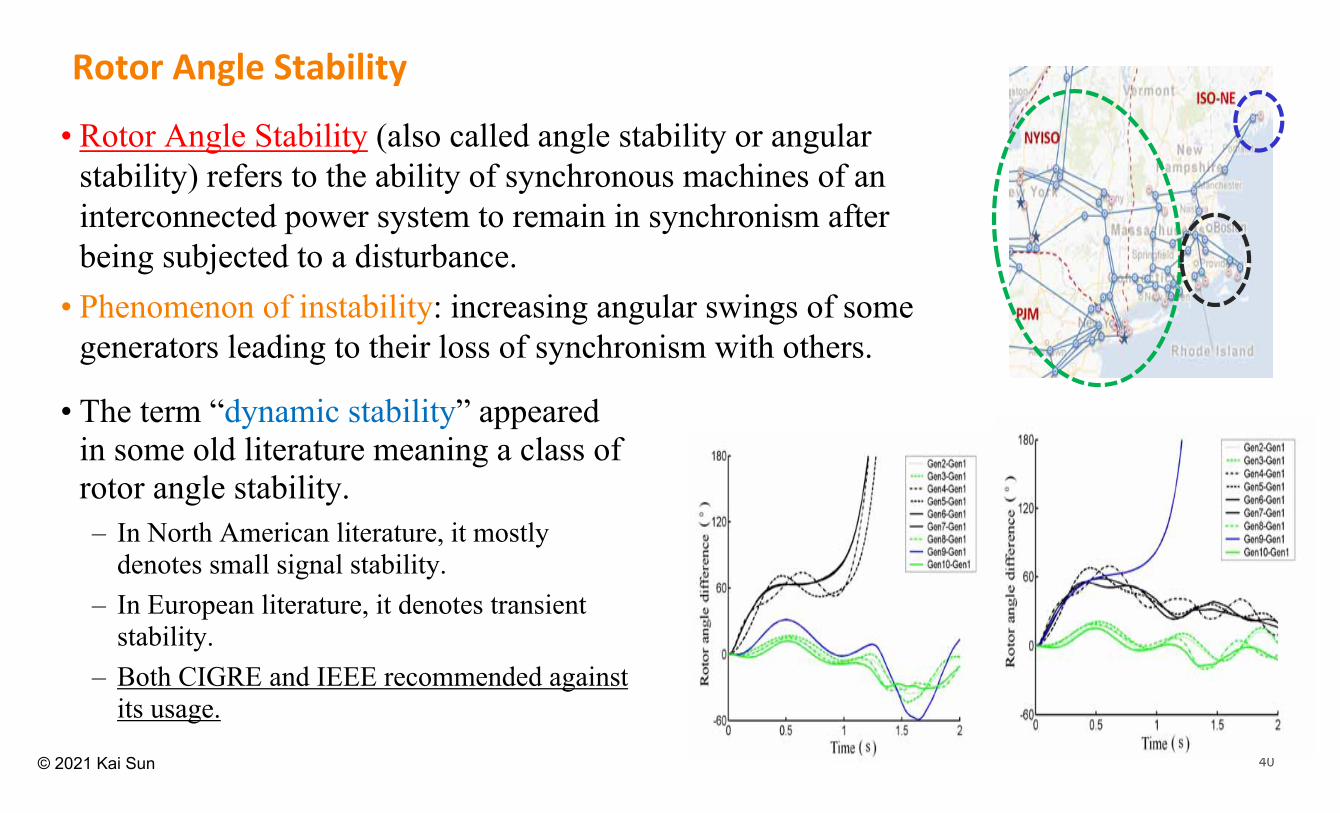
Rotor Angle Stability
• Rotor Angle Stability (also called angle stability or angular stability) refers to the ability of synchronous machines of an interconnected power system to remain in synchronism after being subjected to a disturbance.
• Phenomenon of instability: increasing angular swings of some generators leading to their loss of synchronism with others.
• The term “dynamic stability” appeared in some old literature meaning a class of rotor angle stability.– In North American literature, it mostly
denotes small signal stability.– In European literature, it denotes transient
stability.– Both CIGRE and IEEE recommended against
its usage.

41© 2021 Kai Sun
Rotor Angle Stability (cont’d)
• Rotor angle stability depends on the ability to maintain/restore equilibrium between the mechanical torque (controlled) and electromagnetic torque (somehow uncontrolled subject to the load) of each synchronous machine in the system.
• For a simple power system having only one generator tied to a load bus, only when both sides have rotating mass, rotor angle stability can be a concern.
42© 2021 Kai Sun
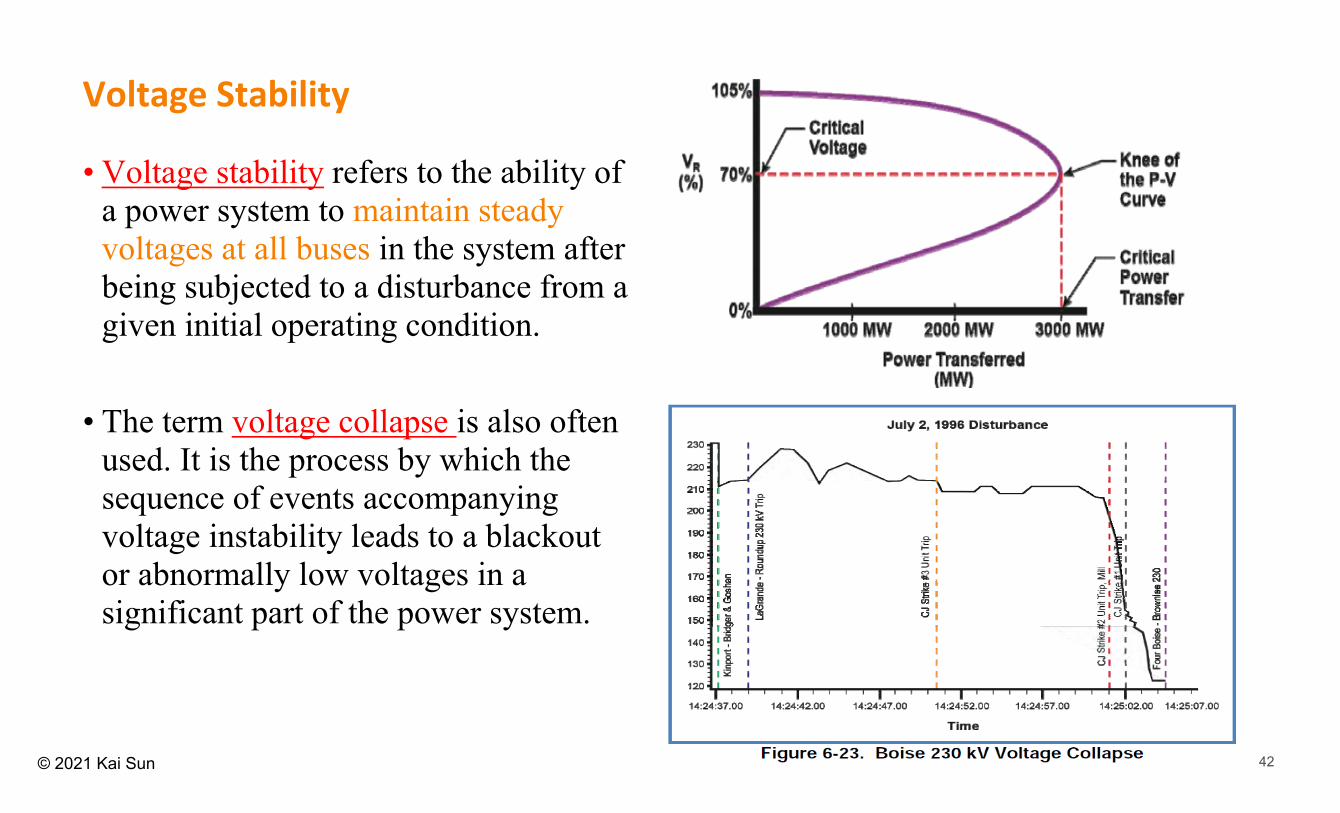
Voltage Stability
• Voltage stability refers to the ability of a power system to maintain steady voltages at all buses in the system after being subjected to a disturbance from a given initial operating condition.
• The term voltage collapse is also often used. It is the process by which the sequence of events accompanying voltage instability leads to a blackout or abnormally low voltages in a significant part of the power system.
43© 2021 Kai Sun
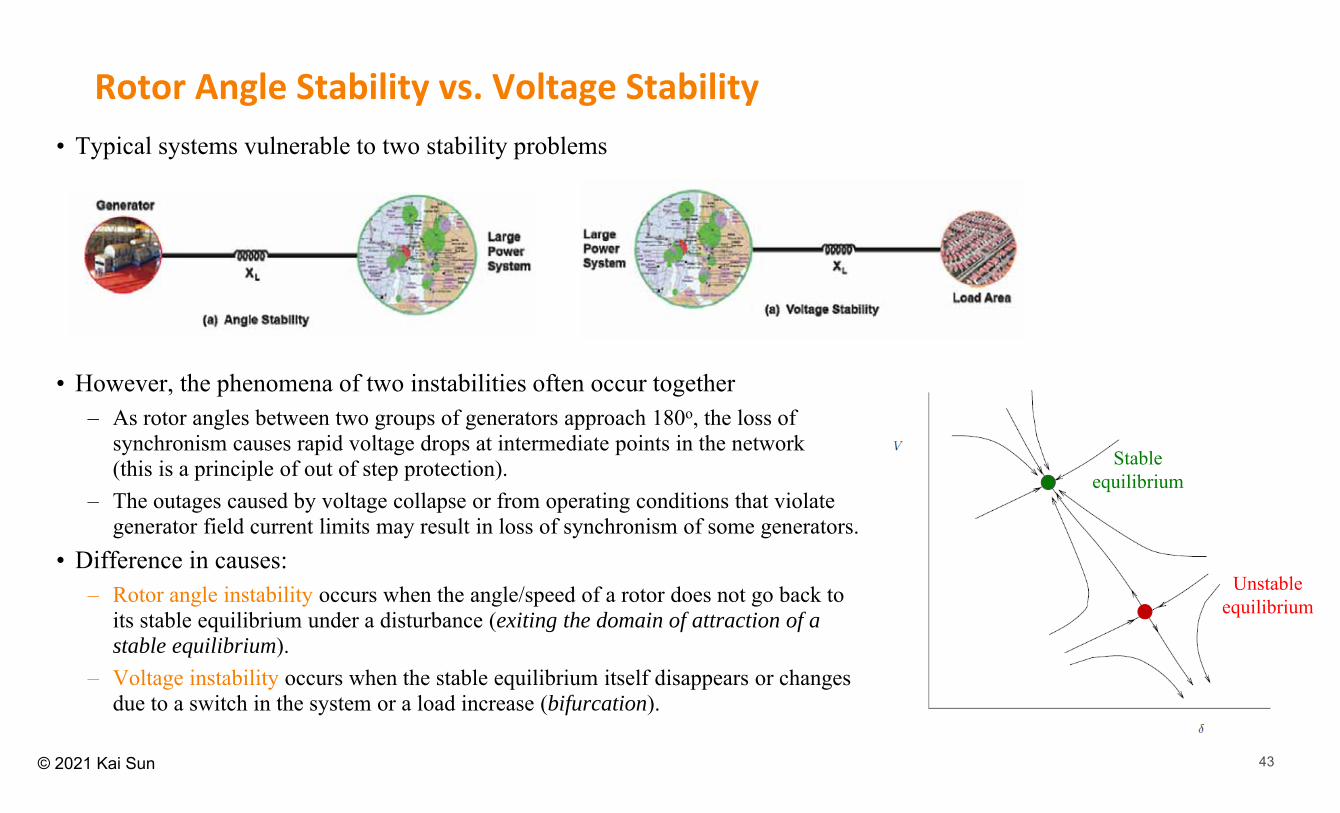
Rotor Angle Stability vs. Voltage Stability• Typical systems vulnerable to two stability problems
• However, the phenomena of two instabilities often occur together– As rotor angles between two groups of generators approach 180o, the loss of
synchronism causes rapid voltage drops at intermediate points in the network (this is a principle of out of step protection).
– The outages caused by voltage collapse or from operating conditions that violate generator field current limits may result in loss of synchronism of some generators.
• Difference in causes:– Rotor angle instability occurs when the angle/speed of a rotor does not go back to
its stable equilibrium under a disturbance (exiting the domain of attraction of a stable equilibrium).
– Voltage instability occurs when the stable equilibrium itself disappears or changes due to a switch in the system or a load increase (bifurcation).
Stable equilibrium
Unstable equilibrium
44© 2021 Kai Sun
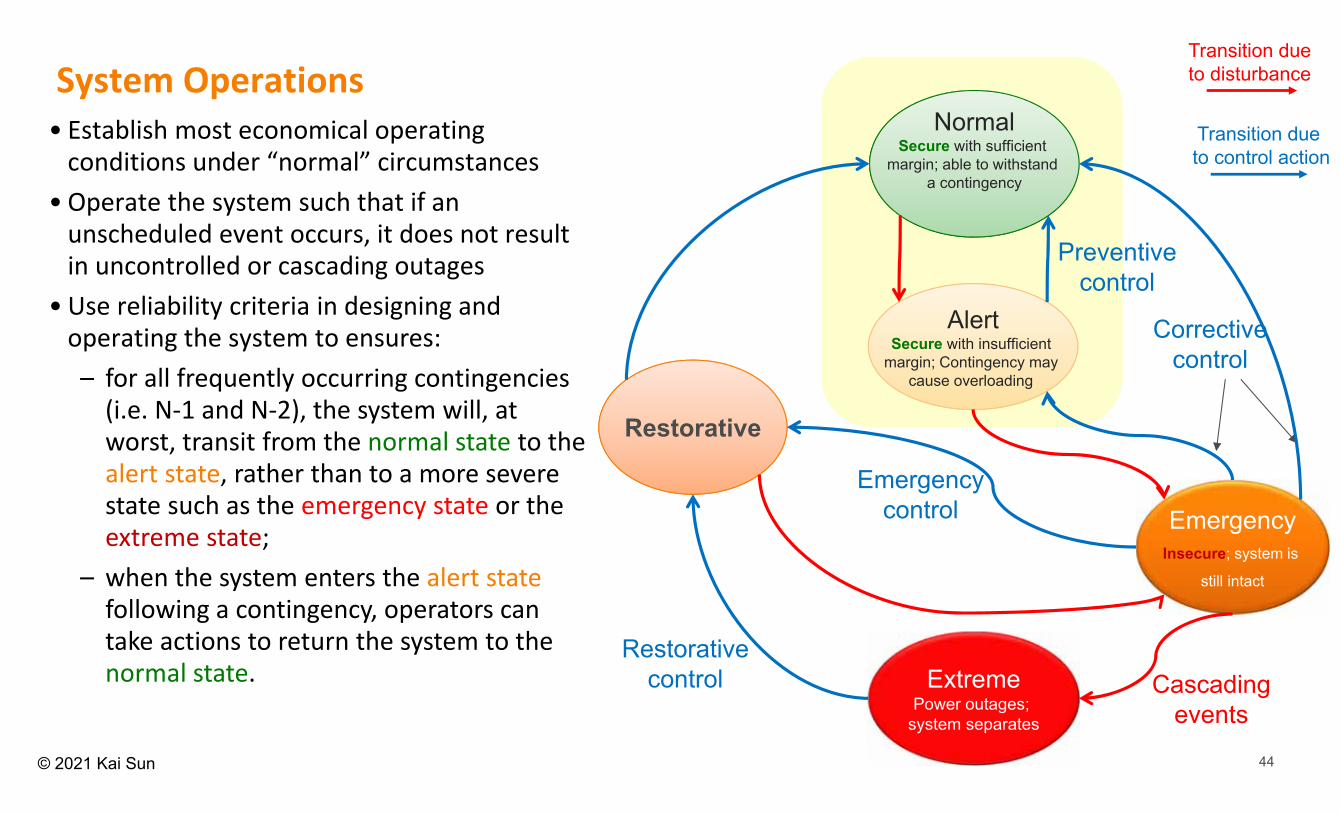
NormalSecure with sufficient
margin; able to withstand a contingency
AlertSecure with insufficient
margin; Contingency may cause overloading
EmergencyInsecure; system is
still intact
Restorative
Preventivecontrol
Correctivecontrol
Emergencycontrol
Restorativecontrol
Transition due to control action
Transition dueto disturbance
ExtremePower outages;
system separates
Cascading events
System Operations• Establish most economical operating conditions under “normal” circumstances
• Operate the system such that if an unscheduled event occurs, it does not result in uncontrolled or cascading outages
• Use reliability criteria in designing and operating the system to ensures:– for all frequently occurring contingencies (i.e. N‐1 and N‐2), the system will, at worst, transit from the normal state to the alert state, rather than to a more severe state such as the emergency state or the extreme state;
– when the system enters the alert state following a contingency, operators can take actions to return the system to the normal state.

45© 2021 Kai Sun
Structure of a Power System and Associated Controls