Embed Size (px)
DESCRIPTION
Citation preview
Economic Commission for Africa African Development BankAfrican Union
FONDS AFRICAIN DE DEVELOPPEMEN
T
AFR
ICAN DEVELOPMENT FUND
BAN
QUE
A
FRICAINE DE DEVELOPPEMENT
Assessing Regional Integration in Africa VTowards an African Continental Free Trade Area
© United Nations Economic Commission for Africa, 2012Addis Ababa, Ethiopia
All rights reservedFirst printing June 2012
Sales No.: E.12.II.K.1ISBN-13: 978-92-1-125117-3e-ISBN-13: 978-92-1-055278-3
Material in this publication may be freely quoted or reprinted. Acknowledgement is requested, together with a copy of the publication.
Designed by Phoenix Design Aid A/S, Denmark. ISO 14001/ISO 9000 certified and approved CO2 neutral company – www.phoenixdesignaid.dk.
Printed by the UNECA Documents Publishing Unit, Addis Ababa.
Cover Photos: Stock.xchng/Herman Brinkman, Darias Martin, Robert Linder, Robert Parzychowski, Ehsan Namavar, Ilker, Antonella Falbo, Matteo Canessa, Abcdz2000, John Nyberg, Petr Vins, UN Photo/Martine Perret, UN Photo/Tim McKulka, Dawit Tesfaye.
Ordering informationTo order copies of Assessing Regional Integration in Africa (ARIA V): Towards an African Continental Free Trade Area by the Economic Commission for Africa, please contact:
Publications:Economic Commission for AfricaP.O. Box 3001Addis Ababa, Ethiopia
Tel: +251 11 544-9900Fax: +251 11 551-4416E-mail: [email protected]: www.uneca.org
Acronyms ix
Regional Economic Communities Recognized by the African Union xi
Acknowledgements xiii
Foreword xv
Highlights 1
Chapter One: Introduction 11
Chapter Two: Overview of Regional Integration in Africa 132.1 Assessing regional integration 142.2 Status in selected RECs 14 2.2.1 Community of Sahel-Saharan States (CEN-SAD) 14 2.2.2 Common Market for Eastern and Southern Africa (COMESA) 15 2.2.3 East African Community (EAC) 16 2.2.4 Economic Community of Central African States (ECCAS) 17 2.2.5 Economic Community of West African States (ECOWAS) 17 2.2.6 Inter-Governmental Authority on Development (IGAD) 18 2.2.7 Southern African Development Community (SADC) 182.3 Direction of trade among the RECs 19 2.3.1 Exports 19 2.3.2 Imports 202.4 Challenges for regional integration 202.5 Initiatives to overcome some of the challenges 21 2.5.1 Some notable initiatives 21 2.5.2 COMESA–EAC–SADC 21 2.5.3 Minimum Integration Programme 212.6 Conclusions and recommendations 23Annex 24A2.1 First Phase of the Minimum Integration Programme, 2009–2012 24Bibliography 26
Contents
iv Assessing Regional Integration in Africa (ARIA V): Towards an African Continental Free Trade Area
Chapter Three: The Theory of Free Trade Areas: The Case for an African Continental Free Trade Area 293.1 Theoretical perspectives on potential gains and losses from FTAs 30 3.1.1 Static effects: trade creation and trade diversion 30 3.1.2 Dynamic effects 313.2 Prevailing conditions, benefits and challenges 32 3.2.1 Prevailing conditions 32 3.2.2 Benefits of the CFTA 34 3.2.3 The challenges 353.3 Conclusion 36References 36
Chapter Four: The African Continental Free Trade Area: An Empirical Analysis 394.1 Economic effects of the CFTA 404.2 Conclusion 41Annexes 42 A4.1 Methodology 42 A4.2 Economic impacts of the Continental Customs Union to be established
by 2019 49References 52
Chapter Five: Perspectives for Fast-tracking an African Continental Free Trade Area 555.1 Guiding Principles 56 5.1.1 Liberalizing trade in goods 56 5.1.2 Ensuring trade-related protection 56 5.1.3 Liberalizing trade in services 57 5.1.4 Cross-cutting issues 575.2 Key steps to consider 58 5.2.1 Background technical work 58 5.2.2 Developing negotiating principles and guidelines and launching
the negotiations 58 5.2.3 Drafting the CFTA protocol and related Annexes 58 5.2.4 Expert group meetings 59 5.2.5 Launching the negotiations 59 5.2.6 Finalizing the agreement and bringing it into force 59References 59
v
Chapter Six: Movement of People and the Right of Residence and Establishment 616.1 Integrating factor markets 626.2 Protocols on temporary immigration 64 6.2.1 Labour policies in RECs 64 6.2.2 Mutual recognition of certificates 65 6.2.3 Challenges for the free movement of labour 656.3 Trends in permanent immigration 656.4 Protocols and regulations 686.5 Other regional initiatives 706.6 Challenges of permanent immigration and free movement of people 71 6.6.1 Non-security concerns 71 6.6.2 Security concerns 72 6.6.3 Measures to relieve security concerns 726.7 Conclusions and recommendations 73References 74
Chapter Seven: Movement of Goods and Services in Africa 777.1 Comparison of trade policies 77 7.1.1 Tariff liberalization and time-frames in the RECs’ FTAs 78 7.1.2 NTBs 81 7.1.3 Rules of origin 81 7.1.4 Safeguards 82 7.1.5 Areas of convergence and divergence 837.2 Assessing intra-African trade by country 837.3 Commodity structure of selected RECs’ merchandise trade 897.4 Infrastructure 95 7.5.1 Issues 95 7.5.2 RECs’ initiatives 977.6 Trade facilitation 102 7.6.1 Regional programmes 103 7.6.2 Gains from trade facilitation 1067.7 Identifying trade opportunities in Africa 1067.8 Conclusion 111Annex 111A7.1 Scope of trade complementarity 111Regional orientation index 112Trade complementarity among African countries 113Revealed comparative advantage and complementarity indices 116References 120
vi Assessing Regional Integration in Africa (ARIA V): Towards an African Continental Free Trade Area
Chapter Eight: Movement of Investment and Capital in Africa 1238.1 What prompts FDI? 124 8.1.1 Cross-border competitive advantages 124 8.1.2 Economic determinants of FDI 125 8.1.3 Motives for FDI 125 8.1.4 Modes of FDI 1268.2 Types, sizes and trends of cross-border investment and capital flows 127 8.2.1 Inflows to Africa 127 8.2.2 Intra-African flows 1288.3 Improving intra-African movement of investment and capital 131 8.3.1 International investment agreements and investment-specific policy
measures 131 8.3.2 Macro-economic environment 134 8.3.3 Financial market development 134 8.3.4 Business environment 1378.4 Conclusions and recommendations 137 8.4.1 Rationalizing IIAs 138 8.4.2 Improving macro-economic performance and harmonizing policies 138 8.4.3 Developing and integrating regional financial markets 138 8.4.4 Improving the business environment 138Annex 140A8.1 A roadmap for regional financial integration 140References 142
Tables
Table 2.1 Africa’s integration process 15Table 2.2 Destination of Africa REC exports, average 2000–2009, per cent
of world total 19Table 2.3 Sources of Africa REC imports, average 2000–2009, per cent of world total 20Table A2.1 First Phase of the Minimum Integration Programme, 2009–2012 24Table 3.1 Features of regional integration 29Table 3.2 Trade within continents, 2009 (per cent of total trade) 32Table 3.3 Commodity structure of African exports (per cent) 33Table 3.4 Average export and import times (days) 33Table 3.5 Intra-REC trade as a share of total African trade, 2004 35Table 4.1 Protection and tariff revenues before and after trade reforms 41Table 4.2 Changes in Africa’s export volumes by sector, relative to the baseline
scenario, 2022, per cent 42Table A4.1 Geographical decomposition 45Table A4.2 Sector decomposition 47
vii
Table A4.3 Average protection on African countries’ imports from and exports to Africa, 2004 48
Table A4.4 Changes in average protection and African imports and exports after establishment of a CCU as compared to a CFTA, 2022, per cent 51
Table 6.1 Estimates of immigrant populations in selected REC member states 67Table 6.2 Protocols and regulations for regional integration 68Table 7.1 Tariff reduction schedule for EAC, 2000 79Table 7.2 Tariff reduction schedule for ECCAS 80Table 7.3 Value of exports to and imports from Africa by each country, 2007–2009
(US$ million) 84Table 7.4 Africa’s share of total exports based on average exports, 1995–2009
(per cent) 87Table 7.5 COMESA trade with Africa and the world by product group (US$ million) 90Table 7.6 EAC trade with Africa and the world by product group (US$ million) 91Table 7.7 ECOWAS trade with Africa and the world by product group (US$ million) 92Table 7.8 SADC trade with Africa and the world by product group (US$ million) 93Table 7.9 UEMOA trade with Africa and the world by product group (US$ million) 94Table 7.10 African Action Plan priority infrastructure interventions, 2010–2015 96Table 7.11 Strategic water infrastructure projects, SADC 102Table 7.12 Potential trade opportunities for COMESA in Africa in 2010 (US$ million) 107Table 7.13 Potential trade opportunities for EAC in Africa in 2010 (US$ million) 108Table 7.14 Potential trade opportunities for ECOWAS in Africa in 2010 (US$ million) 109Table 7.15 Potential trade opportunities for SADC in Africa in 2010 (US$ million) 110Table A7.1 Regional orientation index for Africa 112Table A7.2 Merchandise trade matrix, imports, annual, 1995–2009: share of imports
from Africa in world imports 113Table A7.3 Revealed comparative advantage of African countries 116Table 8.1a Trade or FDI: factors underlying MNE choices 125Table 8.1b Trade or FDI: factors underlying MNE choices 125Table 8.2 Cross-border M&A, 1987–2008, and greenfield investment projects,
2003–2007, in Africa 130Table 8.3 Total and intra-regional FDI projects in Africa, cumulative 2003−2010 131Table 8.4 Capital market structures, sub-Saharan Africa 136
Figures
Figure 4.1 Changes in exports of African countries by origin, relative to the baseline scenario, 2022 (US$ billion) 41
Figure A4.1: Change in African exports by destination for CFTA and CCU scenarios with and without trade facilitation (TF) measures, relative to the baseline, 2022 51
Figure 7.1. Planned versus required capacity, SADC 99
viii Assessing Regional Integration in Africa (ARIA V): Towards an African Continental Free Trade Area
Boxes
Box 6.1 Visa requirements 62Box 6.2 Africa’s remittance gains 63Box 7.1 Africa’s spaghetti bowl 78Box 7.2 North–South Corridor 97Box 7.3 The COMESA Fund 100Box 7.4 AfDB infrastructure development interventions in Africa 105Box 8.1 Compiling data on investment and capital flows 129Box 8.2 The main features of African investment agreements 132Box 8.3 The spread of cross-border banking in Africa 135
Map
Map 3.1 Average applied protection on African countries’ imports from and exports to the rest of the world, 2004 34
Acronyms
ACP African, Caribbean and Pacific (group of countries)AfDB African Development BankAEC African Economic CommunityASEAN Association of Southeast Asian NationsASYCUDA Automated System of Customs DataAU African UnionAUC African Union CommissionBIT Bilateral Investment TreatyCCIA COMESA Common Investment AreaCEMAC Central African Economic and Monetary CommunityCEN-SAD Community of Sahel-Saharan StatesCEPGL Economic Community of the Great Lakes CountriesCOMESA Common Market for Eastern and Southern AfricaDTT Double Taxation TreatyEAC East African CommunityECA Economic Commission for AfricaECCAS Economic Community of Central African StatesECOWAS Economic Community of West African StatesEPA Economic Partnership AgreementEU European UnionFDI Foreign Direct InvestmentFTA Free Trade AreaGDP Gross Domestic ProductHS Harmonized Commodity Description Coding SystemICT Information and Communications TechnologyIGAD Inter-Governmental Authority on DevelopmentIIA International Investment ArrangementILO International Labour OrganizationIMF International Monetary FundIOC Indian Ocean Commission
ix
x Assessing Regional Integration in Africa (ARIA V): Towards an African Continental Free Trade Area
M&A Mergers and Acquisitions MIP Minimum Integration Programme MFN Most-Favoured NationMNE Multinational Enterprise MRU Mano River UnionNAFTA North American Free Trade AgreementNEPAD New Partnership for Africa’s DevelopmentOLI Ownership, Location and InternalizationPPP Public-Private PartnershipRIA Regional Investment AgreementREC Regional Economic CommunityREIA Regional Economic Integration ArrangementSACU Southern African Customs UnionSADC Southern African Development CommunitySAPP Southern African Power PoolSATCC Southern Africa Transport and Communications CommissionSIFP SADC Investment and Finance Protocol UEMOA West African Economic and Monetary UnionUMA Arab Maghreb UnionUNCTAD United Nations Conference on Trade and DevelopmentUNDP United Nations Development Pro grammeUNECA United Nations Economic Commission for AfricaUNHCR United Nations High Commission for RefugeesWTO World Trade Organization
xi
CEN-SAD: Benin, Burkina Faso, Cape Verde; Central African Republic, Comoros, Côte d’Ivoire, Chad, Djibouti, Egypt, Eritrea, Gambia, Ghana, Guinea-Bissau, Guinea, Kenya, Liberia, Libya, Mali, Mauritania, Morocco, Niger, Nigeria, São Tomé & Príncipe, Senegal, Sierra Leone, Somalia, Sudan, Togo, Tunisia.
COMESA: Burundi; Comoros; Democratic Republics of Congo; Djibouti; Egypt; Eritrea; Ethiopia; Kenya; Libya; Madagascar; Malawi; Mauritius; Rwanda; Seychelles; Sudan; Swaziland; Uganda; Zambia; Zimbabwe.
EAC: Burundi, Kenya, Rwanda, Tanzania, Uganda.
ECCAS: Angola; Burundi; Cameroon; Central African Republic; Chad; Democratic Republic of Congo; Equatorial Guinea; Gabon; Republic of Congo; São Tomé and Príncipe.
ECOWAS: Benin, Burkina Faso, Cape Verde, Côte d’Ivoire, Gambia, Ghana, Guinea, Guinea-Bissau, Liberia, Mali, Niger, Nigeria, Senegal, Sierra Leone, Togo.
IGAD: Djibouti; Eritrea; Ethiopia; Kenya; Somalia; Sudan; Uganda.
SADC: Angola; Botswana; Democratic Republic of Congo; Lesotho; Madagascar; Malawi; Mauritius; Mozambique; Namibia; Seychelles; South Africa; Swaziland; Tanzania; Zambia; Zimbabwe.
UMA: Algeria, Libya, Mauritania, Morocco, Tunisia.
Regional Economic Communities Recognized by the African Union

xiii
ARIA V is a joint publication of the United Nations Economic Commission for Africa (UN-ECA), the African Union Commission (AUC) and the African Development Bank (AfDB) prepared by a team of staff members under the general direction of the heads of the three
institutions—Jean Ping, AUC Chairperson; Abdoulie Janneh, United Nations Under Secretary General and UNECA Executive Secretary; and Donald Kaberuka, President of the AfDB.
The UNECA Team was composed mainly of staff members of the Regional Integration, Infrastructure and Trade Division (RITD) under the overall technical supervision of Stephen Karingi, Director of the Division, and Joseph Atta-Mensah, his predecessor. The following experts in the Division constituted the core team of the work on ARIA V: Daniel Tanoe (who coordinated the substantive work and the overall production process of ARIA V), Emmanuel Chinyama, Simon Mevel, Dawit Tesfaye and Ousman Aboubakar Mahamat.
Others in the Division who provided assistance are Wilfred Lombe, Alan Kyerematen, Marie-Thérese Guiebo, Laura Paez, Amal Elbeshbishi, Malcome Spence, Mongameli Mehlwana, Mkhululi Ncube, Jane Karonga, Deresse Degefa, Aster Gebremariam, Tarik Kassa, and Dinknesh Assefa. Adminis-trative Assistant Mulumebet Arega and other support staff (Mekdes Kassa, Elleni Hamawi, Elleni Negash, Haimanot Assefa, Tiblet Tesfaye, Zewdnesh Mesfin, Wondimu Haile and Benyam Bisrat) provided very valuable secretarial and administrative support throughout the production process.
Under the overall supervision and guidance of the AU Commissioner for Economic Affairs, Max-well Mkwezalamba, the Team from the AUC comprised Rene Kouassi, Charles Awitor, Manasseh Nataganda, Swaleh Islam, Fliss Liwaadine and Victoria Foster-Jones. The Team from the AfDB comprised Alex Rugamba and Lamine Manneh. The publication benefited from very solid technical inputs from Oludele Akinboade, Moses Tekere and Michael Mahmoud.
The publication was subject to peer reviews provided by UNECA Directors of Division and their staff. It also benefited from an external review meeting convened in Addis Ababa, Ethiopia. Besides staff from UNECA, AUC and AfDB, the following representatives from RECs and other organizations participated in the external review: Francis Mangeni from the Common Market for Eastern and Southern Africa (COMESA); Elsadig Abdalla from the InterGovernmental Authority on Develop-ment (IGAD); Christian Sambia from the Economic Community of Central African States (ECCAS); Tekpa André Guy-Sinclair from the Economic and Monetary Community of Central African States
Acknowledgements
xiv Assessing Regional Integration in Africa (ARIA V): Towards an African Continental Free Trade Area
(CEMAC); Gilbert Boois from Walvis Bay Corridor Group (WBCG); Melchior Barantandikiye from the Central Cor-ridor Transit Transportation Facilitation; Kebela Patrick from the Transit Transport Coordination Authority of the Northern Corridor; Yaya Yedan from the Burkina Shippers Council in Ghana; Peter Lunenborg from the South Center; Barbara Mommen from the Maputo Cor-ridor Logistics Initiative (MCLI); Rukankama Jean from the East Africa Global Business Solutions; Tamar Bello from the Department for International Development (DFID); Jorge Gallego Lizon from the European Union Representative Office to the African Union; Dan Lui from the European Centre for Development and Policy Management (ECDPM); Mwangi S. Kimenyi from the Brookings Institute; Andrew Roberts from the World Bank; Abraham Gebregiorgis from the World Health
Organization; Naomi Shiferaw from the International Organization for Migration; and Isidore Kahoui from the UNECA Subregional Office for Central Africa (SRO-CA).
Staff of the UNECA Publication and Conference Man-agement Services, in particular Etienne Kabou, Marcel Ngoma-Mouaya, Charles Ndugu, Teshome Yohannes,and Henock Legesse provided useful logistics and oversight support in the translation printing and distribution of the report.
Finally, Bruce Ross-Larson and his team from Commu-nications Development Incorporated, in Washington, DC, provided instrumental assistance in professionally editing the report.
xv
African Union Heads of State and Government have adopted and are pursuing regional in-tegration as an overarching continental development strategy. The vision at the continental level is to achieve an African Economic Community (AEC) as the last of six successive stages
that involve the strengthening of sectoral cooperation and establishment of regional free trade areas (FTAs), a continental customs union, a common market, and a monetary and economic union. The rationale behind this phased approach is that the integration vision should be first consolidated at regional level, through creating and strengthening the regional economic communities (RECs), which would eventually merge into the AEC.
African leaders and stakeholders are more than ever keen to accelerate progress towards the AEC through increased inter-REC harmonization and convergence initiatives, such as the COMESA–EAC–SADC tripartite FTA. This FTA brings together 26 African countries, with a combined popula-tion of 530 million people, and a total gross domestic product of US$ 630 billion, representing over 50 per cent of Africa’s economic output. This initiative has indeed galvanized interest of Africa’s policymakers towards a much broader continental FTA. Accordingly, the African Union Summit, at its 18th Assembly held in Addis Ababa in January 2012, decided to fast-track the establishment of an African continental FTA by an indicative date of 2017 and implement a comprehensive action plan to boost intra-African trade.
The creation of a single continental market for goods and services, with free movement of business people and investments, will help bring closer the continental customs union and African common market. It will help turn the 54 single African economies into a more coherent large market. Mak-ing use of complementarities and collectively exploiting Africa’s rich reservoir of land and natural endowments—to create larger, more viable internal economic spaces—it could allow Africa’s markets to work more efficiently. The single market will also help expand intra-African trade through bet-ter harmonizing and coordinating trade liberalization and facilitation regimes among RECs and throughout Africa. Finally, it will help to resolve the challenges of multiple and overlapping REC memberships and to address the disconnect between contiguous RECs, thus unlocking the inter-REC trade potential across the continent.
The fifth in the series, this publication—ARIA V—comes at a time of renewed enthusiasm to shorten the period for attaining the vision of the Abuja Treaty. In this perspective the Pan-African Parliament
Foreword
xvi Assessing Regional Integration in Africa (ARIA V): Towards an African Continental Free Trade Area
Abdoulie Janneh
Executive SecretaryEconomic Commission for Africa
Jean Ping
ChairpersonAfrican Union Commission
Donald Kaberuka
PresidentAfrican Development Bank
was established earlier than envisaged in the said treaty and moves to set up other key continental institutions—the African Investment Bank, the African Monetary Fund and the African Central Bank—are being accelerated.
It is in this spirit of accelerating integration that the es-tablishment of the continental FTA needs to be perceived. According to a recent AUC study on the acceleration of the Abuja Treaty, the continental customs union is to come into effect in 2012 and the AEC by 2017. These dates have however been overtaken by recent develop-ments, in particular the January 2012 AU Summit Deci-sion to fast track the establishment of the continental FTA by the indicative date of 2017. The establishment of the continental FTA does compel all RECs both within and outside the COMESA-SADC-EAC Tripartite initiative to redouble their efforts to become full-fledged FTAs by 2014. Although RECs have made encouraging efforts to move ahead with the first stage of the Abuja Treaty by adopting staged elimination of their tariffs on internal trade, they have shown some variations in performance: some RECs are still struggling to set up their FTAs, while others are either partial FTAs or partial customs unions. The pace of progress is not uniform, and given the overlaps of RECs and their membership, strategic decisions and
actions are imperative to ensure that the RECs move in tandem towards the continental FTA as a prelude to the continental customs union, the common market, and to the ultimate goal of the AEC.
ARIA V provides a timely analysis of how various steps are accelerating the continental FTA, and the tangential tasks of removing all obstacles to the free movement of goods, services, people, investment and capital across the continent. It shows that the continental FTA needs to be boosted by efforts to establish viable transport networks and enhanced trade-facilitation measures across the conti-nent, and thus contribute to lower costs of production and marketing of goods and services. Similarly, the continental FTA has to be supported by integrated energy resources, by harmonized investment, tax and tariff codes, by other behind-the-border procedures as well as by an improved economic environment through adherence to common standards of sound macro-economic management. A continental FTA can only be meaningful if policymak-ers also give due consideration to these enabling factors.
We commend this publication as a technical contribution to the roadmap and architecture for fast-tracking the establishment of the continental FTA.
1
Interregional coordination is growing. COMESA, EAC and SADC held their first Tripartite Summit in October 2008, where the Heads of State and Government of the three RECs agreed to establish a Free Trade Area (FTA). This Tripartite FTA brings together 26 African countries,
with a combined population of 530 million people, and a total GDP of USD 630 billion, or more than half of the output of Africa’s economies. It has galvanized the interest of Africa’s policymakers towards a much broader Continental FTA. Accordingly, the African Union Ministers of Trade, at their 6th Ordinary Session in Kigali in November 2010, recommended fast-tracking the establish-ment of an African Continental Free Trade Area (C-FTA).
One of the main challenges facing Africa’s Regional Economic Communities (RECs) in implementing their integration programmes is overlapping membership. Consider the case of COMESA, EAC and SADC. EAC is already a common market, but it shares four member States with COMESA and one Member State with SADC. Five SADC member States are members of Southern African Customs Union (SACU). Ten countries in the region are already members of customs unions, but all of them are also in negotiations to establish alternative customs unions from the one they now belong to. COMESA and SADC have seven member States in common that are not part of a customs union, but all are preparing customs unions. So, of the 26 countries in COMESA, EAC and SADC, 17 are either in a customs union and negotiating an alternative customs union to the one they belong, or are negotiating two separate customs unions. Similar overlaps, though to a lesser scale exists among members of RECs in Western and Northern Africa.
Deepening Africa’s integration goes beyond harmonising RECs memberships and policies. Indeed, the African countries have agreed on a Minimum Integration Programme (MIP). The MIP comprises those activities, projects and programmes that the RECs have selected to accelerate and bring to completion as part of the regional and continental integration process. As a mechanism for conver-gence of RECs, it focuses on a few priority areas of regional and continental concern, where RECs could strengthen their cooperation and benefit from best integration practices.
The MIP incorporates attainable objectives from the AU’s Strategic Plan (2009–2012), as well as a monitoring and assessment mechanism. It will be implemented by the RECs and the member States of the AUC, in collaboration with Africa’s various development partners. It embraces the variable geometry integration approach, according to which the RECs should progress at different speeds in their integration process. To this effect, the RECs will continue implementing their own priority programmes, and will at the same time try to work towards achieving the other goals in the MIP.
Highlights
2 Assessing Regional Integration in Africa (ARIA V): Towards an African Continental Free Trade Area
The MIP’s objectives include:
» Highlighting the regional and continental priority programmes initiated by the Commission and whose implementation, according to the principle of sub-sidiarity, falls within the competence of the national or regional authorities.
» Strengthening the initiatives in progress with respect to economic cooperation among RECs, and iden-tifying measures likely to accelerate integration in selected priority sectors or areas.
» Emulating successful integration experiences in cer-tain RECs and replicating them in other communities (as with the tripartite arrangement among COMESA, SADC and EAC).
» Helping the RECs identify and implement priority activities with a view to surmounting the various integration stages in Article 6 of the Treaty of Abuja and helping them implement the MIP through a clearly defined timetable.
The major constraints that can hinder or slow the imple-mentation of the MIP are a lack of effective coordination, a lack of compatibility between national policies and regional approaches and the overlapping memberships of countries to several RECs. For all this, a balance is needed between national sovereignties and the power given to the RECs-a balance that the AUC should strike effectively and on a long-term basis.
Special attention should be paid to funding the MIP. The Heads of State and Government have endorsed a proposal to establish an “Integration Fund” devoted to financing the MIP. The fund could be lodged either with the African Development Bank (AfDB) or the future African Invest-ment Bank (AIB). Three other financing sources have also been proposed:
» Internal sources (statutory contributions from Mem-ber States, and alternative sources of financing cur-rently being identified).
» Contributions from Pan-African financial institutions (AfDB, AIB and African Central Bank).
» External sources, essentially development partners.
The AUC will undertake consultations with the RECs to develop a funding strategy for the MIP. That strategy will have to:
» Identify the financial sources of the different RECs;
» Identify the funds used by the RECs to implement ongoing activities and projects contained in the MIP;
» Identify existing funds in the AUC allocated to ac-tivities of the MIP;
» Estimate the amounts required to implement each activity or project in the MIP;
» Set a strategy for mobilizing financial resources from development partners;
» Propose measures for the creation, functioning and management of the Integration Fund; and
» Determine the relations between the specialized re-gional funds in the RECs and the proposed Integra-tion Fund.
Clearly, the RECs and the pan-African institutions have been advancing the regional integration agenda. But more needs to be done to yield more results. Success will de-pend on the will and determination of each stakeholder to play its efficient role in the realization of the African Economic Community through implementing the Abuja Treaty. RECs will have to coordinate their programmes and share best practices and experiences through the various programmes and activities that fall within their regions. And the AU should lead the integration process while the member States support the process.
3Highlights
The case for an African Continental Free Trade Area
The most important benefits of free trade areas (FTAs) are significantly anchored in the expected gains from an enlarged market. With free and unrestricted move-ment of goods and services, investment more easily responds to the requirements of market demand and supply within the FTA, resulting in more efficient alloca-tions of resources. But to fully reap the benefits of FTAs members have to meet certain provisions. In addition to the removal of tariff barriers and non-tariff barriers (NTBs), clear and transparent rules of origin also need to be in place. Simple removal of tariff barriers would not bring about the above-stated gains from regional integration unless they are pursued by policy meas-ures aimed at reducing costs of trade from rent-seeking practices, the lack of adequate infrastructure, lengthy border administration and duplication of procedures. Regional efforts towards developing infrastructure and reducing the NTBs are, therefore, imperative to success-ful integration.
Further, both foreign direct investment (FDI) and cross-border regional investment activities and opportunities expected from an FTA can only be enhanced if trade fa-cilitation measures reducing barriers to trade, a stable and predictable trade policy environment and the removal of restrictions on competition among firms within the region are in place. In addition, measures to protect FDI through broader property rights and special regional arbitration courts can provide incentives for investors seeking higher profits but are naturally risk averse.
The establishment of optimum-size industrial and service projects—constrained by the limited size of individual country markets—could be facilitated by the adoption of appropriate trade and macroeconomic policy regimes promoting regional integration activities. For example, the economies of most African countries are individually too small to support a viable steel project, widely recognized as pivotal in any meaningful industrialization drive. A stable investment climate, transport and communication infrastructure and sound (and coordinated) regional economic policy could provide adequate incentives for large-scale investment in manufacturing and service
projects across borders which would greatly benefit from economies of scale.
Regional integration is likely to improve efficiency as a result of competitive pressures among rival firms in the community. One of the major obstacles for production efficiency in most African countries is that the industrial landscape is dotted with monopolies and oligopolistic market structures. Quite often, inefficient national enter-prises (including government monopolies) reap abnormal profits from year to year because they are either protected by government legislation or there are no credible rivals in the industry. Adopting and enforcing regional competition rules throughout an FTA would generate and enhance an atmosphere of free competition, supporting an efficient industrial structure.
Intra-African trade expansion is expected to generate faster growth and income convergence within the commu-nity. Regional market integration at the REC level would lead to the emergence of regional growth poles capable of generating sufficient positive externalities to the less devel-oped member States of the FTA. As production structures are diversified away from primary products, the long-term dependence of African countries on the developed market economies for manufactures is expected to weaken. The existing structure of commodity specialization in Africa has placed the continent at a long-term disadvantage not only on the grounds of cumulative terms-of-trade losses but also in terms of loss of continental self-esteem and growth. Regional integration arrangements could provide a more conducive environment for industrial diversifica-tion and regional complementarities than is currently viable under the existing individual country approach to development. They could also provide an excellent op-portunity and platform for dialogue, conflict resolution and the achievement of peace and security.
While there is a general consensus on the expected ben-efits of an African Continental FTA (CFTA), the follow-ing challenges could hinder the continent’s efforts in adhering to their commitments and derail the process of integration.
4 Assessing Regional Integration in Africa (ARIA V): Towards an African Continental Free Trade Area
First, a collective financial pool is needed to address in-equality in the distribution of gains from the CFTA. Therefore, financing by members could provide com-pensation and adjustment costs arising from revenue and income losses expected to be incurred by members as a result of the continental FTA. Because African countries are financially weak, undertaking such investments will pose challenges.
Second, establishing a continental agreement requires huge financial resources to facilitate the development of competent institutions and complementary infrastructure. This includes financing trade-related infrastructure such as roads, water ways, airways and information and com-munication technology. Capacity-building and developing the necessary knowledge bases are also required to run the institutions of integration at national, regional and continental levels.
Third, there is the potential for conflicts of interest among members stemming from lack of serious commitment to CFTA protocols. The commitment to integration varies across countries. Some countries have undertaken no
liberalization within their respective RECs. And if they cannot commit to a smaller FTA, how will they commit to a CFTA? The reluctance to liberalize their borders to trade is a common concern and may only be overcome if the gains from such liberalization are shared.
In sum, the objectives behind Africa’s envisaged CFTA should rise above merely economic considerations and give due attention to areas of cooperation in the fields of cross-border infrastructure, investment and private sector development, to capture the dynamic benefits of integration. The CFTA has the potential to group the population and create the economic size critical for both static and dynamic gains of large-scale integration to come into effect.
Africa’s stride towards a CFTA could succeed in attaining the benefits outlined in this summary only if individual states display the strong commitment required to imple-ment agreed parameters and the inequitable distribution of the gains and losses of integration are addressed. The tripartite COMESA-EAC-SADC initiative is an encourag-ing move in that direction.
What an African Continental Free Trade Area can offer
An African C-FTA would expand trade flows among Afri-can countries because it addresses most of the constraints mentioned earlier. It would add up to USD 34.6 billion (52.3 per cent) to the baseline in 2022. Imports of African countries from the rest of the world would come down by USD 10.2 billion, well compensated by the significant projected increase in intra-African trade.
Africa’s exports of agricultural and food products—par-ticularly wheat, cereals, raw sugar (sugar cane and sugar beet) and processed food (meat, sugar and other food products)—would benefit most from the CFTA. These are products in which African economies have comparative advantages and that are sometimes highly protected by some countries in the region. Under the CFTA, Africa’s export volumes of agricultural and food products would increase by an extra 7.2 per cent (or USD 3.8 billion) in 2022 above the baseline. Africa’s export volumes of
industrial products—particularly textiles, wearing ap-parel, leather products, petroleum, coal products, mineral and metal products and other manufactured products would increase over the baseline by 4.7 per cent (or USD 21.1 billion). These increases in trade are anticipated to translate into income gains.
Complementary trade facilitation measures could substan-tially increase these gains. It is assumed here that customs procedures and port handling become twice as efficient, enhancing trade more than FTAs based solely on tariff elimination. As a result, Africa’s export volumes to the world would be 6.2 percentage points higher under the Continental FTA. Intra-African trade also increases by an extra 6.4 percentage points under the CFTA relative to the scenarios under the separate FTAs. This corresponds to a doubling of intra-African trade compared to the baseline of a CFTA not being established. Similarly, Africa’s real
5Highlights
income would improve by an additional percentage point annually whatever the trade policy considered, when cou-pled with faster customs procedures and port handling. Therefore, despite a general assumption that FTAs in developing countries have the tendency to divert trade and produce limited gains, the results of our empirical analysis make it amply clear that a CFTA has the poten-tial to produce net economic gains for Africa as a whole.
Summing up, the elimination of high tariff barriers preva-lent across Africa through a CFTA would enhance intra-African trade and generate growth in real income. These economic gains are expected to be significantly higher if complemented by additional trade facilitation measures aimed at reducing the cost of administrative and customs procedures, improving port handling and developing infrastructure.
Some perspectives for fast-tracking an African Continental Free Trade AreaThe general objective of establishing the CFTA is the creation of a single market with free movement of goods and services as a way of promoting social and economic development in Africa. The CFTA will broaden and deepen the opportunities available to exporters by removing and reducing barriers to trade and investment. The CFTA will bolster intraregional trade by creating a wider market, increasing investment flows, enhancing competitiveness and developing cross-regional infrastructure.
The CFTA protocol could be inspired by the WTO prin-ciple of most-favoured nation (MFN) treatment, which forbids any member from discriminating against other members. A related principle to consider is “national treatment” which will ensure that products imported from other CFTA member states are not subjected to unfair national treatment by the importing member state.
Fast-tracking the African C-FTA also requires building on the experiences and structures of the existing RECs’ FTAs and this should form the basis for establishing the principles, objectives and provisions of the protocol, se-quencing and institutions. The January 2012 AU Summit
agreement envisages conclusion of negotiation and launch of the C-FTA indicatively within eight years by 2017. A number of more specific steps will have to be taken as integral parts of the negotiating process. Particularly, the negotiations of the C-FTA could consider the fol-lowing phases:
» The first phase will cover liberalization of trade in goods. This will include tariff reduction or elimi-nation, creation of simple and transparent rules of origin, dispute resolution and arbitration, simplifi-cation of administrative, transit and customs proce-dures and in general the reduction of NTBs through trade facilitation measures. Security and protection for cross-border goods would also be an important component.
» The second phase could focus on liberalizing trade in services and in a parallel track, the free movement of persons.
» A third phase could address accompanying measures on intellectual property rights, competition policy and investments.
Movement of persons and labour and right of establishment
Free movement of persons, rights of residence and estab-lishment is one of the founding principles of the African leaders, as stipulated in Chapter VI of the Abuja Treaty. Free movement of persons also represents one of the most
important rights of individuals under national common law.
6 Assessing Regional Integration in Africa (ARIA V): Towards an African Continental Free Trade Area
Free movement of persons underpins all other pillars of an African common market because it is critical for the supply of services, the right of establishment and the movement of capital. It requires the removal of barriers such as visa requirements, which restrict the movement of people across national borders. Full transition to mo-bility of workers among African countries remains one of the most contentious issues for African leaders due to security, unemployment and other reasons.
Some innovative approaches are being implemented in the UMA region such as guaranteeing freedom of es-tablishment and investment capital, in accordance with the laws and regulations in place, freedom to transfer foreign capital, the ability to transfer professional income of foreign employees and equal treatment of nationals and foreign individuals and legal entities. The free movement of persons and the rights of residence and establishment within UEMOA are for instance fully harmonized with ECOWAS, including a common passport.
There are still some problems with the right of establish-ment and residence in a number of RECs. Restrictions to the right of establishment have not been completely clarified under the member States’ national laws. In some RECs, a number of services are still closed or limited. In some countries, foreign investment in the telecommuni-cations sector is limited, non-citizens are not allowed to trade outside large cities, and the hospitality industry is limited for foreign participation. There are also restric-tions on the movement of capital.
Overall, the African regional organizations have taken steps to facilitate short-term stays in member countries, but the establishment of large economic unions within which citizens could move and work freely remains a long-term goal. Various articles in the REC protocols presuppose that every community citizen who is a mi-grant worker must either be gainfully employed in the formal sector of the member State before they qualify to apply for the right of residence or must have a business formally registered in accordance with the member State’s national law.
To facilitate free movement of labour, work permits need to be issued for community citizens irrespective of skills. National governments should also revise national em-ployment codes in line with REC protocols and ensure that the rights of migrant workers in host countries are protected. There is a need to harmonize national laws that conflict with regional and subregional treaties, and to address the rights of residence and establishment of migrants. This requires modifying domestic laws, statutory instruments and administrative practices, and aligning national political interests to long-term regional goals and ambitions, which may not be seen as priority by some member States.
African RECs are still behind in their programmes to open borders and customs red-tape prevails. The innovation of a one-stop border post such as the Chirundu OSBP between Zambia and Zimbabwe needs to be expanded. Member States need to expedite the process of providing identity documents, travel certificates and health certifi-cates to community citizens resident in their territories. To improve community information flows, the border information centres between Ghana and Togo, and the planned centre between Mali and Senegal, are welcome developments designed to support the private sector, reduce supply-chain costs for exporters and increase national governments’ competitiveness for creating jobs and reducing poverty.
African RECs should, as a matter of urgency, activate the functioning of national protocol monitoring committees and facilitate the coordination of their activities with the Secretariat of their respective RECs. This should result in the harmonization of regulations, implementation pro-cedures and guidelines and other measures to give effect to the free movement of people in the particular region.
7Highlights
Movements of goods and services in Africa
Against the backdrop of global financial and economic crisis in the traditional developed markets and the stale-mate in WTO negotiations, regional trade integration has emerged as a formidable instrument for sustaining current economic growth across Africa and a cushion against the effects of the global financial and economic crisis. Increasing intra-African trade and building Af-rican markets through increased trade integration can be a launch pad for enhancing African competitiveness and its meaningful participation in the world economy.
There is great potential and diversity of opportunities available in all African countries in such areas as agri-culture and agri-business, mining, energy generation, transportation, construction and many other industries. Most African countries are still importing the same prod-ucts Africa is exporting to the rest of the world. Thus, vast trade and investment opportunities exist in most product and services groups which are yet to be exploited within regions.
Taking into consideration the importance of trade in gen-eral and intraregional trade in particular, many African countries have taken measures to ease the movement of
goods and services within their respective RECs. Many are signatories to the existing bilateral and regional agree-ments to reduce and eliminate tariff and non-tariff barriers to trade. RECs have started a gradual tariff phase-down but implementation by members is at varying speeds. Despite the encouraging commitments to this end, in-traregional trade remains weak, and much needs to be done to eliminate non-tariff barriers through trade fa-cilitation schemes.
Infrastructure development is an integral part of trade facilitation and a priority for most RECs. Accordingly, all of them have comprehensive policy and frameworks on the development of regional inter-REC cross-border transport, ICT connections, water and transport develop-ment and power supply coordination. The lack of adequate financial resources restrains efforts by most countries to improve cross-border infrastructure. Infrastructural projects by their nature cut across a number of coun-tries, so policy coordination is required across the RECs for effective implementation. An African C-FTA could support such efforts by pooling resources for financing cross-border infrastructure development.
Movement of investment and capital in Africa
Attracting external resources provides an incentive for countries to strengthen economic links among them-selves and to take other steps to enhance intraregional financial flows. Already, a few of the regional groupings have protocols or agreements encouraging and facilitating cross-border movement of investments and capital. In ad-dition, national economic policies have been improved to attract private capital and investments. African domestic and regional markets are not only relatively unexploited but are also expected to grow at a reasonably high rate compared with those of other developing regions.
Global flows to Africa have increased rapidly since the 1990s for all types of private investment and capital, reflecting abundant credit in developed countries and
greater global financial integration. Net private capital flows to sub-Saharan Africa increased more than sixfold from an average of USD 3.4 billion in 2000–02 to USD 21.7 billion in 2010, with inflows growing much faster than outflows. In fact, private capital inflows increased fivefold between 2000 and 2007, overtaking official development assistance flows in 2006. Debt-creating flows (bank and other private capital) declined in favour of rising portfolio equity and FDI.
The bulk of the FDI inflows in the last decade went to Nigeria (29 per cent) and South Africa (18 per cent), which have substantial locational advantages, and most portfolio inflows went to South Africa (88 per cent), where the capi-tal market is highly developed. Ghana, Kenya, Tanzania,
8 Assessing Regional Integration in Africa (ARIA V): Towards an African Continental Free Trade Area
Uganda and Zambia, which have also made impressive progress in economic and financial sector reforms, also saw substantial increases in investment, with very high foreign holdings of domestic public debt in Ghana and Zambia. But about a third of African countries have not benefited from the boom in private capital flows, as they lose out to other countries in their regions.
The picture for intra-African investment and capital flows, however, is largely unavailable. Data limitations/gaps for these flows are huge, and it is almost impossible to as-sess their scale, scope and significance. Very few African countries compile data on them systematically.
Over the years, the share of intra-African FDI in Af-rica has not risen significantly, but it fluctuates widely. Intra-African FDI flows were estimated at USD 2 billion annually during 2002–04 and, while they fell to USD 1.6 billion during 2005–07 (only about 13 per cent and 4 per cent, respectively, of total FDI inflows in Africa), they are estimated to have recovered to levels slightly higher than a decade ago. Intraregional investment in Africa is mostly concentrated in four major sectors. These are mining, quarrying and petroleum; finance; business ser-vices; and transport, storage and communication. Lack of investment in the other sectors could partly be explained by the small country markets and lack of strong commit-ments to the existing integration arrangements. In this regard, in deepening and enlarging regional integration arrangements through the establishment of the C-FTA, Africa could further encourage intraregional investment flows and create new opportunities for exports within the unified continental market.
The bulk of intra-African FDI also goes to finance mergers and acquisitions (M&As) rather than greenfield invest-ments. The share of Africa in total cross-border M&As sales in Africa ranges from 20 per cent to nearly 60 per cent, while in greenfield investments the share is much lower in each industry. This suggests that greenfield invest-ments, still a typical mode of investments in Africa, are financed mainly by FDI from non-African countries. But it also points to the fact that intra-African FDI should be attractive to countries privatizing state firms or seeking to increase exportable output from existing firms.
The surge in investment and capital flows to Africa and intraregional investments, partly reflects several positive steps that African countries have taken to enhance the “pull factors” or geographical advantages—regional in-vestment arrangements and bilateral investment treaties, macroeconomic reforms, financial sector development and the business climate. But in many cases the regional in-vestment arrangements are not fully implemented because countries fail to realize their impacts. Some of the weak impacts are related to the non-compliance of the regional investment arrangements and the bilateral investment treaties. But others are related to complementary actions that have not been implemented and that are necessary for a conducive investment environment.
Rationalizing the international investment arrangements. Despite their perceived benefits, the proliferation and over-lapping of international investment arrangements make it difficult for countries in specific regional groupings to harmonize their investment policies and benefit from deepening regional integration. There is need to consider consolidating the existing arrangements in the context of ongoing harmonization arrangements to disentangle the “spaghetti bowl” of African regional integration. While launching customs unions would provide the opportunity to do that, countries could in the interim take specific steps to rationalize current arrangements by incorporat-ing existing investment protocols in FTA agreements. Further actions would involve terminating the signing of bilateral investment treaties among countries in the same grouping, as they would become redundant in the presence of regional investment arrangements, adopting a regional approach to negotiations with third States and gradually transferring negotiating power to the regional groupings. Finally, at the regional levels, business cli-mate reforms could also be embedded in the regional investment agreements to enhance credibility, improve harmonization of rules and standards and address pos-sible contagion and spillovers.
Improving macroeconomic performance and harmonizing policies. Many African countries have made significant progress towards stabilizing their macroeconomic en-vironment. Maintaining and improving performance in this area would require building institutions for, and
9Highlights
enhancing transparency in, macroeconomic policymak-ing and management to reduce inefficiencies and risks in the macroeconomic environment. At the regional level, countries would also need to enhance economic policy harmonization.
Enhancing regional financial and capital market develop-ment and integration. Financial development and regional integration should be considered not as sequential but as simultaneous processes. An ultimate objective of regional financial integration is to facilitate financing of larger trade and service transactions among the member countries of the region. Having a formal FTA, or customs union, that does away with tariff and non-tariff barriers will increase the attractiveness of the region for FDI and other capital flows. Proactive actions to integrate the financial markets are also very necessary, as market forces alone cannot ensure that financial integration will occur at a pace or in a form that meets the requirements of increasing trade and investment flows.
Improving the business environment. Improving the investment climate would require tackling, at both na-tional and regional levels, three elements important for entrepreneurs, including cross-border investors: costs (both monetary and time or processing delay costs as-sociated with weak contract enforcement, inadequate infrastructure, crime, corruption and regulation); risks (especially as linked to unstable and insecure environ-ment, including for protection of property rights, policy uncertainty, macroeconomic instability and arbitrary regulation; and barriers to competition facing firms (es-pecially the regulation of market entry and exit, and government responses to anticompetitive behavior by firms). Tackling these issues require governments to balance the preferences of investors with those of society, especially in the area of taxes and regulations, and to tackle some basic issues.
In addition to finance, the basics include measures in three areas:
» Improving the stability and security of property rights. This requires governments to take measures in veri-fying rights to land and other property, facilitating
contract enforcement, reducing crime and ending uncompensated expropriation of property.
» Regulation and taxation. Too often, governments pursue taxation and regulatory approaches that fail to achieve the intended objectives because of wide-spread informality—yet harm the investment climate by imposing unnecessary costs and delays, inviting corruption, increasing uncertainty and risk and cre-ating unjustified barriers to competition. The key is to strike a better balance between market failures and government failures by enhancing transparency. And while many African countries have pursued cus-toms reforms to reduce barriers to international trade and investment flows in recent years, there is need to address non-tariff barriers, including improving customs administration and exploiting information technologies to reduce delays and corruption that are so much of concern to investors.
» Improving labour markets. A skilled workforce is es-sential for firms to adopt new and more productive technologies. Apart from the general need for govern-ments to lead in making education more inclusive and relevant to the skill needs of firms, many countries need to improve labour market policies to encourage wage adaptability, to ensure workplace regulations re-flect a good institutional fit and to strike a reasonable balance between workers’ preference for employment stability and firms’ need to adjust the work force.
At the regional levels, business climate reforms could also be embedded in the regional investment agreements to enhance credibility, improve harmonization of rules and standards and address possible contagion and spillovers.
10 Assessing Regional Integration in Africa (ARIA V): Towards an African Continental Free Trade Area
Conclusion
In conclusion, it is now widely acknowledged that the socio-economic and political gains from regional integra-tion in general and the CFTA in particular are significant. Despite this general consensus on the need for stronger and deeper integration arrangement, the continent’s de-termination to overcome the barriers to integration, are on the right track, but efforts need to be intensified. It has now become amply clear that the response to these chal-lenges requires a collective approach with a deeper and a continental effort to integration. This implies bringing
the 54 separate economies on the continent into a more coherent and large economic and market space making common use of complementarities and resources to create stronger and more viable economies. It is in this respect that there has been a concerted level of political will and commitment displayed by African leaders to regional integration and tangible changes have taken place on the ground. As a result, the envisaged Continental FTA seems increasingly within reach.
CHAPTER
11
Regional integration in Africa is not a new phenomenon. Initiatives on the continent date back to when the South African Customs Union (SACU) was set up in 1990 and before that the East African Community (EAC) in 1919. The 1970s saw a surge in launching regional
economic communities (RECs)—the African Union (AU) recognizes eight. In recent years, African countries have vigorously pursued an integration agenda as a collective development and transfor-mation strategy.
Despite its strong recent economic growth, the continent remains marginalized in global economic terms: its share of world trade is only 3.2 per cent. The roots are constraints that inhibit trade within Africa and trade to developed markets, and include physical transport and communications infra-structure, customs procedures and border administration, weak financial and capital markets, lack of a diverse production base and absence of regional policy coordination.
These challenges are not new. In 1991 African Heads of State and Government signed the Treaty Establishing the African Economic Community (AEC)—the Abuja Treaty—which provides the guid-ing principles and goals as well as a region-wide framework to strengthen the integration agenda. The aims are further underpinned by the Constitutive Act of the AU, which came into force in May 2000, as well as the RECs’ various treaties and protocols.
The idea is to build the AEC as an integral part of the AU. The AEC is to be formed in six phases over 34 years:
» First phase (five years): Strengthen existing RECs and create new RECs in regions where they do not exist.
» Second phase (eight years): Ensure consolidation within each REC, with a focus on liberalizing tariffs; removing non-tariff barriers (NTBs); harmonizing taxes; and strengthening sector in-tegration regionally and continentally in trade, agriculture, money and finance, transport and communications, industrial development and energy.
Introduction 1
12 Assessing Regional Integration in Africa (ARIA V): Towards an African Continental Free Trade Area
» Third phase (10 years): Set up in each REC a free trade area (FTA) and customs union (with a common external tariff and a single customs territory).
» Fourth phase (two years): Coordinate and harmonize tariff and non-tariff systems among the RECs with a view to establishing a continental customs union.
» Fifth phase (four years): Set up an African common market.
» Sixth phase (five years): Establish the AEC, includ-ing an African Monetary Union and Pan-African Parliament.
The idea behind the six stages is that economic integra-tion should first be consolidated regionally, through the creation of RECs that would eventually merge into the AEC. The RECs are expected to serve as the building blocks for the AEC.
In an effort to keep the momentum going, a tripartite FTA was launched involving COMESA, EAC and the Southern African Development Community (SADC). It covers 26 African countries (almost half the AU member-ship), a population of 530 million (57 per cent of Africa’s population) and a total gross domestic product (GDP) of US$ 630 billion (53 per cent of the continent’s). This move seriously galvanized interest in the much broader continental FTA (CFTA): AU ministers of trade, at their 6th Ordinary Session in Kigali in November 2010, after assessing the progress made in carrying out the FTAs and customs unions in the various RECs, recommended that the creation of a CFTA should be fast-tracked to help address unresolved development issues. The January 2012 African Union Summit endorsed this recommendation, agreeing on an indicative date of 2017.
Efforts are also being made Africa-wide. The Pan-Afri-can Parliament was set up earlier than the Abuja Treaty
envisaged, and the launch of other key continental institu-tions—namely the African Investment Bank, the African Monetary Fund and the African Central Bank—is being accelerated. It is in this same spirit of accelerated inte-gration that the birth of the continental customs union should be considered. Under the Abuja Treaty, it is to be established in about eight years from now. And indeed the programme for realizing the AEC expects that all the RECs should satisfy the requirements of an FTA hopefully by the indicative date of 2017.
This fifth edition of Assessing Regional Integration in Africa (ARIA V)—a joint United Nations Economic Commission for Africa (UNECA), African Union Commission (AUC) and African Development Bank (AfDB) publication—is a contribution to the analysis and development of a strategy for creating the CFTA. It provides a framework for African governments, the AU and RECs to bring forward the day that the CFTA and AEC are founded.
It is organized as follows. Chapter 2 provides an over-view of current and emerging developments in regional integration. Chapter 3 gives a theoretical underpinning to FTAs and discusses the rationale behind the CFTA, and chapter 4 offers an empirical analysis of the CFTA. Chapter 5 is a perspective for fast-tracking the CFTA. Chapter 6 analyses the movement of people and the right of establishment in Africa, probing the reasons for states’ non-compliance with signed protocols, and provides recommendations to address the lack of commitment and implementation. Chapter 7 assesses the movement of goods and services, identifying trade policies, com-modity structures, the main challenges facing the RECs and Africa’s key trade opportunities. Chapter 8 looks into some theory behind investment and capital flows, and for Africa offers recommendations to boost them (with appropriate safeguards), particularly related to interna-tional investment agreements, the macro-economic and business environments, and specific measures to develop and integrate the continent’s financial markets.
CHAPTER
13
African countries have a fairly long history of repeated attempts to group themselves—in sub-groups and even Africa-wide—through several broad types of arrangements. Many researchers have argued that regional integration and cooperation are the most appropri-
ate way to improve weak intra-African trade as well as internal (domestic) trade. Many of the more popular arguments rest heavily on the possibilities of generating large economies of scale from activities typically associated with expanded trade and overall economic growth in a country.
The path to African integration has not been easy, however. It has been marked by a series of major initiatives and political decisions to accelerate it or infuse new momentum, and to integrate variables of new imperatives in international economic relations. The Abuja Treaty (signed on 3 June 1991 and operational from 12 May 1994) stipulates that African states must endeavour to strengthen their RECs, in particular by coordinating, harmonizing and progressively integrating their activities in order to attain the AEC, which would gradually be put in place during a 34-year transition period subdivided into six stages (table 2.1 below).
Another major initiative came on 9 September 1999, when the Heads of State and Government of the Organization of African Unity issued a declaration (the Sirte Declaration) calling for the establishment of an African Union, with a view, among other things, to accelerate integration on the continent to enable it to play its rightful role in the global economy while addressing multifaceted social, eco-nomic and political problems compounded by factors such as the negative aspects of globalization.
Yet despite the adoption and implementation of the current initiatives, results remain mixed. Whereas certain RECs have achieved tangible outcomes in some specific sectors, others have had relatively disappointing results in terms of the objectives of the Abuja Treaty. The AU—its principal architect—was to manage and assess the success of the process, but faces some challenges in fully fulfilling the role given to it, particularly in coordinating, harmonizing, monitoring and assessing activities, projects and programmes destined to boost integration.
The RECs—the building blocks of the integration project—also face a number of implementation chal-lenges including inadequate financial and manpower resources to support their numerous integration
Overview of Regional Integration in Africa 2
14 Assessing Regional Integration in Africa (ARIA V): Towards an African Continental Free Trade Area
initiatives. These challenges have contributed to slowing progress towards regional and continental integration. In order to address them, the AUC, working closely with the RECs, has undertaken a range of initiatives, including a Minimum Integration Programme (MIP) (see below).
This chapter gives the status of regional integration in Africa, looking at progress made by RECs and other pan-African institutions in implementing integration initiatives. It also outlines key challenges in this area, and offers policy recommendations for tackling them.
2.1 Assessing regional integration
Several RECs have made some progress in accelerat-ing the regional integration agenda, although they still need to make tremendous efforts to harmonize policies, especially Africa-wide. Some RECs—COMESA, EAC, ECCAS, ECOWAS and SADC—have set up an FTA, while CEN-SAD and IGAD are still doing that.1 COMESA and EAC have initiated a customs union: COMESA launched its Customs Union in June 2009 with an implementation framework of three years; EAC has a fully operational customs union. Other RECs plan to become fully-fledged customs unions in the coming years.
In West Africa, there is a growing rapport between ECO-WAS and UEMOA, leading to their adopting a common programme of action on a range of issues, including trade liberalization and macro-economic policy convergence.2
In Central Africa, ECCAS and CEMAC are making efforts to increase their working relationships towards harmoniz-ing their programmes. In Eastern and Southern Africa,
IGAD and the Indian Ocean Commission (IOC) are ap-plying most of the integration instruments adopted within COMESA. EAC and COMESA have a memorandum of understanding to help harmonize their policies and pro-grammes, while COMESA and SADC have set up a task force to deal with common issues and invite each other to their policy and technical meetings. And currently, the tripartite FTA between COMESA, EAC and SADC is under negotiations. These negotiations are expected to be concluded in 2014.
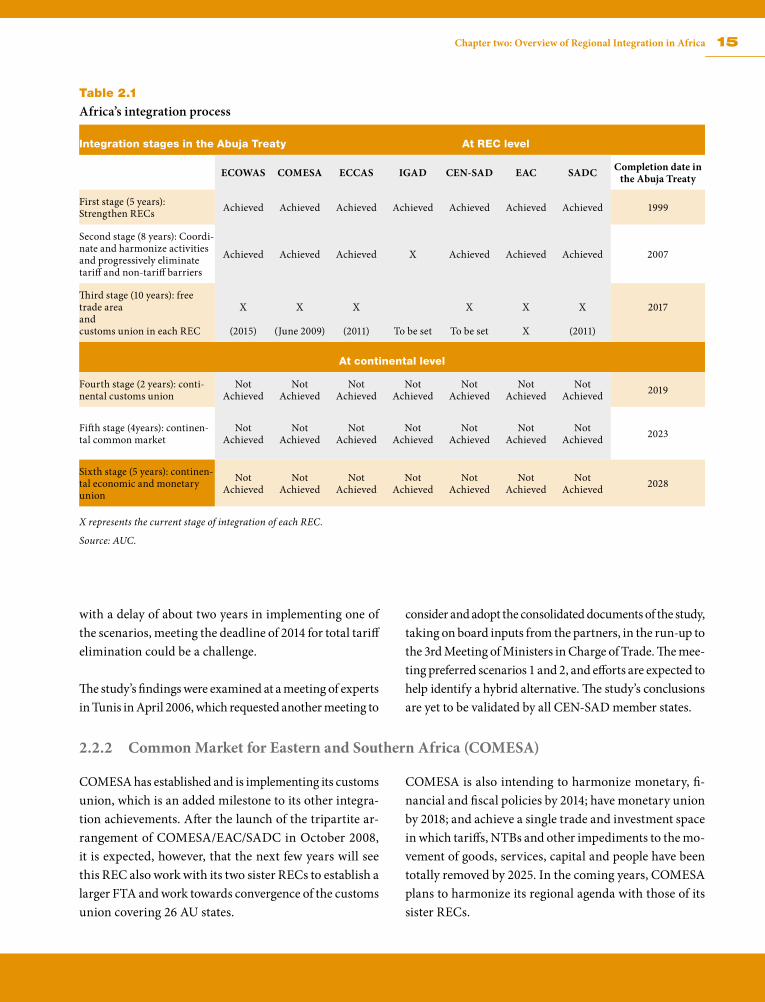
Table 2.1 illustrates the RECs’ progress in integrating. Although virtually all the regions (and the AUC) have, in the first stage, strengthened the institutional framework of existing RECs and created new RECs where they did not already exist, difficulties have started to emerge in the second stage in terms of coordinating and harmonizing activities, and in completely eliminating tariffs and NTBs.
2.2 Status in selected RECs2.2.1 Community of Sahel-Saharan States (CEN-SAD)
CEN-SAD is working to build its own FTA. Since the 5th Conference of Leaders and Heads of State and Government held in Niamey, Niger in March 2003, its general secretar-iat has launched activities to move towards implementing the project, which covers 29 countries. For example, with support from the AfDB, it carried out a technical study to help member countries identify tariffs and NTBs, and to adopt measures to boost intra-community trade. The findings of the study were structured around three tariff-elimination scenarios—solidarity, equality and freedom.
The solidarity scenario took into account development differences among member countries. It proposed a spe-cific scheme. For the least-developed countries: eight years (2007–2014), with an annual tariff relief of 12.5 per cent; for other countries, four years (2007–2010) to eliminate tariffs: 20 per cent per year for 2007 and 2008, and 30 per cent per year for 2009 and 2010. The equality scenario did not accommodate discrimination. It provided for an identical scheme for all countries, starting from 1 January 2007: 10 per cent for the first two years, and 20 per cent for the remaining four years. In the freedom scenario, each state presented a scheme over eight years (2007–2014). However,
15Chapter two: Overview of Regional Integration in Africa
Table 2.1
Africa’s integration process
Integration stages in the Abuja Treaty At REC level
ECOWAS COMESA ECCAS IGAD CEN-SAD EAC SADC Completion date in the Abuja Treaty
First stage (5 years): Strengthen RECs Achieved Achieved Achieved Achieved Achieved Achieved Achieved 1999
Second stage (8 years): Coordi-nate and harmonize activities and progressively eliminate tariff and non-tariff barriers
Achieved Achieved Achieved X Achieved Achieved Achieved 2007
Third stage (10 years): free trade area and customs union in each REC
X
(2015)
X
(June 2009)
X
(2011) To be set
X
To be set
X
X
X
(2011)
2017
At continental level
Fourth stage (2 years): conti-nental customs union
Not Achieved
Not Achieved
Not Achieved
Not Achieved
Not Achieved
Not Achieved
Not Achieved 2019
Fifth stage (4years): continen-tal common market
Not Achieved
Not Achieved
Not Achieved
Not Achieved
Not Achieved
Not Achieved
Not Achieved 2023
Sixth stage (5 years): continen-tal economic and monetary union
Not Achieved
Not Achieved
Not Achieved
Not Achieved
Not Achieved
Not Achieved
Not Achieved 2028
X represents the current stage of integration of each REC.
Source: AUC.
with a delay of about two years in implementing one of the scenarios, meeting the deadline of 2014 for total tariff elimination could be a challenge.
The study’s findings were examined at a meeting of experts in Tunis in April 2006, which requested another meeting to
consider and adopt the consolidated documents of the study, taking on board inputs from the partners, in the run-up to the 3rd Meeting of Ministers in Charge of Trade. The mee-ting preferred scenarios 1 and 2, and efforts are expected to help identify a hybrid alternative. The study’s conclusions are yet to be validated by all CEN-SAD member states.
2.2.2 Common Market for Eastern and Southern Africa (COMESA)
COMESA has established and is implementing its customs union, which is an added milestone to its other integra-tion achievements. After the launch of the tripartite ar-rangement of COMESA/EAC/SADC in October 2008, it is expected, however, that the next few years will see this REC also work with its two sister RECs to establish a larger FTA and work towards convergence of the customs union covering 26 AU states.
COMESA is also intending to harmonize monetary, fi-nancial and fiscal policies by 2014; have monetary union by 2018; and achieve a single trade and investment space in which tariffs, NTBs and other impediments to the mo-vement of goods, services, capital and people have been totally removed by 2025. In the coming years, COMESA plans to harmonize its regional agenda with those of its sister RECs.

16 Assessing Regional Integration in Africa (ARIA V): Towards an African Continental Free Trade Area
The bloc’s focal areas of integration include trade in goods and services; monetary-integration payments and sett-lement arrangements; investment promotion and facili-tation; and infrastructure development—air, road, rail, maritime and inland transport, information and com-munications technology (ICT) and energy. Other areas include trade liberalization and customs cooperation covering 14 states; a robust programme for removing NTBs (such as regional and national institutional systems and modalities); and trade in services.
On trade, COMESA has made much progress. Intra-COMESA trade rose to US$ 17.2 billion in 2010 from US$ 12.7 billion in 2009. COMESA’s attraction of foreign investments has also been rising, particularly in manufac-turing. The FDI flows and are mainly attributable to newly emerging economies, primarily China, India, Malaysia, Turkey and Gulf Cooperation Council countries.
2.2.3 East African Community (EAC)
The good progress made by the EAC since it started full operations in 1996 lays a strong foundation for achieving its mission of regional integration and development. It made the East African currency convertible in 1997, fully operationalized its customs union in January 2010 and launched its common market in July 2010. With monetary union envisaged for 2012, preparations for establishing a political federation continue in earnest, although they will require substantial resources and firm commitment from the partner states.
EAC is also promoting investments and trade, as well as identifying and developing regional infrastructure projects including roads, railways, civil aviation, posts and telecommunications, energy and the Lake Victoria Development Programme. Already, with the entry of Burundi and Rwanda, EAC’s resource base has risen, and it offers exciting prospects for becoming a middle-income economy by 2020. The prospects are also good that the region can realize its great potential to become the eco-nomic hub for the wider Eastern Africa region, beyond its current membership of five countries.
In infrastructure, it is making steady gains on the East African Road Network Project, in particular the Mom-basa–Katuna Road (Northern Corridor) and the Dar es Salaam–Mutukula Road (Central Corridor), which has reached the implementation stage. The Arusha–Na-manga–Athi River Road Project is 70 per cent complete (200 km of 240 km). Feasibility studies for the Arusha–Holili–Voi Road are finished and work on detailed design is under way.
For the free movement of people, EAC has achieved the following:
» The EAC passport is in force and allows multiple entries to citizens of partner states to travel freely within the EAC region for up to six months. Inter-nationalizing the EAC passport has been endorsed by the EAC Council of Ministers and modalities for implementing this move are being explored.
» Partner states commit themselves to cooperate in putting in place a social partnership between govern-ments, employers and employees so as to increase human resource productivity through efficient production. Partner states have agreed to develop a framework for mutually recognizing professional qualifications. It is now possible for legal practitioners to operate in any EAC country, without having to sit new bar examinations.
» Studies on harmonizing employment policies and labour legislation have been presented to stakehold-ers’ workshops.
» Under the Common Market Protocol, the right to free movement of people entails the abolition of any discrimination based on nationality.
For the free movement of goods, services and capital, EAC has reached the following milestones:
17Chapter two: Overview of Regional Integration in Africa
» Full implementation of the customs union took effect on 1 January 2010.
» A zero tariff is applied on trade in goods from partner states, with a few exceptions based on an agreed “list of sensitive goods”.
» Free movement of goods among the partner states is governed by the provisions of the Customs Law of the Community; of the EAC Protocol on Standardization, Quality Assurance, Metrology and Testing; and the
EAC Standardization, Quality Assurance, Metrology and Testing Act.
» Jointly managed border points to expedite movement across borders, as well as pilot border points, have registered success.
With international funding, the EAC has carried out a study on a strategy for regionalizing EAC capital markets, which entails a capital-market and stock-exchange regime.
2.2.4 Economic Community of Central African States (ECCAS)
ECCAS has yet to secure free movement of people. Some countries require a visa, for example. Security issues are cited as major factors for delays in pushing through deci-sions taken at regional level. Instruments are already in place—all that needs to be done is to implement earlier agreements.
ECCAS launched an FTA in 2004, but the planned laun-ching of its customs union in 2008 was delayed. It is proposed to start during 2012.
2.2.5 Economic Community of West African States (ECOWAS)
ECOWAS’s objectives are to promote cooperation and integration in economic, social and cultural activity, ultimately leading to an economic and monetary union through completely integrating its member states’ na-tional economies, raising living standards and enhancing economic stability.
A major achievement was the launch of the Regional Pov-erty Reduction Strategy Paper on 11 January 2010 in Accra. This was followed by a workshop in Abuja to review the im-plementation plan and discuss institutional arrangements for implementation as well as monitoring and evaluation. In the financial arena, ECOWAS has established a Bank for Investment and Development (an off-shoot of the ECOWAS Fund). The bank’s objective is to finance and promote eco-nomic growth and development within ECOWAS. It offers a range of financial products and services to businesses.
Six of the Anglophone members—Gambia, Ghana, Guinea, Liberia, Nigeria and Sierra Leone—are setting up a second West African Monetary Zone as part of the efforts towards an eventual monetary union in the ECOWAS region. On
free trade, ECOWAS has emphasized three areas. First, it is establishing an FTA through the ECOWAS Trade Liberalization Scheme. Second, it is setting up a common external tariff, and has made large strides since it formally adopted the ECOWAS common external tariff structure in January 2006, and created the ECOWAS-UEMOA Com-mittee (for concluding the project). Third, the ECOWAS Council of Ministers has directed the Commission to take every necessary action to assist those member states which are yet to adopt a value-added tax (VAT).
On the free movement of people, member states adopted in Dakar, Senegal on 29 may 1979, the Protocol on Free Movement of Persons, Residence and Establishment which guarantees to the nationals of ECOWAS member states, among other things, the right to enter, reside and establish economic activities in the territory of member states. There is good progress in the implementation of this protocol, particularly in the area of free movement of people across borders without visa restrictions.
18 Assessing Regional Integration in Africa (ARIA V): Towards an African Continental Free Trade Area
2.2.6 Inter-Governmental Authority on Development (IGAD)
The agreement establishing IGAD identified three prior-ity areas as immediate entry points for working together: food security and environmental protection; conflict prevention, management and resolution; and economic cooperation and integration. IGAD is making efforts to work on these three areas, among other things, estab-lishing effective mechanisms, networks, processes, and partnerships for its regional activities.
It has also set up specialized bodies such as the Conflict Early Warning and Response Mechanism in Addis Ababa, the IGAD Business Forum in Kampala), the IGAD Cli-mate Prediction and Application Centre for Monitoring and Forecasting in Nairobi, the IGAD Capacity Building Programme against Terrorism in Addis Ababa and the IGAD Regional HIV/AIDS Partnership Programme in Kampala.
IGAD aims to have its own FTA. It also intends to have provision for free movement of people, services, goods and capital to be implemented through a protocol. Its proposed FTA would follow the model of existing FTAs in Africa (given the dual membership of its member states) to ensure regional policy coherence and to gain an entry point into the tripartite FTA.
The 12th IGAD Assembly of Heads of State and Govern-ment of June 2008 in Addis Ababa directed the Secretariat to undertake an inventory of what has been achieved so far in harmonization and regional integration, and make recommendations. It further directed the secretariat to develop regional integration policies and programmes to make IGAD relevant as a building block of the AU. The secretariat has completed the IGAD MIP.
2.2.7 Southern African Development Community (SADC)
SADC has objectives, among others to:
» Become a customs union by 2012, accomplish a com-mon market by 2015, monetary union by 2016 and economic union by 2018;
» Improve the business and investment climate and achieve convergence on selected macro-economic indicators;
» Enhance industrial competitiveness and diversify SADC economies by promoting intra-regional trade, productive investment and technological coopera-tion; and
SADC is drafting a competition policy model aimed at fast tracking creation of the common market. The policy’s objective is to create the conditions that allow markets to function competitively for the benefit of consumers and businesses. Such a policy will ensure that competition is undistorted, in particular by preventing or removing public and private barriers to competition.
For the customs union, it has undertaken various studies, including one on the appropriate model and one on as-sessing the compatibility of national trade policies. These formed the basis for further work.
In the area of infrastructure and services SADC contin-ues to focus on the energy crisis that has hit several of its members. Guided by its Energy Activity Plan, it is trying to put through key regional projects to generate around an additional 44,000 megawatts. In the short term, it plans to rehabilitate some generation units to provide 1,700 megawatts.
On the free movement of people, SADC has reached the stage that:
» Entry of citizens from a member country to another does not require a visa for up to 90 days; and
» The right to settlement consists of a permit given to a citizen of another member country to undertake an economic activity or profession, either as a salaried person or an investor.
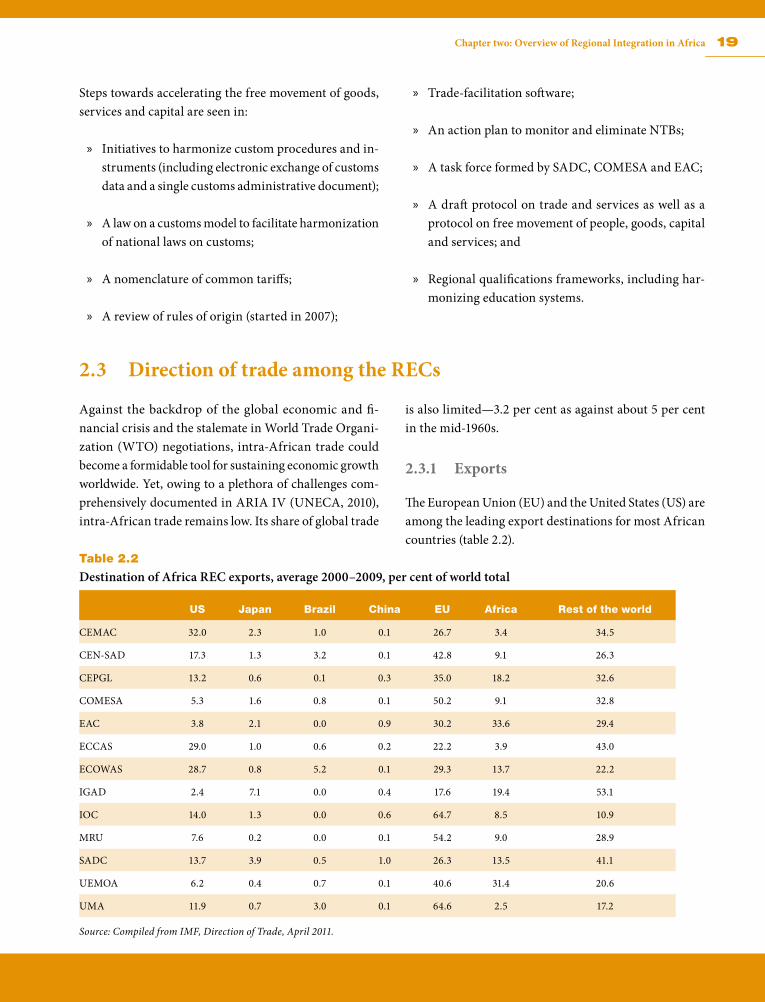
19Chapter two: Overview of Regional Integration in Africa
Steps towards accelerating the free movement of goods, services and capital are seen in:
» Initiatives to harmonize custom procedures and in-struments (including electronic exchange of customs data and a single customs administrative document);
» A law on a customs model to facilitate harmonization of national laws on customs;
» A nomenclature of common tariffs;
» A review of rules of origin (started in 2007);
» Trade-facilitation software;
» An action plan to monitor and eliminate NTBs;
» A task force formed by SADC, COMESA and EAC;
» A draft protocol on trade and services as well as a protocol on free movement of people, goods, capital and services; and
» Regional qualifications frameworks, including har-monizing education systems.
2.3 Direction of trade among the RECs
Against the backdrop of the global economic and fi-nancial crisis and the stalemate in World Trade Organi-zation (WTO) negotiations, intra-African trade could become a formidable tool for sustaining economic growth worldwide. Yet, owing to a plethora of challenges com-prehensively documented in ARIA IV (UNECA, 2010), intra-African trade remains low. Its share of global trade
is also limited—3.2 per cent as against about 5 per cent in the mid-1960s.
2.3.1 Exports
The European Union (EU) and the United States (US) are among the leading export destinations for most African countries (table 2.2).
Table 2.2
Destination of Africa REC exports, average 2000–2009, per cent of world total
US Japan Brazil China EU Africa Rest of the world
CEMAC 32.0 2.3 1.0 0.1 26.7 3.4 34.5
CEN-SAD 17.3 1.3 3.2 0.1 42.8 9.1 26.3
CEPGL 13.2 0.6 0.1 0.3 35.0 18.2 32.6
COMESA 5.3 1.6 0.8 0.1 50.2 9.1 32.8
EAC 3.8 2.1 0.0 0.9 30.2 33.6 29.4
ECCAS 29.0 1.0 0.6 0.2 22.2 3.9 43.0
ECOWAS 28.7 0.8 5.2 0.1 29.3 13.7 22.2
IGAD 2.4 7.1 0.0 0.4 17.6 19.4 53.1
IOC 14.0 1.3 0.0 0.6 64.7 8.5 10.9
MRU 7.6 0.2 0.0 0.1 54.2 9.0 28.9
SADC 13.7 3.9 0.5 1.0 26.3 13.5 41.1
UEMOA 6.2 0.4 0.7 0.1 40.6 31.4 20.6
UMA 11.9 0.7 3.0 0.1 64.6 2.5 17.2
Source: Compiled from IMF, Direction of Trade, April 2011.
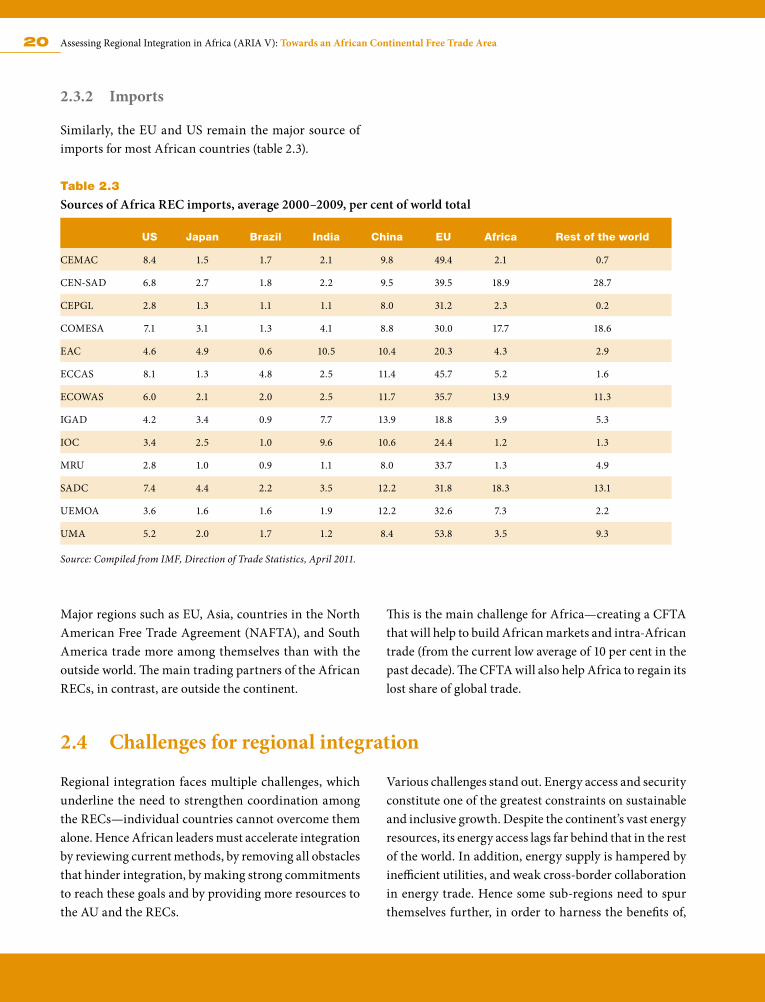
20 Assessing Regional Integration in Africa (ARIA V): Towards an African Continental Free Trade Area
2.3.2 Imports
Similarly, the EU and US remain the major source of imports for most African countries (table 2.3).
Table 2.3
Sources of Africa REC imports, average 2000–2009, per cent of world total
US Japan Brazil India China EU Africa Rest of the world
CEMAC 8.4 1.5 1.7 2.1 9.8 49.4 2.1 0.7
CEN-SAD 6.8 2.7 1.8 2.2 9.5 39.5 18.9 28.7
CEPGL 2.8 1.3 1.1 1.1 8.0 31.2 2.3 0.2
COMESA 7.1 3.1 1.3 4.1 8.8 30.0 17.7 18.6
EAC 4.6 4.9 0.6 10.5 10.4 20.3 4.3 2.9
ECCAS 8.1 1.3 4.8 2.5 11.4 45.7 5.2 1.6
ECOWAS 6.0 2.1 2.0 2.5 11.7 35.7 13.9 11.3
IGAD 4.2 3.4 0.9 7.7 13.9 18.8 3.9 5.3
IOC 3.4 2.5 1.0 9.6 10.6 24.4 1.2 1.3
MRU 2.8 1.0 0.9 1.1 8.0 33.7 1.3 4.9
SADC 7.4 4.4 2.2 3.5 12.2 31.8 18.3 13.1
UEMOA 3.6 1.6 1.6 1.9 12.2 32.6 7.3 2.2
UMA 5.2 2.0 1.7 1.2 8.4 53.8 3.5 9.3
Source: Compiled from IMF, Direction of Trade Statistics, April 2011.
Major regions such as EU, Asia, countries in the North American Free Trade Agreement (NAFTA), and South America trade more among themselves than with the outside world. The main trading partners of the African RECs, in contrast, are outside the continent.
This is the main challenge for Africa—creating a CFTA that will help to build African markets and intra-African trade (from the current low average of 10 per cent in the past decade). The CFTA will also help Africa to regain its lost share of global trade.
2.4 Challenges for regional integration
Regional integration faces multiple challenges, which underline the need to strengthen coordination among the RECs—individual countries cannot overcome them alone. Hence African leaders must accelerate integration by reviewing current methods, by removing all obstacles that hinder integration, by making strong commitments to reach these goals and by providing more resources to the AU and the RECs.
Various challenges stand out. Energy access and security constitute one of the greatest constraints on sustainable and inclusive growth. Despite the continent’s vast energy resources, its energy access lags far behind that in the rest of the world. In addition, energy supply is hampered by inefficient utilities, and weak cross-border collaboration in energy trade. Hence some sub-regions need to spur themselves further, in order to harness the benefits of,
21Chapter two: Overview of Regional Integration in Africa
for example, gas and power supply pools and regional energy markets.
The multiplicity of schemes holds back integration, by imposing a huge burden on countries’ inadequate ad-ministrative and financial capacities and by leading to conflicting obligations.
A smooth integration process is also held up by the lack of self-financing mechanisms for the RECS, limited pro-gress on fostering production integration and regional complementarities, or for developing regional infrastruc-ture (especially transport and communications) to drive market integration.
2.5 Initiatives to overcome some of the challenges
The AUC has adopted several policy decisions and initia-tives to accelerate regional integration.3
2.5.1 Some notable initiatives
The AU has accomplished or initiated the following:
» Rationalization of the RECs which has led to the recognition of the eight RECs;
» Elaboration and adoption of the African Charter on Statistics (ratification by countries in progress); and
» Establishment of financial institutions (Article 19 of the Constitutive Act) and adoption of the founding texts of the African Investment Bank (ratification of protocol and statutes in progress).
» Adoption of an Action Plan for boosting intra-African trade and a roadmap for fast-tracking the establish-ment of a continental free trade area by an indicative date of 2017.
2.5.2 COMESA–EAC–SADC
Inter-regional coordination is growing among the RECs. For instance, COMESA–EAC–SADC held their first tri-partite summit in October 2008, where the Heads of State and Government of the three RECs agreed to institu-tionalize establishing an FTA. This tripartite FTA brings together 26 African countries, a combined population of 530 million people, and a total GDP of US$ 630 bil-lion, which together represent over 50 per cent of Africa’s economic output. This initiative has indeed galvanized
the interest of Africa’s policymakers in a much broader CFTA, resulting in the Decision by the AU Summit in January 2012 to fast track it by an indicative date of 2017 and implement a comprehensive Action Plan to boost intra-African trade.
2.5.3 Minimum Integration Programme
Definition A mechanism for convergence between the RECs, the MIP—developed by the AUC and the RECs—consists of initiatives that the RECs have selected for accelerating and completing the regional and continental integration process (annex A2.1). It focuses on a few priority areas of concern at regional and continental levels, where RECs could strengthen their cooperation and benefit from their comparative advantages as well as best practices on inte-gration. It will be carried out by the RECs and member states of the AUC with the support of Africa’s various development partners.
The MIP incorporates attainable objectives from the AU’s Strategic Plan (2009–2012), as well as a monitoring and assessment mechanism. It allows for “variable geometry” in integration (that is, the RECs should integrate at differ-ent speeds), and so the RECs will continue implementing their own priority programmes while working on the other activities of the MIP.
ObjectivesThe primary objectives are to:
» Situate the RECs in relation to implementation of the Abuja Treaty;
22 Assessing Regional Integration in Africa (ARIA V): Towards an African Continental Free Trade Area
» Highlight the regional and continental priority pro-grammes initiated by the AUC whose implemen-tation, according to the principle of subsidiarity, falls within the competence of national or regional authorities;
» Identify the regional and continental projects within the AUC and the RECs whose implementation de-pends on the principle of subsidiarity;
» Strengthen current initiatives on economic coopera-tion between RECs, and identify measures likely to accelerate integration in priority sectors or areas;
» Identify priority sectors requiring bold coordination and harmonization, within each REC and among them;
» Emulate successful integration experiences in cer-tain RECs and replicate them in others (such as COMESA–EAC–SADC);
» Help the RECs to identify and implement priority activities to fulfil the integration stages in Article 6 of the Abuja Treaty and help the RECs to implement the MIP through a clearly defined timetable; and
» Identify projects and programmes where implementa-tion is based on inter-REC relationships.
Relevant sectors and sub-sectorsThe RECs have accepted the following as priority sectors: free movement of person, goods, services and capital; peace and security; infrastructure and energy; agriculture; trade; industry; investment; and statistics. They also con-sider it important to undertake urgent activities in political affairs (71 per cent); science and technology (57 per cent); and social affairs (57 per cent).
Challenges in implementing the MIPFunding is a major constraint. A proposal has been made and endorsed by the Heads of State and Government to create an integration fund for financing the MIP. The MIP could also turn to other sources:
» Internal sources (statutory contributions from mem-ber states, and other sources being identified);
» Contributions from pan-African financial institu-tions (AfDB, African Investment Bank, and African Central Bank); and
» External sources (primarily development partners).
The AUC will continue consultations with the RECs to develop a funding strategy, which will:
» Identify the financial sources of the different RECs;
» Identify the funds used by the RECs to implement current activities and MIP projects;
» Identify existing funds in the AUC allocated to cur-rent MIP activities;
» Estimate the amounts required to implement each MIP activity or project;
» Mobilize resources from development partners;
» Propose measures to create and manage the proposed integration fund; and
» Determine the relations between the RECs’ special-ized regional funds and the integration fund.
23Chapter two: Overview of Regional Integration in Africa
2.6 Conclusions and recommendations
The RECs and the pan-African institutions have made great efforts to expedite regional integration—although more needs to be done. The success of regional integra-tion will depend on stakeholders’ determination to follow the Abuja Treaty and realize the AEC. RECs will have to continue their laudable efforts to reinforce coordination of their programmes and share best practices and other experiences through programmes and activities in their regions. Supported by member states, the AU should act as leader in integration.
The following further recommendations are put forward to help strengthen the steady progress being made in Africa’s integration and address the challenges:
» Member states are urged to accelerate the implementa-tion of decisions, treaties and protocols at the national level. In this regard, they are urged to ratify and imple-ment all the protocols related to integration matters, and integrate the MIP, PIDA and other regional and continental initiatives within their national develop-ment plans, strategies and budgetary allocations.
» RECs need to harmonize their activities further.
» Average Africans need to be involved in the integra-tion process more. This requires more information on how it works, which will also help to offer greater transparency of the process and secure greater buy-in from the populace.
» Sectoral meetings between AUC, UNECA, AfDB and the RECs should be further encouraged to assist in enhancing the integration process.
» Efforts to fully operationalize the comprehensive Programme for Infrastructure Development in Africa (PIDA) should be enhanced because effective and af-fordable physical infrastructure and services as well as ICT are needed to support market integration. These would greatly lower the cost of doing business in Africa, in turn helping to expand trade and integrate markets, regionally and continentally.
» The AUC, with its partners, are urged to mobilize internal and external resources to run the MIP, host sectoral training sessions to build capacity among RECs’ personnel and develop a monitoring and assess-ment framework to track progress towards integration objectives, and to evaluate the results of programmes and projects directed towards those objectives.
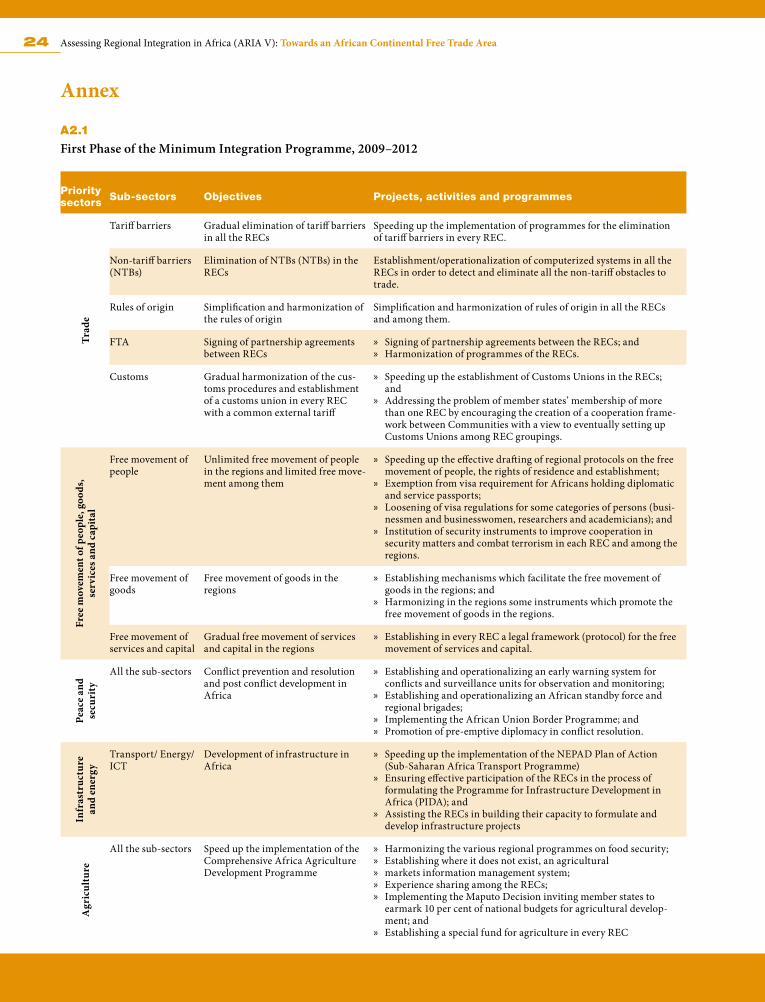
24 Assessing Regional Integration in Africa (ARIA V): Towards an African Continental Free Trade Area
Annex
A2.1
First Phase of the Minimum Integration Programme, 2009–2012
Priority sectors Sub-sectors Objectives Projects, activities and programmes
Trad
e
Tariff barriers Gradual elimination of tariff barriers in all the RECs
Speeding up the implementation of programmes for the elimination of tariff barriers in every REC.
Non-tariff barriers (NTBs)
Elimination of NTBs (NTBs) in the RECs
Establishment/operationalization of computerized systems in all the RECs in order to detect and eliminate all the non-tariff obstacles to trade.
Rules of origin Simplification and harmonization of the rules of origin
Simplification and harmonization of rules of origin in all the RECs and among them.
FTA Signing of partnership agreements between RECs
» Signing of partnership agreements between the RECs; and » Harmonization of programmes of the RECs.
Customs Gradual harmonization of the cus-toms procedures and establishment of a customs union in every REC with a common external tariff
» Speeding up the establishment of Customs Unions in the RECs; and
» Addressing the problem of member states’ membership of more than one REC by encouraging the creation of a cooperation frame-work between Communities with a view to eventually setting up Customs Unions among REC groupings.
Free
mov
emen
t of p
eopl
e, g
oods
, se
rvic
es a
nd c
apit
al
Free movement of people
Unlimited free movement of people in the regions and limited free move-ment among them
» Speeding up the effective drafting of regional protocols on the free movement of people, the rights of residence and establishment;
» Exemption from visa requirement for Africans holding diplomatic and service passports;
» Loosening of visa regulations for some categories of persons (busi-nessmen and businesswomen, researchers and academicians); and
» Institution of security instruments to improve cooperation in security matters and combat terrorism in each REC and among the regions.
Free movement of goods
Free movement of goods in the regions
» Establishing mechanisms which facilitate the free movement of goods in the regions; and
» Harmonizing in the regions some instruments which promote the free movement of goods in the regions.
Free movement of services and capital
Gradual free movement of services and capital in the regions
» Establishing in every REC a legal framework (protocol) for the free movement of services and capital.
Peac
e an
d se
curi
ty
All the sub-sectors Conflict prevention and resolution and post conflict development in Africa
» Establishing and operationalizing an early warning system for conflicts and surveillance units for observation and monitoring;
» Establishing and operationalizing an African standby force and regional brigades;
» Implementing the African Union Border Programme; and » Promotion of pre-emptive diplomacy in conflict resolution.
Infr
astr
uctu
re
and
ener
gy
Transport/ Energy/ICT
Development of infrastructure in Africa
» Speeding up the implementation of the NEPAD Plan of Action (Sub-Saharan Africa Transport Programme)
» Ensuring effective participation of the RECs in the process of formulating the Programme for Infrastructure Development in Africa (PIDA); and
» Assisting the RECs in building their capacity to formulate and develop infrastructure projects
Agr
icul
ture
All the sub-sectors Speed up the implementation of the Comprehensive Africa Agriculture Development Programme
» Harmonizing the various regional programmes on food security; » Establishing where it does not exist, an agricultural » markets information management system; » Experience sharing among the RECs; » Implementing the Maputo Decision inviting member states to
earmark 10 per cent of national budgets for agricultural develop-ment; and
» Establishing a special fund for agriculture in every REC
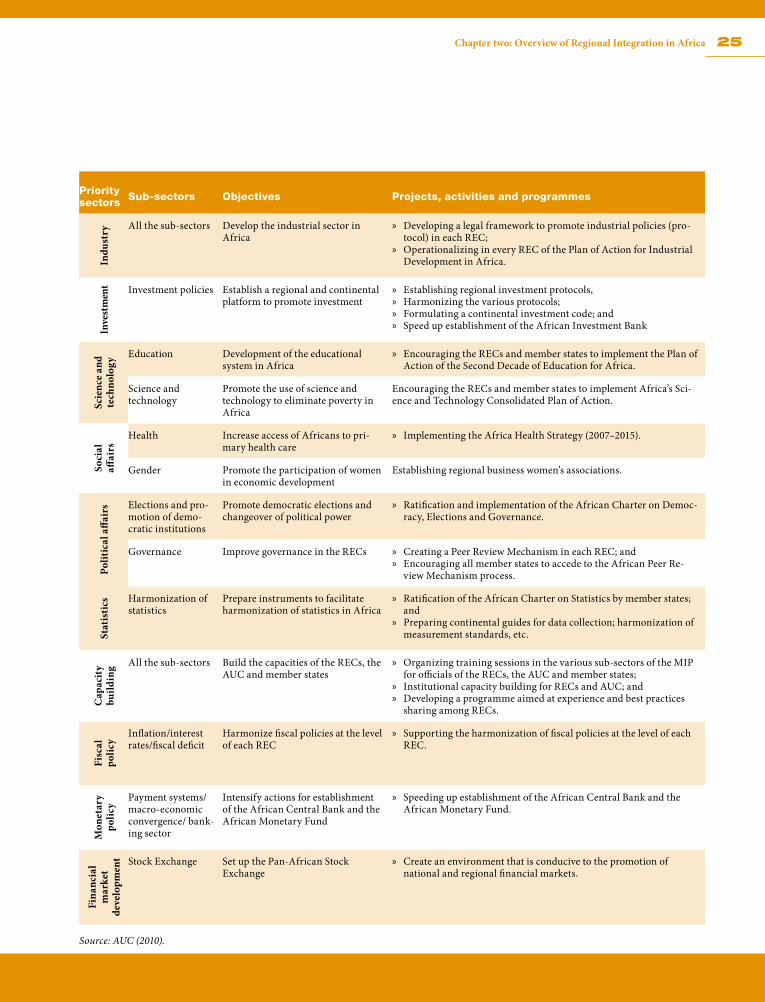
25Chapter two: Overview of Regional Integration in Africa
Priority sectors Sub-sectors Objectives Projects, activities and programmes
Indu
stry All the sub-sectors Develop the industrial sector in
Africa » Developing a legal framework to promote industrial policies (pro-
tocol) in each REC; » Operationalizing in every REC of the Plan of Action for Industrial
Development in Africa.
Inve
stm
ent Investment policies Establish a regional and continental
platform to promote investment » Establishing regional investment protocols, » Harmonizing the various protocols; » Formulating a continental investment code; and » Speed up establishment of the African Investment Bank
Scie
nce
and
tech
nolo
gy
Education Development of the educational system in Africa
» Encouraging the RECs and member states to implement the Plan of Action of the Second Decade of Education for Africa.
Science and technology
Promote the use of science and technology to eliminate poverty in Africa
Encouraging the RECs and member states to implement Africa’s Sci-ence and Technology Consolidated Plan of Action.
Soci
al
affai
rs
Health Increase access of Africans to pri-mary health care
» Implementing the Africa Health Strategy (2007–2015).
Gender Promote the participation of women in economic development
Establishing regional business women’s associations.
Polit
ical
affa
irs Elections and pro-
motion of demo-cratic institutions
Promote democratic elections and changeover of political power
» Ratification and implementation of the African Charter on Democ-racy, Elections and Governance.
Governance Improve governance in the RECs » Creating a Peer Review Mechanism in each REC; and » Encouraging all member states to accede to the African Peer Re-
view Mechanism process.
Stat
isti
cs Harmonization of statistics
Prepare instruments to facilitate harmonization of statistics in Africa
» Ratification of the African Charter on Statistics by member states; and
» Preparing continental guides for data collection; harmonization of measurement standards, etc.
Cap
acit
y bu
ildin
g All the sub-sectors Build the capacities of the RECs, the AUC and member states
» Organizing training sessions in the various sub-sectors of the MIP for officials of the RECs, the AUC and member states;
» Institutional capacity building for RECs and AUC; and » Developing a programme aimed at experience and best practices
sharing among RECs.
Fisc
al
polic
y
Inflation/interest rates/fiscal deficit
Harmonize fiscal policies at the level of each REC
» Supporting the harmonization of fiscal policies at the level of each REC.
Mon
etar
y po
licy
Payment systems/ macro-economic convergence/ bank-ing sector
Intensify actions for establishment of the African Central Bank and the African Monetary Fund
» Speeding up establishment of the African Central Bank and the African Monetary Fund.
Fina
ncia
l m
arke
t de
velo
pmen
t Stock Exchange Set up the Pan-African Stock Exchange
» Create an environment that is conducive to the promotion of national and regional financial markets.
Source: AUC (2010).
26 Assessing Regional Integration in Africa (ARIA V): Towards an African Continental Free Trade Area
Bibliography
AUC (African Union Commission). 2007. Rationalisation of the regional economic communities (RECs), review of the Abuja Treaty and adoption of a minimum integration progamme. Addis Ababa.
———. 2009. Status of integration in Africa. Addis Ababa.
———. 2007. African integration review. Vol. 1, No. 1–2. Addis Ababa.
———. 2010. “Minimum Integration Programme.” Co-ordinated and elaborated by the Economic Affairs Department. Addis Ababa.
CEN-SAD. 2006. Establishment of a free trade zone be-tween CEN-SAD member states, final report. CEN-SAD Secretariat, Tripoli, Libya.
———. 2007a. Rapport de l’atelier de travail avec les com-munautes economiques regionales pour la promotion concertee du secteur rural. CEN-SAD Secretariat, Tripoli, Libya.
———. 2007b. Rural development strategy and the man-agement of natural resources in the CEN-SAD re-gion: priority areas for 2010. CEN-SAD Secretariat, Tripoli, Libya.
COMESA. 2004. Report of the Secretary General to the 9th Summit of the COMESA Authority of Heads of State and Government. Lusaka, Zambia.
———. 2006a. COMESA Annual Report 2006. COMESA Secretariat, Lusaka, Zambia.
———. 2006b. COMESA Strategic Plan. COMESA Sec-retariat, Lusaka, Zambia.
———. 2007a. “COMESA heads of state and government summit.” Souvenir Magazine and Report, Nairobi, Kenya, May. COMESA Secretariat, Lusaka, Zambia.
———. 2007b. COMESA fund. COMESA Secretariat, Lusaka, Zambia.
———. 2007c. COMESA in brief, 3rd ed. COMESA Sec-retariat, Lusaka, Zambia.
———. n.d. The COMESA programme for peace and secu-rity. COMESA Secretariat, Lusaka, Zambia.
———. n.d. The process of regional integration in COMESA. COMESA Secretariat, Lusaka, Zambia.
EAC (East African Community). 2006. Report of the 8th summit of the East African Community Heads of State. EAC/SHS/08/2006. EAC Secretariat, Arusha, Tanzania, November 30,
———. 2007. EAC Annual Report 2006. EAC Secretariat, Arusha, Tanzania.
———. 2008. Final report on the 15th meeting of the Coun-cil of Ministers. EAC Secretariat, Arusha, Tanzania, March 17–18.
———. n.d. EAC development strategy 2006–2010. EAC Secretariat, Arusha, Tanzania.
ECCAS. 2007. Étude de Priorisation des Projets du Plan Directeur Consensuel des Transports en Afrique Centrale (PDCT-AC), 1st ed. ECCAS Secretariat, Libreville, Gabon.
———. 2008. “India-Africa Summit Meeting Central Africa’s Priorities.” ECCAS Secretariat, Libreville, Gabon.
———. n.d. “Brochure.” ECCAS Secretariat, Libreville, Gabon.
ECOWAS. 1999. Protocol relating to conflict prevention, management, resolution, peace-keeping and security. ECOWAS Executive Secretariat, Abuja, Nigeria.
27Chapter two: Overview of Regional Integration in Africa
———. 2006. “Convention on small arms and light weap-ons, their ammunition and other related materials.” ECOWAS Executive Secretariat, Abuja, Nigeria, June 14.
———. 2007. Annual report: Consolidation of the restruc-tured community intuitions for the effectiveness and accelerated regional integration and development. ECOWAS Executive Secretariat, Abuja, Nigeria.
———. n.d. A compendium of protocols, conventions and decisions relating to free movement of persons, goods and services. ECOWAS Executive Secretariat, Abuja, Nigeria.
———. n.d. “Achievements of ECOWAS market integra-tion programme.” http://www.sec.ECOWAS.int/sitecedeao/english/achievements-1.htm.
IGAD (Intergovernmental Authority on Development. 1996a. “Agreement establishing the Inter-Govern-mental Authority on Development.” Djibouti City, Djibouti.
———. 1996b. “Assembly of heads of state of government: agreement establishing the Inter-Governmental Authority on Development.” IGAD Executive Sec-retariat, Djibouti City, Djibouti.
———. 2003. IGAD strategy. Djibouti City, Djibouti.
———. 2006. Annual report of IGAD Executive Secretariat for 2006 and planned activities for 2007. IGAD Ex-ecutive Secretariat, Djibouti City, Djibouti.
———. 2008. Final report of the second Inter-Regional Coordination Committee. Djibouti City, Djibouti.
SADC (Southern African Development Community). 2007. 2007/2008 official SADC trade, industry and investment review, 11th ed. (1997–2008). SADC Sec-retariat, Gaborone, Botswana.
———. n.d. Implementation of programmes and strategies through a decentralised approach: the case of the Directorate of Infrastructure and Services. SADC Secretariat, Gaborone, Botswana.
———. n.d. “Trade industry, finance and investment.” Presentation. SADC Secretariat, Gaborone, Botswana.
———. n.d. Plan stratégique indicatif de développement regional. SADC Secretariat, Gaborone, Botswana.
UNECA (United Nations Economic Commission for Af-rica). 2006. Assessing regional integration in Africa II: rationalizing regional economic communities. Addis Ababa. http://www.uneca.org/aria2/full_ver-sion.pdf.
———. 2008. Assessing regional integration in Africa III: towards monetary and financial integration in Africa. Addis Ababa. http://www.uneca.org/aria3/ARIA3_ENG.pdf.
———. 2009. Economic report on Africa 2009: developing African agriculture through regional value chains. Addis Ababa.
———. 2010. Assessing regional integration in Africa IV: enhancing intra-African trade. Addis Ababa. http://www.uneca.org/aria4/ARIA4Full.pdf.
Notes1 All full forms are given in the list of acronyms.2 UEMOA (WAEMU in its English acronym) comprises Benin,
Burkina Faso, Côte d’Ivoire, Guinea-Bissau, Mali, Niger, Senegal and Togo.
3 Table 2.1 highlights the progress by the RECs in implementing the Abuja Treaty.

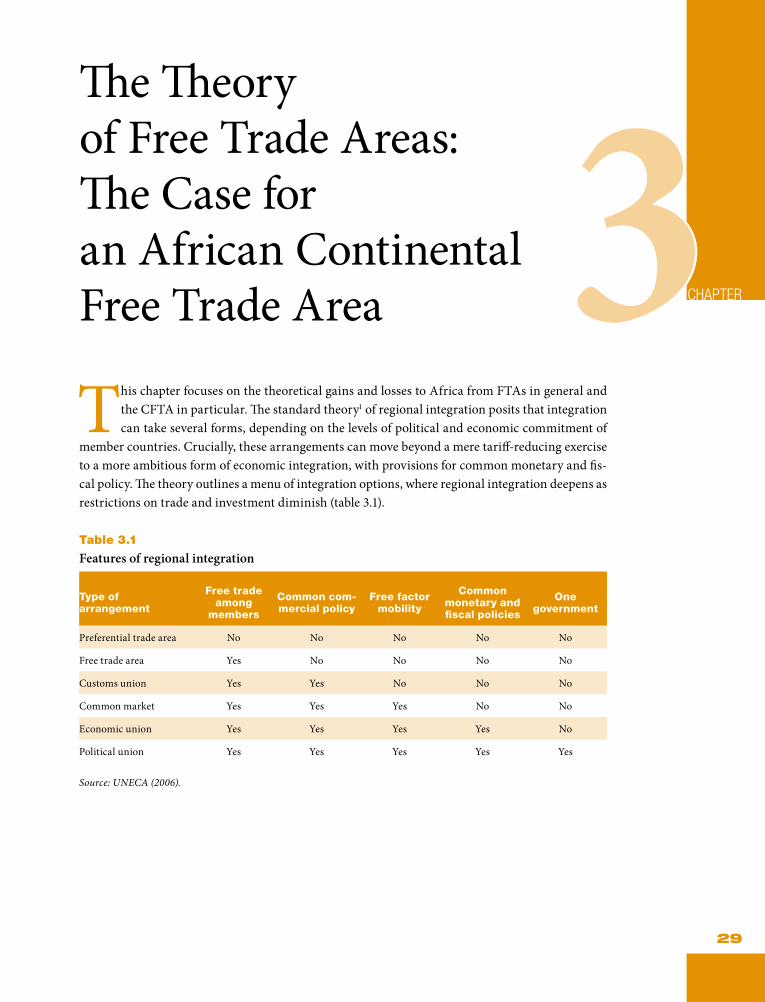
CHAPTER
29
This chapter focuses on the theoretical gains and losses to Africa from FTAs in general and the CFTA in particular. The standard theory1 of regional integration posits that integration can take several forms, depending on the levels of political and economic commitment of
member countries. Crucially, these arrangements can move beyond a mere tariff-reducing exercise to a more ambitious form of economic integration, with provisions for common monetary and fis-cal policy. The theory outlines a menu of integration options, where regional integration deepens as restrictions on trade and investment diminish (table 3.1).
Table 3.1
Features of regional integration
Type of arrangement
Free trade among
members
Common com-mercial policy
Free factor mobility
Common monetary and fiscal policies
One government
Preferential trade area No No No No No
Free trade area Yes No No No No
Customs union Yes Yes No No No
Common market Yes Yes Yes No No
Economic union Yes Yes Yes Yes No
Political union Yes Yes Yes Yes Yes
Source: UNECA (2006).
The Theory of Free Trade Areas: The Case for an African Continental Free Trade Area 3
30 Assessing Regional Integration in Africa (ARIA V): Towards an African Continental Free Trade Area
The growing enthusiasm for most of Africa’s regional arrangements stems from the underlying principles of traditional trade theory, which postulates that liberaliz-ing trade and investment among two or more countries generally has positive welfare effects for the countries concerned and leads to economic growth and poverty reduction, as articulated in ARIA IV (UNECA, 2010). One of the strongest justifications for regional integra-tion on the continent is the overriding desire for greater economic independence and development.
The theory of FTAs is largely rooted in the theory of cus-toms unions, and can be defined as a process to reduce or abolish tariff and non-tariff restrictions on trade of goods and services among a group of countries in a given geographical area.
The theoretical literature shows a wide consensus that FTAs’ most important benefits are heavily anchored in the
expected gains from an enlarged market. With free and unrestricted movement of goods and services, investment is expected to more easily respond to the requirements of market demand and supply in the FTA, leading to more efficient resource allocation. But to fully reap the benefits of an FTA, members have to meet certain conditions: a stable and predictable trade policy environment; the re-moval of restrictions on competition among firms within the region; and trade-facilitation measures reducing bar-riers to trade including NTBs. In addition, measures to protect foreign direct investment (FDI) through broader property rights and special regional arbitration courts provide incentives for investors.
The objective of this chapter is to highlight the potential gains from the planned CFTA, which it does by discussing the effects of integration from a theoretical perspective and the benchmarks to measure gains or losses against.
3.1 Theoretical perspectives on potential gains and losses from FTAs
The traditional approach to integration theory does not provide a full analysis of the welfare gains and losses to countries adhering to free trade principles—and particu-larly not for developing countries.
Jacob Viner’s (1950) custom union theory has been widely used to analyse net gains and losses of regional integra-tion. According to Viner, preferential trade arrangements,
including FTAs, bring important changes to national and global welfare through two distinct effects—the static and dynamic. The former refers to resource allocation resulting from changing relative prices associated with the changed pattern of tariffs, and the latter refers to the ability to exploit economies of scale and to achieve levels of investment and economic growth due to efficiency and size.
3.1.1 Static effects: trade creation and trade diversion
The phenomenon of regional integration—FTAs in particular—has posed serious analytical challenges for trade theorists mainly because regional integration schemes conceptually combine elements of both free trade (within the union) and protectionism (against non-members). Of course, while the trade liberalization aspect of regional integration is consistent with the neo-classical perception of a welfare-enhancing trade policy regime, the discriminatory aspect of the arrangement is potentially detrimental to attaining both regional and global welfare.
According to the Viner model, static effects of integration result from a one-time reallocation of economic factors of production and natural resources and entail negative and positive impacts on welfare. The model provides a tool for analysing the welfare effects of FTAs by introducing the concepts of trade creation and trade diversion. The extent to which the changes in welfare occur depends greatly on the predominance of either one of these effects.
Trade creation refers to the increased level of trade that results from the abolition of trade barriers within the
31Chapter three: The Theory of Free Trade Areas: The Case for an African Continental Free Trade Area
FTA. According to the assumptions of trade creation, the pattern of trade heavily reflects the differences in comparative advantage among member countries. Trade is said to have been created when countries give up on the production of goods and services that they produce less efficiently in exchange for the same goods and services produced more efficiently by a partner country. Thus regional and global welfare is said to have been enhanced when the changes introduced by the FTA produce a shift in consumption from a higher-cost domestic product to a lower-cost partner-country product.
So, what are the conditions for a trade-creating regional integration arrangement? Robson (1984) states that trade is more likely to be created when the economic area of integration and the number of member countries is large; tariffs and NTBs have been reduced or eliminated as a result of the FTA; and the economies of the integrated countries are competitive, having comparable levels of development and a complementary resource base.
The trade diversion effect, in contrast, is seen as a cost to the region and the world at large. Trade is said to have
been diverted when the shift in consumption is more in favour of higher-cost products and services from the re-gion than lower-cost products and services produced by countries outside the region. Thus trade diversion could produce an uncompetitive environment, inefficiency and loss of consumer surplus.
Although it is generally accepted as a theoretical fact that trade creation and trade diversion are potential outcomes of preferential trading systems and that they tend to move economic welfare in opposite directions (Viner, 1950), the net effect of the two phenomena is an empirical issue (see next section).
For Africa, a focus of static economic theory with the impact of trade diversion on global welfare may over-look the fact that the continent’s integration objectives often transcend narrow economic considerations. Its integration approach is developmental, and it has cogent, development-related justifications, which lie outside the framework of conventional static theoretical analysis for its regional integration.
3.1.2 Dynamic effects
Dynamic gains from FTAs are attained over the long run. They are more than a one-off enhancement of wel-fare through spillover effects. These effects often result from economies of scale (due to an enlarged market); efficiency gains (due to the competitive environment and transfer of technology); increased inward FDI flows; and removal of contingent protection and trade barriers. The most important economic gains may stem from the cheaper unit costs induced by economic cooperation and coordination of policies (De Melo, Panagariya and Rodrik, 1993), including those for region-wide transport and communications. Africa itself may see dynamic gains from regional integration in six main areas.
The enlarged regional markets provide incentives for FDI as well as private cross-border investment. Appropriate trade and macro-economic policy regimes can encour-age businesses to set up optimum-sized industrial and service projects, which were formerly held back by the
small size of national markets. Most African economies are too small to launch viable steel projects, for example, yet this industry’s pivotal role for developing countries to industrialize is widely recognized. The combination of a stable investment climate, development of transport and communications infrastructure as well as sound regional economic policy could provide the incentives for large investments in the manufacturing and service projects that require economies of scale.
Regional integration is likely to improve efficiency as a result of competitive pressures among rival firms. Monopolies and oligopolistic market structures are major impediments to efficient production in most African countries. Inefficient national enterprises (including government monopolies) often keep reaping abnormal profits either because laws protect them or because industry offers no credible ri-vals. Adopting and enforcing regional competition rules
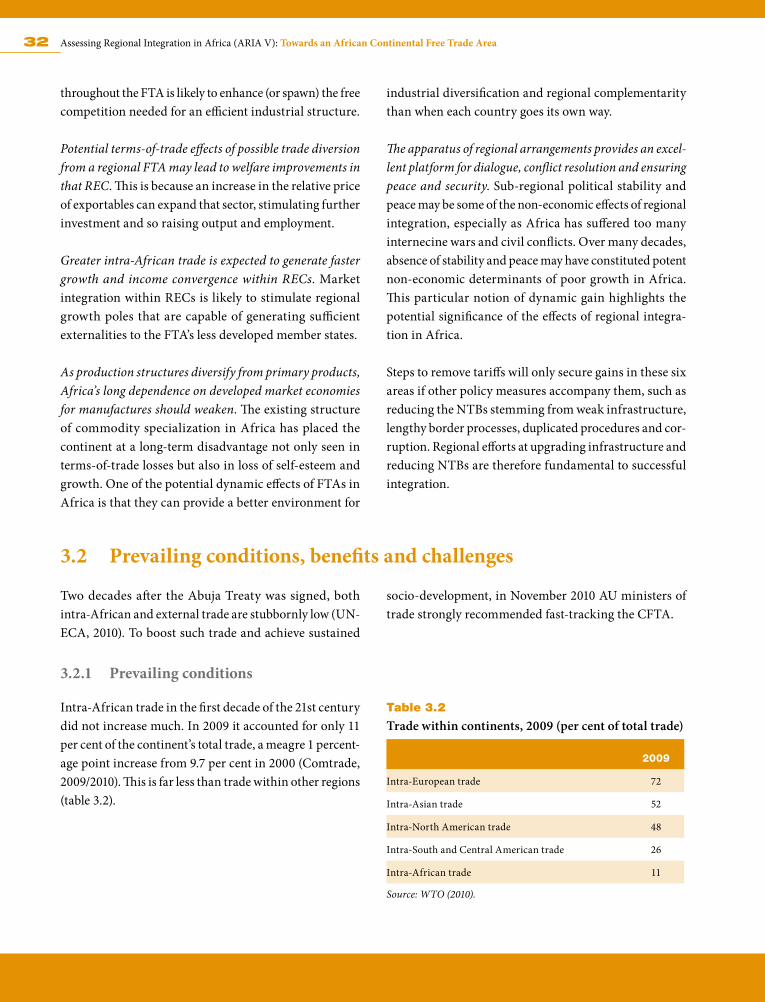
32 Assessing Regional Integration in Africa (ARIA V): Towards an African Continental Free Trade Area
throughout the FTA is likely to enhance (or spawn) the free competition needed for an efficient industrial structure.
Potential terms-of-trade effects of possible trade diversion from a regional FTA may lead to welfare improvements in that REC. This is because an increase in the relative price of exportables can expand that sector, stimulating further investment and so raising output and employment.
Greater intra-African trade is expected to generate faster growth and income convergence within RECs. Market integration within RECs is likely to stimulate regional growth poles that are capable of generating sufficient externalities to the FTA’s less developed member states.
As production structures diversify from primary products, Africa’s long dependence on developed market economies for manufactures should weaken. The existing structure of commodity specialization in Africa has placed the continent at a long-term disadvantage not only seen in terms-of-trade losses but also in loss of self-esteem and growth. One of the potential dynamic effects of FTAs in Africa is that they can provide a better environment for
industrial diversification and regional complementarity than when each country goes its own way.
The apparatus of regional arrangements provides an excel-lent platform for dialogue, conflict resolution and ensuring peace and security. Sub-regional political stability and peace may be some of the non-economic effects of regional integration, especially as Africa has suffered too many internecine wars and civil conflicts. Over many decades, absence of stability and peace may have constituted potent non-economic determinants of poor growth in Africa. This particular notion of dynamic gain highlights the potential significance of the effects of regional integra-tion in Africa.
Steps to remove tariffs will only secure gains in these six areas if other policy measures accompany them, such as reducing the NTBs stemming from weak infrastructure, lengthy border processes, duplicated procedures and cor-ruption. Regional efforts at upgrading infrastructure and reducing NTBs are therefore fundamental to successful integration.
3.2 Prevailing conditions, benefits and challenges
Two decades after the Abuja Treaty was signed, both intra-African and external trade are stubbornly low (UN-ECA, 2010). To boost such trade and achieve sustained
socio-development, in November 2010 AU ministers of trade strongly recommended fast-tracking the CFTA.
3.2.1 Prevailing conditions
Intra-African trade in the first decade of the 21st century did not increase much. In 2009 it accounted for only 11 per cent of the continent’s total trade, a meagre 1 percent-age point increase from 9.7 per cent in 2000 (Comtrade, 2009/2010). This is far less than trade within other regions (table 3.2).
Table 3.2
Trade within continents, 2009 (per cent of total trade)
2009
Intra-European trade 72
Intra-Asian trade 52
Intra-North American trade 48
Intra-South and Central American trade 26
Intra-African trade 11
Source: WTO (2010).
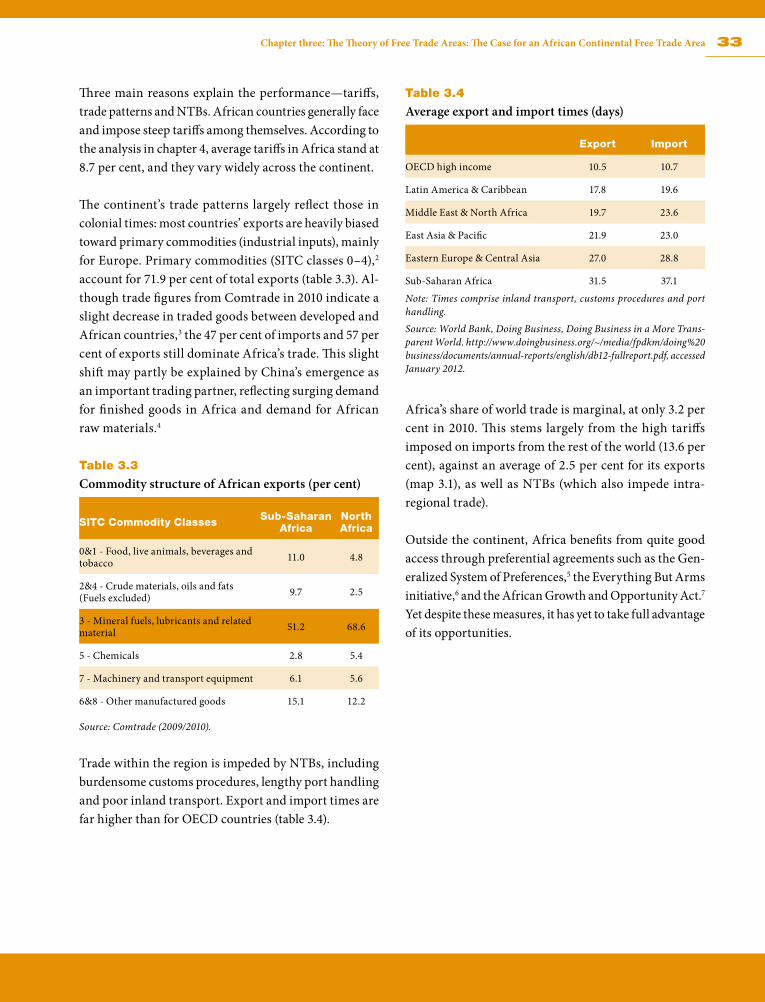
33Chapter three: The Theory of Free Trade Areas: The Case for an African Continental Free Trade Area
Three main reasons explain the performance—tariffs, trade patterns and NTBs. African countries generally face and impose steep tariffs among themselves. According to the analysis in chapter 4, average tariffs in Africa stand at 8.7 per cent, and they vary widely across the continent.
The continent’s trade patterns largely reflect those in colonial times: most countries’ exports are heavily biased toward primary commodities (industrial inputs), mainly for Europe. Primary commodities (SITC classes 0–4),2 account for 71.9 per cent of total exports (table 3.3). Al-though trade figures from Comtrade in 2010 indicate a slight decrease in traded goods between developed and African countries,3 the 47 per cent of imports and 57 per cent of exports still dominate Africa’s trade. This slight shift may partly be explained by China’s emergence as an important trading partner, reflecting surging demand for finished goods in Africa and demand for African raw materials.4
Table 3.3
Commodity structure of African exports (per cent)
SITC Commodity Classes Sub-Saharan Africa
North Africa
0&1 - Food, live animals, beverages and tobacco 11.0 4.8
2&4 - Crude materials, oils and fats (Fuels excluded) 9.7 2.5
3 - Mineral fuels, lubricants and related material 51.2 68.6
5 - Chemicals 2.8 5.4
7 - Machinery and transport equipment 6.1 5.6
6&8 - Other manufactured goods 15.1 12.2
Source: Comtrade (2009/2010).
Trade within the region is impeded by NTBs, including burdensome customs procedures, lengthy port handling and poor inland transport. Export and import times are far higher than for OECD countries (table 3.4).
Table 3.4
Average export and import times (days)
Export Import
OECD high income 10.5 10.7
Latin America & Caribbean 17.8 19.6
Middle East & North Africa 19.7 23.6
East Asia & Pacific 21.9 23.0
Eastern Europe & Central Asia 27.0 28.8
Sub-Saharan Africa 31.5 37.1
Note: Times comprise inland transport, customs procedures and port handling.
Source: World Bank, Doing Business, Doing Business in a More Trans-parent World. http://www.doingbusiness.org/~/media/fpdkm/doing%20business/documents/annual-reports/english/db12-fullreport.pdf, accessed January 2012.
Africa’s share of world trade is marginal, at only 3.2 per cent in 2010. This stems largely from the high tariffs imposed on imports from the rest of the world (13.6 per cent), against an average of 2.5 per cent for its exports (map 3.1), as well as NTBs (which also impede intra-regional trade).
Outside the continent, Africa benefits from quite good access through preferential agreements such as the Gen-eralized System of Preferences,5 the Everything But Arms initiative,6 and the African Growth and Opportunity Act.7
Yet despite these measures, it has yet to take full advantage of its opportunities.
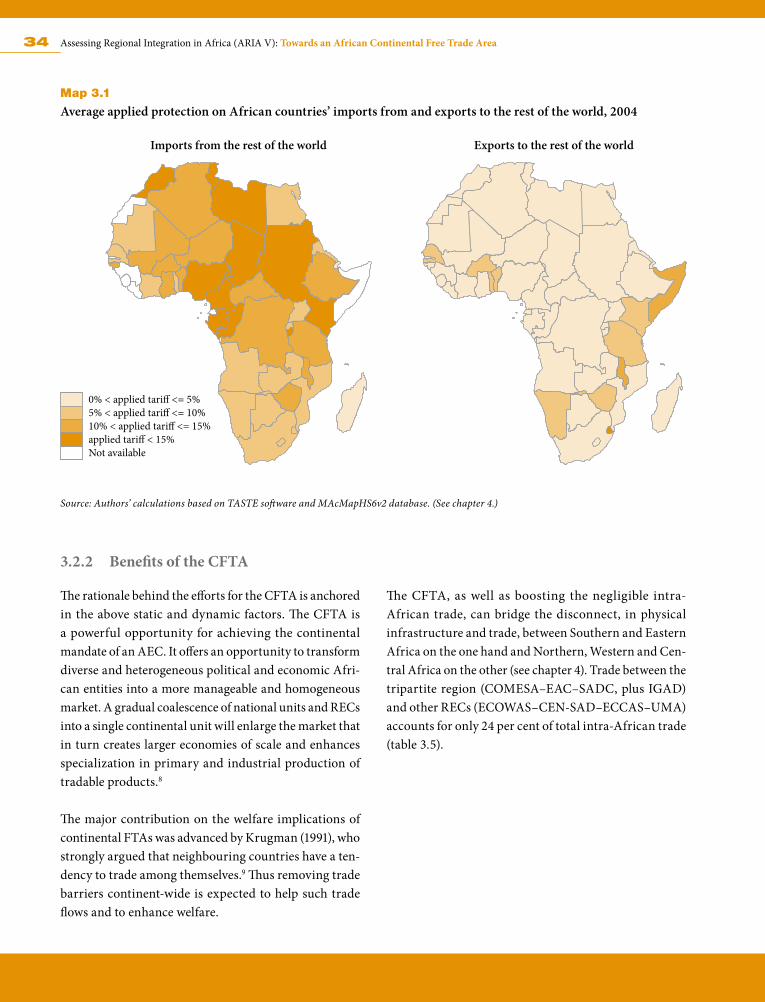
34 Assessing Regional Integration in Africa (ARIA V): Towards an African Continental Free Trade Area
Map 3.1
Average applied protection on African countries’ imports from and exports to the rest of the world, 2004
Source: Authors’ calculations based on TASTE software and MAcMapHS6v2 database. (See chapter 4.)
3.2.2 Benefits of the CFTA
The rationale behind the efforts for the CFTA is anchored in the above static and dynamic factors. The CFTA is a powerful opportunity for achieving the continental mandate of an AEC. It offers an opportunity to transform diverse and heterogeneous political and economic Afri-can entities into a more manageable and homogeneous market. A gradual coalescence of national units and RECs into a single continental unit will enlarge the market that in turn creates larger economies of scale and enhances specialization in primary and industrial production of tradable products.8
The major contribution on the welfare implications of continental FTAs was advanced by Krugman (1991), who strongly argued that neighbouring countries have a ten-dency to trade among themselves.9 Thus removing trade barriers continent-wide is expected to help such trade flows and to enhance welfare.
The CFTA, as well as boosting the negligible intra-African trade, can bridge the disconnect, in physical infrastructure and trade, between Southern and Eastern Africa on the one hand and Northern, Western and Cen-tral Africa on the other (see chapter 4). Trade between the tripartite region (COMESA–EAC–SADC, plus IGAD) and other RECs (ECOWAS–CEN-SAD–ECCAS–UMA) accounts for only 24 per cent of total intra-African trade (table 3.5).
0% < applied tari� <= 5%5% < applied tari� <= 10%10% < applied tari� <= 15%applied tari� < 15%Not available
Imports from the rest of the world Exports to the rest of the world
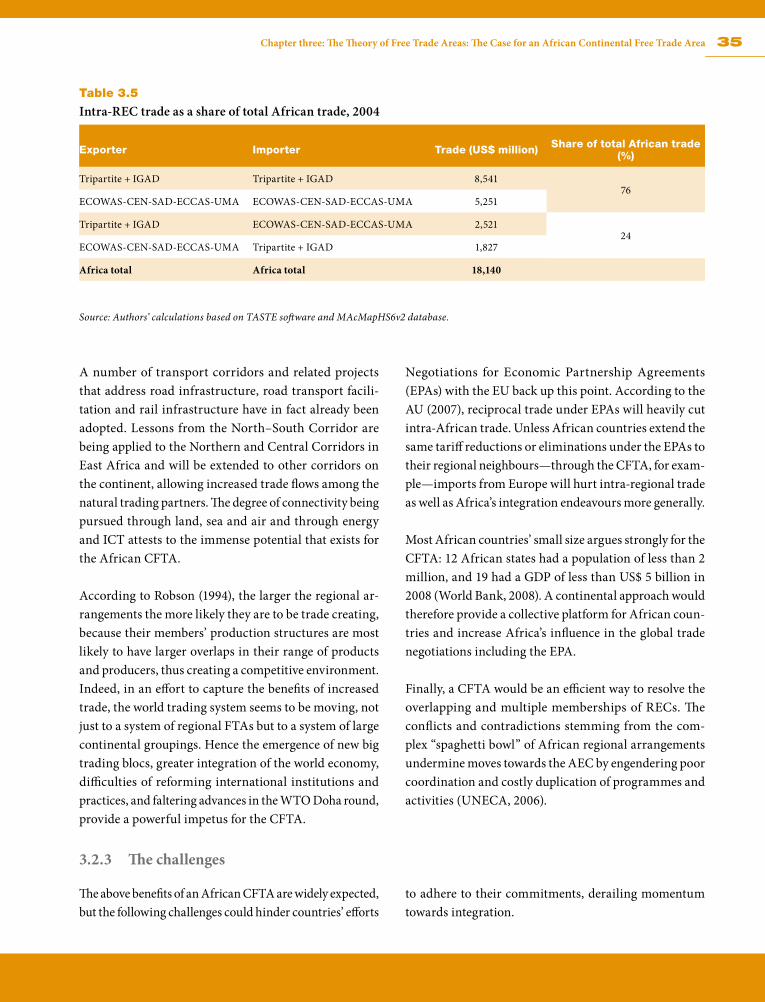
35Chapter three: The Theory of Free Trade Areas: The Case for an African Continental Free Trade Area
Table 3.5
Intra-REC trade as a share of total African trade, 2004
Exporter Importer Trade (US$ million) Share of total African trade (%)
Tripartite + IGAD Tripartite + IGAD 8,54176
ECOWAS-CEN-SAD-ECCAS-UMA ECOWAS-CEN-SAD-ECCAS-UMA 5,251
Tripartite + IGAD ECOWAS-CEN-SAD-ECCAS-UMA 2,52124
ECOWAS-CEN-SAD-ECCAS-UMA Tripartite + IGAD 1,827
Africa total Africa total 18,140
Source: Authors’ calculations based on TASTE software and MAcMapHS6v2 database.
A number of transport corridors and related projects that address road infrastructure, road transport facili-tation and rail infrastructure have in fact already been adopted. Lessons from the North–South Corridor are being applied to the Northern and Central Corridors in East Africa and will be extended to other corridors on the continent, allowing increased trade flows among the natural trading partners. The degree of connectivity being pursued through land, sea and air and through energy and ICT attests to the immense potential that exists for the African CFTA.
According to Robson (1994), the larger the regional ar-rangements the more likely they are to be trade creating, because their members’ production structures are most likely to have larger overlaps in their range of products and producers, thus creating a competitive environment. Indeed, in an effort to capture the benefits of increased trade, the world trading system seems to be moving, not just to a system of regional FTAs but to a system of large continental groupings. Hence the emergence of new big trading blocs, greater integration of the world economy, difficulties of reforming international institutions and practices, and faltering advances in the WTO Doha round, provide a powerful impetus for the CFTA.
Negotiations for Economic Partnership Agreements (EPAs) with the EU back up this point. According to the AU (2007), reciprocal trade under EPAs will heavily cut intra-African trade. Unless African countries extend the same tariff reductions or eliminations under the EPAs to their regional neighbours—through the CFTA, for exam-ple—imports from Europe will hurt intra-regional trade as well as Africa’s integration endeavours more generally.
Most African countries’ small size argues strongly for the CFTA: 12 African states had a population of less than 2 million, and 19 had a GDP of less than US$ 5 billion in 2008 (World Bank, 2008). A continental approach would therefore provide a collective platform for African coun-tries and increase Africa’s influence in the global trade negotiations including the EPA.
Finally, a CFTA would be an efficient way to resolve the overlapping and multiple memberships of RECs. The conflicts and contradictions stemming from the com-plex “spaghetti bowl” of African regional arrangements undermine moves towards the AEC by engendering poor coordination and costly duplication of programmes and activities (UNECA, 2006).
3.2.3 The challenges
The above benefits of an African CFTA are widely expected, but the following challenges could hinder countries’ efforts
to adhere to their commitments, derailing momentum towards integration.
36 Assessing Regional Integration in Africa (ARIA V): Towards an African Continental Free Trade Area
Inequitable distribution of gains: As gains from the CFTA will not be distributed fairly, members need to create a collective financial pool to provide compensation and meet the adjustment costs arising from tariff-revenue and other income losses. Yet African countries are financially weak and it may be hard to set up such a pool.
Paucity of financial resources: Establishing a continental agreement requires huge financial resources to build or expand the required infrastructure and institutions. Capacity building in general and developing the neces-sary knowledge in particular are also required to run the institutions of integration effectively, nationally and re-gionally. Such resources are not at Africa’s ready disposal.
Weak will and commitment: Commitment to sub-regional integration already varies across countries, stemming in some cases from lack of political will and serious com-mitment to FTA protocols. Some countries have not lib-eralized within their RECs. Hence if they cannot commit themselves to a smaller FTA they are unlikely to commit to an Africa-wide bloc. Countries’ reluctance to fully open their borders to trade is a common concern.
NTBs: Administrative burdens on cross-border trade and road blocks along trading routes, bribery and corruption, as well as robbery and piracy, all need to be tackled on a continental scale. Otherwise, the benefits of the CFTA will be far below potential.
3.3 Conclusion
The gains from the CFTA are much greater than the potential losses, but inequitable distribution of the gains require mechanisms to redress these imbalances, such as a financial pool.
Africa’s strides towards the CFTA will only generate full benefits when individual states display the political commitment to push through with the principles of in-tegration that they have already agreed to. The tripartite
COMESA–EAC–SADC initiative is an encouraging move in that direction.
Using the above theoretical perspectives as well as Africa’s prevailing conditions as a benchmark against which to measure gains or losses, chapter 4 provides an empirical analysis of the gains from a CFTA, the framework of which is outlined in chapter 5.
References
AU (2007), “Brief on Negotiations for Economic Partner-ship Agreements”, African UNION, 26 May 2007.
Balassa, B. 1965. “The Theory of Economic Integration, London: Allen and Unwin.
Balassa, B. 1965. “Trade liberalization and revealed com-parative advantage.” The Manchester School of Eco-nomic and Social Studies 33: 92–123.
Baldwin, R.E., and A.J. Venables. 1995. “Regional eco-nomic integration.” In G. Grossman and K. Rogoff (eds.), Handbook of International Economics. Am-sterdam: Elsevier.
Comtrade (United Nations Commodity Trade Statistics Database). 2009/2010. http://comtrade.un.org/db/default.aspx.
de Melo, Jaime & Panagariya, Arvind & Rodrik, Dani, 1993. “The new regionalism : a country perspec-tive,” Policy Research Working Paper Series 1094, The World Bank.
Krugman, P. 1991a. “Increasing Returns and Economic Geography.” Journal of Political Economy,Volume 99, Issue 3
37Chapter three: The Theory of Free Trade Areas: The Case for an African Continental Free Trade Area
Lipsey, R.G. 1957. “The theory of customs unions: trade creation and welfare.” Economica 24: 40–46.
Meade, J.E. 1955. The theory of customs unions. Amster-dam: North-Holland.
Robson, P. 1994. The economics of international integra-tion, 2nd ed. London: George Allen & Unwin.
Viner, J. 1950. The customs union issue. New York: Carn-egie Endowment for International Peace; London: Stevens & Sons.
UNECA (United Nations Economic Commission for Af-rica). 2006. Assessing regional integration in Africa II: rationalizing regional economic communities. Addis Ababa. http://www.uneca.org/aria2/full_ver-sion.pdf.
———. 2008. Assessing regional integration in Africa III: towards monetary and financial integration in
Africa. Addis Ababa. http://www.uneca.org/aria3/ARIA3_ENG.pdf.
———. 2010. Assessing regional integration in Africa IV: enhancing intra-African trade. Addis Ababa. http://www.uneca.org/aria4/ARIA4Full.pdf.
World Bank. 2008. World Development Indicators 2008. Washington, DC.
______. 2012. Doing Business: Doing Business in a More Transparent World http://www.doingbusiness.org/~/media/FPDKM/Doing%20Business/Docu-ments/Annual-Reports/English/DB12-FullReport.pdf
World Trade Organization (WTO). 2010. International Trade Statistics. Geneva.
Notes1 See, for example, Balassa (1962, 1966), Meade (1955), Baldwin and
Venables (1995) and Lipsey (1957).2 Standard International Trade Classification (SITC) is a statistical
classification of commodities for external trade.3 Africa’s goods imports from developed countries shrank from 62
per cent in 2000 to 47.6 per cent in 2010.4 Africa’s imports from China increased from 4.8 per cent in 2000
to 13.2 per cent in 2010.5 This allows developing countries to export selected products to
certain markets (mainly developed countries) at lower tariff rates than most-favored nation (MFN) rates. The MFN system operates on the basis that all members of the World Trade Organization (WTO) must not discriminate in the access it grants to its market: a tariff rate given to one WTO country must be extended to all oth-ers—with a few exceptions, such as allowed regional or preferential treatment agreements.
6 This provides duty-free, quota-free access to least-developed coun-tries exporting to the EU.
7 This gives to African exports preferential access to the US.
8 Specialization improves the efficiency of production and distribu-tion of goods and services, quality of products, the price of finished product, income earnings for producers and national income for all countries.
9 Trade among two neighboring countries even with the absence of a tariff reduction mechanism is said to happen along the “natural line”.

4CHAPTER
39
Assessments of regional integration for developing countries do not always come to firm conclusions as to their benefits, and the evidence for Africa is mixed. This chapter therefore, using computable general equilibrium (CGE) modelling, carries out an exercise to determine
the economic gains and losses from the envisaged African CFTA, and presents three main find-ings. First, eliminating the high tariff barriers prevalent across Africa by establishing the CFTA is expected to increase intra-African trade, which is likely to produce growth in real income. Second, these gains are expected to be significantly higher if complemented by additional trade-facilitation measures that reduce the cost of customs procedures and port handling. And third, although the potential economic benefits from the CFTA for Africa as a whole are encouraging, the gains are not distributed equitably across the continent.
Several empirical studies have attempted to discern the trade creation and diversion effects of re-gional integration arrangements in Africa, and offer mixed results. Yeats (1998) and Schiff (1997), for example, have argued that intra-regional trade among small and developing countries could potentially divert regional resources from cheaper third-country imports to more expensive and less efficiently produced imports from a member country.1 From a static point of view, they argue that Africa’s manufacturing base needs to be diversified enough for the continent to enjoy favourable levels of intra-regional trade.
Yet Carrere (2003), using an extended gravity model, found that regional integration arrangements in Africa induced significant levels of trade creation through trade diversion, intra- and extra-regionally.
Recognizing the trade diverting and creating nature of such arrangements, Meade (1955) had al-ready argued that even when a customs union diverted trade, it could still generate welfare gains as it might set a new international trade pattern, followed by a shift in the use of resources into more efficient production. He contended that these outcomes could be partly explained by the arrange-ment eliminating or reducing “invisible” trade barriers.2
The African Continental Free Trade Area: An Empirical Analysis
40 Assessing Regional Integration in Africa (ARIA V): Towards an African Continental Free Trade Area
Others (including Evans, 1998; Lewis et al., 1999), using the CGE model, found that regional integration arrange-ments among developing countries, with specific consid-eration of Southern Africa, were more likely to generate net static and dynamic gains.
Using a gravity model, Musila (2005) found that the net ef-fect of integrating in the COMESA, ECCAS and ECOWAS regions to be trade creating. Coulibaly (2004) established that six ECOWAS member countries3 experienced in-creased exports after joining the REC, largely attributable to reduced intra-regional tariffs.4
4.1 Economic effects of the CFTA
Using a multi-country and multi-sector CGE model, this section assesses the economic effects of an African CFTA (annex 4.1 describes the methodology).5 The analysis is based mainly on quantitative trade barriers (tariffs).
The modelling exercise envisages two scenarios for com-parison purposes. The first one considers the impact of two large FTAs in Africa: the South-Eastern (S-E) FTA group comprising COMESA, SADC, EAC and IGAD,6 which reflects the tripartite initiative; and the North-West-Central (N-W-C) FTA group covering ECOWAS, CEN-SAD, ECCAS and UMA. The second scenario ap-plies a continental approach, where all African countries fully liberalize trade in goods. All scenarios are assumed to be fully implemented by 2017. However, as variables need time to adjust in the model, results are given for the year 2022. Comparisons are made between the scenarios considered and the baseline (i.e. situation without the implementation of any trade reforms) and expressed in per cent or absolute change, unless otherwise stated.
The prevailing conditions tend to indicate that high tariffs could potentially contribute to low intra-African trade. Within the two FTA groups—S-E and N-W-C—average protection rates are 7.7 per cent and 8.2 per cent. Inter-group average protection rates also show wide variations in imposed and faced protection: S-E exports to the N-W-C group face an average tariff of 16.5 per cent, and S-E group imposes 4.3 per cent tariff on N-W-C imports (table 4.1).
The formation of two regional FTAs (scenario 1) or the CFTA (scenario 2) would expand trade flows of African countries. Thus, establishing two large trading blocs—S-E and N-W-C—would increase total African exports by US$ 17.6 billion (a 2.8 per cent increase from the baseline where FTAs are not set up) and the CFTA would add as much as US$ 25.3 billion (4.0 per cent) to the baseline, in 2022 (figure 4.1).
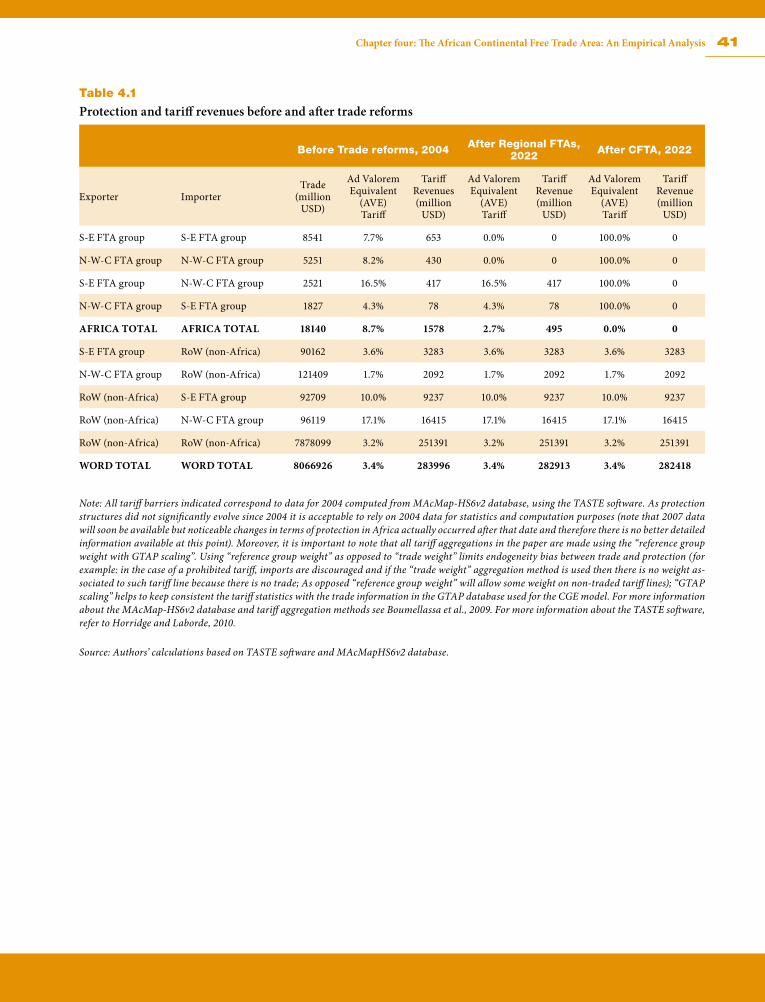
41Chapter four: The African Continental Free Trade Area: An Empirical Analysis
Table 4.1
Protection and tariff revenues before and after trade reforms
Before Trade reforms, 2004 After Regional FTAs, 2022 After CFTA, 2022
Exporter ImporterTrade
(million USD)
Ad Valorem Equivalent
(AVE)Tariff
TariffRevenues(million
USD)
Ad Valorem Equivalent
(AVE) Tariff
TariffRevenue(million
USD)
Ad Valorem Equivalent
(AVE) Tariff
TariffRevenue(million
USD)
S-E FTA group S-E FTA group 8541 7.7% 653 0.0% 0 100.0% 0
N-W-C FTA group N-W-C FTA group 5251 8.2% 430 0.0% 0 100.0% 0
S-E FTA group N-W-C FTA group 2521 16.5% 417 16.5% 417 100.0% 0
N-W-C FTA group S-E FTA group 1827 4.3% 78 4.3% 78 100.0% 0
AFRICA TOTAL AFRICA TOTAL 18140 8.7% 1578 2.7% 495 0.0% 0
S-E FTA group RoW (non-Africa) 90162 3.6% 3283 3.6% 3283 3.6% 3283
N-W-C FTA group RoW (non-Africa) 121409 1.7% 2092 1.7% 2092 1.7% 2092
RoW (non-Africa) S-E FTA group 92709 10.0% 9237 10.0% 9237 10.0% 9237
RoW (non-Africa) N-W-C FTA group 96119 17.1% 16415 17.1% 16415 17.1% 16415
RoW (non-Africa) RoW (non-Africa) 7878099 3.2% 251391 3.2% 251391 3.2% 251391
WORD TOTAL WORD TOTAL 8066926 3.4% 283996 3.4% 282913 3.4% 282418
Note: All tariff barriers indicated correspond to data for 2004 computed from MAcMap-HS6v2 database, using the TASTE software. As protection structures did not significantly evolve since 2004 it is acceptable to rely on 2004 data for statistics and computation purposes (note that 2007 data will soon be available but noticeable changes in terms of protection in Africa actually occurred after that date and therefore there is no better detailed information available at this point). Moreover, it is important to note that all tariff aggregations in the paper are made using the “reference group weight with GTAP scaling”. Using “reference group weight” as opposed to “trade weight” limits endogeneity bias between trade and protection (for example: in the case of a prohibited tariff, imports are discouraged and if the “trade weight” aggregation method is used then there is no weight as-sociated to such tariff line because there is no trade; As opposed “reference group weight” will allow some weight on non-traded tariff lines); “GTAP scaling” helps to keep consistent the tariff statistics with the trade information in the GTAP database used for the CGE model. For more information about the MAcMap-HS6v2 database and tariff aggregation methods see Boumellassa et al., 2009. For more information about the TASTE software, refer to Horridge and Laborde, 2010.
Source: Authors’ calculations based on TASTE software and MAcMapHS6v2 database.
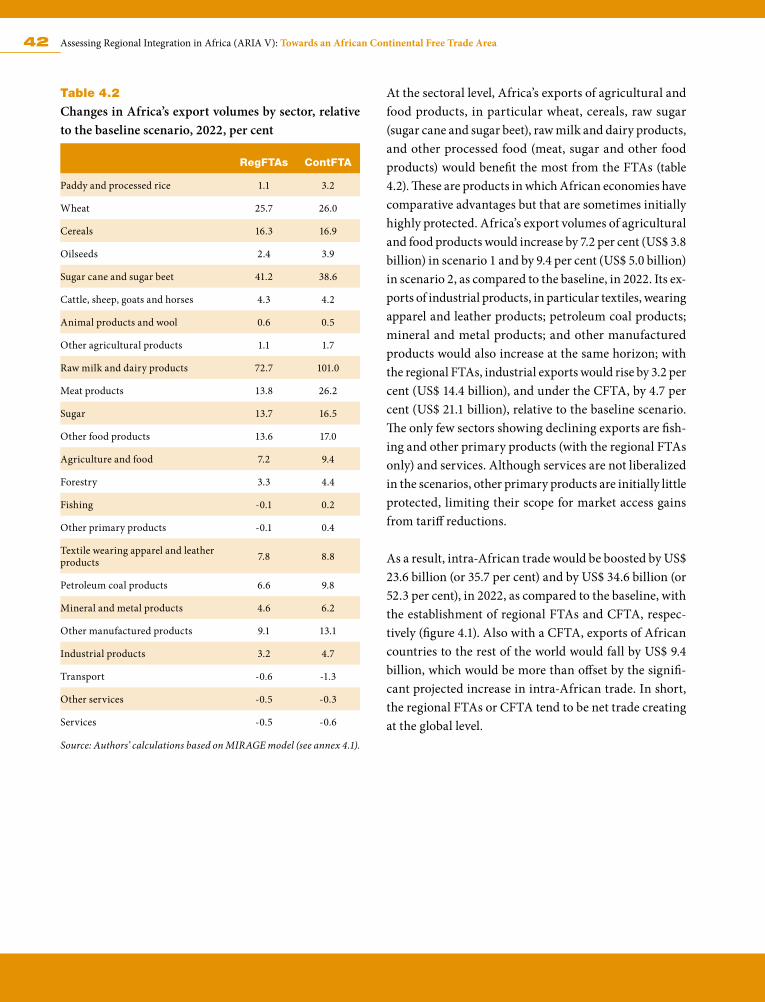
42 Assessing Regional Integration in Africa (ARIA V): Towards an African Continental Free Trade Area
Table 4.2
Changes in Africa’s export volumes by sector, relative to the baseline scenario, 2022, per cent
RegFTAs ContFTA
Paddy and processed rice 1.1 3.2
Wheat 25.7 26.0
Cereals 16.3 16.9
Oilseeds 2.4 3.9
Sugar cane and sugar beet 41.2 38.6
Cattle, sheep, goats and horses 4.3 4.2
Animal products and wool 0.6 0.5
Other agricultural products 1.1 1.7
Raw milk and dairy products 72.7 101.0
Meat products 13.8 26.2
Sugar 13.7 16.5
Other food products 13.6 17.0
Agriculture and food 7.2 9.4
Forestry 3.3 4.4
Fishing -0.1 0.2
Other primary products -0.1 0.4
Textile wearing apparel and leather products 7.8 8.8
Petroleum coal products 6.6 9.8
Mineral and metal products 4.6 6.2
Other manufactured products 9.1 13.1
Industrial products 3.2 4.7
Transport -0.6 -1.3
Other services -0.5 -0.3
Services -0.5 -0.6
Source: Authors’ calculations based on MIRAGE model (see annex 4.1).
At the sectoral level, Africa’s exports of agricultural and food products, in particular wheat, cereals, raw sugar (sugar cane and sugar beet), raw milk and dairy products, and other processed food (meat, sugar and other food products) would benefit the most from the FTAs (table 4.2). These are products in which African economies have comparative advantages but that are sometimes initially highly protected. Africa’s export volumes of agricultural and food products would increase by 7.2 per cent (US$ 3.8 billion) in scenario 1 and by 9.4 per cent (US$ 5.0 billion) in scenario 2, as compared to the baseline, in 2022. Its ex-ports of industrial products, in particular textiles, wearing apparel and leather products; petroleum coal products; mineral and metal products; and other manufactured products would also increase at the same horizon; with the regional FTAs, industrial exports would rise by 3.2 per cent (US$ 14.4 billion), and under the CFTA, by 4.7 per cent (US$ 21.1 billion), relative to the baseline scenario. The only few sectors showing declining exports are fish-ing and other primary products (with the regional FTAs only) and services. Although services are not liberalized in the scenarios, other primary products are initially little protected, limiting their scope for market access gains from tariff reductions.
As a result, intra-African trade would be boosted by US$ 23.6 billion (or 35.7 per cent) and by US$ 34.6 billion (or 52.3 per cent), in 2022, as compared to the baseline, with the establishment of regional FTAs and CFTA, respec-tively (figure 4.1). Also with a CFTA, exports of African countries to the rest of the world would fall by US$ 9.4 billion, which would be more than offset by the signifi-cant projected increase in intra-African trade. In short, the regional FTAs or CFTA tend to be net trade creating at the global level.
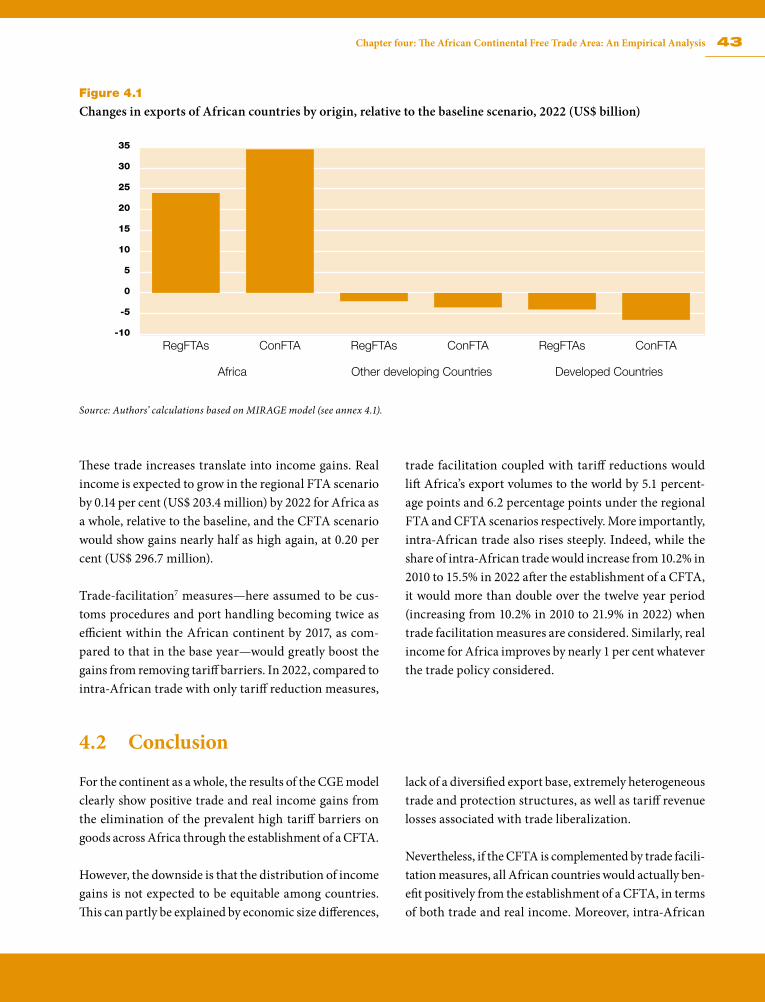
43Chapter four: The African Continental Free Trade Area: An Empirical Analysis
Figure 4.1
Changes in exports of African countries by origin, relative to the baseline scenario, 2022 (US$ billion)
Source: Authors’ calculations based on MIRAGE model (see annex 4.1).
These trade increases translate into income gains. Real income is expected to grow in the regional FTA scenario by 0.14 per cent (US$ 203.4 million) by 2022 for Africa as a whole, relative to the baseline, and the CFTA scenario would show gains nearly half as high again, at 0.20 per cent (US$ 296.7 million).
Trade-facilitation7 measures—here assumed to be cus-toms procedures and port handling becoming twice as efficient within the African continent by 2017, as com-pared to that in the base year—would greatly boost the gains from removing tariff barriers. In 2022, compared to intra-African trade with only tariff reduction measures,
trade facilitation coupled with tariff reductions would lift Africa’s export volumes to the world by 5.1 percent-age points and 6.2 percentage points under the regional FTA and CFTA scenarios respectively. More importantly, intra-African trade also rises steeply. Indeed, while the share of intra-African trade would increase from 10.2% in 2010 to 15.5% in 2022 after the establishment of a CFTA, it would more than double over the twelve year period (increasing from 10.2% in 2010 to 21.9% in 2022) when trade facilitation measures are considered. Similarly, real income for Africa improves by nearly 1 per cent whatever the trade policy considered.
4.2 Conclusion
For the continent as a whole, the results of the CGE model clearly show positive trade and real income gains from the elimination of the prevalent high tariff barriers on goods across Africa through the establishment of a CFTA.
However, the downside is that the distribution of income gains is not expected to be equitable among countries. This can partly be explained by economic size differences,
lack of a diversified export base, extremely heterogeneous trade and protection structures, as well as tariff revenue losses associated with trade liberalization.
Nevertheless, if the CFTA is complemented by trade facili-tation measures, all African countries would actually ben-efit positively from the establishment of a CFTA, in terms of both trade and real income. Moreover, intra-African
-10
-5
0
5
10
15
20
25
30
35
RegFTAs
Africa Other developing Countries Developed Countries
ConFTA ConFTA ConFTARegFTAs RegFTAs
44 Assessing Regional Integration in Africa (ARIA V): Towards an African Continental Free Trade Area
trade would be strongly enhanced and could more than double within the next ten years.
More importantly, the establishment of the CFTA is a step towards the Continental Customs Union planned to take
effect in 2019 ultimately leading to the African Economic Community as specified by the Abuja Treaty. The CGE analysis of this envisioned Continental Customs Union is included in the annex8 of this chapter.
Annexes A4.1 Methodology
Computable general equilibrium (CGE) models allow analysts to capture the complicated interactions within the different agents of an economy. For the purpose of this analysis, we use MIRAGE (Modelling International Relationships in Applied General Equilibrium)—a multi-country and multi-sector CGE model—which is par-ticularly well designed for capturing trade policy effects.9 To better assess the different, timely, steps of regional integration in Africa, we use a dynamic version of the model. The dynamic is recursive implying a succession of equilibriums being solved sequentially from one year to another.
On the demand side of the model, a single representative agent is assumed in each region. It allocates a fixed share of its income for savings and devotes the rest to consump-tion of goods. A Linear Expenditure System–Constant Elasticity of Substitution (LES–CES) function is used for representing agents’ preferences across sectors.10 The model allows for vertical (quality) as well as horizontal (variety) differentiations in goods. The goods produced by developed countries are assumed to have a higher quality than those produced by developing countries (following the Armington hypothesis, which postulates that consumer choices can be influenced by goods’ geo-graphical origin).
On the supply side, the model relies on a Leontief function assuming perfect complementarity between intermediate consumption and value added. Five factors of production are contributing to the value added: unskilled and skilled labour, capital, land, and natural resources. Skilled labour and capital are supposed to be more substitutable between themselves than with other factors. A full employment of factor endowments is assumed. Skilled labour is perfectly
mobile between sectors while unskilled labour has imper-fect mobility between agricultural and non-agricultural sectors, but that mobility is perfect among each group of sectors. The rates of variations of labour are exogenously set following World Bank demographic forecasts (World Bank, 2005). Land is imperfectly mobile between sectors while natural resources and capital are sector-specific. Yet natural resources are constant and capital is accumula-tive. The sole adjustment variable for capital stocks is the investment, such that the capital stock for the current year depends on the investment made for the same year and the capital stock from the previous year which has depreciated.
The macro-economic closure of the MIRAGE model is obtained by maintaining the current account of each region constant and fixed to its initial value. The real exchange rate is allowed to adjust in order to balance any possible disequilibrium of the current account. In other words, when a trade reform, such as reduced tariff barri-ers, stimulates trade, the real exchange rates appreciate if exports increase more than imports or depreciate if exports increase less than imports.
As other CGE models, MIRAGE requires an extremely large amount of very detailed data for describing all eco-nomic relationships within the different agents of the world economy in a particular year. Based in Purdue University (Indiana, US) the Global Trade Analysis Pro-ject (GTAP) maintains a database especially designed for CGE models. In its version 7, used as a global social accounting matrix for the MIRAGE model, the GTAP database provides data on international trade (bilateral flows and trade barriers), production, final consumption
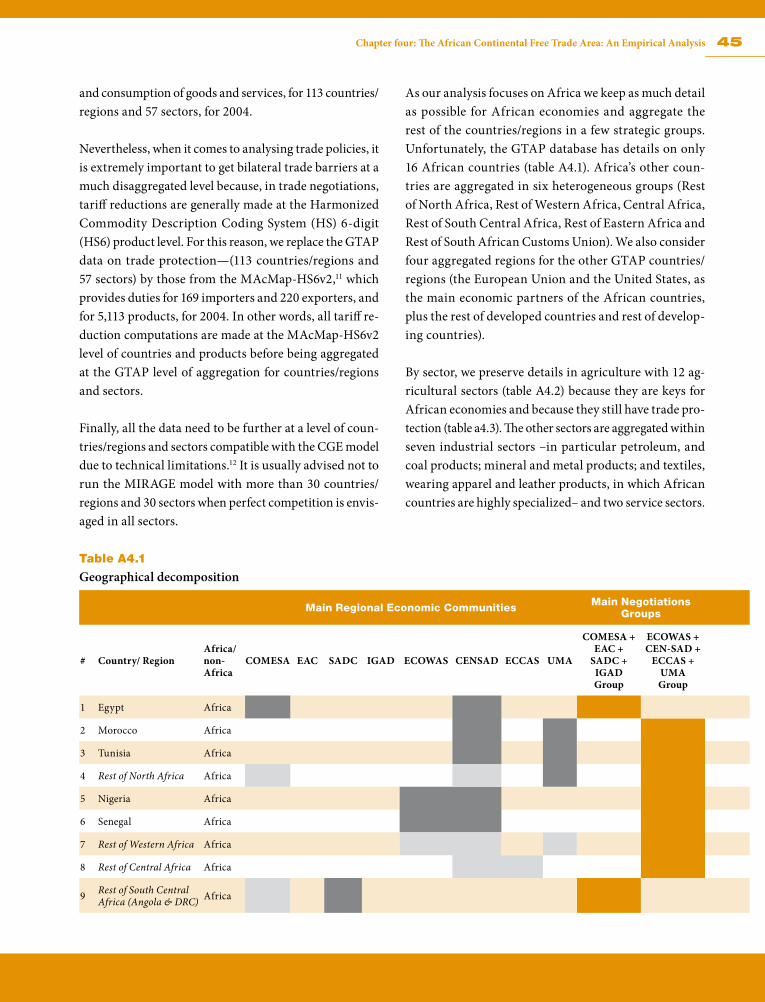
45Chapter four: The African Continental Free Trade Area: An Empirical Analysis
and consumption of goods and services, for 113 countries/regions and 57 sectors, for 2004.
Nevertheless, when it comes to analysing trade policies, it is extremely important to get bilateral trade barriers at a much disaggregated level because, in trade negotiations, tariff reductions are generally made at the Harmonized Commodity Description Coding System (HS) 6-digit (HS6) product level. For this reason, we replace the GTAP data on trade protection—(113 countries/regions and 57 sectors) by those from the MAcMap-HS6v2,11 which provides duties for 169 importers and 220 exporters, and for 5,113 products, for 2004. In other words, all tariff re-duction computations are made at the MAcMap-HS6v2 level of countries and products before being aggregated at the GTAP level of aggregation for countries/regions and sectors.
Finally, all the data need to be further at a level of coun-tries/regions and sectors compatible with the CGE model due to technical limitations.12 It is usually advised not to run the MIRAGE model with more than 30 countries/regions and 30 sectors when perfect competition is envis-aged in all sectors.
As our analysis focuses on Africa we keep as much detail as possible for African economies and aggregate the rest of the countries/regions in a few strategic groups. Unfortunately, the GTAP database has details on only 16 African countries (table A4.1). Africa’s other coun-tries are aggregated in six heterogeneous groups (Rest of North Africa, Rest of Western Africa, Central Africa, Rest of South Central Africa, Rest of Eastern Africa and Rest of South African Customs Union). We also consider four aggregated regions for the other GTAP countries/regions (the European Union and the United States, as the main economic partners of the African countries, plus the rest of developed countries and rest of develop-ing countries).
By sector, we preserve details in agriculture with 12 ag-ricultural sectors (table A4.2) because they are keys for African economies and because they still have trade pro-tection (table a4.3). The other sectors are aggregated within seven industrial sectors –in particular petroleum, and coal products; mineral and metal products; and textiles, wearing apparel and leather products, in which African countries are highly specialized– and two service sectors.
Table A4.1
Geographical decomposition
Main Regional Economic Communities Main Negotiations Groups
# Country/ RegionAfrica/ non-Africa
COMESA EAC SADC IGAD ECOWAS CENSAD ECCAS UMA
COMESA + EAC +
SADC + IGAD Group
ECOWAS + CEN-SAD +
ECCAS +UMAGroup
1 Egypt Africa
2 Morocco Africa
3 Tunisia Africa
4 Rest of North Africa Africa
5 Nigeria Africa
6 Senegal Africa
7 Rest of Western Africa Africa
8 Rest of Central Africa Africa
9 Rest of South Central Africa (Angola & DRC) Africa
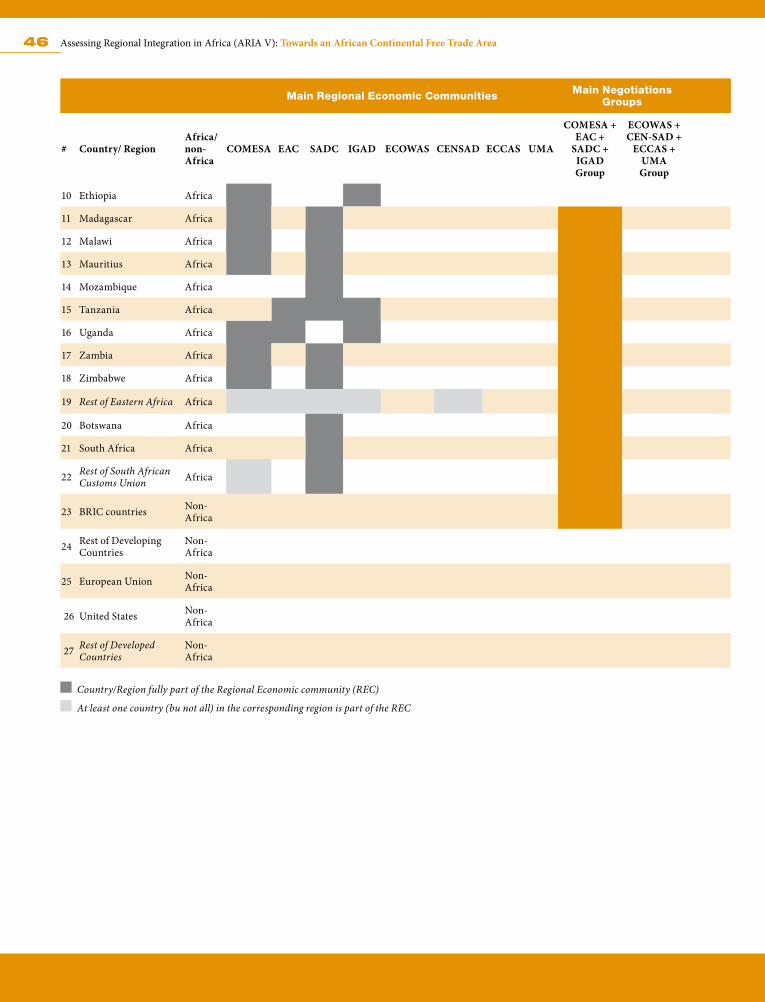
46 Assessing Regional Integration in Africa (ARIA V): Towards an African Continental Free Trade Area
Main Regional Economic Communities Main Negotiations Groups
# Country/ RegionAfrica/ non-Africa
COMESA EAC SADC IGAD ECOWAS CENSAD ECCAS UMA
COMESA + EAC +
SADC + IGAD Group
ECOWAS + CEN-SAD +
ECCAS +UMAGroup
10 Ethiopia Africa
11 Madagascar Africa
12 Malawi Africa
13 Mauritius Africa
14 Mozambique Africa
15 Tanzania Africa
16 Uganda Africa
17 Zambia Africa
18 Zimbabwe Africa
19 Rest of Eastern Africa Africa
20 Botswana Africa
21 South Africa Africa
22 Rest of South African Customs Union Africa
23 BRIC countries Non-Africa
24 Rest of DevelopingCountries
Non-Africa
25 European Union Non-Africa
26 United States Non-Africa
27 Rest of Developed Countries
Non-Africa
Country/Region fully part of the Regional Economic community (REC)
At least one country (bu not all) in the corresponding region is part of the REC
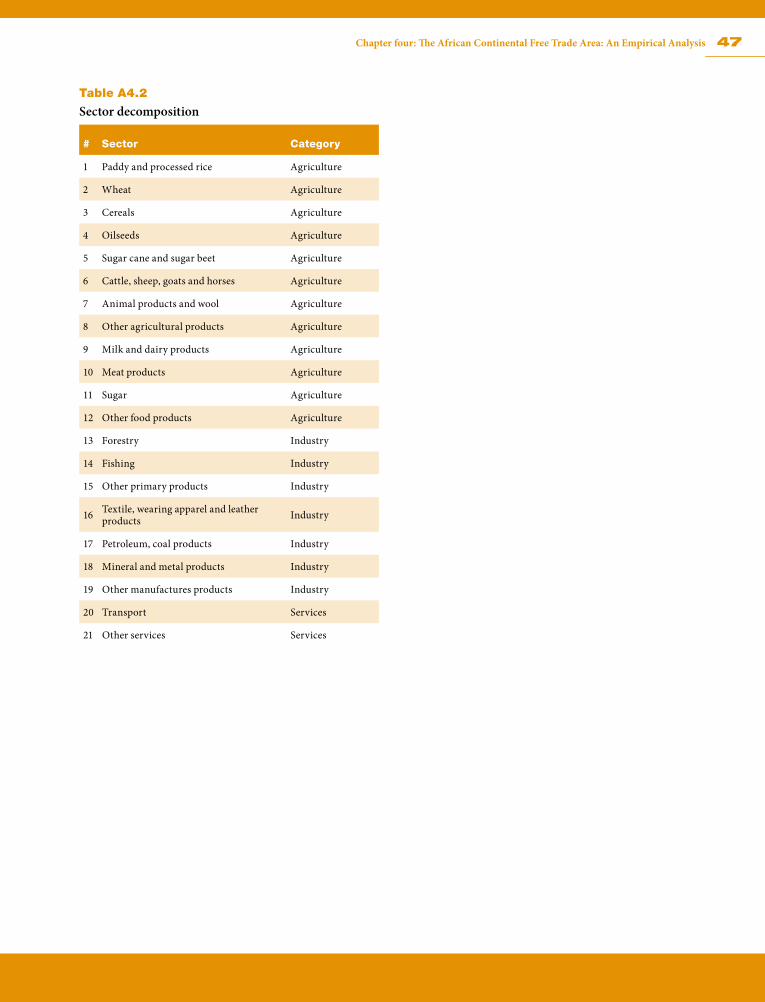
47Chapter four: The African Continental Free Trade Area: An Empirical Analysis
Table A4.2
Sector decomposition
# Sector Category
1 Paddy and processed rice Agriculture
2 Wheat Agriculture
3 Cereals Agriculture
4 Oilseeds Agriculture
5 Sugar cane and sugar beet Agriculture
6 Cattle, sheep, goats and horses Agriculture
7 Animal products and wool Agriculture
8 Other agricultural products Agriculture
9 Milk and dairy products Agriculture
10 Meat products Agriculture
11 Sugar Agriculture
12 Other food products Agriculture
13 Forestry Industry
14 Fishing Industry
15 Other primary products Industry
16 Textile, wearing apparel and leather products Industry
17 Petroleum, coal products Industry
18 Mineral and metal products Industry
19 Other manufactures products Industry
20 Transport Services
21 Other services Services
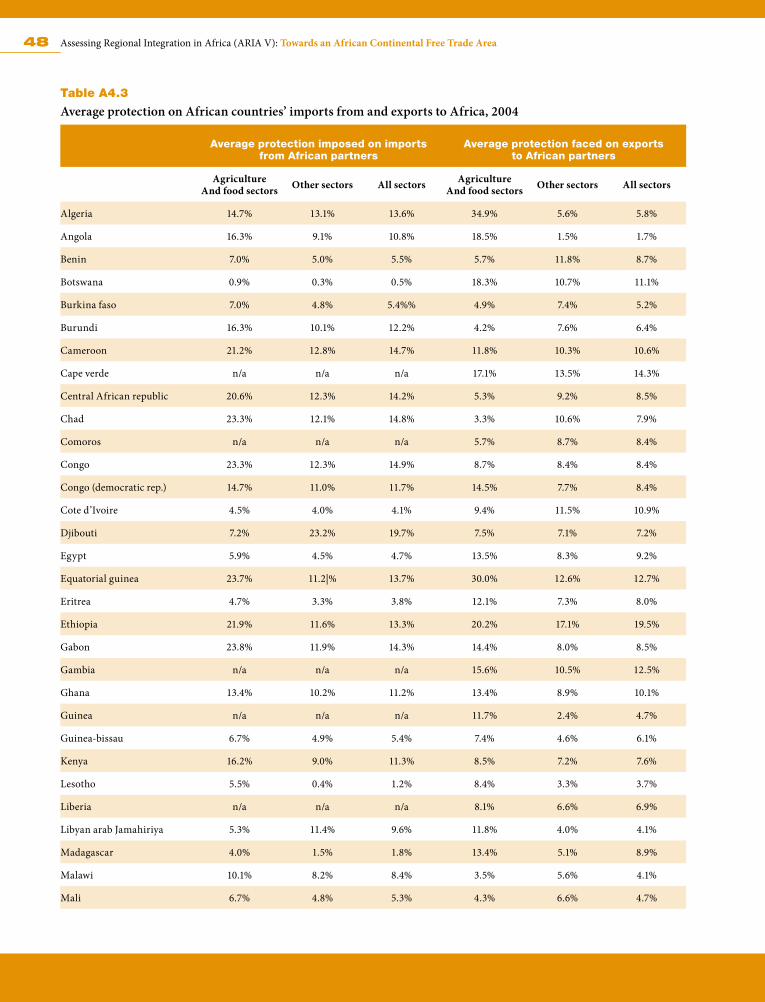
48 Assessing Regional Integration in Africa (ARIA V): Towards an African Continental Free Trade Area
Table A4.3
Average protection on African countries’ imports from and exports to Africa, 2004
Average protection imposed on imports from African partners
Average protection faced on exports to African partners
AgricultureAnd food sectors Other sectors All sectors Agriculture
And food sectors Other sectors All sectors
Algeria 14.7% 13.1% 13.6% 34.9% 5.6% 5.8%
Angola 16.3% 9.1% 10.8% 18.5% 1.5% 1.7%
Benin 7.0% 5.0% 5.5% 5.7% 11.8% 8.7%
Botswana 0.9% 0.3% 0.5% 18.3% 10.7% 11.1%
Burkina faso 7.0% 4.8% 5.4%% 4.9% 7.4% 5.2%
Burundi 16.3% 10.1% 12.2% 4.2% 7.6% 6.4%
Cameroon 21.2% 12.8% 14.7% 11.8% 10.3% 10.6%
Cape verde n/a n/a n/a 17.1% 13.5% 14.3%
Central African republic 20.6% 12.3% 14.2% 5.3% 9.2% 8.5%
Chad 23.3% 12.1% 14.8% 3.3% 10.6% 7.9%
Comoros n/a n/a n/a 5.7% 8.7% 8.4%
Congo 23.3% 12.3% 14.9% 8.7% 8.4% 8.4%
Congo (democratic rep.) 14.7% 11.0% 11.7% 14.5% 7.7% 8.4%
Cote d’Ivoire 4.5% 4.0% 4.1% 9.4% 11.5% 10.9%
Djibouti 7.2% 23.2% 19.7% 7.5% 7.1% 7.2%
Egypt 5.9% 4.5% 4.7% 13.5% 8.3% 9.2%
Equatorial guinea 23.7% 11.2|% 13.7% 30.0% 12.6% 12.7%
Eritrea 4.7% 3.3% 3.8% 12.1% 7.3% 8.0%
Ethiopia 21.9% 11.6% 13.3% 20.2% 17.1% 19.5%
Gabon 23.8% 11.9% 14.3% 14.4% 8.0% 8.5%
Gambia n/a n/a n/a 15.6% 10.5% 12.5%
Ghana 13.4% 10.2% 11.2% 13.4% 8.9% 10.1%
Guinea n/a n/a n/a 11.7% 2.4% 4.7%
Guinea-bissau 6.7% 4.9% 5.4% 7.4% 4.6% 6.1%
Kenya 16.2% 9.0% 11.3% 8.5% 7.2% 7.6%
Lesotho 5.5% 0.4% 1.2% 8.4% 3.3% 3.7%
Liberia n/a n/a n/a 8.1% 6.6% 6.9%
Libyan arab Jamahiriya 5.3% 11.4% 9.6% 11.8% 4.0% 4.1%
Madagascar 4.0% 1.5% 1.8% 13.4% 5.1% 8.9%
Malawi 10.1% 8.2% 8.4% 3.5% 5.6% 4.1%
Mali 6.7% 4.8% 5.3% 4.3% 6.6% 4.7%
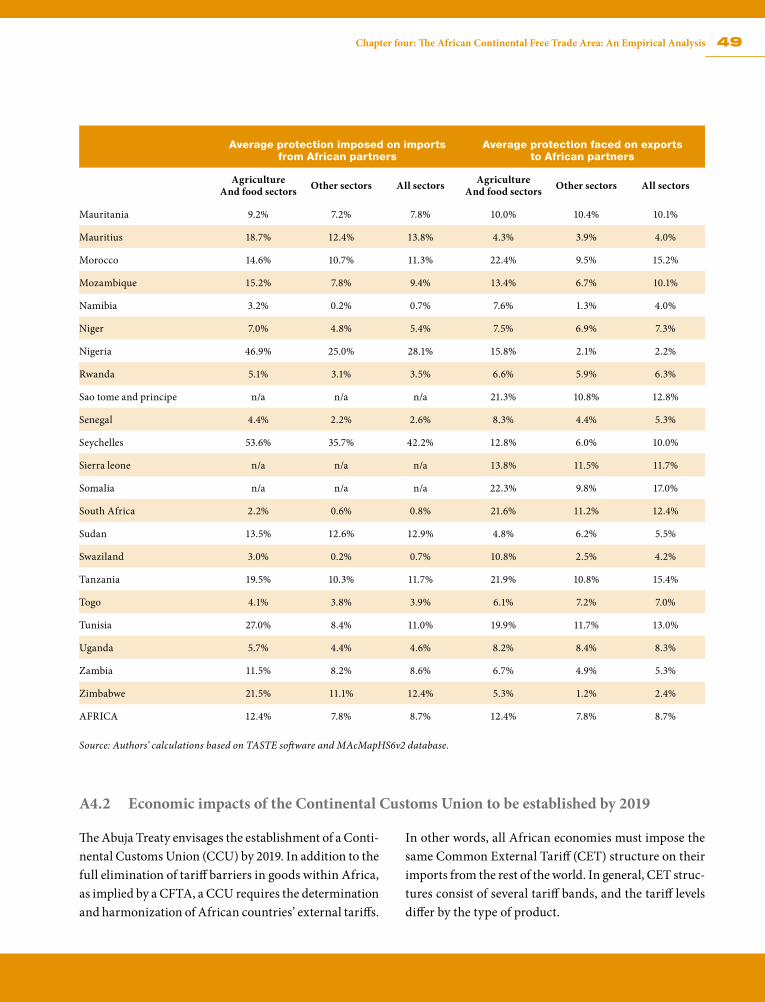
49Chapter four: The African Continental Free Trade Area: An Empirical Analysis
Average protection imposed on imports from African partners
Average protection faced on exports to African partners
AgricultureAnd food sectors Other sectors All sectors Agriculture
And food sectors Other sectors All sectors
Mauritania 9.2% 7.2% 7.8% 10.0% 10.4% 10.1%
Mauritius 18.7% 12.4% 13.8% 4.3% 3.9% 4.0%
Morocco 14.6% 10.7% 11.3% 22.4% 9.5% 15.2%
Mozambique 15.2% 7.8% 9.4% 13.4% 6.7% 10.1%
Namibia 3.2% 0.2% 0.7% 7.6% 1.3% 4.0%
Niger 7.0% 4.8% 5.4% 7.5% 6.9% 7.3%
Nigeria 46.9% 25.0% 28.1% 15.8% 2.1% 2.2%
Rwanda 5.1% 3.1% 3.5% 6.6% 5.9% 6.3%
Sao tome and principe n/a n/a n/a 21.3% 10.8% 12.8%
Senegal 4.4% 2.2% 2.6% 8.3% 4.4% 5.3%
Seychelles 53.6% 35.7% 42.2% 12.8% 6.0% 10.0%
Sierra leone n/a n/a n/a 13.8% 11.5% 11.7%
Somalia n/a n/a n/a 22.3% 9.8% 17.0%
South Africa 2.2% 0.6% 0.8% 21.6% 11.2% 12.4%
Sudan 13.5% 12.6% 12.9% 4.8% 6.2% 5.5%
Swaziland 3.0% 0.2% 0.7% 10.8% 2.5% 4.2%
Tanzania 19.5% 10.3% 11.7% 21.9% 10.8% 15.4%
Togo 4.1% 3.8% 3.9% 6.1% 7.2% 7.0%
Tunisia 27.0% 8.4% 11.0% 19.9% 11.7% 13.0%
Uganda 5.7% 4.4% 4.6% 8.2% 8.4% 8.3%
Zambia 11.5% 8.2% 8.6% 6.7% 4.9% 5.3%
Zimbabwe 21.5% 11.1% 12.4% 5.3% 1.2% 2.4%
AFRICA 12.4% 7.8% 8.7% 12.4% 7.8% 8.7%
Source: Authors’ calculations based on TASTE software and MAcMapHS6v2 database.
A4.2 Economic impacts of the Continental Customs Union to be established by 2019
The Abuja Treaty envisages the establishment of a Conti-nental Customs Union (CCU) by 2019. In addition to the full elimination of tariff barriers in goods within Africa, as implied by a CFTA, a CCU requires the determination and harmonization of African countries’ external tariffs.
In other words, all African economies must impose the same Common External Tariff (CET) structure on their imports from the rest of the world. In general, CET struc-tures consist of several tariff bands, and the tariff levels differ by the type of product.
50 Assessing Regional Integration in Africa (ARIA V): Towards an African Continental Free Trade Area
As Regional Economic Communities (RECs) are expected to become regional Customs Union by 2017, some of them, in particular COMESA and ECOWAS, have already designed their CET structures. While COMESA’s CET assumes 4 tariff bands (0 per cent for raw materials, 0 per cent for capital goods, 10 per cent for intermediate goods, and 25 per cent for final goods), that of ECOWAS consists of 5 bands (0 per cent for essential social goods, 5 per cent for goods of primary necessity, raw materials, capital goods and specific inputs, 10 per cent for intermediate goods, 20 per cent for final consumer goods, and an additional 35 per cent for “specific goods for economic development”). The different CETs pose challenges for the required har-monization of the bands at the continental level by 2019. To add to the complexity, in order to protect domestic markets in specific sensitive sectors, African countries are allowed to individually select a limited number of prod-ucts, which will either be exempted from the application of the CET or will benefit from protection rates that are above the highest of the CET bands. It should be noted that although some countries have already determined and submitted their sensitive product lists, information available remains limited13.
Following the implementation of a CFTA by 2017, our analysis (based on the MIRAGE CGE model) assumes the formation of a CCU by 2019. In this context, we simulate a CCU scenario that assumes the COMESA CET structure, which has relatively lower protection than that of ECO-WAS. It is also important to note that sensitive products for each African country are determined in our analysis by computing an index proposed by Jean et al. (2008)14. In this regard, we assume a probable sensitive list of prod-ucts to be exempted from the CET as representing 2 per cent of the 5113 product lines defined at the Harmonized System (HS) 6-digit level for which the computed index is the highest.
The main results and key messages from our analysis are presented hereafter. In both the CFTA and CCU, tariff barriers on goods are assumed to be fully removed across the continent. The CCU results in a more opening up to the rest of the world than the CFTA in that aver-age protection imposed by Africa on its imports from the rest of the world would decrease to a level of 9.8 per
cent, against a level of 13.6 per cent with a CFTA. This corresponds to a 27.915 per cent improvement in market access granted by Africa to the rest of the world when a CCU is implemented. Non-African economies would gain further access to African markets in industrial sectors than in agriculture and food sectors16 (see Table A4.4).
As a result, and as compared to the creation of a CFTA, not only African imports would be boosted (+3.4 per cent or US$ 21.6 billion) with the establishment of a CCU –thanks to lower average tariffs imposed by African countries on their imports from the rest of the world– but African exports would increase even more (+4.2 per cent or US$ 27.6 billion) with the trade reform. In particular, African countries would strongly enhance their exports of indus-trial products and services with the formation of a CCU following the establishment of a CFTA (see Table 1). It has to be noted, however, real income would increase less in the case of a CCU (+0.17% as compared to baseline) than with a CFTA (+0.2% as compared to baseline) because with the CET, countries lose the prerogative to determine their own external tariffs vis-à-vis third countries to suit their own trade policy objectives. Nevertheless, Africa as a whole would still benefit from real income gains with a CCU in the magnitude of about 0.17 per cent relative to the status quo.
Higher African exports with a CCU as compared to a CFTA, as mentioned in Table 1, would essentially come from an increase in African exports to the rest of the world. Indeed, following the establishment of a CFTA, exports of African countries to trading partners outside the con-tinent (other developing and developed countries) would reduce as compared to the baseline, while intra-African trade would be considerably enhanced (see Figure A4.1). However, if CETs are then harmonized at the continental level, intra-African trade would also increase as compared to the baseline but to a lesser extent. The lowering of intra-African trade in the CCU from the higher level in the CFTA could be explained by the fact that some exports would be redirected to non-African partners. In quanti-tative terms, by 2022, African exports would increase by US$25.3 billion with the establishment of a CFTA, relative to the status-quo. This amount represents the net effect of a US$34.6 billion increase in intra-African exports and a
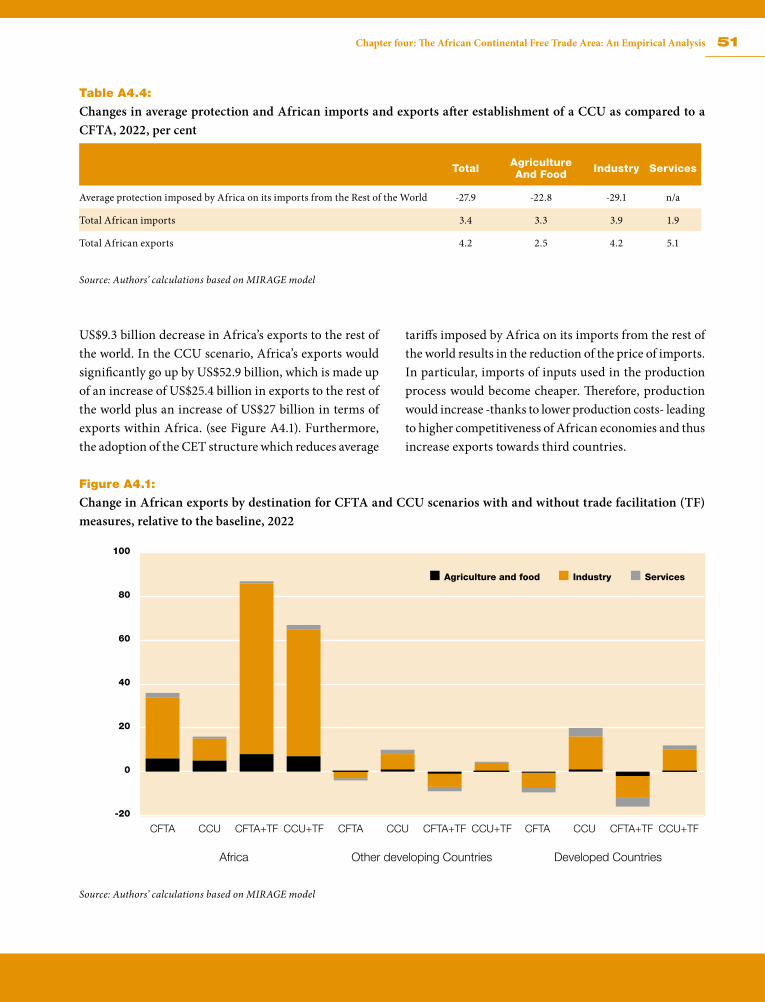
51Chapter four: The African Continental Free Trade Area: An Empirical Analysis
Table A4.4:
Changes in average protection and African imports and exports after establishment of a CCU as compared to a CFTA, 2022, per cent
Total Agriculture And Food Industry Services
Average protection imposed by Africa on its imports from the Rest of the World -27.9 -22.8 -29.1 n/a
Total African imports 3.4 3.3 3.9 1.9
Total African exports 4.2 2.5 4.2 5.1
Source: Authors’ calculations based on MIRAGE model
US$9.3 billion decrease in Africa’s exports to the rest of the world. In the CCU scenario, Africa’s exports would significantly go up by US$52.9 billion, which is made up of an increase of US$25.4 billion in exports to the rest of the world plus an increase of US$27 billion in terms of exports within Africa. (see Figure A4.1). Furthermore, the adoption of the CET structure which reduces average
tariffs imposed by Africa on its imports from the rest of the world results in the reduction of the price of imports. In particular, imports of inputs used in the production process would become cheaper. Therefore, production would increase -thanks to lower production costs- leading to higher competitiveness of African economies and thus increase exports towards third countries.
Figure A4.1:
Change in African exports by destination for CFTA and CCU scenarios with and without trade facilitation (TF) measures, relative to the baseline, 2022
Source: Authors’ calculations based on MIRAGE model
Africa
CFTA CCU CFTA+TF CCU+TF CFTA CCU CFTA+TF CCU+TF CFTA CCU CFTA+TF CCU+TF
Other developing Countries Developed Countries
-20
0
20
40
60
80
100
Agriculture and food Industry Services
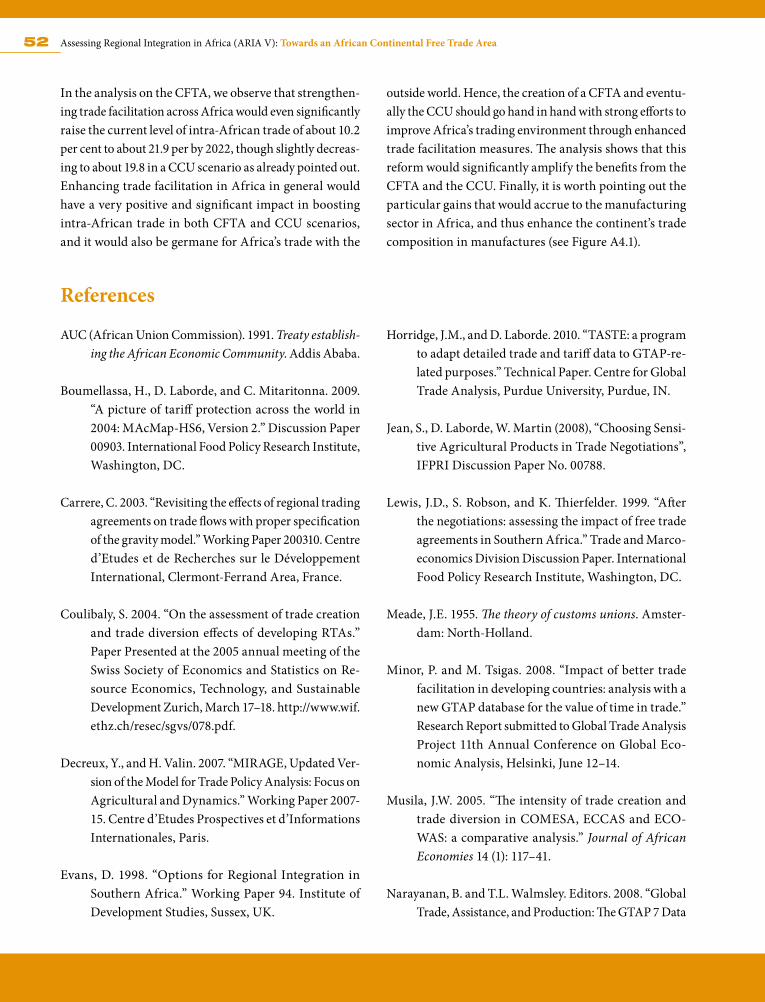
52 Assessing Regional Integration in Africa (ARIA V): Towards an African Continental Free Trade Area
In the analysis on the CFTA, we observe that strengthen-ing trade facilitation across Africa would even significantly raise the current level of intra-African trade of about 10.2 per cent to about 21.9 per by 2022, though slightly decreas-ing to about 19.8 in a CCU scenario as already pointed out. Enhancing trade facilitation in Africa in general would have a very positive and significant impact in boosting intra-African trade in both CFTA and CCU scenarios, and it would also be germane for Africa’s trade with the
outside world. Hence, the creation of a CFTA and eventu-ally the CCU should go hand in hand with strong efforts to improve Africa’s trading environment through enhanced trade facilitation measures. The analysis shows that this reform would significantly amplify the benefits from the CFTA and the CCU. Finally, it is worth pointing out the particular gains that would accrue to the manufacturing sector in Africa, and thus enhance the continent’s trade composition in manufactures (see Figure A4.1).
References
AUC (African Union Commission). 1991. Treaty establish-ing the African Economic Community. Addis Ababa.
Boumellassa, H., D. Laborde, and C. Mitaritonna. 2009. “A picture of tariff protection across the world in 2004: MAcMap-HS6, Version 2.” Discussion Paper 00903. International Food Policy Research Institute, Washington, DC.
Carrere, C. 2003. “Revisiting the effects of regional trading agreements on trade flows with proper specification of the gravity model.” Working Paper 200310. Centre d’Etudes et de Recherches sur le Développement International, Clermont-Ferrand Area, France.
Coulibaly, S. 2004. “On the assessment of trade creation and trade diversion effects of developing RTAs.” Paper Presented at the 2005 annual meeting of the Swiss Society of Economics and Statistics on Re-source Economics, Technology, and Sustainable Development Zurich, March 17–18. http://www.wif.ethz.ch/resec/sgvs/078.pdf.
Decreux, Y., and H. Valin. 2007. “MIRAGE, Updated Ver-sion of the Model for Trade Policy Analysis: Focus on Agricultural and Dynamics.” Working Paper 2007-15. Centre d’Etudes Prospectives et d’Informations Internationales, Paris.
Evans, D. 1998. “Options for Regional Integration in Southern Africa.” Working Paper 94. Institute of Development Studies, Sussex, UK.
Horridge, J.M., and D. Laborde. 2010. “TASTE: a program to adapt detailed trade and tariff data to GTAP-re-lated purposes.” Technical Paper. Centre for Global Trade Analysis, Purdue University, Purdue, IN.
Jean, S., D. Laborde, W. Martin (2008), “Choosing Sensi-tive Agricultural Products in Trade Negotiations”, IFPRI Discussion Paper No. 00788.
Lewis, J.D., S. Robson, and K. Thierfelder. 1999. “After the negotiations: assessing the impact of free trade agreements in Southern Africa.” Trade and Marco-economics Division Discussion Paper. International Food Policy Research Institute, Washington, DC.
Meade, J.E. 1955. The theory of customs unions. Amster-dam: North-Holland.
Minor, P. and M. Tsigas. 2008. “Impact of better trade facilitation in developing countries: analysis with a new GTAP database for the value of time in trade.” Research Report submitted to Global Trade Analysis Project 11th Annual Conference on Global Eco-nomic Analysis, Helsinki, June 12–14.
Musila, J.W. 2005. “The intensity of trade creation and trade diversion in COMESA, ECCAS and ECO-WAS: a comparative analysis.” Journal of African Economies 14 (1): 117–41.
Narayanan, B. and T.L. Walmsley. Editors. 2008. “Global Trade, Assistance, and Production: The GTAP 7 Data
53Chapter four: The African Continental Free Trade Area: An Empirical Analysis
Base”, Center for Global Trade Analysis, Purdue University.
Schiff, M. 1997. “Small is beautiful: preferential trade agreements and the impact of country size, market share, and smuggling.” Journal of Economic Integra-tion 12: 359–87.
UNECA (United Nations Economic Commission for Africa). 2010. Assessing regional integration in Africa IV: enhancing intra-African trade. Addis Ababa. http://www.uneca.org/aria4/ARIA4Full.pdf.
USAID (United States Agency for International Develop-ment). 2007. Calculating tariff equivalents for time in trade. Washington, DC
World Bank. 2000a. Trade Blocs. New York: Oxford Uni-versity Press.
———. 2005. Global economic prospects 2005: trade, regionalism, and development. Washington, DC. http://go.worldbank.org/U051HQ8JZ0.
Yeats, A. 1998. “What can be expected from African regional trade arrangements? Some empirical evi-dence.” Mimeo. World Bank, Washington, DC.
Notes 1 Taking lack of industrial complementarity into consideration.2 In this argument, regional integration arrangements are believed
to engage inherently in trade-facilitating activities, which would eventually lead to the reduction of NTBs.
3 Burkina Faso, Côte d’Ivoire, Guinea Bissau, Mali, Senegal and Togo.
4 COMESA member states had lowered their tariffs by 90 per cent.5 Here we used a dynamic version of the MIRAGE (Modeling In-
ternational Relationships in Applied General Equilibrium) model to assess the effects of regional and continental FTAs (For more detail about the model see Annex: Methodology. For description of the model see Decreux and Valin, 2007), The model is calibrated using the GTAP database version 7 (see Naravanan and Walmsley, 2008) and tariff comes from the MacMap-HS6v2 database (see Boumellassa et al., 2009).
6 The tripartite initiative here includes IGAD because all IGAD members, except Somalia, are members of COMESA–EAC–SADC.
7 A database of trade costs associated to time from Minor and Tsigas (2008) was used. Reduction of these costs (modeled as “iceberg costs”) were then applied to reflect improved trade facilitation between African countries.
8 See Annex 4.2 for details.9 The MIRAGE model was developed at the Centre d’Etudes Pro-
spectives et d’Informations Internationales (CEPII) in Paris and is now used in several well-known research centers and interna-tional organizations around the world. For a full description of the MIRAGE model, see Decreux and Valin, 2007.
10 An LES-CES function indicates that the demand structure of each region depends on its income level. In MIRAGE, developed countries are assumed to be constrained to a lower minimum level of consumption than developing countries; ideally, household surveys should be used for representing the demand structures in each region but they require huge amounts of data.
11 For more information about the MAcMap-HS6v2 database, see Boumellassa et al., 2009.
12 CGE models are usually composed of thousands of equations, and increasing the number of countries/regions and sectors inevitably higher the number of equations. Available softwares for running CGE models do not solve equilibriums when the number of equa-tions becomes too high (which depends on the solver and the model used).
13 For example: only Burundi, Republic Democratic of Congo, Co-moros, Kenya, Madagascar, Malawi, Mauritius, Rwanda, Sudan, Swaziland and Uganda recently submitted their sensitive product lists to COMESA.
14 From a policy maker point of view, considering both benefits and costs of sector protections, the authors show that a product can be qualified as sensitive if it combines the following three char-acteristics: it represents a high value of total imports, it is initially highly protected, and it is subject to a large tariff reduction from trade reforms.
15 Average protection imposed by Africa on its imports of all prod-ucts from the rest of the world would pass from 13.6% in the case a CFTA is implemented to 9.8% with a CCU.
16 Note that average protection imposed by Africa on its imports of agricultural and food products (industrial products) from the rest of the world would pass from 19.3% (12.7%) in the case a CFTA is implemented to 14.9% (9.0%) with a CCU.

CHAPTER
55
Perspectives for Fast-tracking an African Continental Free Trade Area 5Theory and modelling in the previous chapter showed the huge impact that an Africa-wide
CFTA can have on trade and incomes. This chapter discusses what countries could do to get to the CFTA by providing some perspectives on the subject.
The general objective of the CFTA is the creation of a single market with free movement of goods and services to foster social and economic development in Africa. The CFTA will help to broaden and deepen opportunities for exporters, by reducing and then removing barriers to trade and investment, and by building the institutional superstructure to enable trade and investment links to expand. The CFTA will bolster intra-regional trade by creating a bigger market, stimulating investment, enhancing competitiveness and developing cross-regional infrastructure, among other impacts.
All African countries need to remove obstacles to moving goods across boundaries, steps that require improvements to infrastructure and that will lift intra-African trade from the current low base. Africa’s economy has grown at an average of 5.7 per cent a year over the past decade to around $1 trillion, fuelling the expansion of a new middle class in a total population of more than 1 billion and pointing to the enormous potential of the CFTA.
It is well documented that free trade helps economies to increase their share of global markets, especially small economies, partly through increased competitiveness. Beyond market access for goods, FTAs provide more opportunities to investors, as well as greater certainty and transparency, and enable them operate freely.1
Still, the objectives of the CFTA must be clearly outlined in the protocol establishing the CFTA. The benefits, commitments and costs—as well as a roadmap—must be clear to member countries to avoid any misapprehension.
56 Assessing Regional Integration in Africa (ARIA V): Towards an African Continental Free Trade Area
5.1 Guiding Principles
A CFTA protocol could be inspired by the WTO principle of most-favoured nation (MFN) treatment, which does not allow members from discriminating against one another. A related principle to consider is “national treatment” which will ensure that products imported from other CFTA member states are not subjected to unfair national treatment by the importing member state.
Fast-tracking the African CFTA also requires building on the experiences and structures of the RECs’ FTAs and they should form the basis for establishing the provisions of the protocol, as well as sequencing and institutions. It could more or less follow the three-phase sequence used for the RECs’ FTAs—liberalize trade in goods, ensure trade-related protection and liberalize trade in services. Cross-cutting issues relate to all three phases.
5.1.1 Liberalizing trade in goods
Using the trade liberalization experience and achieve-ments of the RECs, trade in goods at the CFTA level could be fully liberalized within five years. Measures should be targeted at removing all tariffs, NTBs and quotas, and addressing the following areas:
Rules of origin. CFTA members need to identify and agree on eligible goods for preferential treatment through a list of clear and simplified rules of origin that is easy to administer and that promotes value addition along the continental production chain. The list could be modelled on the rules of origin in some of the RECs—COMESA’s may be some of the simplest.
Sensitive goods. Members need to define what they con-sider to be sensitive goods—identifiable at 4- or 6-digit HS level—taking into account national circumstances and interests. They need to prescribe a limited time-line for removing products from the sensitive list.
Customs cooperation and trade facilitation. The CFTA needs to significantly reduce and harmonize costs of customs clearance, transport and other administrative procedures. If the full benefits of integration are to be realized, cross-border infrastructure has to be enhanced.
5.1.2 Ensuring trade-related protection
Competition. Businesses in the CFTA need to be protected against any unfair trade practices. It is imperative that the CFTA adopts a competition policy and has institutional and implementation mechanisms in place.
Trade remedies. The CFTA should also allow members to take remedial trade measures—including safeguards as well as anti-dumping and countervailing measures—wherever a threat or injury arises from implementing the CFTA. The CFTA also needs a provision to protect infant industries. The protocol would need to prescribe the manner and circumstances in which such trade remedies can be taken, drawing inspiration from relevant WTO agreements.
Intellectual property rights. Such rights in the CFTA region will require protection to promote innovation in arts, science and technology. A policy on intellectual property rights is needed.
Technical barriers. The CFTA members will need to ap-preciate and recognize the importance of standards, me-trology, conformity assessment and accreditation. CFTA members will need to harmonize their practices in this area to achieve mutual product recognition. Cooperation with national, regional and international standards bod-ies will need to be promoted. Members will thus need to develop and adopt a policy framework (annexed to the CFTA protocol), consistent with the provisions of the relevant WTO agreement.
57Chapter Five: Perspectives for Fast-tracking an African Continental Free Trade Area
Sanitary and phyto-sanitary measures. Members need to develop a framework for harmonizing such measures to enable regional product certification. Any measures must be in line with the relevant WTO agreement, which would help to ensure they do not constitute technical barriers to trade.
Cross-border investment. CFTA members will need to adopt policies that create a conducive climate for cross-border investment, reduce transaction costs and create an enabling environment for private sector development.
Infrastructure development. Unless states upgrade and expand their infrastructure, the countries in the CFTA will find it hard to fully realize their trade potential. They will therefore need to undertake coordinated regional infrastructure programmes in, especially, transport, com-munications and energy. The CFTA should build on RECs’ efforts to develop trade corridors.
5.1.3 Liberalizing trade in services
As services are an important part of Africa’s economy—particularly in marketing and distributing goods—intra-African trade in services must be boosted. To do this, the CFTA needs to liberalize trade in services in sectors critical to economic integration of the whole region.
The CFTA would need to adopt a liberalization pro-gramme that will see the gradual slackening of impedi-ments to trade in services Africa-wide. The programme will need to build on the commitments that the CFTA members have already made both at the WTO and under their respective RECs.
5.1.4 Cross-cutting issues
Trade policy coordinationGiven that most CFTA members will already be contract-ing parties to regional and bilateral trading arrangements and that individual CFTA members will still want to join new arrangements with third parties, the CFTA should try to accommodate such interest.
Trading arrangements with third parties must not, how-ever, conflict with the objectives of the CFTA and the MFN principle must be applied to other CFTA members. Provisions in the CFTA would ensure that CFTA members coordinate their trade policies and negotiating positions when dealing with third parties, which would benefit the whole CFTA.
CFTA Protocol The protocol establishing the CFTA should be very clear in articulating matters relating to the responsibilities and obligations of members, including accession and ratifica-tion of the protocol, and assert the right of the authority of the CFTA to sanction any CFTA member in default of its obligations under the protocol. It should also stipulate
that a CFTA member who wishes to withdraw may do so subject to first fulfilling any outstanding obligations.
Dispute settlementDisputes are common in FTAs, hence an efficient dispute resolution system is a prerequisite for the CFTA. It is very unlikely that there will be no trade-related disputes among CFTA members.
Any dispute settlement mechanism would need to:
» Be based on the principles of cooperation and con-sultation between concerned members, to reach a mutually satisfactory solution;
» Provide for a solution that invariably entails removal of the measure not conforming to the provisions of the CFTA; and
» Provide for mediation and then arbitration, if a solution cannot be found after cooperation and consultation.
58 Assessing Regional Integration in Africa (ARIA V): Towards an African Continental Free Trade Area
Suggestions on key organs of the CFTAAs a continental arrangement, the CFTA would have to operate under existing (and any new) institutional organs of the AU, such as:
» AU Summit of Heads of State and Government, as the political authority of the CFTA;
» AU Conference of Trade Ministers, for overseeing and guiding technical work and negotiations and for over-all support to policy formulation and implementation;
» AU Sectoral Ministerial Committees, for support to policy formulation and implementation in respec-tive areas;
» Multistakeholder participation and support including civil society and the private sector; and
» AUC for secretariat support, including managing and coordinating administrative affairs of the CFTA.
5.2 Key steps to consider 5.2.1 Background technical work
Previous ARIA reports including this current publication provide much information for boosting intra-African trade but further technical work may be required to support the on-going process towards fast-tracking the
Continental Free Trade Area, in areas such as rules of origin, adjustment costs, and the RECs’ trading arrange-ments and how they would fit into a CFTA.
5.2.2 Developing negotiating principles and guidelines and launching the negotiations
From the onset, it will be instructive to have principles and guidelines for the negotiations, and they should outline the proposed permanent CFTA institutional framework, principles, scope and the mechanisms for monitoring
the CFTA negotiations. The CFTA could borrow best practices from some of the RECs but ensure that they are redesigned to serve the interests of prospective CFTA members. Negotiations will be carried out in good faith.
5.2.3 Drafting the CFTA protocol and related Annexes
As the principal legal authority for establishing the CFTA, and the subject and basis of CFTA negotiations, the pro-tocol establishing the CFTA would need to be drafted in the early preparatory stages to launch the negotiations. Several annexes that form integral parts of the CFTA protocol will also need to be developed early as final drafts, as they are subject to negotiation. Independent experts could be assigned to develop the drafts. The key annexes for the CFTA would include:: rules of origin; trade
remedies; NTB reporting, monitoring and elimination mechanisms; simplification and harmonization of trade and customs procedures and documentation; transit pro-cedures; procedures for anti-dumping and countervailing measures; competition policy; standardization, metrology, conformity assessment and accreditation; provisions on tariff liberalization for trade in goods; specific commit-ment schedules for trade in services; and dispute settle-ment mechanisms.
59Chapter Five: Perspectives for Fast-tracking an African Continental Free Trade Area
5.2.4 Expert group meetings
The draft CFTA documents will need to be examined by experts from prospective CFTA member states to gain stakeholder buy-in and to refine them before negotiations begin. The experts could be organized into one or more working groups with relevant expertise.
The working group(s) would then, on the basis of the re-fined draft documents and deliberations, draft a roadmap for the negotiations showing thematic areas, activities, outputs, responsibility and time-frames, present their outputs to the relevant AU organs to consider and ap-prove them.
5.2.5 Launching the negotiations
A special summit of the AU would need to be convened to officially launch the CFTA negotiations. It would need to approve the work programme, negotiation principles and guidelines as well as the roadmap for negotiations. It should also consider the draft documents developed as the basis for negotiations.
The negotiations are the most critical step as they entail national and regional consultations as well as continen-tal negotiations to achieve convergence on key issues. Although advisory working groups or teams of experts can be established by prospective CFTA member states to do the preliminary work on the thematic areas, the
official negotiations should be at some sort of continen-tal trade negotiating forum or similar permanent body established for this.
Prospective CFTA member states will need to pledge much commitment and sincerity if they are to progress through the negotiations. It will also be crucial that negotiators adhere to the principles and guidelines earlier adopted.
The negotiations will cover all aspects of the CFTA, in-cluding provisions of the CFTA protocol and its annexes, and will seek to secure agreement on each issue or theme of the CFTA by all prospective member states.
5.2.6 Finalizing the agreement and bringing it into force
Given the many different themes under negotiation, vari-ous agreements will emerge from the negotiations, cul-minating in the protocol establishing the CFTA.
A Summit of Heads of State and Government will need to be convened to approve the agreements and sign the
protocol. After the necessary ratification processes by member states, the CFTA would then enter into force in accordance with the protocol’s provisions.
References
AU (African Union). 2010. Report of meeting of 6th Or-dinary Session of AU Ministers of Trade, Kigali, Rwanda, October 29–November 2010.
AU (African Union). 2011. . Report of meeting of 7th Ordinary Session of AU Ministers of Trade, Accra, Ghana, 29 November – 3 December 2011
COMESA, EAC and SADC. 2010. “Tripartite agreement establishing the COMESA–EAC–SADC Tripartite Free Trade Area.” Draft. December Revision. Lusaka, Zambia; Arusha, Tanzania; Gaborone, Botswana.
———. n.d. Tripartite FTA negotiation modalities: guide-lines for negotiating the Tripartite Free Trade Area among the member states of COMESA, EAC and
60 Assessing Regional Integration in Africa (ARIA V): Towards an African Continental Free Trade Area
SADC. Lusaka, Zambia; Arusha, Tanzania; Gabo-rone, Botswana.
UNECA (United Nations Economic Commission for Africa). 2010. Assessing regional integration in Africa IV: enhancing intra-African trade. Addis Ababa. http://www.uneca.org/aria4/ARIA4Full.pdf.
———. 2011. Study on the establishment of inter RECs’ free trade areas in Africa: drawing on lessons from the COMESA-SADC-EAC FTA experience. Addis Ababa, Ethiopia
Notes1 Despite the above advantages, FTAs draw criticism. Some com-
mentators argue that most effects on developing countries are negative. For example, many developing countries do not have robust environmental protection laws, but do have cheap labour, leading to exploitation both of natural resources and labour, rather than poverty reduction.
CHAPTER
61
Movement of People and the Right of Residence and Establishment
This chapter discusses the traditional arguments for free movement of people, then moves on to issues of temporary and permanent immigration, including implementation of relevant protocols, and analyses governments’ concerns.
The free movement of people and their right of residence and establishment across borders are among the founding principles of the AEC (chapter VI of the Abuja Treaty). People’s freedom to move country is a basic human entitlement, recognized in the 1948 Universal Declaration of Human Rights and the International Covenant on Civil and Political Rights as “freedom of movement”.
Movement of people is the ability of individuals, families or groups of people to choose their place of residence, and human movement or migration as the act of changing one’s place of residence (UNDP, 2009). Free movement of people in Africa consists in enabling REC nationals to move freely in all the REC member states (and thus to exempt them from needing a visitor’s visa or residence permit), al-lowing them to reside in a member state other than their country of origin and eventually to establish in one country and exercise an employment there or undertake commercial and industrial activities.
In an increasingly integrated world, international migration is bound to continue and will likely expand. This is particularly true in Africa, where movements of people have been commonplace, particularly among contiguous states.
Any society that creates an enabling environment for the free movement of people invariably paves the way for the free movement of labour. Migration is accepted as a legitimate tool for adjusting the skills, age and sectoral composition of national and regional labour markets. Migrant labour has become an essential feature in meeting economic and labour market challenges—when people move from one region or country to another, they carry with them their skills and know-how.1 Still, migrant workers need to be granted social security rights and their qualifications recognized in other countries.
6
62 Assessing Regional Integration in Africa (ARIA V): Towards an African Continental Free Trade Area
The free movement of people underpins all other key pillars of the African common market as it is critical for supplying services and even the movement of capital. It will bring a net gain, particularly in providing skilled workers in countries lacking them.
Significant progress has been made by various RECs, including the adoption of protocols on the free movement
of people, labour, services, right of establishment and right of residence (table 6.2 below). Yet the process of full transition of mobility of workers among African coun-tries remains one of the most contentious issues among African countries for various reasons, including security and unemployment, and is slow. Apart from countries in West Africa, and a few others, many countries in Africa still generally demand visas from neighbours (box 6.1).
6.1 Integrating factor markets
The main argument for the movement of labour in an FTA is that it increases the aggregate output of the member countries and so the aggregate welfare of their popula-tions. Harvard economist Lant Pritchett has stated that “in contrast to these modest gains from further liberalization of goods or capital markets, estimates of the gains from the fanciful counterfactual of a complete liberalization of labour mobility are that the world GDP would roughly double. At current levels of GDP, this implies gains of $65 trillion” (Pritchett, 2010).
Free movement of people would mean that nation states would need to compete for the best and brightest human
resources. Labourers would seek locations where their productivity and quality of life would be maximized. Mobile labour would ensure that the regional pool of skills is fully exploited and can move quickly to areas of greatest need, and that the common market is free from bias as a result of either very high or very low-priced labour in some areas.
Economic theory provides a strong general result for aggregate production when the production sectors of two (or more) countries are integrated by the removal of restrictions on intra-area factor mobility and factor tax differences. This analysis relates to the establishment
Box 6.1 Visa requirements
The system of harmonized immigration and emigration foreseen by REC protocols is yet to be widely implemented.
Freedom of movement in the ECOWAS region is more advanced than in any other sub-region, but only the first
of the three phases of the relevant protocol (visa-free entry for up to 90 days) has been completely implemented
in all ECOWAS countries.
Many other African countries still demand visas from neighbours. Of the 15 SADC member countries, five have
made no commitment in movement of labour. Members of COMESA and the SADC impose visa requirements.
CEMAC community citizens still need to secure an entry visa to Gabon and Equatorial Guinea, which resist such
movements—formally and informally—because of their small populations.
In UMA’s five countries, free movement of people is allowed between Libya, Morocco and Tunisia. Algeria and Tunisia
impose no visa restrictions on each other. Visa restrictions are still applied between the other countries bilaterally.
63Chapter Six: Movement of People and the Right of Residence and Establishment
of a single regional market for factors: it requires the removal of border restrictions on the movements of fac-tors plus national treatment through mutual recognition or equivalent measures to ensure that foreign factors are treated equally within the borders. The proposition is that the aggregate production using the sum of the resources is greater (or no less) than the sum of the production of the member countries separately, and is in addition to gains from freeing commodity trade, as it is based on a given set of prices.
Thus a gain results from freeing trade in primary factors over and above the gain from freeing commodity trade, assuming the latter does not equalize factor prices. This result derives from differences in the countries in terms of the marginal productivity of factors, with labour and capital moving from low to high marginal productivity locations. This is the essential argument in favour of a common market—free trade plus provisions for free movement of factors.
This efficiency argument for the free movement of people could be further supported if there are complementarities between mobile factors. In particular, capital movements in the form of FDI very often require key company ex-ecutive and skilled personnel to move to the new affiliate in the host country. Most service trade is carried out through commercial presence. Including provisions in RECs dealing with FDI-related movement of people is thus complementary to liberalizing trade in services.
The arguments in support of the movement of profession-als are another form of the gains from integrating factor markets. To a greater extent than the provisions relating to permanent migration, temporary labour movement provisions in African RECs are based on the desire to increase the supply of workers in professions or occupa-tions that have excess national demand for labour. When this demand in one country is matched with excess supply in another, both countries secure unambiguous gains; when both countries have excess demand, however, the emigration (source) country may lose.
In addition, for sending countries, immigration reduces the incidence of poverty, improves health and education outcomes, and increases business investment (Ratha et al., 2011), partly because of the remittances that immi-grants send home (box 6.2). Migrant remittances are also a vital source of foreign currency that helps to develop the labour-exporting country (Davies and Head, 1995). The return of many temporary worker emigrants to their home countries also generates gains, from their recent labour training and experience.
Box 6.2 Africa’s remittance gains
Remittance inflows in Africa quadrupled between 1990 and 2010, to nearly US$ 40 billion, or equivalent to 2.6
per cent of continental GDP in 2009. After FDI, they are the continent’s largest source of foreign currency. Nigeria
received US$ 10 billion in 2010, the highest in sub-Saharan Africa and about half the total.
Other large remittance recipients are Kenya, Senegal, South Africa, Sudan and Uganda. As a share of GDP, Lesotho
received the highest (28.5 per cent), followed by Togo (10.7 per cent), Cape Verde (9.4 per cent), Senegal (9.3 per
cent) and Gambia (8.2 per cent). Egypt and Morocco, the two largest recipients in North Africa for both absolute
flows and as a share of GDP, account for three quarters of flows to North Africa, followed by Algeria and Tunisia.
64 Assessing Regional Integration in Africa (ARIA V): Towards an African Continental Free Trade Area
6.2 Protocols on temporary immigration
Temporary immigration has become more important in recent years for its role in international business and education. It is gaining importance as international and globalized businesses evolve, and as managers seek people with the best skills and qualifications. Such immigra-tion can be long (several months to a couple of years for workers and several years for students). In some cases temporary migrants are permitted to extend their stay to permanent residence.
Temporary immigration is defined as entry into a REC member state without the intent to establish permanent residence. Protocols on FTAs often allow for the temporary entry of business people into the territory of the trading partners to facilitate free trade opportunities. They also permit movement of labour to take up work. Much of the international migration of labour is of the temporary type. This category also covers foreign students. The FTAs have a category of temporary entry for non-immigrant
professionals. Dependent spouses and children accompa-nying or following are also eligible for temporary entry.
A temporary period has a reasonable, finite end that does not equate to permanent residence. Non-immigrant pro-fessionals could be admitted to a REC member state for a period ranging from a couple of days or weeks (for consultancies) to a couple of years renewable indefinitely, provided the foreigner can demonstrate that he or she does not intend to remain or work permanently in the host country.
Parallel to labour migration runs entrepreneurial (or com-mercial) migration. Entrepreneurs who are self-employed, especially in the informal sector, move from one country to another across Africa. A large proportion of commer-cial migrants from, for example, Burkina Faso, Mali and Senegal are in Côte d’Ivoire; many from Chad and Niger are in Ghana and Nigeria.
6.2.1 Labour policies in RECs
Article 61 of the ECOWAS Treaty encourages members to harmonize labour and social security laws. In September 2005, six states (Benin, Côte d’Ivoire, Guinea, Mali, Nigeria and Togo) proposed a framework for implementing the ECOWAS priority programmes on labour matters. An ECOWAS meeting of experts in 2008 made a strong case for the OHADA2 draft labour law3 to be considered as a possible model for parts of an ECOWAS labour policy.
Member states have been slow, however, to meet their com-mitments to grant migrant workers equal treatment with nationals in areas such as security of employment, and, in certain cases of job loss, re-employment and training. Thus in January 2008, they adopted the ECOWAS Common Approach on Migration, a multi-sectoral regional mecha-nism for addressing the challenges of intra-community mobility and migration to third countries. They also set up an ad hoc ministerial committee with responsibility for migration and urged member states to take the necessary steps to remove all obstacles to intra-community move-ment of regional citizens (Deacon et al., 2008).
On a positive note, however, after the adoption of the ECOWAS Protocol on Education and Training in 2001, work is taking place to harmonize education certificates across the three language groups.
EAC states have committed themselves to put in place a social partnership among governments, employers and employees. They have also agreed to develop a framework for mutual recognition of professional qualifications, and have issued various studies, including the “Harmonization of employment policies in East Africa” and “Harmoni-zation of labour legislation in East Africa”. The Council of Ministers recommended that similar studies should be conducted in the new EAC members—Burundi and Rwanda—after which a model EAC labour law and an EAC labour policy will be developed.
Article 26 of the SADC social charter seeks to harmonize social policies that contribute to productive employment, facilitate labour mobility and ensure regional cooperation in collecting labour market data. This is work in progress.
65Chapter Six: Movement of People and the Right of Residence and Establishment
6.2.2 Mutual recognition of certificates
The complexity of differing national labour market regu-lations discourages cross-border movements of labour, and temporary immigrants especially face steep hurdles when seeking to join the formal job stream in the host country. Immigrants are less successful in securing jobs than locals in the country of destination, partly because of discrepancies and difficulties in evaluating and rating immigrants’ certificates.
The chief measure to overcome this problem is mutu-ally recognizing labour qualifications (Lloyd, 2002), and African RECs need to do this. Labour provisions should be designed to grant national treatment to occupational
workers moving from one country to another country. The basic principle is that a person registered to practise an occupation in any African REC member should also be entitled to practise an equivalent occupation in the host country.4
In education, too, without common regional standards and qualifications, foreign certificates risk being given less recognition. Some countries within RECs have better standards and qualifications and these could be used as good practices to follow, or to build regional centres of excellence in areas such as health, engineering and law.
6.2.3 Challenges for the free movement of labour
Some countries fall short of implementing provisions or protocols for the free movement of labour for economic, political and socio-cultural reasons. For instance, official unemployment rates in Africa are generally high ranging from 12 to 45 per cent and in some cases as high as 70 per cent. With such high unemployment, made worse in recent years by structural changes to their economies,
states are unwilling to allow in temporary unskilled la-bour, especially if they consider their own nationals highly uncompetitive against immigrants. Member states may also allow only people with certain job descriptions and skills to enter their countries even though they may be short of skills.
6.3 Trends in permanent immigration
The United Nations estimates that international migration in 2010 involved about 3.1 per cent of the world’s popula-tion—about 214 million of people—a tenth of whom are destined for Africa (UN, 2010). Movement is particularly heavy in sub-Saharan Africa, where almost 7 out of 10 people who had moved abroad were estimated to live in other sub-Saharan African countries in 2005. 5
Almost 3 per cent of West Africans living in the region are not living in their country of origin (ECOWAS Com-mission, 2007: 3). Between 1989 and 1991, the number of Malians in Côte d’Ivoire was estimated at somewhere over 1 million. Burkina Faso alone had about 3 million of its nationals living in Côte d’Ivoire. Studies confirm that at mid-2007, among non-citizens living elsewhere in ECOWAS there were no less than 270,000 refugees in the
West African region, with most of them fleeing civil wars in Liberia (120,000) and Sierra Leone (19,000).6 In Guinea, it was estimated that some 15,800 refugees were living in the country, the majority from Liberia.7 About 93 per cent of emigrants from Niger were living in Africa compared with 27 per cent and 33 per cent of emigrants from São Tomé and Príncipe and Cape Verde. According to official estimates, about 100,000, predominantly Senegalese and, to a lesser extent, Malians live in Mauritania (Oumar Ba and Choplin, 2005).
Eastern and Central Africa has traditionally shown huge mobility, partly because of drought and war. The Luo and Masai tribal populations, for example, are on both sides of the Kenyan and Tanzanian borders, the Nubi reside in both Uganda and Sudan, and bands of Somalis move
66 Assessing Regional Integration in Africa (ARIA V): Towards an African Continental Free Trade Area
around the region, regularly crossing the borders of Soma-lia, Ethiopia, Djibouti and Kenya. One would also expect the Bakongo from the Democratic Republic of Congo to move back and forth more easily from that country to Angola, to Gabon and to the Republic of Congo, given that they share borders, similar cultures and family ties.
The Democratic Republic of Congo, Kenya, Tanzania and Uganda are the main destination countries for workers from Burundi, Malawi, Mozambique, Rwanda and other central African countries. Mining has also attracted work-ers in Angola, Gabon, Equatorial Guinea, Mauritius, Namibia, Swaziland, Zambia and Zimbabwe.
The countries with the largest immigrant shares in Eastern and Central Africa in early 1990 were Zimbabwe (8 per cent), Somalia (7 per cent), Malawi (12 per cent), Djibouti (13 per cent) and Zambia (4 per cent). The Democratic Republic of Congo, Ethiopia, Malawi, Somalia and Zimba-bwe had the largest number of immigrants, varying from more than 1 million in Malawi to over 600,000 in Somalia. In 2000 and 2005 the Democratic Republic of Congo, Ethiopia, Sudan and Tanzania had some of the largest immigrant shares, at 1.5–2.5 per cent of the population.
In Southern Africa, mining in South Africa and activi-ties of multinational companies have caused significant movements of people (Ndulo et al., 2005), particularly
from its neighbours Lesotho, Mozambique, Swaziland and Zimbabwe. Most of the workers are semi-skilled and unskilled labourers.
Beyond the impact of mining, since 1994 South Africa has received an influx of migrants from various parts of the sub-Saharan region, including Congo, Ghana, Kenya, Mali, Nigeria, Senegal, Sierra Leone, Uganda and Zaire. The post-apartheid wave of immigrants from Mali, Nige-ria, Senegal, Sierra Leone and Zimbabwe are mostly street vendors and traders seeking to capitalize on the relatively affluent market of South Africa. These mostly informal entrepreneurs import traditional African clothing and handicrafts, employ and train locals, and generally in-vigorate the economy.
In North Africa migrants or de facto settlers have stayed for years, some for decades (Roman, 2006, for exam-ple) and many Chadians, Nigeriens, Sudanese and other migrants and refugees have been living and working in Tripoli and Cairo for many years, or even decades. Some estimates suggest that Libya hosts 2 million–2.5 million immigrants (including 200,000 Moroccans, 60,000 Tu-nisians, 20,000–30,000 Algerians, and 1 million–1.5 mil-lion sub-Saharan Africans), or 25–30 per cent of its total population (Boubakri, 2004). This sub-Saharan immigrant population is dominated by some 500,000 Chadians and an even higher number of Sudanese (table 6.1)8.
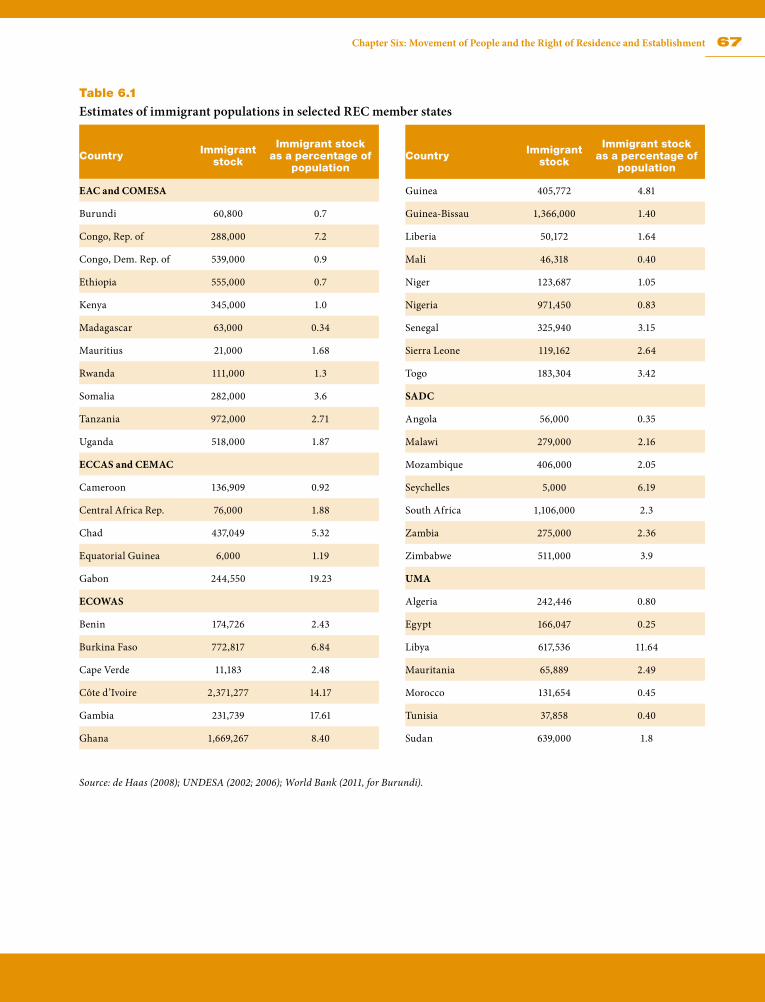
67Chapter Six: Movement of People and the Right of Residence and Establishment
Table 6.1
Estimates of immigrant populations in selected REC member states
Country Immigrant stock
Immigrant stock as a percentage of
population
EAC and COMESA
Burundi 60,800 0.7
Congo, Rep. of 288,000 7.2
Congo, Dem. Rep. of 539,000 0.9
Ethiopia 555,000 0.7
Kenya 345,000 1.0
Madagascar 63,000 0.34
Mauritius 21,000 1.68
Rwanda 111,000 1.3
Somalia 282,000 3.6
Tanzania 972,000 2.71
Uganda 518,000 1.87
ECCAS and CEMAC
Cameroon 136,909 0.92
Central Africa Rep. 76,000 1.88
Chad 437,049 5.32
Equatorial Guinea 6,000 1.19
Gabon 244,550 19.23
ECOWAS
Benin 174,726 2.43
Burkina Faso 772,817 6.84
Cape Verde 11,183 2.48
Côte d’Ivoire 2,371,277 14.17
Gambia 231,739 17.61
Ghana 1,669,267 8.40
Country Immigrant stock
Immigrant stock as a percentage of
population
Guinea 405,772 4.81
Guinea-Bissau 1,366,000 1.40
Liberia 50,172 1.64
Mali 46,318 0.40
Niger 123,687 1.05
Nigeria 971,450 0.83
Senegal 325,940 3.15
Sierra Leone 119,162 2.64
Togo 183,304 3.42
SADC
Angola 56,000 0.35
Malawi 279,000 2.16
Mozambique 406,000 2.05
Seychelles 5,000 6.19
South Africa 1,106,000 2.3
Zambia 275,000 2.36
Zimbabwe 511,000 3.9
UMA
Algeria 242,446 0.80
Egypt 166,047 0.25
Libya 617,536 11.64
Mauritania 65,889 2.49
Morocco 131,654 0.45
Tunisia 37,858 0.40
Sudan 639,000 1.8
Source: de Haas (2008); UNDESA (2002; 2006); World Bank (2011, for Burundi).
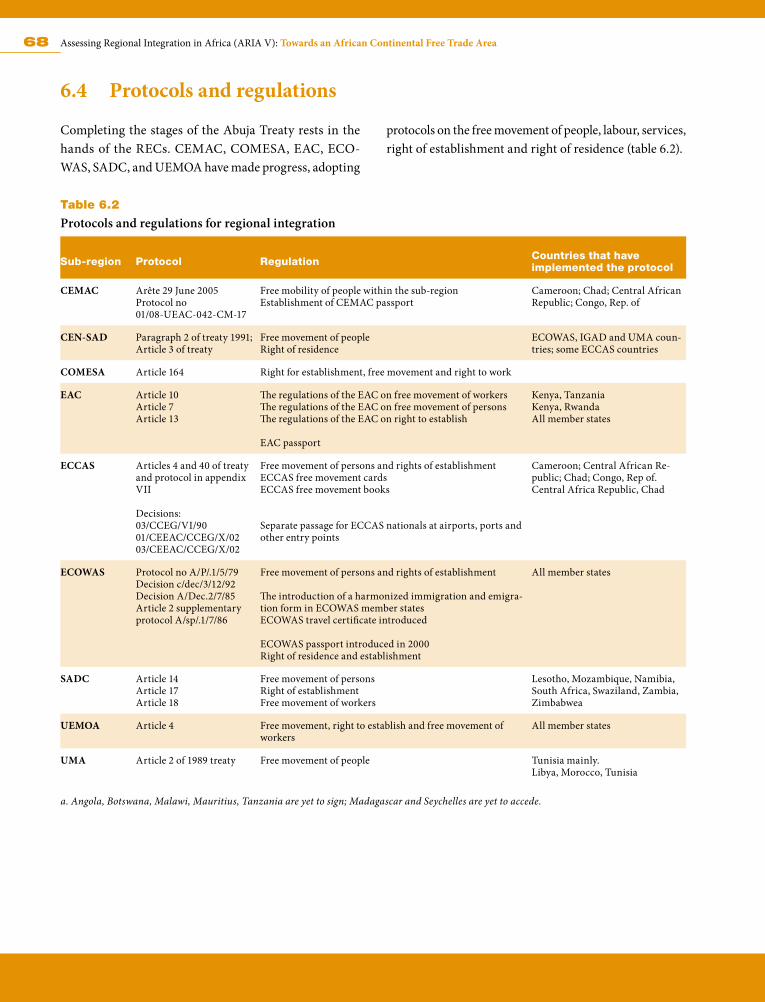
68 Assessing Regional Integration in Africa (ARIA V): Towards an African Continental Free Trade Area
6.4 Protocols and regulations
Completing the stages of the Abuja Treaty rests in the hands of the RECs. CEMAC, COMESA, EAC, ECO-WAS, SADC, and UEMOA have made progress, adopting
protocols on the free movement of people, labour, services, right of establishment and right of residence (table 6.2).
Table 6.2
Protocols and regulations for regional integration
Sub-region Protocol Regulation Countries that have implemented the protocol
CEMAC Arête 29 June 2005Protocol no 01/08-UEAC-042-CM-17
Free mobility of people within the sub-regionEstablishment of CEMAC passport
Cameroon; Chad; Central African Republic; Congo, Rep. of
CEN-SAD Paragraph 2 of treaty 1991; Article 3 of treaty
Free movement of peopleRight of residence
ECOWAS, IGAD and UMA coun-tries; some ECCAS countries
COMESA Article 164 Right for establishment, free movement and right to work
EAC Article 10 Article 7Article 13
The regulations of the EAC on free movement of workersThe regulations of the EAC on free movement of personsThe regulations of the EAC on right to establish
EAC passport
Kenya, TanzaniaKenya, RwandaAll member states
ECCAS Articles 4 and 40 of treaty and protocol in appendix VII
Decisions: 03/CCEG/VI/9001/CEEAC/CCEG/X/0203/CEEAC/CCEG/X/02
Free movement of persons and rights of establishmentECCAS free movement cardsECCAS free movement books
Separate passage for ECCAS nationals at airports, ports and other entry points
Cameroon; Central African Re-public; Chad; Congo, Rep of.Central Africa Republic, Chad
ECOWAS Protocol no A/P/.1/5/79Decision c/dec/3/12/92Decision A/Dec.2/7/85Article 2 supplementary protocol A/sp/.1/7/86
Free movement of persons and rights of establishment
The introduction of a harmonized immigration and emigra-tion form in ECOWAS member statesECOWAS travel certificate introduced
ECOWAS passport introduced in 2000Right of residence and establishment
All member states
SADC Article 14 Article 17Article 18
Free movement of personsRight of establishmentFree movement of workers
Lesotho, Mozambique, Namibia, South Africa, Swaziland, Zambia, Zimbabwea
UEMOA Article 4 Free movement, right to establish and free movement of workers
All member states
UMA Article 2 of 1989 treaty Free movement of people Tunisia mainly.Libya, Morocco, Tunisia
a. Angola, Botswana, Malawi, Mauritius, Tanzania are yet to sign; Madagascar and Seychelles are yet to accede.
69Chapter Six: Movement of People and the Right of Residence and Establishment
CEMACThe protocol on the free movement of persons within CEMAC was signed in the arête of 16 March 1994 and was revised on 25 June 2008. An act of 2005 was passed on the free movement of people in the CEMAC region, and in March 2010 a regulation set the conditions for the management and delivery of the CEMAC passport. The CEMAC Treaty also provides for right of residence and establishment.
CEN-SADParagraph 2 of Article 1 of the treaty of establishment provided for measures likely to ensure the free movement of people, goods, capital and interest of the nationals of the member states; the freedom of residence, ownership and economic performance; and the freedom of trade and movement of goods, products and services from signatory countries.
COMESAAs a first step towards establishing a common market and eventually an economic community of Eastern and Southern African states, the Protocol on the Gradual Re-laxation and Eventual Elimination of Visa Requirements within COMESA (under Article 163 of the COMESA Treaty) was adopted in December 1984. In 2001 COMESA member states adopted a protocol on the free movement of persons, labour, services, right of establishment and residence, and to remove gradually all restrictions within an agreed time-frame. EAC member states recently signed the Common Market Protocol for free movement of per-sons, goods, labour, services and capital.
EACArticles 7 through 9 of the Protocol for the Establishment of a Common Market for East Africa, which came into effect in July 2010, stipulate that partner states guarantee the free movement of people who are citizens of the com-mon market, within their territories.
ECCASArticles 4 and 40 of the 1983 ECCAS Treaty and the protocol (appendix VII) state that nationals of a member state can freely and in any time enter, travel to, establish in and exit any territory of another country member. The
right of establishment gives other nationals from ECCAS member states access to unpaid and traditional activities, the professions as well as the opportunity to create and manage an enterprise according to the chart of invest-ments of the host country.
ECOWASMember states adopted in May 1979 the Protocol on Free Movement of Persons, Residence and Establishment. (It was followed by supplementary protocols on residence and establishment.) The protocol guarantees to national of ECOWAS member states, among other things, the right to enter, reside and establish economic activities in the territory of member states.
SADCSADC adopted in June 1995 the Draft Protocol on the Free Movement of Persons in SADC, which was replaced in January 1997 and again by the 2005 Protocol on the Facilitation of Movement of Persons within SADC.9 It aims to facilitate entry, for a lawful purpose and without a visa, into the territory of another state party for a maxi-mum period of 90 days per year, for bona fide visit and in accordance with the laws of the state party concerned; permanent and temporary residence in the territory of another state party; and establishment of oneself when working in the territory of another state party.10
In June 2007, SADC states also adopted the SADC Protocol on Trade in Services for six key sectors.11 Thus SADC states have concluded various protocols and memorandums of understanding with provisions for liberalizing service sectors and harmonizing regulations for these sectors, as well as education and health. SADC member states agreed in March 2008 to bring forward the single visa (Univisa) for tourists visiting southern Africa, modelled along the lines of the European Schengen visa.
SADC partner states are obliged, in accordance with their national laws, to guarantee the protection of the citizens of the other partner states living or staying in their territories.
UMAArticle 2 of the 1989 UMA Treaty states that member states shall strive progressively to implement the free circulation
70 Assessing Regional Integration in Africa (ARIA V): Towards an African Continental Free Trade Area
of persons, services, goods and capital. In Article 3, the treaty looks at agreement at the cultural level, suggesting the establishment of cooperation aiming at developing education at different levels, preserving spiritual and moral values inspired from general teachings of Islam and safeguarding Arab national identity.
Progress in adopting textsIn COMESA, the relevant protocol has not come into force, and will only do so when at least seven states sign and ratify it (only three have so far—Kenya, Rwanda and Zimbabwe).
Only about half the member states have responded to the ECOWAS recommendation to establish national commit-tees to monitor how the ECOWAS protocols are carried out.12 The Liberian government is following through on the ECOWAS protocols on the free movement of peoples and goods through border management.13 Although an ECCAS decision in 200214 institutionalized meetings of immigration officials from member states to enable the secretariat to follow up on decisions relating to movement of people, no meetings have been held.
Freedom of movement in ECCAS is applied to only some categories of nationals: tourists, professionals (government and ECCAS officials, businessmen, artists, athletes), re-searchers, teachers, students and interns, and “borders”.15
Central Africa has made minimal progress in accelerat-ing free movement of people. Some ECCAS countries still impose visa requirements on community citizens—Angola, Gabon, Equatorial Guinea and São Tomé and Príncipe. Free movement is practised only among four of the 10 ECCAS member countries—Cameroon, Central African Republic, Chad and the Republic of Congo. These are also the countries implementing the protocol in CEMAC.
The relevant SADC protocol awaits ratification by two thirds of member states. So although visa requirements were abolished in 1994 (for travel by SADC citizens in the region), inequalities in economic development between some member states have held back implementation.
6.5 Other regional initiatives
Some innovative approaches are being implemented to promote the free movement of people, right of establish-ment and residence in Africa. For example, in UMA, Mauritania guarantees freedom of establishment and capital investment, freedom to transfer foreign capital, the ability to transfer professional income of foreign em-ployees, and equal treatment of Mauritanian and foreign individuals and legal entities.16 Free movement of people and the rights of residence and establishment in UEMOA are fully harmonized with ECOWAS, including the com-mon passport.
Holders of diplomatic passports are exempted from visa obligations in the CEN-SAD zone, a privilege to be ex-tended to students, businessmen, athletes and academi-cians. CEN-SAD is drawing up a protocol on free move-ment, inspired by ECOWAS texts.
The five EAC member states are planning to have joint diplomatic missions. The move will harmonize consular and visa services for EAC citizens (EAC, 2011). Rwanda and Kenya have waived work permits for EAC citizens (Muwanga, 2011). Kenya has waived work permit fees for citizens of Burundi, Tanzania and Uganda.17 All 15 of Kenya’s border posts now have harmonized immigra-tion procedures, and eight are operating 24 hours a day (Mugoh, 2011).
Some RECs are using community passports. CEMAC is a forerunner, adopting a CEMAC passport for the Central Africa Republic in 2003. Free movement within the region, by individuals for business or other reasons, has improved since the wider introduction of the CEMAC passport in 2008. In EAC, a community passport is in use, allowing multiple entry to citizens of partner states to travel freely within the EAC region for up to six months.
71Chapter Six: Movement of People and the Right of Residence and Establishment
A standardized ECOWAS travel certificate was adopted in 1985. These are available in seven countries18 and are valid for two years, renewable for a further two. They are much cheaper to acquire and produce than national pass-ports, which are also distributed less than systematically in several member states.19 In May 2000, the ECOWAS passport was adopted to progressively replace national passports over a 10-year transitional period.
Some RECs are establishing special immigration counters at ports of entry, particularly in West Africa. EAC mem-ber states have also done this for community travellers at regional airports.
A few African countries have helped potential emigrants by providing information on migration opportunities and counselling them about the risks involved. For instance, the Ethiopian government has established an office to regulate private recruitment agencies, which are required to obtain a one-year, renewable licence, to report the status of their work, and to submit to audits, in order to ensure that workers are not being cheated by the agencies or foreign employers (Ratha et al., 2011).
6.6 Challenges of permanent immigration and free movement of people
The challenges of implementing the protocol on the free movement of people include those enumerated below:
6.6.1 Non-security concerns
The effect of bilateral arrangements Existing bilateral arrangements may act as a disincentive to sign or ratify protocols. For example, the bilateral ar-rangement between South Africa and Lesotho through the Lesotho/SA Joint Bilateral Commission Agreement of Cooperation of June 2007 allows Lesotho citizens to move freely into South Africa without visas and stay without time bound. To South Africa and Lesotho, therefore, the SADC protocol would make no difference to the current situation.
Uncoordinated economic programmes and fiscal policies Initiatives to enable free movement have not attempted to harmonize national legislation and other national policies (on, for example, setting up a business). This lacuna could affect the right of residence and establishment and hence perpetuate bias and discrimination against nationals of other member states in the REC.
Minimum capital requirement for investment in member statesIn its broadest interpretation, the freedom of movement should facilitate the greatest possible mobility for the larg-est number of people within a REC. In most cases, however,
member states target specific groups for free movement, and right of residence and establishment, such as business people and investors. This is because they are the people with funds and can help to improve tax collection and create local jobs. Small business vendors are treated dif-ferently from commercial entrepreneurs with investment capital—and may even be obstructed and harassed.
Yet even investors may find the barriers high. There are still problems over the right of establishment and resi-dence in RECs. Some countries impose minimum capital requirement ranging from US$80,000 to USD1 million to do business there. These amounts may well be prohibitive, discouraging non-nationals from setting up a business in the countries.
Some countries have also enacted laws, which in effect restrict foreigners from participating in certain kinds of economic activities. These laws have discouraged long-term investment by foreign owned or operated businesses. Land is also a recurring issue in a number of countries, where land Acts prohibit foreign companies or non-nationals from owning land, sometimes stemming from traditional rules on land ownership.
72 Assessing Regional Integration in Africa (ARIA V): Towards an African Continental Free Trade Area
6.6.2 Security concerns
Limited resources, weak public institutions and long land borders severely impede the control of migration in many African countries, resulting in many undocumented mi-grants. Their presence may lead to large numbers of resi-dents being perceived as foreigners, which may contribute to lawlessness and can undercut attempts to regulate the labour market and protect workers. This imposes severe security problems on member countries. There could be significant security concerns among member states, even within the same REC, rendering states reluctant to move ahead with protocols on free movement of people.
Border disputesBorder disputes deriving from arbitrary borders persist, even after the Organization of African Unity enjoined governments to respect these borders to avoid poten-tially protracted, widespread conflicts.20 Border disputes between some countries for example, have led to the expulsion of community citizens.
Spillovers from political instabilityPolitical instability generates many refugees and internally displaced persons. According to the World Refugee Survey 2009,21 the five EAC states host 949,000 refugees; of them,
about 300,000 are citizens of East African states living as refugees in other EAC states.22
Some studies suggest that, in mid-2007, among non-citizens living elsewhere in ECOWAS there were at least 270,000 refugees in the West African region, with most of them fleeing civil wars in Liberia (120,000) and Sierra Leone (19,000).23 In Guinea, an estimated 15,800 refugees were living in the country, the majority from Liberia (UNHCR, 2011).
Identity card requirementsThe provision for the free movement of people requires a person to show a national identity card, a valid passport or any travel document, and an international health cer-tificate. Yet some immigration officials in member states appear to be unaware that community nationals holding these valid documents can enter their country freely. Many African migrants thus leave their home country without proper travel documents and enter the host country ir-regularly, even though if they carry the travel and health certificates they are entitled to, they can enter through regular channels.
6.6.3 Measures to relieve security concerns
African countries have undertaken some measures to overcome security-related challenges, primarily on their borders but also inside their territories.
Building common border postsIn COMESA, the one-stop border post initiative was launched in December 2009 on the border between Zam-bia and Zimbabwe at Chirundu—the first such post in Africa, and the most advanced. According to Trade Mark Southern Africa,24 before the new system the border post’s clearing times were between three and five days. Now clearance is done on the same day. An average of 480 trucks cross at Chirundu every day, saving 960–1,920 travel days per day. This translates, at a conservative estimate, to between US$ 288,000 and US$ 576,000 in saving every day. It is the second-busiest border post
on the North–South Corridor after Beitbridge, between Zimbabwe and South Africa.
In EAC, one-stop posts were set up on the border be-tween Kenya and Uganda at Malaba and at Rusumo in March 2010.25 They are important not only for Rwanda and Tanzania as well, but also for the Democratic Republic of Congo, Burundi and other neighbours. The EAC has begun an audit of regulations to guide how this type of post operates across the community. A sub-committee of the regional council of ministers is now scrutinizing the One-Stop-Border Posts Bill 2010 before handing in its recommendations for adoption.26 The bill will enable countries to align the laws of entities operating at the border and lead to simplified systems. If carried out, this proposal will harmonize customs-clearance routines on
73Chapter Six: Movement of People and the Right of Residence and Establishment
common borders, helping to cut back on processing time27 and greatly reduce the cost of doing business.28
Similar initiatives have begun on some borders of Ghana, Burkina Faso, Togo, and Mali. Two joint border posts are to be built along the Abidjan–Lagos corridor on the Nigeria-Benin border (Seme/Krake) and the Togo–Ghana border (Noepe/Aflao) under the aegis of ECOWAS.29 A joint border post has been built between Burkina Faso and Mali at Her-emakono, and another between Burkina Faso and Togo at Cinkane. A series of joint border posts are planned between Benin and Niger at Melanville,30 to be completed this year, between Togo and Benin at Sanveecondji/Hilacondji, and between Ghana and Burkina Faso at Paga.
In SADC, a one-stop border post has been built on the border between Zimbabwe and Mozambique at Forbes/Machipanda, on the Trans-Kalahari corridor. A single border facility for passenger transport between South Africa and Mozambique was completed in November 2010, after a similar facility for freight was opened earlier in the year. An informal survey, using satellite-tracking devices on trucks, showed that drivers from South Africa were able to cross into Mozambique, drive to the port of Maputo, unload and return to the border in little more than five hours. This is a huge improvement on the 10 hours it used to take, and has gone a long way to clearing up the congestion at Lebombo border post.31
Running joint border patrolsBorder posts and all checkpoints on international ECO-WAS highways are to be policed by customs and im-migration officials only. These posts are to be scrapped eventually.32 Border procedures are to be modernized by the use of passport-scanning machines.
Introducing electronic passportsA benefit of electronic passports is automated passenger clearance at border controls. In 2007 Nigeria began in-troducing such passports in ECOWAS.33 Ghana began in February 2010,34 and Botswana the following month.35 Cameroon intends to issue half a million electronic pass-ports in 2011–2014.36 The increasing threat of identity fraud requires stronger security features in national pass-ports, including biometric information to link a person to a passport.
Integrating refugees with host economiesUnder a partnership involving Nigeria, Liberia, Sierra Leone, the United Nations High Commission for Refu-gees (UNHCR) and ECOWAS, UNHCR has continued integrating some 7,000 refugees in Nigeria. The 2010 initiative, which focuses mainly on Liberians, is intended to help them to generate income and become part of the local economy.
6.7 Conclusions and recommendations
African regional organizations have taken steps to fa-cilitate short-term stays in member countries, but the establishment of large economic unions within which citizens can move and work freely remains a longer-term goal. Various articles in the REC protocols presuppose that every community citizen who is a migrant worker must either be gainfully employed in the formal sector of the member state before they qualify to apply for the right of residence or must have a business which has been formally registered in accordance with the national laws of the member state.
To facilitate free movement of labour, work permit require-ments need to be facilitated for Community citizens in diverse skills. In this regard, countries need to align their employment codes with REC protocols and ensure that the rights of migrant workers in host countries are protected. They need to harmonize laws that conflict with regional treaties, and to address the issue of right of residence and establishment of migrants.
Expanding the number of one-stop border posts should help to reinforce RECs’ efforts to open borders and reduce delays and the red tape at customs. Member states also need to expedite their supply of identity documents, as
74 Assessing Regional Integration in Africa (ARIA V): Towards an African Continental Free Trade Area
well as travel and health certificates to community citi-zens resident on their territories. The border information centres between Ghana and Togo, and the planned centre between Mali and Senegal, are a welcome development in this regard.
REC member states should also facilitate work and busi-ness permits for REC citizens to foster closer integration.
This is also important for promoting intra-community trade and investment, which will boost employment.
RECs should, as a matter of urgency, activate national protocol-monitoring committees and help to coordinate their activities with the secretariat of the REC. This should contribute to harmonizing regulations, implementation procedures and guidelines to boost free movement of people.
References
Adepoju, A. 2005. Migration in West Africa. Geneva: Policy Analysis and Research Programme of the Global Commission on International Migration.
Adetayo, L. 2011. “ECOWAS in search of better regional integration.” The Punch, August 20. http://punchng.com/Articl.aspx?datex=11/25/Send2Friend.aspx?datex=11/25/2010&theartic=Art201108200282546.
Boubakri, H. 2004. “Transit migration between Tuni-sia, Libya and Sub-Saharan Africa: study based on Greater Tunis.” Paper presented at the Regional Conference on “Migrants in transit countries: shar-ing responsibility for management and protection,” Istanbul, September 30–October 1.
BusinessDay Online. 2009. “Ghana’s plan to chase out Nigerians—classifies ECOWAS citizens as exper-trates.” October 7. http://www.nairaland.com/nigeria/topic-333847.0.html.
Davies, R, and J. Head. 1995. “The future of mine mi-grancy in the context of border trends in migration in Southern Africa.” Journal of Southern African Studies 21 (3): 439–50.
Deacon, B., K. Van Hoestenberghe, P. De Lombaerde, and M.C. Macovei. 2008. “Regional integration: decent work and labour and social policies in West and Southern Africa.” Working Paper W-2008/13. United Nations University Institute on Compara-tive Regional Integration Studies, Bruges, Belgium.
de Haas, H. 2008. “Irregular migration from West Africa to the Maghreb and the European Union: an over-view of recent trends.” ION Migration Research Series 32. http://www.iom.int/jahia/webdav/site/my-jahiasite/shared/shared/mainsite/published_docs/serial_publications/MRS-32_EN.pdf.
Drozdz, M., and O. Pliez. 2005. “Entre Libye et Soudan: La fermeture d’une piste transsaharienne.” Autrepart 36: 63–80.
EAC (East African Community). 2011. “EAC plans joint diplomatic missions.” Arusha, Tanzania. http://eastafricancommunity.blogspot.com.
Fergany, N. 2001. Aspects of labour migration and unem-ployment in the Arab region. Almishkat Centre for Research, Giza, Egypt. http://www.mafhoum.com/press4/116S25.pdf.
Lloyd, P.J. 2002. “Facilitating free movement of people in an Australia-US FTA.” Paper prepared for “The impact of an Australia US free trade agreement: foreign policy challenges and economic opportu-nities” conference held at the National Press Club, Canberra, August 29–30.
Macrosecnomics.com. 2011. “A guide to doing business in Nigeria.” http://www.macrosecnominees.com/DoingBusinessinNigeria.pdf.
75Chapter Six: Movement of People and the Right of Residence and Establishment
Maritz. 2011. “A single East African currency and what it means for business in the region.” http://www.howwemadeitinafrica.com/a-single-east-african-currency-and-what-it-means-for-business-in-the-region/7526/.
Mugoh, E. 2011. “How common market has changed East Africa’s trade climate.” East African Busi-ness Week, July 10. http://www.busiweek.com/11/the-eac-issues?start=18.
Muwanga, D. 2011. “Where will the common market be built?” East African Business Week, August 8. http://www.busiweek.com/11/the-eac-issues/eac-news/1474-where-will-the-common-market-be-built.
Odera Omolo, L. 2011. “EAC: fear of losing sovereignty by EAC member countries is what is derailing the creation of an East African political federation.” July 19. http://blog.jaluo.com/?p=21980.
OECD (Organisation for Economic Co-operation and Development). 2009. International migration and the financial crisis: understanding the links and shaping policy responses. Paris.
Oumar Ba, C., and A. Choplin. 2005. “Tenter l’aventure par la Mauritanie: migrations transsahariennes et recompositions urbaines.” Autrepart 36: 21–42.
Pritchett, L. 2010. “The cliff at the border.” In Equity and growth in a globalizing world, ed. R. Kanbur and M. Spence. Washington, DC: Commission on Growth and Development.
Ratha, D., S. Mohapatra, C. Özden, S. Plaza, W. Shaw, and A. Shimeles. 2011. Leveraging migration for Africa: Remittances, Skills, and Investments. Washington, DC: World Bank.
Roman, H. 2006. Transit migration in Egypt. Euro-Med-iterranean Consortium for Applied Research on International Migration, European University In-stitute, Florence, Italy.
UN (United Nations). 2010. International migration and development, report of the Secretary-General. http://www.gfmd.org/documents/65th-UNGA_Report-of-UN-Sec-Gen.pdf.
UNDESA (United Nations Population Division, Depart-ment of Economic and Social Affairs). 2002. “Inter-national migration 2002, wall chart.” New York.
———. 2006. “National trends in population, resources, environment and development: country profiles.” http://www.un.org/esa/population/publications/countryprofile/profile.htm.
UNDP (United Nations Development Programme). 2009. Human Development Report 2009 overcoming bar-riers: human mobility and development. New York.
UNHCR (United Nations High Commission for Refu-gees). 2011. “2011 regional operations profile: West Africa.” http://www.unhcr.org/cgi-bin/texis/vtx/page?page=49e483de6.
USAID (United States Agency for International Develop-ment) et al. 2010. “Draft report on regional transport and agricultural policy study.” West Africa Trade Hub, Accra, Ghana.
World Bank. 2011. The Migration and Remittance Factbook 2011. Washington, DC. http://sitere-sources.worldbank.org/INTPROSPECTS/Re-sources/334934-1199807908806/Burundi.pdf.
Notes 1 In Ghana, for example, the higher the education of the head of
household (and that of the parents of the head of household), the higher the probability that a household member has emigrated. A higher level of education makes it easier to gather and process
76 Assessing Regional Integration in Africa (ARIA V): Towards an African Continental Free Trade Area
the information necessary for international migration. This trend is also observed in Nigeria, where the probability of migration increases with education—at least up to a point (Ratha et al., 2011).
2 OHADA is a system of business laws and implementing institutions adopted by sixteen West and Central African nations. OHADA is the French acronym for “Organisation pour l’Harmonisation en Afrique du Droit des Affaires”, which translates into English as “Organisation for the Harmonization of Business Law in Africa”. It covers the following countries in West and Southern Africa: Benin, Guinea, Guinea Bissau, Burkina Faso, Democratic Republic of Congo, Côte d’Ivoire, Mali, Niger, Senegal and Togo.
3 OHADA is attempting to achieve labour law uniformity in Africa by linking African countries with a unified business code.
4 Occupations are those for which registration is usually required under member state law, and cover a wide range of professional and skilled activities.
5 Development Research Centre on Migration, Globalisation and Poverty (Migration DRC) (2007) “Global Migrant Origin Data-base”, University of Sussex, March 2007, http://www.migrationdrc.org/research/typesofmigration/global_migrant_origin_database.html.
6 Although all these individuals have been accorded the recogni-tion by their host governments as ECOWAS citizens, toleration or acceptance of their residence is largely predicated on the legal fact of them being refugees.
7 http://www.unhcr.org/cgi-bin/texis/vtx/page?page=49e483de6.8 Drozdz and Pliez (2005)9 “Draft Protocol on The Free Movement of Persons in the Southern
African Development Community (SADC)”; the latest document of 2005 is entitled “Protocol on The Facilitation of Movement of Persons within SADC”. The Change from “Free Movement” to “Facilitation” may imply that the SADC countries shifted their emphasis from targeting free movement of natural persons as the main objective to a lesser aim of facilitation of movement of natural persons.
10 http://www.sadc.int/index/browse/page/149.11 Construction, communication, transport, energy, tourism and
finance.12 Benin, Burkina Faso, Mali, Niger, Nigeria, Senegal and Togo have
established national monitoring committees.13 http://www.emansion.gov.lr/press.
php?news_id=1834&related=The%20Vice%20President.14 01/CEEAC/CCEG/X/0215 This category includes every person residing within 5 kilometres
on both sides of the border between two member states. “Borders” are required to possess a free movement card (issued by the local authorities) before crossing the border.
16 Foreign investors generally receive the same treatment as Maurita-nian investors, subject to the provisions of treaties and agreements concluded between the Government of Mauritania and other countries. Foreign investors have the same access as Mauritanians to courts of law. Nonetheless, the success of foreign investors often depends in large part on collaboration with local partners who understand the local market and government.
17 This creates an imbalance in the flow of labour in EAC.18 Burkina Faso, Gambia, Ghana, Guinea, Niger, Nigeria and Sierra
Leone.
19 Indeed many member states fail to provide travel documents of any sort to their citizens (Adepoju, 2005).
20 Benin retains a border dispute with Burkina Faso around the town of Koualou; location of Benin-Niger-Nigeria tripoint is unresolved; sovereignty dispute between Equatorial Guinea and Cameroon over an island at the mouth of the Ntem River; Malawi disputes with Tanzania over the boundary in Lake Nyasa (Lake Malawi) and the meandering Songwe River remain dormant; Mauritius and Seychelles claim the Chagos Islands; Mauritius claims French-administered Tromelin Island; Swaziland in 2006, resorted to ICJ to claim parts of Mpumalanga and KwaZulu-Natal from South Africa. Morocco claims sovereignty over two pieces of land in the Tindouf and Bechar areas of Algeria as well as sovereignty over Western Sahara.
21 http://www.refugees.org/resources/refugee-warehousing/archived-world-refugee-surveys/2009-world-refugee-survey.html
22 http://www.sidint.net/the-east-african-community-and-the-refugee-question.
23 Although all these individuals have been accorded the recogni-tion by their host governments as ECOWAS citizens, toleration or acceptance of their residence is largely predicated on the legal fact of them being refugees.
24 http://www.trademarksa.org/node/572925 http://www.eac.int/component/content/article/1-latest-news/405-
tanzania-rwanda-rusumo-osbp.html 26 The Kenya National Highway Authority said it required contrac-
tors to erect such facilities at Lunga Lunga, Malaba, Busia, Taveta, Isebania and Busia as part of the East Africa Trade and Transport Facilitation project.
27 Prior to the establishment of the facility, truckers required two days to clear with customs officials on the common border but this has since been slashed to an average two hours or less owing to the joint handling of documentation.
28 http://allafrica.com/stories/201109070062.html.29 http://news.myjoyonline.com/news/201102/60869.asp.30 Contracts for the construction of three joint border posts in the
ECOWAS region have also been signed.31 http://www.africagoodnews.com/pan-africa/regional-
integration/2321-single-border-facility-for-south-africa-mozam-bique.html.
32 To this effect, the Nigerian government ordered all checkpoints between Nigeria and Benin to be dismantled
33 http://allafrica.com/stories/201004190825.html.34 http://www.ghana.gov.gh/index.php?option=com_content&
view=article&id=975:biometric-passport-forms-ready-jan-25&catid=28:general-news&Itemid=16.
35 http://www.southerntimesafrica.com/article.php?title=Botswana_introduces_e-passport&id=3817, accessed 22 November 2011
36 http://www.secureidnews.com/2011/05/04/de-la-rue-plans-roll-out-of-500k-epassports-for-cameroon?tag=Border_Control.
CHAPTER
77
Movement of Goods and Services in Africa 7Against the backdrop of the global economic and financial crisis in the traditional developed
markets and the stalemate in WTO Doha round negotiations, regional trade integration has emerged as a crucial instrument for sustaining economic growth in Africa. Still, intra-
African trade remains far too low and Africa has continued losing its share of global trade—now about 3.2 per cent versus about 5 per cent in the mid-1960s.
This chapter compares trade policies and regimes of eight RECs, assesses intra-African trade by country and commodity, highlights the underlying factors for the low trade shares1 and looks at infrastructure and trade facilitation. In perhaps the most important section it identifies trade op-portunities for Africa by REC and by product, to move Africa from its heavy dependence on exports of raw materials.
Increasing intra-African trade and building African markets are necessary to serve as a launch pad for enhancing African competitiveness and its integration with the world economy.
7.1 Comparison of trade policies
Market sizes and resource bases are small in most African states, hence the need for regional in-tegration—to make them internationally competitive, achieve high economic growth and reduce poverty. Such integration enables countries to combine their efforts and resources so as to create large markets for dealing with the challenges that they cannot overcome alone.
Yet complicating the drive toward integration is that most African countries belong to more than one grouping, which often have overlapping—or worse, competing—mandates. Some have multiple memberships in groups that pursue different policies. Although the AU recognizes eight RECs2 as the building blocks of the AEC, Africa has 14 major regional economic groupings with wide membership overlaps3. These overlaps make it extremely hard to integrate markets more deeply through common trade policy instruments such as a common external tariff in customs unions (UNDP, 2011), because a country cannot be part of two customs unions applying two different common external tariffs. Yet of Africa’s 54 countries, only 10 are involved in only one REC (box 7.1).4
78 Assessing Regional Integration in Africa (ARIA V): Towards an African Continental Free Trade Area
7.1.1 Tariff liberalization and time-frames in the RECs’ FTAs
RECs’ progress towards getting their FTAs and customs unions up and running varies. COMESA, EAC, ECOWAS and SADC seem to have made more progress, having built FTAs. The first two have also launched customs unions. ECCAS and UMA have seen slow advances. CEN-SAD and IGAD have hardly moved.
COMESACOMESA launched an FTA in 2000, after 17 years of a liberalizing trade programme that began under the Pref-erential Trade Areas for Eastern and Southern African States. The COMESA FTA allows others to join when they are ready to reciprocate its terms. Unlike ECOWAS and
SADC, it does not provide for asymmetrical treatment be-tween least-developed countries and developing-country members (Nhara, 2006). Indeed, the FTA was grounded in comprehensive product coverage with no exclusions, after a long period of tariff reductions (based on principles of “open regionalism”).
COMESA aimed to reduce tariffs on intra-COMESA trade by 60 per cent in 1993, 70 per cent in 1994, 80 per cent in 1996, 90 per cent in 1998, and completely in 2000 (in October each year).Yet implementation rarely followed the plan (Oyejide and Njinkeu, 2001).
Box 7.1 Africa’s spaghetti bowl
Six African countries are members of one REC, 26 are members of two RECs and 20 are members of three RECs,
and one country belongs to four RECs.
All CEMAC countries are members of ECCAS, and some are also members of CEN-SAD.
Seven members of SADC belong to COMESA and four EAC countries are also in COMESA. EAC was already a
customs union when COMESA launched its customs union in 2009. (It is hoped that the SADC–COMESA–EAC
tripartite FTA, launched in 2008, will partly resolve this imbroglio.)
Four IGAD member states are COMESA member states—except for Somalia, which has observer status.
Some ECOWAS and UMA countries are members of CEN-SAD, too, a REC that is struggling to harmonize and
coordinate its trade agenda because its member states are pursuing similar programmes elsewhere.
SADC trade integration faces challenges from overlapping membership of several of its member states with
COMESA, EAC, SACU and ECCAS.
Some UMA countries—Libya, Morocco and Tunisia, for example—are members of the Pan-Arab Free Trade Area.
Morocco and Tunisia are founders of the Agadir Agreement for the Establishment of a Free Trade Zone.
For some countries, overlapping REC membership or belonging to more than one regional grouping undermines
binding commitments for different jurisdictions and policy environments whose mandates and objectives may not
be similar. Some Tanzanians, for instance, are concerned that the envisaged EAC political federation will affect
their close relationship with several SADC countries. (See, for example, Odera Omolo, 2011).
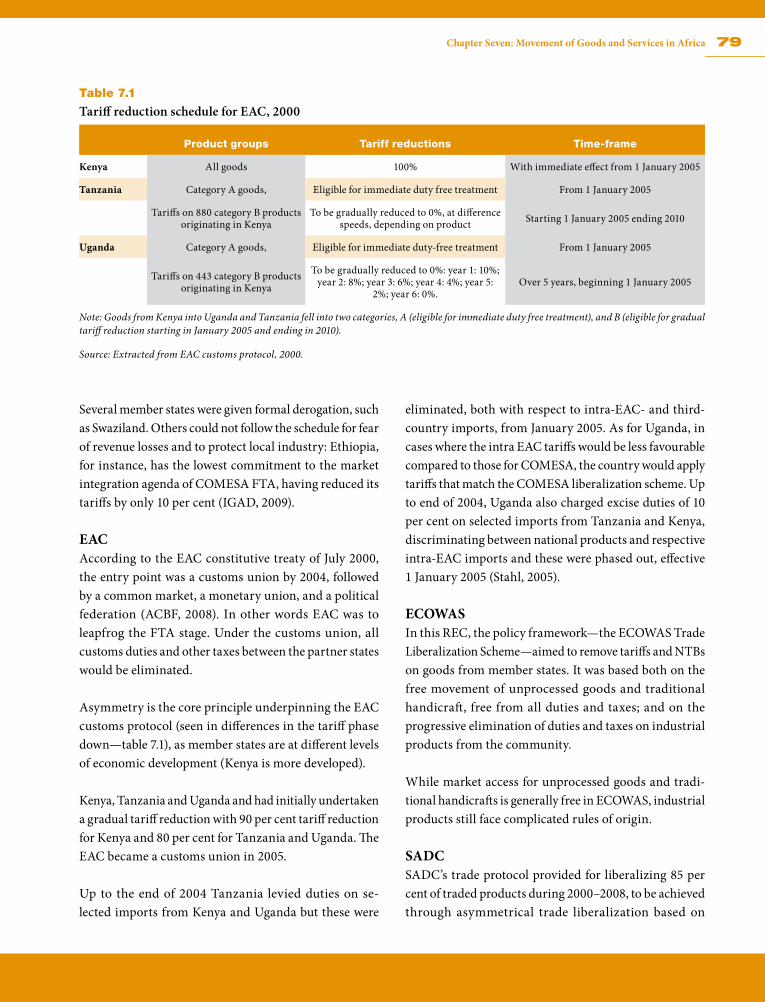
79Chapter Seven: Movement of Goods and Services in Africa
Several member states were given formal derogation, such as Swaziland. Others could not follow the schedule for fear of revenue losses and to protect local industry: Ethiopia, for instance, has the lowest commitment to the market integration agenda of COMESA FTA, having reduced its tariffs by only 10 per cent (IGAD, 2009).
EACAccording to the EAC constitutive treaty of July 2000, the entry point was a customs union by 2004, followed by a common market, a monetary union, and a political federation (ACBF, 2008). In other words EAC was to leapfrog the FTA stage. Under the customs union, all customs duties and other taxes between the partner states would be eliminated.
Asymmetry is the core principle underpinning the EAC customs protocol (seen in differences in the tariff phase down—table 7.1), as member states are at different levels of economic development (Kenya is more developed).
Kenya, Tanzania and Uganda and had initially undertaken a gradual tariff reduction with 90 per cent tariff reduction for Kenya and 80 per cent for Tanzania and Uganda. The EAC became a customs union in 2005.
Up to the end of 2004 Tanzania levied duties on se-lected imports from Kenya and Uganda but these were
eliminated, both with respect to intra-EAC- and third-country imports, from January 2005. As for Uganda, in cases where the intra EAC tariffs would be less favourable compared to those for COMESA, the country would apply tariffs that match the COMESA liberalization scheme. Up to end of 2004, Uganda also charged excise duties of 10 per cent on selected imports from Tanzania and Kenya, discriminating between national products and respective intra-EAC imports and these were phased out, effective 1 January 2005 (Stahl, 2005).
ECOWASIn this REC, the policy framework—the ECOWAS Trade Liberalization Scheme—aimed to remove tariffs and NTBs on goods from member states. It was based both on the free movement of unprocessed goods and traditional handicraft, free from all duties and taxes; and on the progressive elimination of duties and taxes on industrial products from the community.
While market access for unprocessed goods and tradi-tional handicrafts is generally free in ECOWAS, industrial products still face complicated rules of origin.
SADCSADC’s trade protocol provided for liberalizing 85 per cent of traded products during 2000–2008, to be achieved through asymmetrical trade liberalization based on
Table 7.1
Tariff reduction schedule for EAC, 2000
Product groups Tariff reductions Time-frame
Kenya All goods 100% With immediate effect from 1 January 2005
Tanzania Category A goods, Eligible for immediate duty free treatment From 1 January 2005
Tariffs on 880 category B products originating in Kenya
To be gradually reduced to 0%, at difference speeds, depending on product Starting 1 January 2005 ending 2010
Uganda Category A goods, Eligible for immediate duty-free treatment From 1 January 2005
Tariffs on 443 category B products originating in Kenya
To be gradually reduced to 0%: year 1: 10%; year 2: 8%; year 3: 6%; year 4: 4%; year 5:
2%; year 6: 0%.Over 5 years, beginning 1 January 2005
Note: Goods from Kenya into Uganda and Tanzania fell into two categories, A (eligible for immediate duty free treatment), and B (eligible for gradual tariff reduction starting in January 2005 and ending in 2010).
Source: Extracted from EAC customs protocol, 2000.
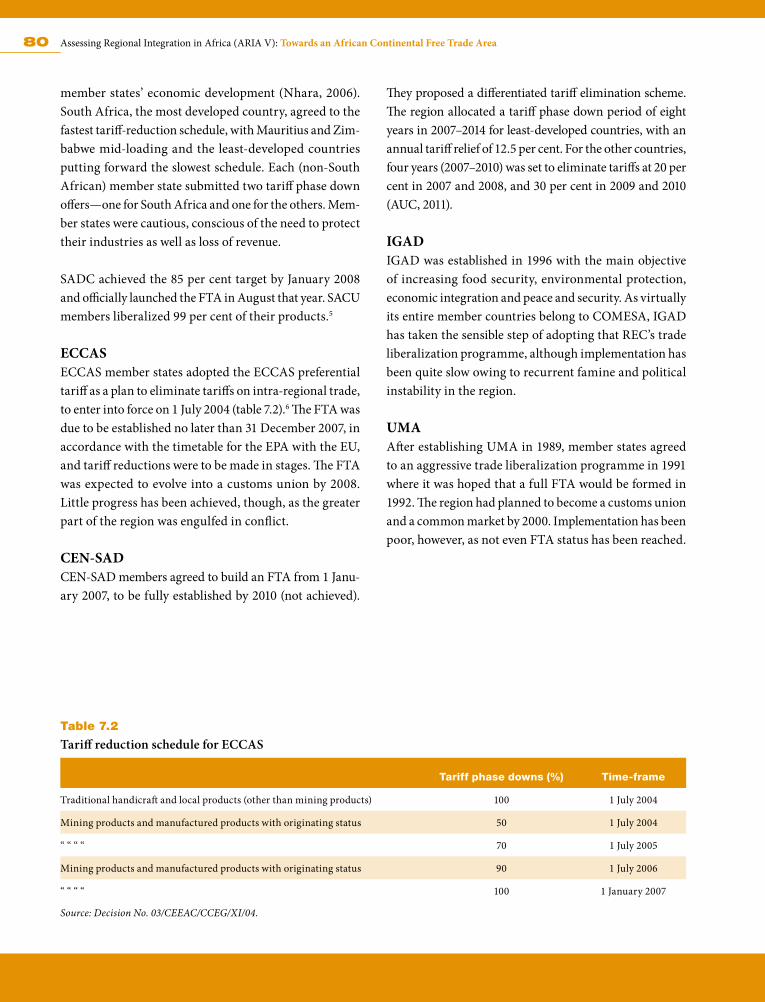
80 Assessing Regional Integration in Africa (ARIA V): Towards an African Continental Free Trade Area
member states’ economic development (Nhara, 2006). South Africa, the most developed country, agreed to the fastest tariff-reduction schedule, with Mauritius and Zim-babwe mid-loading and the least-developed countries putting forward the slowest schedule. Each (non-South African) member state submitted two tariff phase down offers—one for South Africa and one for the others. Mem-ber states were cautious, conscious of the need to protect their industries as well as loss of revenue.
SADC achieved the 85 per cent target by January 2008 and officially launched the FTA in August that year. SACU members liberalized 99 per cent of their products.5
ECCASECCAS member states adopted the ECCAS preferential tariff as a plan to eliminate tariffs on intra-regional trade, to enter into force on 1 July 2004 (table 7.2).6 The FTA was due to be established no later than 31 December 2007, in accordance with the timetable for the EPA with the EU, and tariff reductions were to be made in stages. The FTA was expected to evolve into a customs union by 2008. Little progress has been achieved, though, as the greater part of the region was engulfed in conflict.
CEN-SADCEN-SAD members agreed to build an FTA from 1 Janu-ary 2007, to be fully established by 2010 (not achieved).
They proposed a differentiated tariff elimination scheme. The region allocated a tariff phase down period of eight years in 2007–2014 for least-developed countries, with an annual tariff relief of 12.5 per cent. For the other countries, four years (2007–2010) was set to eliminate tariffs at 20 per cent in 2007 and 2008, and 30 per cent in 2009 and 2010 (AUC, 2011).
IGADIGAD was established in 1996 with the main objective of increasing food security, environmental protection, economic integration and peace and security. As virtually its entire member countries belong to COMESA, IGAD has taken the sensible step of adopting that REC’s trade liberalization programme, although implementation has been quite slow owing to recurrent famine and political instability in the region.
UMAAfter establishing UMA in 1989, member states agreed to an aggressive trade liberalization programme in 1991 where it was hoped that a full FTA would be formed in 1992. The region had planned to become a customs union and a common market by 2000. Implementation has been poor, however, as not even FTA status has been reached.
Table 7.2
Tariff reduction schedule for ECCAS
Tariff phase downs (%) Time-frame
Traditional handicraft and local products (other than mining products) 100 1 July 2004
Mining products and manufactured products with originating status 50 1 July 2004
“ “ “ “ 70 1 July 2005
Mining products and manufactured products with originating status 90 1 July 2006
“ “ “ “ 100 1 January 2007
Source: Decision No. 03/CEEAC/CCEG/XI/04.
81Chapter Seven: Movement of Goods and Services in Africa
7.1.2 NTBs
For a successful FTA, NTBs and other administrative ob-stacles need to be removed, as well as tariffs, because NTBs also impede the free movement of goods and people. In most RECs in fact, NTBs constitute the principal barriers to intra-regional trade, and UNECA (2008) highlighted that they are a growing concern—including rent-seeking customs officials, police roadblocks and harassment by immigration officials. NTBs have an extensive scope as they impede intra-regional trade and serve the cause of protectionism (UNECA, 2008). They also reflect the slow progress of regional integration agreements. Unattended, NTBs will curtail the benefits of greater market openness. According to Alaba (2006), NTBs constitute the greatest hindrances to trade integration.7
Article 49 of the COMESA Treaty states that each of the member states undertakes “to remove immediately on the entry into force of this Treaty, all the existing NTBs to the import into that member state of goods originating in the other member states and thereafter refrain from imposing any further restrictions or prohibitions”. The Council of Ministers of COMESA has already expressed concern that the COMESA FTA in particular and the trade regime in general have been undermined by some member states’ NTBs in the form of cumbersome import licensing and other administrative measures. It urged member states to comply with treaty provisions.
Article 13 of the EAC Customs Union Protocol states that “each of the Partner States agrees to remove, with
immediate effect, all the existing NTBs to the importation into their respective territories of goods originating in the other Partner States and, thereafter, not to impose any new NTBs”. Like COMESA, EAC has developed a mechanism for identifying and monitoring the removal of NTBs.
The SADC trade protocol committed its members to eliminate all NTBs and not to institute any new ones once the protocol came into effect.
COMESA, EAC and SADC have developed a common mechanism to develop a computerized online reporting and monitoring system in gradually removing NTBs. NTBs can be reported on a website8 that contains all the information about the member states and the NTBs in-curred there. RECs have also created focal points where the business community can report the NTBs they face. ECOWAS, ECCAS, IGAD and CEN-SAD—more affected by NTBs—have yet to establish such a system.
Article 41 of the ECOWAS Revised Treaty notes that mem-ber states “undertake to reduce gradually and to remove over a maximum period of four years after the launching of the trade liberalization scheme all the existing quotas, quantitative or like restrictions or prohibitions which apply to the import into that state of goods originating in the other member states and thereafter refrain from imposing any further restrictions or prohibitions”. Yet more than half the ECOWAS states have used NTBs as an instrument of trade control.
7.1.3 Rules of origin
Rules of origin9 are used to distinguish goods, originat-ing from an FTA, which should be accorded preferential treatment. They are the backbone of an FTA as only goods that satisfy these rules are granted duty-free access. Rules of origin can either facilitate trade and avoid trade deflec-tion or hinder trade. For a CFTA the main challenge is that most RECs use their own, differing, rules of origin, as now reviewed.
The CEMAC agreement of 1994 requires domestic inputs to account for 40 per cent of the value of total inputs, rising to 50 per cent in 2003 and 60 per cent in 2008. In addi-tion, industrial products should have local value added of at least 30 per cent of the factory price, rising to 40 per cent in 2003 and 50 per cent in 2008 (Abdoulahi, 2005).
The COMESA rules of origin require goods imported from member states to satisfy one of the following five criteria: be wholly produced in a member state; import
82 Assessing Regional Integration in Africa (ARIA V): Towards an African Continental Free Trade Area
material content of not more than 60 per cent of ex-factory value; have local value added of at least 35 per cent of total cost; be designated as particularly important to economic development and contain no less than 25 per cent local value added; or have undergone substantial transforma-tion in production, i.e. be reclassified, after production, under a new tariff heading.
For EAC, the criteria for goods to enjoy preferential treat-ment are set out in Article 14 of the EAC Customs Proto-col. In fact EAC adopted COMESA’s rules of origin with minor alterations. Goods must be wholly produced; have minimum value addition of not less than 35 per cent; imported raw materials used should not be more than 60 per cent; and there must be a change in tariff heading. The region agreed that value added would be 30 per cent.
ECCAS Article 30 and annex A7.1 states that for goods to qualify for duty free treatment in the ECCAS region, they have to be wholly produced; have CIF value of imported materials of less than 60 per cent; and value added during production of at least 35 per cent.
The ECOWAS Protocol of January 200310 states the follow-ing criteria for goods to be eligible for preferential treat-ment: goods wholly produced in member states; products not wholly produced that have undergone substantial processing or work which may be measured by changes in tariff position; industrial goods produced using foreign raw materials which have received a value added of at least 30 per cent of the ex-factory price of a finished product before tax. ECOWAS and UEMOA have adopted the same criteria. ECOWAS has agreed to adopt new rules of origin with UEMOA where goods would be wholly produced
locally: there must be a change of tariff heading and the use of value-added criteria. However, the two organiza-tions have different value-added levels—ECOWAS 35 per cent and UEMOA 40 per cent.
The original SADC rules of origin under the SADC trade protocol reflected those of a developing-country pref-erential trade area11. They were later amended, a move shaped by the asymmetry in tariff reduction schedules among member states. Member states had demanded that they be more restrictive and product-specific, to increase protection to their domestic markets.
The new SADC rules are indeed product specific and therefore complicated. Goods from the region imported into SADC member states should be wholly produced or have an import content of 53–65 per cent. If products are not wholly produced within the grouping there must be sufficient transformation. Non-originating materials may be used in the manufacture of a product as long as their value does not exceed 10 per cent of the product’s factory price. These rules are particularly restrictive for textiles as they have a combination of single- and double-stage transformation. These rules could be a barrier to both regional trade and international competitiveness as they will be costly to monitor and enforce.
In UMA, rules of origin require commodities said to originate there to meet one of the following criteria: wholly produced; contain at least 40 per cent of local value-added (20 per cent in the case of goods manufactured in an as-sembly plant) or at least 60 per cent of local raw materials; or to have undergone substantial transformation in value added in a member state.
7.1.4 Safeguards
WTO member states use safeguard measures when fac-ing the adverse economic effects of unfair trade practices and trade liberalization. The RECs therefore have their own clauses in cooperating agreements that call for trade remedies in case of harm from unfair trade.
For example, Article 61 (1) of the COMESA Treaty states that in the event of serious disturbances in the economy
of a member state following application of the provisions of the protocol, a member state shall take the necessary safeguard measures, to remain in force for one year. They may be extended.
EAC allows anti-dumping and compensatory measures as well as safeguards to cover material damage to the industry and economy of the importing member state.
83Chapter Seven: Movement of Goods and Services in Africa
Article 31 of the ECCAS Treaty compels a member state suffering from a trade imbalance to submit a report to the Secretary General; Article 34 allows member states to impose restrictions after balance-of-payments difficulties and to protect infant or strategic industries.
Article 49 of the ECOWAS Revised Treaty states that in the event of serious disturbances, the member state shall take the necessary safeguard measures.
Article 20 of the SADC trade protocol states that safe-guards can only be applied where imports are causing or threatening to cause serious injury to domestic industry; Article 21 notes that members may suspend obligations to promote infant industries.
7.1.5 Areas of convergence and divergence
The COMESA FTA had comprehensive product coverage compared with SADC, and no exclusions. The SADC FTA excluded a few sectors from liberalization, includ-ing narcotics; precious and strategic metals such as gold, silver and platinum; second-hand goods; and some other products for environmental reasons (Nhara, 2006).
Unlike more formal FTAs with a common tariff-reduction schedule, SADC allowed each country to submit indi-vidual offers on tariff reductions. For example, Mauritius agreed to allow 65 per cent of imports to enter its economy duty free in 2000 while Tanzania offered only 9 per cent that year, and tariff removal was to be staggered—88 per cent by 2008 and 100 in 2012 (Abdoulahi, 2005).
None of the RECs except for COMESA, EAC and ECO-WAS seems to have a compensation mechanism for the revenue losses that member states would incur when tariffs on products derived from within the community are removed.
Most RECs are bringing forward programmes that aim to eliminate tariff barriers, although with different time-frames. (UMA had the most ambitious—creating a free trade zone in just a year—but this remained an ambition
that was not achieved) CEN-SAD, EAC and ECCAS are moderately quick, and COMESA and SADC a bit more cautious.
All the RECs seem to be striving to simplify and harmo-nize rules of origin among their member states, although each REC uses its own rules to grant products qualifying status for preferential treatment, underlining the lack of harmonized instruments governing trade and market integration (UNECA, 2006). The AU (2010) stresses that this clearly discourages inter-REC trade as exporters need to adjust their production process and administrative rules to meet different sets of rules.
Further, while most RECs use origin requirements based on minimum local value addition or the maximum im-ported input to the total product value, specific levels vary. Some of the RECs even use a change in tariff heading (others do not).
Thus continent-wide convergent and harmonized rules of origin, that are balanced and adequate, could be instru-mental in expanding intra-African trade. For the CFTA, the rules of origin should be simple and developmental—to enhance intra-African trade.
7.2 Assessing intra-African trade by country
To analyse intra-African trade patterns, it is necessary to briefly unpack trends of each country’s exports to and imports from Africa. Table 7.3 indicates that despite the low level of aggregate intra-African trade, intra-regional
trade is important to some individual countries. Djibouti and Togo export more than half of their exports to Africa (79 per cent and 62 per cent) while 10 countries12 export more than 30 per cent of their total exports to Africa. In
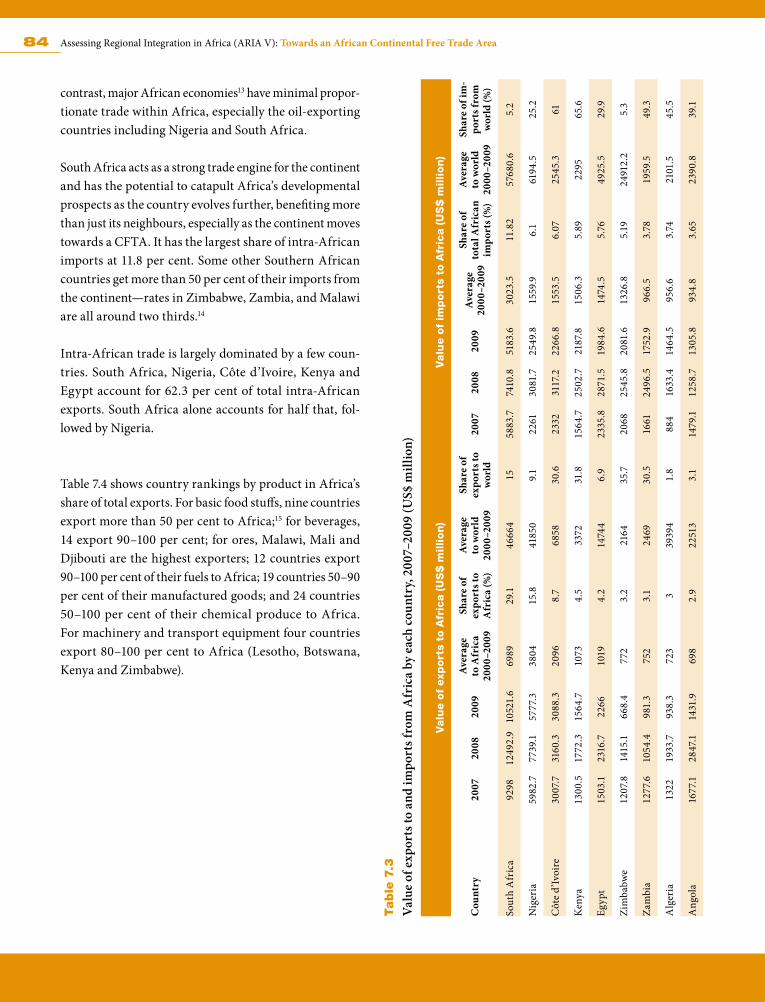
84 Assessing Regional Integration in Africa (ARIA V): Towards an African Continental Free Trade Area
Table
7.3
Val
ue o
f exp
orts
to a
nd im
port
s fro
m A
fric
a by
eac
h co
untr
y, 2
007–
2009
(US$
mill
ion)
Valu
e o
f exp
ort
s to
Afr
ica (
US
$ m
illion
)V
alu
e o
f im
port
s to
Afr
ica (
US
$ m
illion
)
Cou
ntry
2007
2008
2009
Ave
rage
to
Afr
ica
2000
–200
9
Shar
e of
ex
port
s to
Afr
ica
(%)
Ave
rage
to
wor
ld
2000
–200
9
Shar
e of
ex
port
s to
wor
ld20
0720
0820
09A
vera
ge
2000
–200
9
Shar
e of
to
tal A
fric
an
impo
rts (
%)
Ave
rage
to
wor
ld
2000
–200
9
Shar
e of
im-
port
s fro
m
wor
ld (%
)
Sout
h A
fric
a92
9812
492.
910
521.
669
8929
.146
664
1558
83.7
7410
.851
83.6
3023
.511
.82
5768
0.6
5.2
Nig
eria
5982
.777
39.1
5777
.338
0415
.841
850
9.1
2261
3081
.725
49.8
1559
.96.
161
94.5
25.2
Côt
e d’
Ivoi
re30
07.7
3160
.330
88.3
2096
8.7
6858
30.6
2332
3117
.222
66.8
1553
.56.
0725
45.3
61
Ken
ya13
00.5
1772
.315
64.7
1073
4.5
3372
31.8
1564
.725
02.7
2187
.815
06.3
5.89
2295
65.6
Egyp
t15
03.1
2316
.722
6610
194.
214
744
6.9
2335
.828
71.5
1984
.614
74.5
5.76
4925
.529
.9
Zim
babw
e12
07.8
1415
.166
8.4
772
3.2
2164
35.7
2068
2545
.820
81.6
1326
.85.
1924
912.
25.
3
Zam
bia
1277
.610
54.4
981.
375
23.
124
6930
.516
6124
96.5
1752
.996
6.5
3.78
1959
.549
.3
Alg
eria
1322
1933
.793
8.3
723
339
394
1.8
884
1633
.414
64.5
956.
63.
7421
01.5
45.5
Ang
ola
1677
.128
47.1
1431
.969
82.
922
513
3.1
1479
.112
58.7
1305
.893
4.8
3.65
2390
.839
.1
contrast, major African economies13 have minimal propor-tionate trade within Africa, especially the oil-exporting countries including Nigeria and South Africa.
South Africa acts as a strong trade engine for the continent and has the potential to catapult Africa’s developmental prospects as the country evolves further, benefiting more than just its neighbours, especially as the continent moves towards a CFTA. It has the largest share of intra-African imports at 11.8 per cent. Some other Southern African countries get more than 50 per cent of their imports from the continent—rates in Zimbabwe, Zambia, and Malawi are all around two thirds.14
Intra-African trade is largely dominated by a few coun-tries. South Africa, Nigeria, Côte d’Ivoire, Kenya and Egypt account for 62.3 per cent of total intra-African exports. South Africa alone accounts for half that, fol-lowed by Nigeria.
Table 7.4 shows country rankings by product in Africa’s share of total exports. For basic food stuffs, nine countries export more than 50 per cent to Africa;15 for beverages, 14 export 90–100 per cent; for ores, Malawi, Mali and Djibouti are the highest exporters; 12 countries export 90–100 per cent of their fuels to Africa; 19 countries 50–90 per cent of their manufactured goods; and 24 countries 50–100 per cent of their chemical produce to Africa. For machinery and transport equipment four countries export 80–100 per cent to Africa (Lesotho, Botswana, Kenya and Zimbabwe).
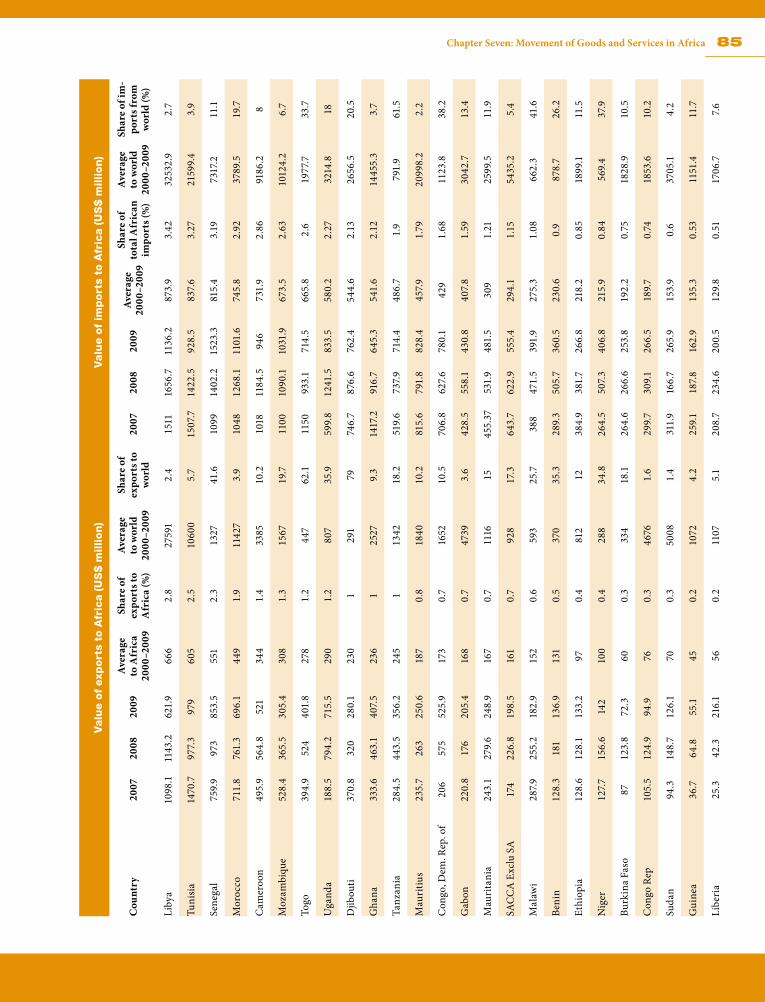
85Chapter Seven: Movement of Goods and Services in Africa
Valu
e o
f exp
ort
s to
Afr
ica (
US
$ m
illion
)V
alu
e o
f im
port
s to
Afr
ica (
US
$ m
illion
)
Cou
ntry
2007
2008
2009
Ave
rage
to
Afr
ica
2000
–200
9
Shar
e of
ex
port
s to
Afr
ica
(%)
Ave
rage
to
wor
ld
2000
–200
9
Shar
e of
ex
port
s to
wor
ld20
0720
0820
09A
vera
ge
2000
–200
9
Shar
e of
to
tal A
fric
an
impo
rts (
%)
Ave
rage
to
wor
ld
2000
–200
9
Shar
e of
im-
port
s fro
m
wor
ld (%
)
Liby
a10
98.1
1143
.262
1.9
666
2.8
2759
12.
415
1116
56.7
1136
.287
3.9
3.42
3253
2.9
2.7
Tuni
sia
1470
.797
7.3
979
605
2.5
1060
05.
715
07.7
1422
.592
8.5
837.
63.
2721
599.
43.
9
Sene
gal
759.
997
385
3.5
551
2.3
1327
41.6
1099
1402
.215
23.3
815.
43.
1973
17.2
11.1
Mor
occo
711.
876
1.3
696.
144
91.
911
427
3.9
1048
1268
.111
01.6
745.
82.
9237
89.5
19.7
Cam
eroo
n49
5.9
564.
852
134
41.
433
8510
.210
1811
84.5
946
731.
92.
8691
86.2
8
Moz
ambi
que
528.
436
5.5
305.
430
81.
315
6719
.711
0010
90.1
1031
.967
3.5
2.63
1012
4.2
6.7
Togo
394.
952
440
1.8
278
1.2
447
62.1
1150
933.
171
4.5
665.
82.
619
77.7
33.7
Uga
nda
188.
579
4.2
715.
529
01.
280
735
.959
9.8
1241
.583
3.5
580.
22.
2732
14.8
18
Djib
outi
370.
832
028
0.1
230
129
179
746.
787
6.6
762.
454
4.6
2.13
2656
.520
.5
Gha
na33
3.6
463.
140
7.5
236
125
279.
314
17.2
916.
764
5.3
541.
62.
1214
455.
33.
7
Tanz
ania
284.
544
3.5
356.
224
51
1342
18.2
519.
673
7.971
4.4
486.
71.
979
1.9
61.5
Mau
ritiu
s23
5.7
263
250.
618
70.
818
4010
.281
5.6
791.
882
8.4
457.9
1.79
2099
8.2
2.2
Con
go, D
em. R
ep. o
f20
657
552
5.9
173
0.7
1652
10.5
706.
862
7.6
780.
142
91.
6811
23.8
38.2
Gab
on22
0.8
176
205.
416
80.
747
393.
642
8.5
558.
143
0.8
407.
81.
5930
42.7
13.4
Mau
rita
nia
243.
127
9.6
248.
916
70.
711
1615
455.
3753
1.9
481.
530
91.
2125
99.5
11.9
SAC
CA
Exc
lu S
A17
422
6.8
198.
516
10.
792
817
.364
3.7
622.
955
5.4
294.
11.
1554
35.2
5.4
Mal
awi
287.9
255.
218
2.9
152
0.6
593
25.7
388
471.
539
1.9
275.
31.
0866
2.3
41.6
Beni
n12
8.3
181
136.
913
10.
537
035
.328
9.3
505.
736
0.5
230.
60.
987
8.7
26.2
Ethi
opia
128.
612
8.1
133.
297
0.4
812
1238
4.9
381.
726
6.8
218.
20.
8518
99.1
11.5
Nig
er12
7.715
6.6
142
100
0.4
288
34.8
264.
550
7.3
406.
821
5.9
0.84
569.
437
.9
Burk
ina
Faso
8712
3.8
72.3
600.
333
418
.126
4.6
266.
625
3.8
192.
20.
7518
28.9
10.5
Con
go R
ep10
5.5
124.
994
.976
0.3
4676
1.6
299.
730
9.1
266.
518
9.7
0.74
1853
.610
.2
Suda
n94
.314
8.7
126.
170
0.3
5008
1.4
311.
916
6.7
265.
915
3.9
0.6
3705
.14.
2
Gui
nea
36.7
64.8
55.1
450.
210
724.
225
9.1
187.
816
2.9
135.
30.
5311
51.4
11.7
Libe
ria
25.3
42.3
216.
156
0.2
1107
5.1
208.
723
4.6
200.
512
9.8
0.51
1706
.77.
6
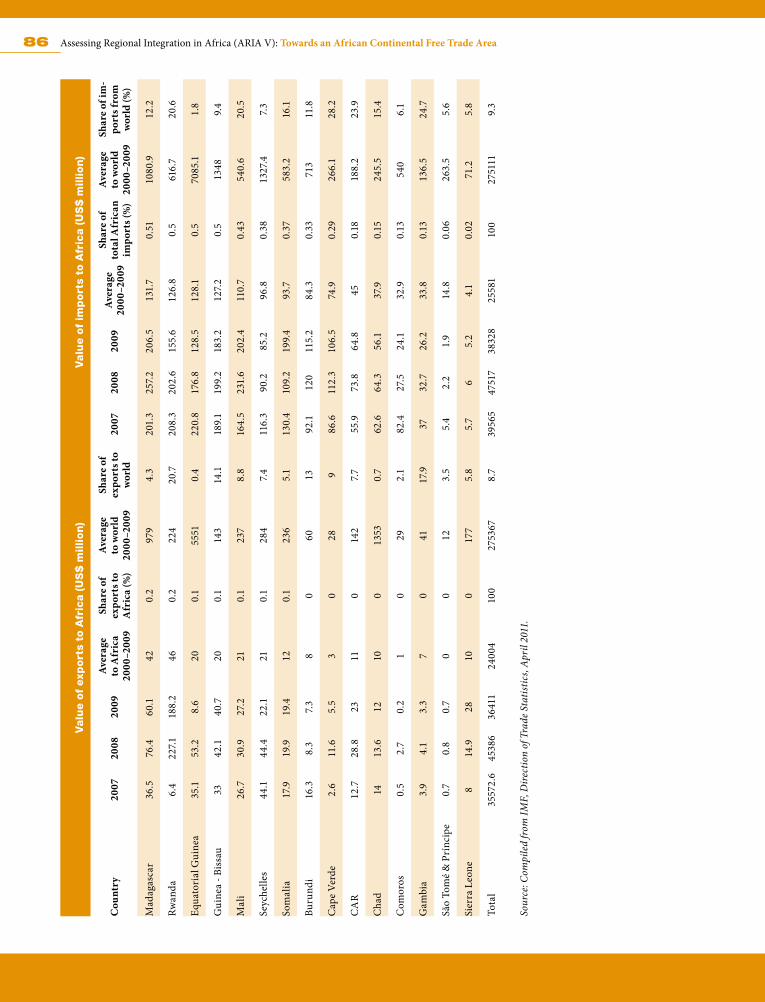
86 Assessing Regional Integration in Africa (ARIA V): Towards an African Continental Free Trade Area
Valu
e o
f exp
ort
s to
Afr
ica (
US
$ m
illion
)V
alu
e o
f im
port
s to
Afr
ica (
US
$ m
illion
)
Cou
ntry
2007
2008
2009
Ave
rage
to
Afr
ica
2000
–200
9
Shar
e of
ex
port
s to
Afr
ica
(%)
Ave
rage
to
wor
ld
2000
–200
9
Shar
e of
ex
port
s to
wor
ld20
0720
0820
09A
vera
ge
2000
–200
9
Shar
e of
to
tal A
fric
an
impo
rts (
%)
Ave
rage
to
wor
ld
2000
–200
9
Shar
e of
im-
port
s fro
m
wor
ld (%
)
Mad
agas
car
36.5
76.4
60.1
420.
297
94.
320
1.3
257.
220
6.5
131.
70.
5110
80.9
12.2
Rwan
da6.
422
7.118
8.2
460.
222
420
.720
8.3
202.
615
5.6
126.
80.
561
6.7
20.6
Equa
tori
al G
uine
a35
.153
.28.
620
0.1
5551
0.4
220.
817
6.8
128.
512
8.1
0.5
7085
.11.
8
Gui
nea
- Bis
sau
3342
.140
.720
0.1
143
14.1
189.
119
9.2
183.
212
7.2
0.5
1348
9.4
Mal
i26
.730
.927
.221
0.1
237
8.8
164.
523
1.6
202.
411
0.7
0.43
540.
620
.5
Seyc
helle
s44
.144
.422
.121
0.1
284
7.411
6.3
90.2
85.2
96.8
0.38
1327
.47.
3
Som
alia
17.9
19.9
19.4
120.
123
65.
113
0.4
109.
219
9.4
93.7
0.37
583.
216
.1
Buru
ndi
16.3
8.3
7.3
80
6013
92.1
120
115.
284
.30.
3371
311
.8
Cap
e Ve
rde
2.6
11.6
5.5
30
289
86.6
112.
310
6.5
74.9
0.29
266.
128
.2
CA
R12
.728
.823
110
142
7.755
.973
.864
.845
0.18
188.
223
.9
Cha
d14
13.6
1210
013
530.
762
.664
.356
.137
.90.
1524
5.5
15.4
Com
oros
0.5
2.7
0.2
10
292.
182
.427
.524
.132
.90.
1354
06.
1
Gam
bia
3.9
4.1
3.3
70
4117
.937
32.7
26.2
33.8
0.13
136.
524
.7
São
Tom
é &
Prí
ncip
e0.
70.
80.
70
012
3.5
5.4
2.2
1.9
14.8
0.06
263.
55.
6
Sier
ra L
eone
814
.928
100
177
5.8
5.7
65.
24.
10.
0271
.25.
8
Tota
l35
572.
645
386
3641
124
004
100
2753
678.
739
565
4751
738
328
2558
110
027
5111
9.3
Sour
ce: C
ompi
led
from
IMF,
Dir
ectio
n of
Tra
de S
tatis
tics,
Apr
il 20
11.
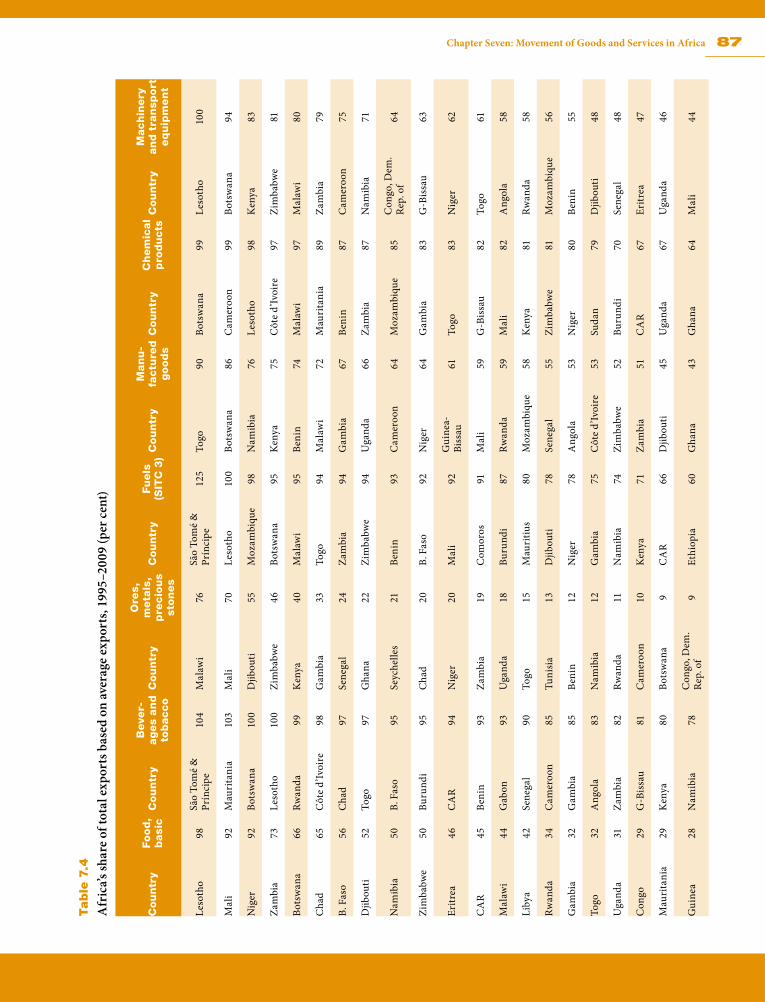
87Chapter Seven: Movement of Goods and Services in Africa
Table
7.4
Afr
ica’s
shar
e of
tota
l exp
orts
bas
ed o
n av
erag
e ex
port
s, 19
95–2
009
(per
cen
t)
Cou
ntr
yFood
, b
asi
cC
ou
ntr
yB
eve
r-ages
an
d
tob
acco
Cou
ntr
y
Ore
s,
meta
ls,
pre
cio
us
ston
es
Cou
ntr
yFu
els
(S
ITC
3)
Cou
ntr
yM
an
u-
factu
red
good
sC
ou
ntr
yC
hem
ical
pro
du
cts
Cou
ntr
yM
ach
inery
an
d t
ran
sport
eq
uip
men
t
Leso
tho
98Sã
o To
mé
&
Prín
cipe
104
Mal
awi
76Sã
o To
mé
&
Prín
cipe
125
Togo
90Bo
tsw
ana
99Le
soth
o10
0
Mal
i92
Mau
rita
nia
103
Mal
i70
Leso
tho
100
Bots
wan
a86
Cam
eroo
n99
Bots
wan
a94
Nig
er92
Bots
wan
a10
0D
jibou
ti55
Moz
ambi
que
98N
amib
ia76
Leso
tho
98K
enya
83
Zam
bia
73Le
soth
o10
0Zi
mba
bwe
46Bo
tsw
ana
95K
enya
75C
ôte
d’Iv
oire
97Zi
mba
bwe
81
Bots
wan
a66
Rwan
da99
Ken
ya40
Mal
awi
95Be
nin
74M
alaw
i97
Mal
awi
80
Cha
d65
Côt
e d’
Ivoi
re98
Gam
bia
33To
go94
Mal
awi
72M
auri
tani
a89
Zam
bia
79
B. F
aso
56C
had
97Se
nega
l24
Zam
bia
94G
ambi
a67
Beni
n87
Cam
eroo
n75
Djib
outi
52To
go97
Gha
na22
Zim
babw
e94
Uga
nda
66Za
mbi
a87
Nam
ibia
71
Nam
ibia
50B.
Fas
o95
Seyc
helle
s21
Beni
n93
Cam
eroo
n64
Moz
ambi
que
85C
ongo
, Dem
. Re
p. o
f64
Zim
babw
e50
Buru
ndi
95C
had
20B.
Fas
o92
Nig
er64
Gam
bia
83G
-Bis
sau
63
Eritr
ea46
CA
R94
Nig
er20
Mal
i92
Gui
nea-
Biss
au61
Togo
83N
iger
62
CA
R45
Beni
n93
Zam
bia
19C
omor
os91
Mal
i59
G-B
issa
u82
Togo
61
Mal
awi
44G
abon
93U
gand
a18
Buru
ndi
87Rw
anda
59M
ali
82A
ngol
a58
Liby
a42
Sene
gal
90To
go15
Mau
ritiu
s80
Moz
ambi
que
58K
enya
81Rw
anda
58
Rwan
da34
Cam
eroo
n85
Tuni
sia
13D
jibou
ti78
Sene
gal
55Zi
mba
bwe
81M
ozam
biqu
e56
Gam
bia
32G
ambi
a85
Beni
n12
Nig
er78
Ang
ola
53N
iger
80Be
nin
55
Togo
32A
ngol
a83
Nam
ibia
12G
ambi
a75
Côt
e d’
Ivoi
re53
Suda
n79
Djib
outi
48
Uga
nda
31Za
mbi
a82
Rwan
da11
Nam
ibia
74Zi
mba
bwe
52Bu
rund
i70
Sene
gal
48
Con
go29
G-B
issa
u81
Cam
eroo
n10
Ken
ya71
Zam
bia
51C
AR
67Er
itrea
47
Mau
rita
nia
29K
enya
80Bo
tsw
ana
9C
AR
66D
jibou
ti45
Uga
nda
67U
gand
a46
Gui
nea
28N
amib
ia78
Con
go, D
em.
Rep.
of
9Et
hiop
ia60
Gha
na43
Gha
na64
Mal
i44
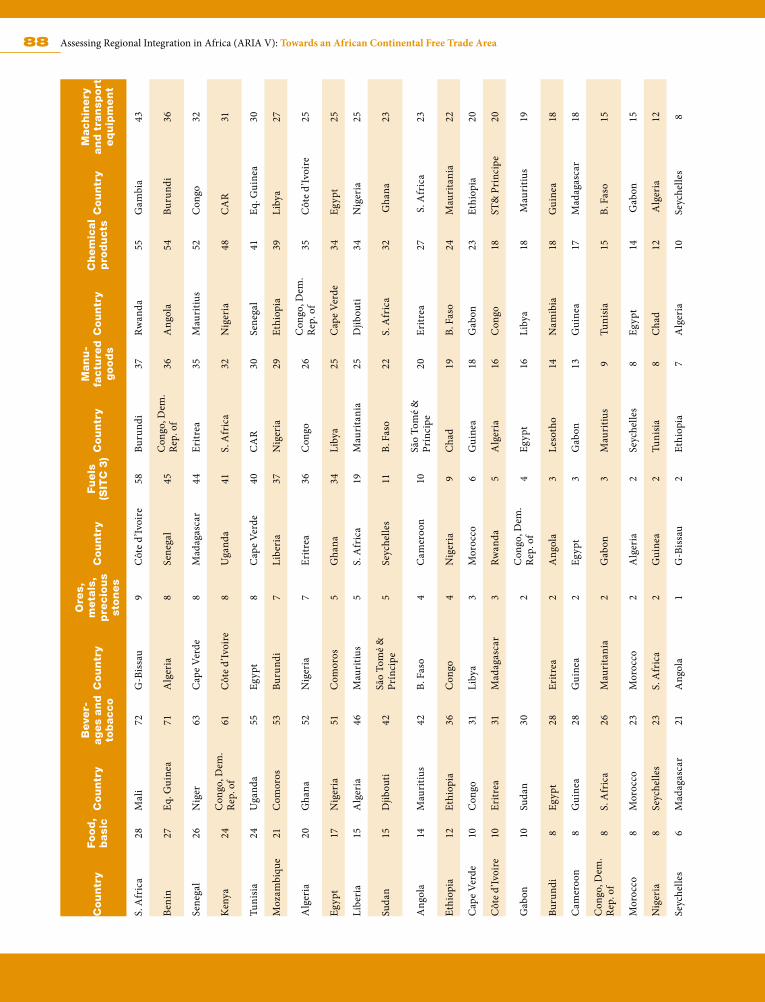
88 Assessing Regional Integration in Africa (ARIA V): Towards an African Continental Free Trade Area
Cou
ntr
yFood
, b
asi
cC
ou
ntr
yB
eve
r-ages
an
d
tob
acco
Cou
ntr
y
Ore
s,
meta
ls,
pre
cio
us
ston
es
Cou
ntr
yFu
els
(S
ITC
3)
Cou
ntr
yM
an
u-
factu
red
good
sC
ou
ntr
yC
hem
ical
pro
du
cts
Cou
ntr
yM
ach
inery
an
d t
ran
sport
eq
uip
men
t
S. A
fric
a28
Mal
i72
G-B
issa
u9
Côt
e d’
Ivoi
re58
Buru
ndi
37Rw
anda
55G
ambi
a43
Beni
n27
Eq. G
uine
a71
Alg
eria
8Se
nega
l45
Con
go, D
em.
Rep.
of
36A
ngol
a54
Buru
ndi
36
Sene
gal
26N
iger
63C
ape
Verd
e8
Mad
agas
car
44Er
itrea
35M
auri
tius
52C
ongo
32
Ken
ya24
Con
go, D
em.
Rep.
of
61C
ôte
d’Iv
oire
8U
gand
a41
S. A
fric
a32
Nig
eria
48C
AR
31
Tuni
sia
24U
gand
a55
Egyp
t8
Cap
e Ve
rde
40C
AR
30Se
nega
l41
Eq. G
uine
a30
Moz
ambi
que
21C
omor
os53
Buru
ndi
7Li
beri
a37
Nig
eria
29Et
hiop
ia39
Liby
a27
Alg
eria
20G
hana
52N
iger
ia7
Eritr
ea36
Con
go26
Con
go, D
em.
Rep.
of
35C
ôte
d’Iv
oire
25
Egyp
t17
Nig
eria
51C
omor
os5
Gha
na34
Liby
a25
Cap
e Ve
rde
34Eg
ypt
25
Libe
ria
15A
lger
ia46
Mau
ritiu
s5
S. A
fric
a19
Mau
rita
nia
25D
jibou
ti34
Nig
eria
25
Suda
n15
Djib
outi
42Sã
o To
mé
&
Prín
cipe
5Se
yche
lles
11B.
Fas
o22
S. A
fric
a32
Gha
na23
Ang
ola
14M
auri
tius
42B.
Fas
o4
Cam
eroo
n10
São
Tom
é &
Pr
ínci
pe20
Eritr
ea27
S. A
fric
a23
Ethi
opia
12Et
hiop
ia36
Con
go4
Nig
eria
9C
had
19B.
Fas
o24
Mau
rita
nia
22
Cap
e Ve
rde
10C
ongo
31Li
bya
3M
oroc
co6
Gui
nea
18G
abon
23Et
hiop
ia20
Côt
e d’
Ivoi
re10
Eritr
ea31
Mad
agas
car
3Rw
anda
5A
lger
ia16
Con
go18
ST&
Pri
ncip
e20
Gab
on10
Suda
n30
2C
ongo
, Dem
. Re
p. o
f4
Egyp
t16
Liby
a18
Mau
ritiu
s19
Buru
ndi
8Eg
ypt
28Er
itrea
2A
ngol
a3
Leso
tho
14N
amib
ia18
Gui
nea
18
Cam
eroo
n8
Gui
nea
28G
uine
a2
Egyp
t3
Gab
on13
Gui
nea
17M
adag
asca
r18
Con
go, D
em.
Rep.
of
8S.
Afr
ica
26M
auri
tani
a2
Gab
on3
Mau
ritiu
s9
Tuni
sia
15B.
Fas
o15
Mor
occo
8M
oroc
co23
Mor
occo
2A
lger
ia2
Seyc
helle
s8
Egyp
t14
Gab
on15
Nig
eria
8Se
yche
lles
23S.
Afr
ica
2G
uine
a2
Tuni
sia
8C
had
12 A
lger
ia12
Seyc
helle
s6
Mad
agas
car
21A
ngol
a1
G-B
issa
u2
Ethi
opia
7A
lger
ia10
Seyc
helle
s8
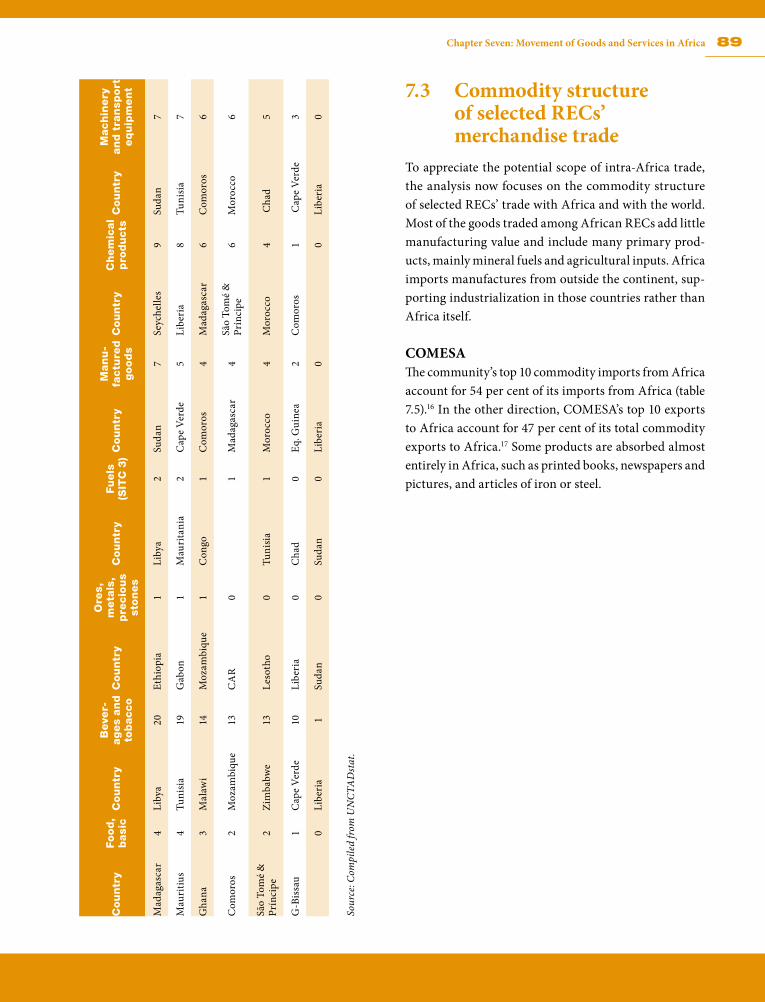
89Chapter Seven: Movement of Goods and Services in Africa
Cou
ntr
yFood
, b
asi
cC
ou
ntr
yB
eve
r-ages
an
d
tob
acco
Cou
ntr
y
Ore
s,
meta
ls,
pre
cio
us
ston
es
Cou
ntr
yFu
els
(S
ITC
3)
Cou
ntr
yM
an
u-
factu
red
good
sC
ou
ntr
yC
hem
ical
pro
du
cts
Cou
ntr
yM
ach
inery
an
d t
ran
sport
eq
uip
men
t
Mad
agas
car
4Li
bya
20Et
hiop
ia1
Liby
a2
Suda
n7
Seyc
helle
s9
Suda
n7
Mau
ritiu
s4
Tuni
sia
19G
abon
1M
auri
tani
a2
Cap
e Ve
rde
5Li
beri
a8
Tuni
sia
7
Gha
na3
Mal
awi
14M
ozam
biqu
e1
Con
go1
Com
oros
4M
adag
asca
r6
Com
oros
6
Com
oros
2M
ozam
biqu
e13
CA
R0
1M
adag
asca
r4
São
Tom
é &
Pr
ínci
pe6
Mor
occo
6
São
Tom
é &
Pr
ínci
pe2
Zim
babw
e13
Leso
tho
0Tu
nisi
a1
Mor
occo
4M
oroc
co4
Cha
d5
G-B
issa
u1
Cap
e Ve
rde
10Li
beri
a0
Cha
d0
Eq. G
uine
a2
Com
oros
1 C
ape
Verd
e3
0Li
beri
a1
Suda
n0
Suda
n0
Libe
ria
00
Libe
ria
0
Sour
ce: C
ompi
led
from
UN
CTA
Dst
at.
7.3 Commodity structure of selected RECs’ merchandise trade
To appreciate the potential scope of intra-Africa trade, the analysis now focuses on the commodity structure of selected RECs’ trade with Africa and with the world. Most of the goods traded among African RECs add little manufacturing value and include many primary prod-ucts, mainly mineral fuels and agricultural inputs. Africa imports manufactures from outside the continent, sup-porting industrialization in those countries rather than Africa itself.
COMESAThe community’s top 10 commodity imports from Africa account for 54 per cent of its imports from Africa (table 7.5).16 In the other direction, COMESA’s top 10 exports to Africa account for 47 per cent of its total commodity exports to Africa.17 Some products are absorbed almost entirely in Africa, such as printed books, newspapers and pictures, and articles of iron or steel.
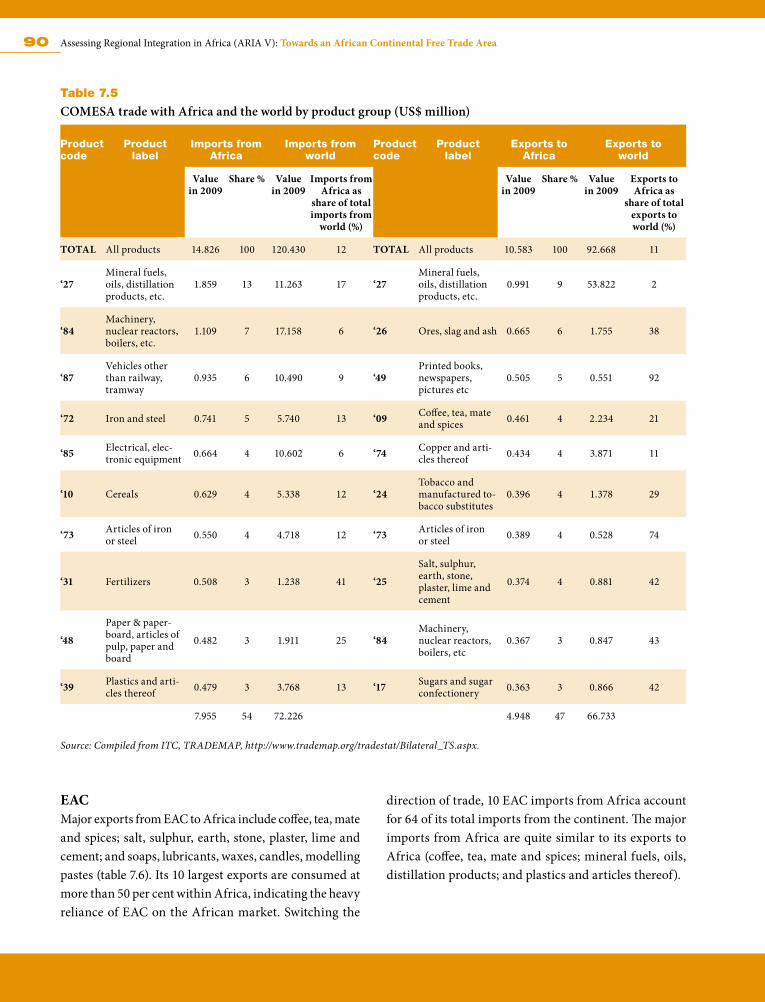
90 Assessing Regional Integration in Africa (ARIA V): Towards an African Continental Free Trade Area
Table 7.5
COMESA trade with Africa and the world by product group (US$ million)
Product code
Product label
Imports from Africa
Imports from world
Product code
Product label
Exports to Africa
Exports to world
Value in 2009
Share % Value in 2009
Imports from Africa as
share of total imports from
world (%)
Value in 2009
Share % Value in 2009
Exports to Africa as
share of total exports to world (%)
TOTAL All products 14.826 100 120.430 12 TOTAL All products 10.583 100 92.668 11
‘27Mineral fuels, oils, distillation products, etc.
1.859 13 11.263 17 ‘27Mineral fuels, oils, distillation products, etc.
0.991 9 53.822 2
‘84Machinery, nuclear reactors, boilers, etc.
1.109 7 17.158 6 ‘26 Ores, slag and ash 0.665 6 1.755 38
‘87Vehicles other than railway, tramway
0.935 6 10.490 9 ‘49Printed books, newspapers, pictures etc
0.505 5 0.551 92
‘72 Iron and steel 0.741 5 5.740 13 ‘09 Coffee, tea, mate and spices 0.461 4 2.234 21
‘85 Electrical, elec-tronic equipment 0.664 4 10.602 6 ‘74 Copper and arti-
cles thereof 0.434 4 3.871 11
‘10 Cereals 0.629 4 5.338 12 ‘24Tobacco and manufactured to-bacco substitutes
0.396 4 1.378 29
‘73 Articles of iron or steel 0.550 4 4.718 12 ‘73 Articles of iron
or steel 0.389 4 0.528 74
‘31 Fertilizers 0.508 3 1.238 41 ‘25
Salt, sulphur, earth, stone, plaster, lime and cement
0.374 4 0.881 42
‘48
Paper & paper-board, articles of pulp, paper and board
0.482 3 1.911 25 ‘84Machinery, nuclear reactors, boilers, etc
0.367 3 0.847 43
‘39 Plastics and arti-cles thereof 0.479 3 3.768 13 ‘17 Sugars and sugar
confectionery 0.363 3 0.866 42
7.955 54 72.226 4.948 47 66.733
Source: Compiled from ITC, TRADEMAP, http://www.trademap.org/tradestat/Bilateral_TS.aspx.
EACMajor exports from EAC to Africa include coffee, tea, mate and spices; salt, sulphur, earth, stone, plaster, lime and cement; and soaps, lubricants, waxes, candles, modelling pastes (table 7.6). Its 10 largest exports are consumed at more than 50 per cent within Africa, indicating the heavy reliance of EAC on the African market. Switching the
direction of trade, 10 EAC imports from Africa account for 64 of its total imports from the continent. The major imports from Africa are quite similar to its exports to Africa (coffee, tea, mate and spices; mineral fuels, oils, distillation products; and plastics and articles thereof).
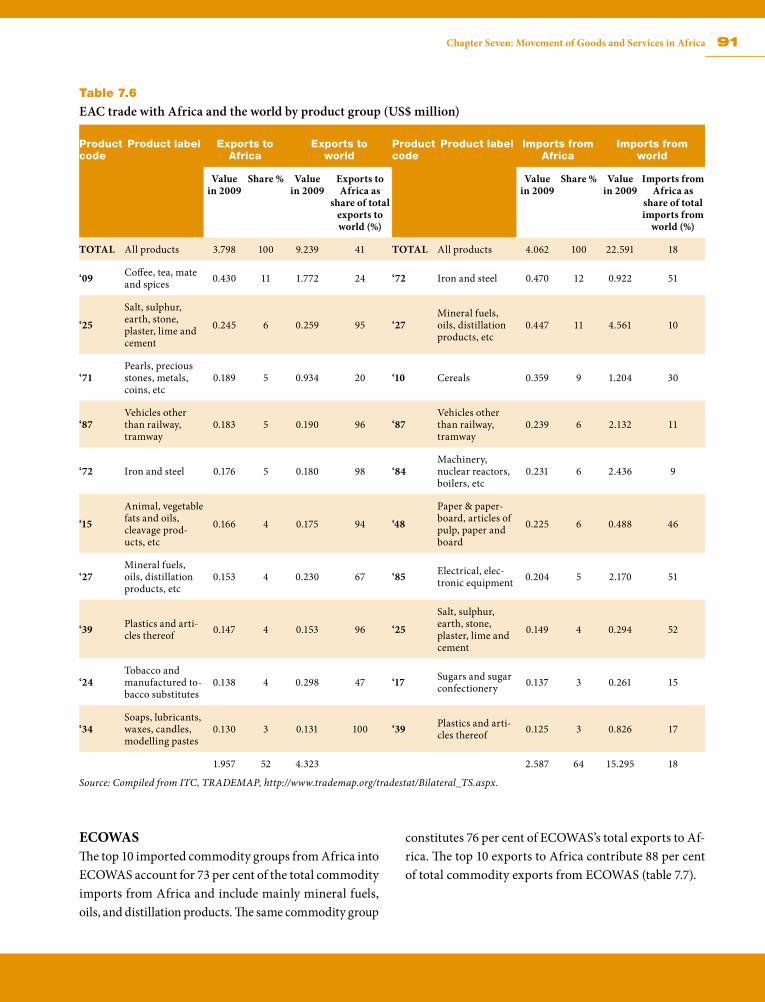
91Chapter Seven: Movement of Goods and Services in Africa
Table 7.6
EAC trade with Africa and the world by product group (US$ million)
Product code
Product label Exports to Africa
Exports to world
Product code
Product label Imports from Africa
Imports from world
Value in 2009
Share % Value in 2009
Exports to Africa as
share of total exports to world (%)
Value in 2009
Share % Value in 2009
Imports from Africa as
share of total imports from
world (%)
TOTAL All products 3.798 100 9.239 41 TOTAL All products 4.062 100 22.591 18
‘09 Coffee, tea, mate and spices 0.430 11 1.772 24 ‘72 Iron and steel 0.470 12 0.922 51
‘25
Salt, sulphur, earth, stone, plaster, lime and cement
0.245 6 0.259 95 ‘27Mineral fuels, oils, distillation products, etc
0.447 11 4.561 10
‘71Pearls, precious stones, metals, coins, etc
0.189 5 0.934 20 ‘10 Cereals 0.359 9 1.204 30
‘87Vehicles other than railway, tramway
0.183 5 0.190 96 ‘87Vehicles other than railway, tramway
0.239 6 2.132 11
‘72 Iron and steel 0.176 5 0.180 98 ‘84Machinery, nuclear reactors, boilers, etc
0.231 6 2.436 9
‘15
Animal, vegetable fats and oils, cleavage prod-ucts, etc
0.166 4 0.175 94 ‘48
Paper & paper-board, articles of pulp, paper and board
0.225 6 0.488 46
‘27Mineral fuels, oils, distillation products, etc
0.153 4 0.230 67 ‘85 Electrical, elec-tronic equipment 0.204 5 2.170 51
‘39 Plastics and arti-cles thereof 0.147 4 0.153 96 ‘25
Salt, sulphur, earth, stone, plaster, lime and cement
0.149 4 0.294 52
‘24Tobacco and manufactured to-bacco substitutes
0.138 4 0.298 47 ‘17 Sugars and sugar confectionery 0.137 3 0.261 15
‘34Soaps, lubricants, waxes, candles, modelling pastes
0.130 3 0.131 100 ‘39 Plastics and arti-cles thereof 0.125 3 0.826 17
1.957 52 4.323 2.587 64 15.295 18
Source: Compiled from ITC, TRADEMAP, http://www.trademap.org/tradestat/Bilateral_TS.aspx.
ECOWASThe top 10 imported commodity groups from Africa into ECOWAS account for 73 per cent of the total commodity imports from Africa and include mainly mineral fuels, oils, and distillation products. The same commodity group
constitutes 76 per cent of ECOWAS’s total exports to Af-rica. The top 10 exports to Africa contribute 88 per cent of total commodity exports from ECOWAS (table 7.7).
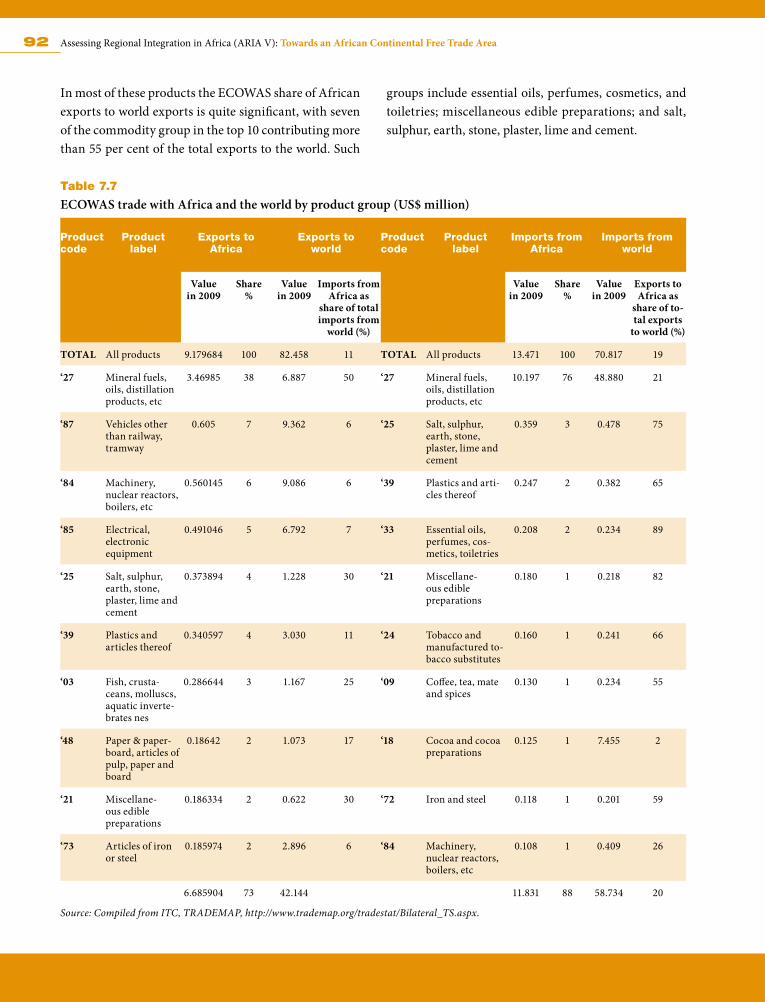
92 Assessing Regional Integration in Africa (ARIA V): Towards an African Continental Free Trade Area
In most of these products the ECOWAS share of African exports to world exports is quite significant, with seven of the commodity group in the top 10 contributing more than 55 per cent of the total exports to the world. Such
groups include essential oils, perfumes, cosmetics, and toiletries; miscellaneous edible preparations; and salt, sulphur, earth, stone, plaster, lime and cement.
Table 7.7
ECOWAS trade with Africa and the world by product group (US$ million)
Product code
Product label
Exports to Africa
Exports to world
Product code
Product label
Imports from Africa
Imports from world
Value in 2009
Share %
Value in 2009
Imports from Africa as
share of total imports from
world (%)
Value in 2009
Share %
Value in 2009
Exports to Africa as
share of to-tal exports
to world (%)
TOTAL All products 9.179684 100 82.458 11 TOTAL All products 13.471 100 70.817 19
‘27 Mineral fuels, oils, distillation products, etc
3.46985 38 6.887 50 ‘27 Mineral fuels, oils, distillation products, etc
10.197 76 48.880 21
‘87 Vehicles other than railway, tramway
0.605 7 9.362 6 ‘25 Salt, sulphur, earth, stone, plaster, lime and cement
0.359 3 0.478 75
‘84 Machinery, nuclear reactors, boilers, etc
0.560145 6 9.086 6 ‘39 Plastics and arti-cles thereof
0.247 2 0.382 65
‘85 Electrical, electronic equipment
0.491046 5 6.792 7 ‘33 Essential oils, perfumes, cos-metics, toiletries
0.208 2 0.234 89
‘25 Salt, sulphur, earth, stone, plaster, lime and cement
0.373894 4 1.228 30 ‘21 Miscellane-ous edible preparations
0.180 1 0.218 82
‘39 Plastics and articles thereof
0.340597 4 3.030 11 ‘24 Tobacco and manufactured to-bacco substitutes
0.160 1 0.241 66
‘03 Fish, crusta-ceans, molluscs, aquatic inverte-brates nes
0.286644 3 1.167 25 ‘09 Coffee, tea, mate and spices
0.130 1 0.234 55
‘48 Paper & paper-board, articles of pulp, paper and board
0.18642 2 1.073 17 ‘18 Cocoa and cocoa preparations
0.125 1 7.455 2
‘21 Miscellane-ous edible preparations
0.186334 2 0.622 30 ‘72 Iron and steel 0.118 1 0.201 59
‘73 Articles of iron or steel
0.185974 2 2.896 6 ‘84 Machinery, nuclear reactors, boilers, etc
0.108 1 0.409 26
6.685904 73 42.144 11.831 88 58.734 20
Source: Compiled from ITC, TRADEMAP, http://www.trademap.org/tradestat/Bilateral_TS.aspx.
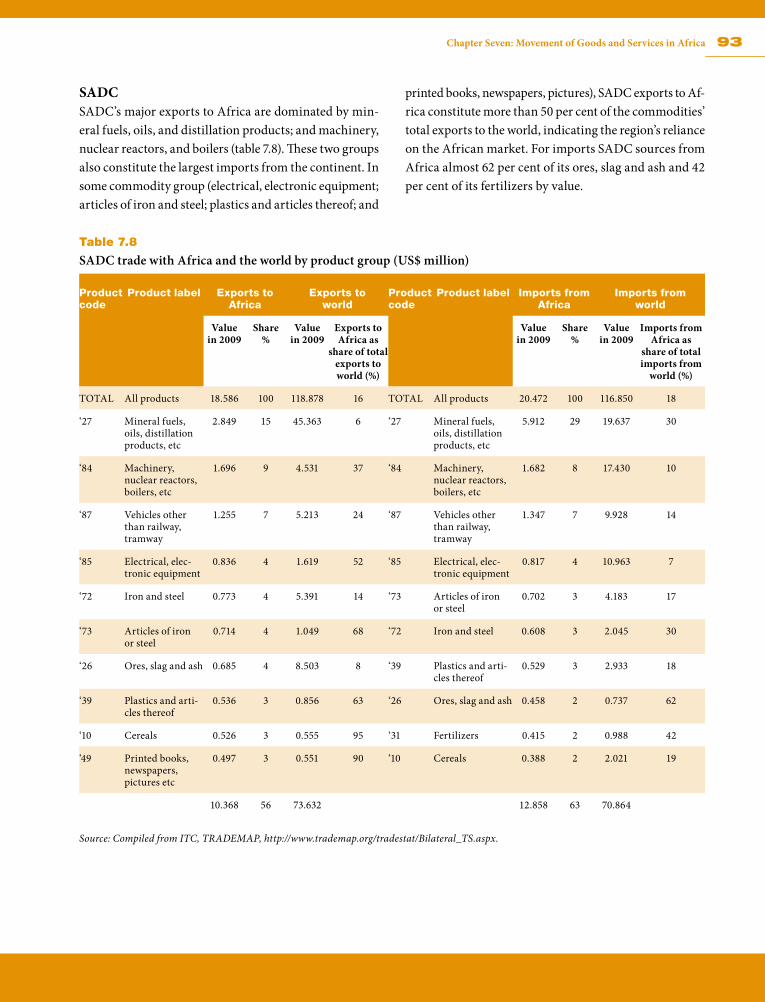
93Chapter Seven: Movement of Goods and Services in Africa
SADCSADC’s major exports to Africa are dominated by min-eral fuels, oils, and distillation products; and machinery, nuclear reactors, and boilers (table 7.8). These two groups also constitute the largest imports from the continent. In some commodity group (electrical, electronic equipment; articles of iron and steel; plastics and articles thereof; and
printed books, newspapers, pictures), SADC exports to Af-rica constitute more than 50 per cent of the commodities’ total exports to the world, indicating the region’s reliance on the African market. For imports SADC sources from Africa almost 62 per cent of its ores, slag and ash and 42 per cent of its fertilizers by value.
Table 7.8
SADC trade with Africa and the world by product group (US$ million)
Product code
Product label Exports to Africa
Exports to world
Product code
Product label Imports from Africa
Imports from world
Value in 2009
Share %
Value in 2009
Exports to Africa as
share of total exports to world (%)
Value in 2009
Share %
Value in 2009
Imports from Africa as
share of total imports from
world (%)
TOTAL All products 18.586 100 118.878 16 TOTAL All products 20.472 100 116.850 18
‘27 Mineral fuels, oils, distillation products, etc
2.849 15 45.363 6 ‘27 Mineral fuels, oils, distillation products, etc
5.912 29 19.637 30
‘84 Machinery, nuclear reactors, boilers, etc
1.696 9 4.531 37 ‘84 Machinery, nuclear reactors, boilers, etc
1.682 8 17.430 10
‘87 Vehicles other than railway, tramway
1.255 7 5.213 24 ‘87 Vehicles other than railway, tramway
1.347 7 9.928 14
‘85 Electrical, elec-tronic equipment
0.836 4 1.619 52 ‘85 Electrical, elec-tronic equipment
0.817 4 10.963 7
‘72 Iron and steel 0.773 4 5.391 14 ‘73 Articles of iron or steel
0.702 3 4.183 17
‘73 Articles of iron or steel
0.714 4 1.049 68 ‘72 Iron and steel 0.608 3 2.045 30
‘26 Ores, slag and ash 0.685 4 8.503 8 ‘39 Plastics and arti-cles thereof
0.529 3 2.933 18
‘39 Plastics and arti-cles thereof
0.536 3 0.856 63 ‘26 Ores, slag and ash 0.458 2 0.737 62
‘10 Cereals 0.526 3 0.555 95 ‘31 Fertilizers 0.415 2 0.988 42
‘49 Printed books, newspapers, pictures etc
0.497 3 0.551 90 ‘10 Cereals 0.388 2 2.021 19
10.368 56 73.632 12.858 63 70.864
Source: Compiled from ITC, TRADEMAP, http://www.trademap.org/tradestat/Bilateral_TS.aspx.
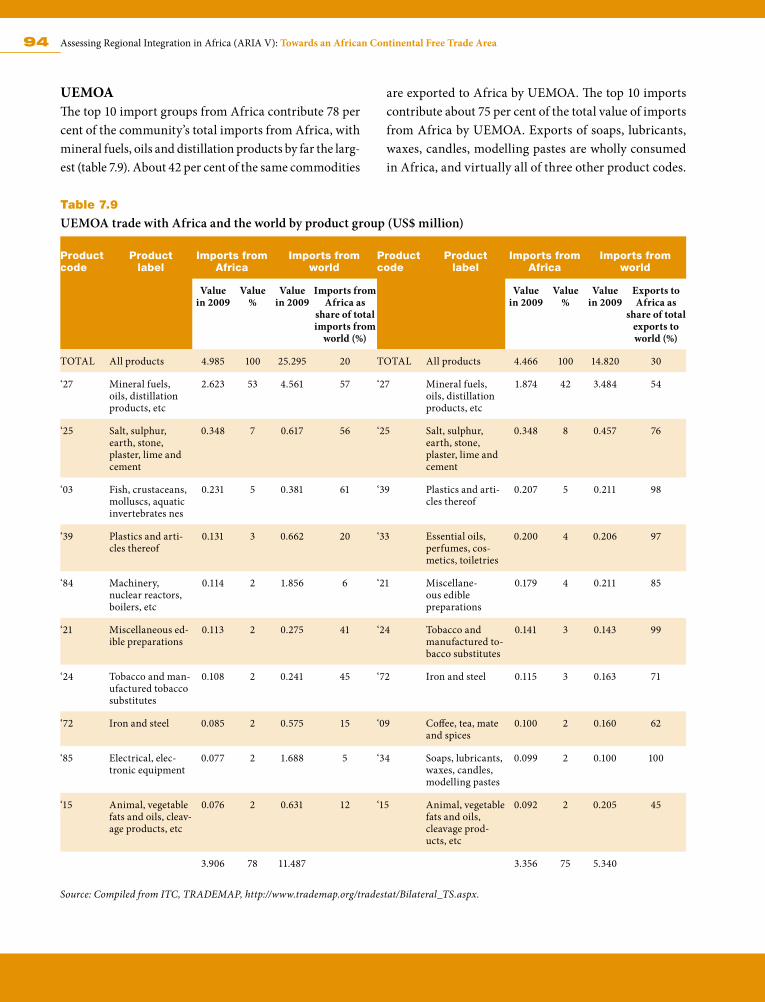
94 Assessing Regional Integration in Africa (ARIA V): Towards an African Continental Free Trade Area
UEMOA The top 10 import groups from Africa contribute 78 per cent of the community’s total imports from Africa, with mineral fuels, oils and distillation products by far the larg-est (table 7.9). About 42 per cent of the same commodities
are exported to Africa by UEMOA. The top 10 imports contribute about 75 per cent of the total value of imports from Africa by UEMOA. Exports of soaps, lubricants, waxes, candles, modelling pastes are wholly consumed in Africa, and virtually all of three other product codes.
Table 7.9
UEMOA trade with Africa and the world by product group (US$ million)
Product code
Product label
Imports from Africa
Imports from world
Product code
Product label
Imports from Africa
Imports from world
Value in 2009
Value %
Value in 2009
Imports from Africa as
share of total imports from
world (%)
Value in 2009
Value %
Value in 2009
Exports to Africa as
share of total exports to world (%)
TOTAL All products 4.985 100 25.295 20 TOTAL All products 4.466 100 14.820 30
‘27 Mineral fuels, oils, distillation products, etc
2.623 53 4.561 57 ‘27 Mineral fuels, oils, distillation products, etc
1.874 42 3.484 54
‘25 Salt, sulphur, earth, stone, plaster, lime and cement
0.348 7 0.617 56 ‘25 Salt, sulphur, earth, stone, plaster, lime and cement
0.348 8 0.457 76
‘03 Fish, crustaceans, molluscs, aquatic invertebrates nes
0.231 5 0.381 61 ‘39 Plastics and arti-cles thereof
0.207 5 0.211 98
‘39 Plastics and arti-cles thereof
0.131 3 0.662 20 ‘33 Essential oils, perfumes, cos-metics, toiletries
0.200 4 0.206 97
‘84 Machinery, nuclear reactors, boilers, etc
0.114 2 1.856 6 ‘21 Miscellane-ous edible preparations
0.179 4 0.211 85
‘21 Miscellaneous ed-ible preparations
0.113 2 0.275 41 ‘24 Tobacco and manufactured to-bacco substitutes
0.141 3 0.143 99
‘24 Tobacco and man-ufactured tobacco substitutes
0.108 2 0.241 45 ‘72 Iron and steel 0.115 3 0.163 71
‘72 Iron and steel 0.085 2 0.575 15 ‘09 Coffee, tea, mate and spices
0.100 2 0.160 62
‘85 Electrical, elec-tronic equipment
0.077 2 1.688 5 ‘34 Soaps, lubricants, waxes, candles, modelling pastes
0.099 2 0.100 100
‘15 Animal, vegetable fats and oils, cleav-age products, etc
0.076 2 0.631 12 ‘15 Animal, vegetable fats and oils, cleavage prod-ucts, etc
0.092 2 0.205 45
3.906 78 11.487 3.356 75 5.340
Source: Compiled from ITC, TRADEMAP, http://www.trademap.org/tradestat/Bilateral_TS.aspx.
95Chapter Seven: Movement of Goods and Services in Africa
7.4 Infrastructure 7.5.1 Issues
Over the past two or three decades successive Organiza-tion of African Unity and AU summits have identified poor transport and communications infrastructure; defi-cient maintenance of road networks; and the inflexibility, unreliability and inefficiency of rail transport, power supply and water as key factors holding back inter-REC and intra-African trade.
According to Amjadi and Yeats (1995), transport cost provides a higher effective rate of protection than tariffs, and largely explains why sub-Saharan Africa has been marginalized from world trade. Limao and Venables (2000) estimated that a general 10 per cent decrease in transport costs could lift trade volumes by up to 20 per cent. Thus regional cross-border infrastructure—in par-ticular transport, energy and water—has the potential to boost intra-regional trade and investment, unlock national and regional comparative advantages, and address the special needs of land-locked countries in accessing the rest of the world.
The World Bank’s Development Research Group (2006) estimates that sub-Saharan Africa could gain in the range of $20 billion annually ($203 billion over 10 years) from trade-related infrastructure upgrading projects. AfDB’s studies suggest that the poor state of infrastructure in sub-Saharan Africa cuts potential economic growth by 2 percentage points a year, and reduces business productiv-ity by as much as 40 per cent (AfDB, 2010a). To attain the Millennium Development Goals on poverty reduction, AfDB argues that Africa requires annual growth of 7
per cent, which will require a yearly investment of US$ 22 billion in infrastructure—40 per cent in transport, 25 per cent in energy, 20 per cent in water and 15 per cent in telecommunications.
This and the next section explore the key infrastructure trade-facilitation issues as well as the programmes that RECs are undertaking to strengthen intra-African trade, on the way to building a CFTA. Bridging this infrastruc-ture gap is as an important element in promoting regional integration, given the small size of most African econo-mies and the need to generate the economies of scale that larger markets have.
Under the aegis of the AU, several initiatives have already been launched. The AUC Heads of State and Government in Kampala launched the Programme for Infrastructure Development in Africa (PIDA) in July 2010. PIDA, which covers Africa’s essential infrastructure needs in the ar-eas of energy, ICT, transport and transboundary water, ensures that the growing demand for regional power is met in a sustainable manner. It also ensures that Africa’s development is not hampered by lack of adequate infra-structure. The PIDA strategic framework (which includes a Priority Action Plan) was developed in 2011 and adopted by the Heads of States and Governments in Addis Ababa in January 2012.
For its part, the AU/NEPAD African Action Plan, launched in 2009, considers the following projects as priorities for 2010–2015 (table 7.10).
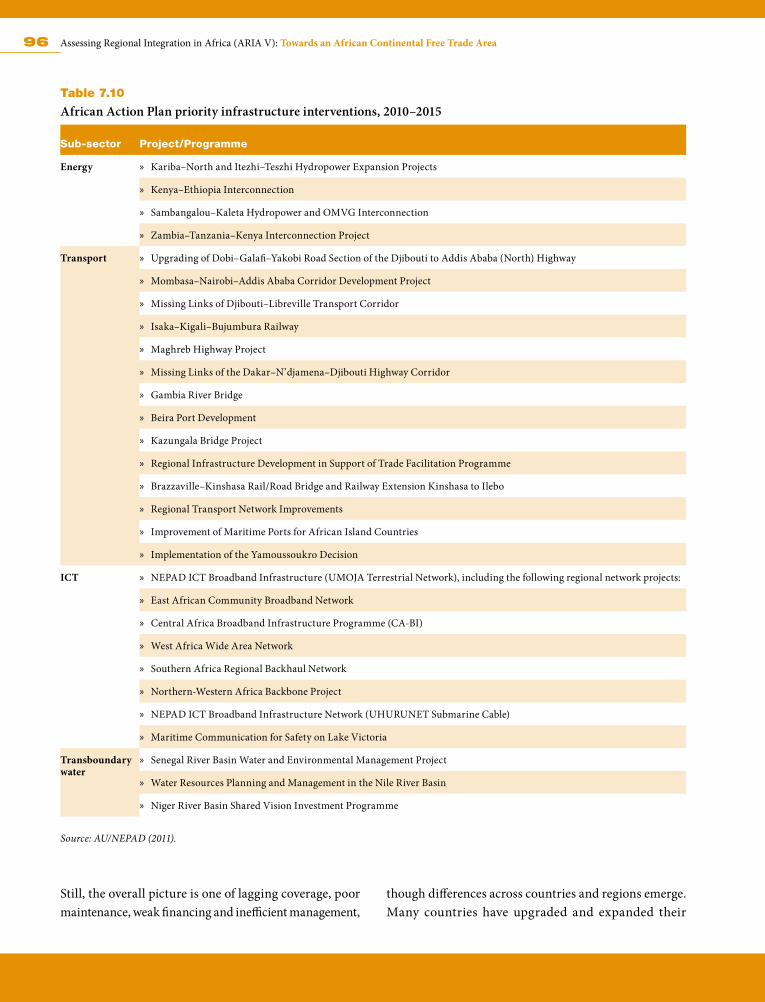
96 Assessing Regional Integration in Africa (ARIA V): Towards an African Continental Free Trade Area
Table 7.10
African Action Plan priority infrastructure interventions, 2010–2015
Sub-sector Project/Programme
Energy » Kariba–North and Itezhi–Teszhi Hydropower Expansion Projects
» Kenya–Ethiopia Interconnection
» Sambangalou–Kaleta Hydropower and OMVG Interconnection
» Zambia–Tanzania–Kenya Interconnection Project
Transport » Upgrading of Dobi–Galafi–Yakobi Road Section of the Djibouti to Addis Ababa (North) Highway
» Mombasa–Nairobi–Addis Ababa Corridor Development Project
» Missing Links of Djibouti–Libreville Transport Corridor
» Isaka–Kigali–Bujumbura Railway
» Maghreb Highway Project
» Missing Links of the Dakar–N’djamena–Djibouti Highway Corridor
» Gambia River Bridge
» Beira Port Development
» Kazungala Bridge Project
» Regional Infrastructure Development in Support of Trade Facilitation Programme
» Brazzaville–Kinshasa Rail/Road Bridge and Railway Extension Kinshasa to Ilebo
» Regional Transport Network Improvements
» Improvement of Maritime Ports for African Island Countries
» Implementation of the Yamoussoukro Decision
ICT » NEPAD ICT Broadband Infrastructure (UMOJA Terrestrial Network), including the following regional network projects:
» East African Community Broadband Network
» Central Africa Broadband Infrastructure Programme (CA-BI)
» West Africa Wide Area Network
» Southern Africa Regional Backhaul Network
» Northern-Western Africa Backbone Project
» NEPAD ICT Broadband Infrastructure Network (UHURUNET Submarine Cable)
» Maritime Communication for Safety on Lake Victoria
Transboundary water
» Senegal River Basin Water and Environmental Management Project
» Water Resources Planning and Management in the Nile River Basin
» Niger River Basin Shared Vision Investment Programme
Source: AU/NEPAD (2011).
Still, the overall picture is one of lagging coverage, poor maintenance, weak financing and inefficient management,
though differences across countries and regions emerge. Many countries have upgraded and expanded their
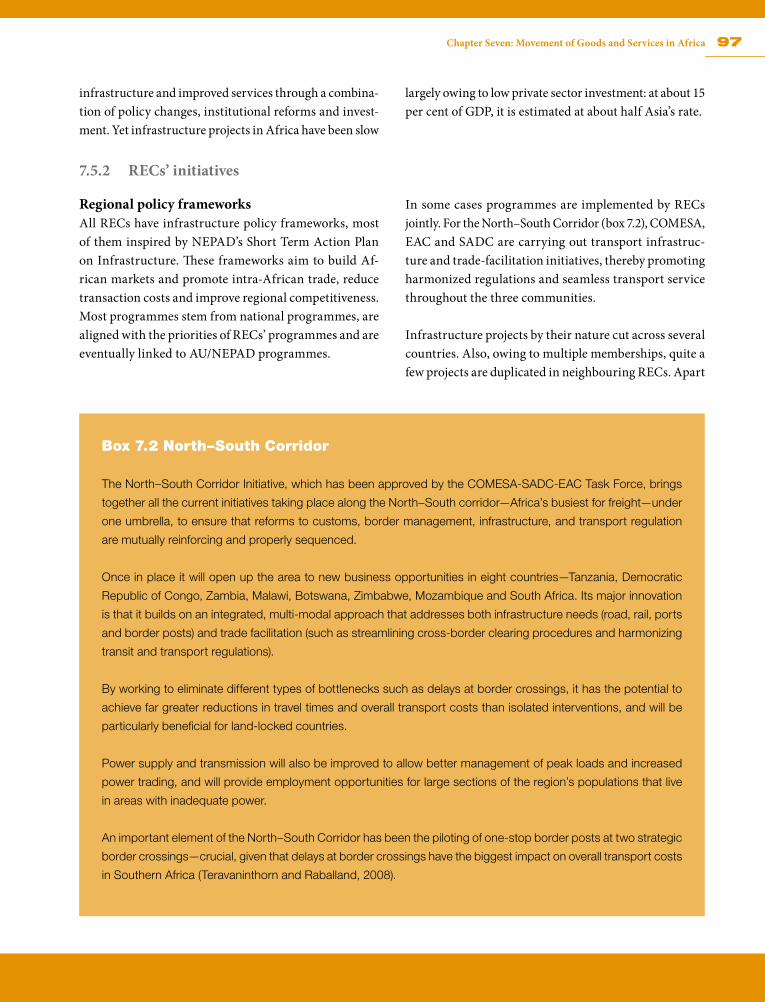
97Chapter Seven: Movement of Goods and Services in Africa
infrastructure and improved services through a combina-tion of policy changes, institutional reforms and invest-ment. Yet infrastructure projects in Africa have been slow
largely owing to low private sector investment: at about 15 per cent of GDP, it is estimated at about half Asia’s rate.
7.5.2 RECs’ initiatives
Regional policy frameworksAll RECs have infrastructure policy frameworks, most of them inspired by NEPAD’s Short Term Action Plan on Infrastructure. These frameworks aim to build Af-rican markets and promote intra-African trade, reduce transaction costs and improve regional competitiveness. Most programmes stem from national programmes, are aligned with the priorities of RECs’ programmes and are eventually linked to AU/NEPAD programmes.
In some cases programmes are implemented by RECs jointly. For the North–South Corridor (box 7.2), COMESA, EAC and SADC are carrying out transport infrastruc-ture and trade-facilitation initiatives, thereby promoting harmonized regulations and seamless transport service throughout the three communities.
Infrastructure projects by their nature cut across several countries. Also, owing to multiple memberships, quite a few projects are duplicated in neighbouring RECs. Apart
Box 7.2 North–South Corridor
The North–South Corridor Initiative, which has been approved by the COMESA-SADC-EAC Task Force, brings
together all the current initiatives taking place along the North–South corridor—Africa’s busiest for freight—under
one umbrella, to ensure that reforms to customs, border management, infrastructure, and transport regulation
are mutually reinforcing and properly sequenced.
Once in place it will open up the area to new business opportunities in eight countries—Tanzania, Democratic
Republic of Congo, Zambia, Malawi, Botswana, Zimbabwe, Mozambique and South Africa. Its major innovation
is that it builds on an integrated, multi-modal approach that addresses both infrastructure needs (road, rail, ports
and border posts) and trade facilitation (such as streamlining cross-border clearing procedures and harmonizing
transit and transport regulations).
By working to eliminate different types of bottlenecks such as delays at border crossings, it has the potential to
achieve far greater reductions in travel times and overall transport costs than isolated interventions, and will be
particularly beneficial for land-locked countries.
Power supply and transmission will also be improved to allow better management of peak loads and increased
power trading, and will provide employment opportunities for large sections of the region’s populations that live
in areas with inadequate power.
An important element of the North–South Corridor has been the piloting of one-stop border posts at two strategic
border crossings—crucial, given that delays at border crossings have the biggest impact on overall transport costs
in Southern Africa (Teravaninthorn and Raballand, 2008).
98 Assessing Regional Integration in Africa (ARIA V): Towards an African Continental Free Trade Area
from the inherent problems, such as waste of technical and financial resources, this has sometimes led to incoherent policies and programmes for the same project, delaying project launch. More important, although quite a num-ber of infrastructure projects have been formulated, the biggest handicap is at the implementation stage. In addi-tion, these infrastructure projects require huge financial resources that most countries and regions do not have, forcing them to rely on loans and aid from development partners.
The biggest challenge facing CEN-SAD is to reduce pov-erty, which efficient infrastructure—via greater trade—will help to achieve. The community’s Infrastructure Development Plan entails activities in transport, energy, mining and telecommunications.
COMESA has infrastructure development programmes and most are aligned with the 2010–2015 AU/NEPAD African Action Plan. COMESA has prioritized four groups of infrastructure projects: transport and trade facilitation; air transport; lake transport; and telecommunications.
The ECCAS regional strategy, as described in the CEMAC 2025 Vision, is based on several sectoral programmes and strategies to help reduce poverty and enhance growth in the region. In energy, for instance, the Central African Power Pool was established to address Central Africa’s energy crisis.
IGAD—as other RECs—considers infrastructure from regional and continental perspectives. Its efforts are fo-cused on facilitation and advocacy for member states in regional priority projects. IGAD has supported member states in such programmes as the Djibouti–Addis Ababa road/rail links, and is now focusing on the Isiolo–Moyale Corridor connecting Kenya and Ethiopia, with funding from AfDB/NEPAD.
SADC’s vision for infrastructure development is premised on the SADC Protocol on Transport, Communications and Meteorology. The launch of the SADC Corridor De-velopment Strategy attests to a renewed commitment to regional infrastructure development, and cross-border collaboration involving two or more member states has
already improved. In August 2011 the Luanda SADC sum-mit launched the SADC Regional Infrastructure Master Plan, which outlines steps to an efficient, seamless and cost-effective trans-boundary network.
SADC has a very ambitious infrastructure programme: its target is to raise US$ 100 billion to finance its projects by 2015. Investment in energy generation alone is estimated to require US$ 47 billion over the next five years, as well as up to US$ 26 billion in surface transport, US$ 18 billion in ports and inland waterways and around US$ 9 billion in ICT, postal systems, meteorology and water.
The West African region has adopted a comprehensive, coordinated strategy for transport and infrastructure. Several initiatives aim to improve transport for land-locked countries and conform to the Sub-Saharan Africa Transport Programme. CEMAC, ECOWAS and UEMOA are cooperating with multilateral and bilateral donors, as well as regional financial institutions, in designing and implementing policy.
EnergyECCAS focuses on developing a regional energy market, managed by the Central Africa Power Pool. In 2009, stud-ies looked into building electrical grids between the region and the rest of Africa, particularly from the Inga dam (Democratic Republic of Congo). This approach would mark a major element in integrating Africa’s regions.
IGAD and EAC are together implementing the 400 kV, 1,200 km Kenya–Ethiopia Interconnection. It will supply power to the eastern region (Burundi, Kenya, Rwanda and Uganda), and will eventually help to integrate the eastern, northern and southern regions. Drawing on the lessons of the Southern African Power Pool (below), IGAD advocates for cross-border power pools to increase access. Kenya and Uganda already share power.
ECOWAS is developing two flagship programmes—the West African Power Pool (WAPP) and the West African Gas Pipeline (WAGP). WAPP promotes regional pooling to meet electricity demand, which is expected to grow by 5 per cent annually over the next 20 years, through inte-grating national power system operations into a unified
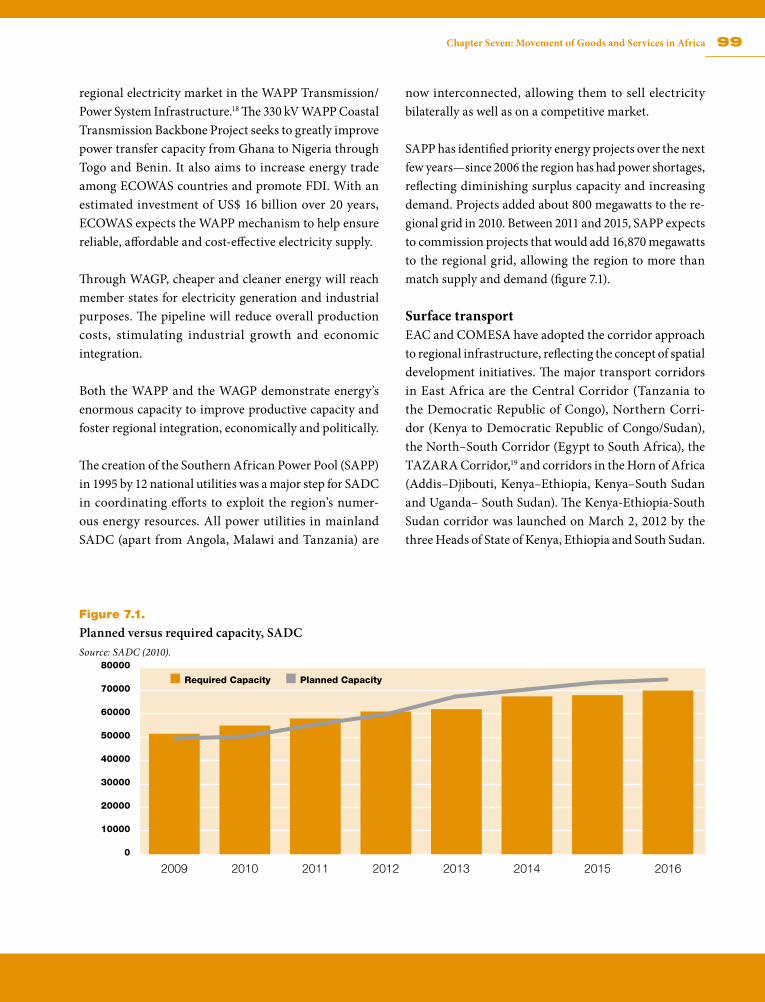
99Chapter Seven: Movement of Goods and Services in Africa
regional electricity market in the WAPP Transmission/Power System Infrastructure.18 The 330 kV WAPP Coastal Transmission Backbone Project seeks to greatly improve power transfer capacity from Ghana to Nigeria through Togo and Benin. It also aims to increase energy trade among ECOWAS countries and promote FDI. With an estimated investment of US$ 16 billion over 20 years, ECOWAS expects the WAPP mechanism to help ensure reliable, affordable and cost-effective electricity supply.
Through WAGP, cheaper and cleaner energy will reach member states for electricity generation and industrial purposes. The pipeline will reduce overall production costs, stimulating industrial growth and economic integration.
Both the WAPP and the WAGP demonstrate energy’s enormous capacity to improve productive capacity and foster regional integration, economically and politically.
The creation of the Southern African Power Pool (SAPP) in 1995 by 12 national utilities was a major step for SADC in coordinating efforts to exploit the region’s numer-ous energy resources. All power utilities in mainland SADC (apart from Angola, Malawi and Tanzania) are
now interconnected, allowing them to sell electricity bilaterally as well as on a competitive market.
SAPP has identified priority energy projects over the next few years—since 2006 the region has had power shortages, reflecting diminishing surplus capacity and increasing demand. Projects added about 800 megawatts to the re-gional grid in 2010. Between 2011 and 2015, SAPP expects to commission projects that would add 16,870 megawatts to the regional grid, allowing the region to more than match supply and demand (figure 7.1).
2009 2010 2011 2012 2013 2014 2015 20160
10000
20000
30000
40000
50000
60000
70000
80000
Required Capacity Planned Capacity
Figure 7.1.
Planned versus required capacity, SADCSource: SADC (2010).
Surface transportEAC and COMESA have adopted the corridor approach to regional infrastructure, reflecting the concept of spatial development initiatives. The major transport corridors in East Africa are the Central Corridor (Tanzania to the Democratic Republic of Congo), Northern Corri-dor (Kenya to Democratic Republic of Congo/Sudan), the North–South Corridor (Egypt to South Africa), the TAZARA Corridor,19 and corridors in the Horn of Africa (Addis–Djibouti, Kenya–Ethiopia, Kenya–South Sudan and Uganda– South Sudan). The Kenya-Ethiopia-South Sudan corridor was launched on March 2, 2012 by the three Heads of State of Kenya, Ethiopia and South Sudan.
100 Assessing Regional Integration in Africa (ARIA V): Towards an African Continental Free Trade Area
The corridor, known as LAPSSET, originates at the new port of Lamu and will also include standard gauge railway lines, fibre-optic cables and an oil pipeline. The corridor approach has the potential of promoting regional connec-tivity, thus contributing to the vision of a well-connected and prosperous East Africa.
With JICA assistance, EAC has improved the container terminal at Mombasa and Dar es Salaam ports, add-ing new berths, building new and expanding existing container yards, and constructing loading/unloading facilities, and laying down access roads, scheduled to be completed this year. In addition, the JICA-assisted con-tainer terminal expansion at Mombasa Port will build four new container berths, adding annual cargo-handling capacity of 1.1 million TEUs.
EAC is also supporting moves towards one-stop border posts. Under the EATTFP initiative (which targets Kenya, Rwanda, Tanzania and Uganda), the East African coun-tries are cooperating to set up such posts. In Malaba on the border between Kenya and Uganda, the first one-stop post for a railway in East Africa was opened in 2007, and border crossing times for railway freight have fallen to 30 minutes to one hour, from one or two days. Various
development partners support one-stop border posts at other international borders (JICA, 2009).
The COMESA infrastructure development programme is based on the following programmes:
» COMESA Transport and Communications Strategy and Priority Investment Plan;
» SADC Infrastructure Master Development Plan;
» The corridor-based COMESA/EAC/SADC Joint Aid for Trade Programme;
» The EAC Railway Development Master Plan; and
» The IGAD Transport, Energy and Water Programme.
Other major infrastructure development programmes in the region include the Shire–Zambezi waterway, which is aimed at linking Malawi with Mozambique, Zambia and Zimbabwe; SEGANET, an inter-island high speed cable link for Indian Ocean Commission islands; and the North–South Corridor, which runs from north Zambia’s copper belt (a joint COMESA-SADC-EAC activity) and
Box 7.3 The COMESA Fund
The COMESA Fund has two facilities, for infrastructure and adjustment costs.
The infrastructure facility aims to mobilize resources for building and maintaining infrastructure, and for leveraging
some of the limited productive capacity of individual member states. It has four main purposes: to provide a source
of revenue to be used to finance priority investment projects; to promote regional integration through Eastern and
Southern African countries having an equity stake in infrastructure in the region; to allow public-private partner-
ships to own and manage capital assets; and to be a vehicle through which development partners can contribute
to priority infrastructure projects.
The adjustment facility addresses costs from regional integration measures, including revenue losses from trade
reforms. Burundi and Rwanda have already benefited, receiving $15.1 million and $6.5 million, respectively, in
anticipation of revenue losses arising from reduced EAC tariffs.
101Chapter Seven: Movement of Goods and Services in Africa
southern Democratic Republic of Congo to Dar es Salaam port and other ports in South Africa.
On the funding front, COMESA launched the COMESA Fund in 2006 (box 7.3), and has already identified several infrastructure projects to receive its funding.
In 2006, CEMAC approved a trade corridor project to improve trade and transport among its members and with the rest of the world. Freight transport from Douala, Cameroon—the main port and regional gateway—took 15 days to N’Djamena in Chad and 10 days to Bangui, Central African Republic. Port delays could add another 28 days.
CEN-SAD’s infrastructure programmes are mainly aimed at addressing the constraints that limit integration be-tween the north and south, and between the west and east, because several of its member states belong to multiple RECs.20 ECOWAS has been responsible for most infra-structure projects, often creating new transit routes or corridors, and maintaining or upgrading infrastructure services.
For ECCAS, the Central African Consensual Transport Master Plan was developed to boost railways, roads and water transport around the Great Lakes Region and pave the way for linking ECCAS capitals by tarred roads before 2010. ECCAS and SADC are jointly building the Braz-zaville–Kinshasa rail and road bridge across the Congo River. This bridge will complete a missing road link of the Tripoli–Windhoek–Cape Town Trans-African Highway and add a rail link for the Pointe Noire–South-Eastern Africa railway network.
Key surface transport projects in ECOWAS include road improvements on priority corridors (Trans-Coastal/Trans-Sahelian) and interconnecting roads; the Nigeria-Cameroon Transport Facilitation Programme; the joint border post and bridge over the Cross River (supported by AfDB); and the UEMOA Road Infrastructure and Transport Action Programme.
Southern Africa has launched several initiatives, includ-ing the North–South Corridor investment programme, the Kazungula Bridge (linking Zambia and Botswana via Zimbabwe), upgrading of the Kavango Bridge along the Trans Caprivi Corridor, the Sena Railway Line reha-bilitation, the Unity Bridge across the Rovuma linking Mozambique and Tanzania on the Mtwara Corridor, the Lobito Corridor, the Lubango–Santa Clara Road along the Trans-Cunene Corridor and the rehabilitation of several ports (including Lobito, Luanda, Beira and Maputo). All these projects are in the SADC Regional Infrastructure Master Plan. SADC with COMESA and EAC have agreed to transform transport corridors into broader spatial development corridors, and accord priority to the North–South Corridor, which traverses eight countries in East and Southern Africa between Durban and Dar es Salaam. The Aid for Trade programme encompasses transport and power (as well as trade-facilitation) projects along the North–South Corridor.
WaterThe EAC has several regional initiatives, including the Sustainable Development of Lake Victoria Basin; Lake Vic-toria Transport Project; joint concessioning of railroads; East Africa Power Master Plan; East Africa Submarine System; and the East Africa Infrastructure Master Plan. For its part, ECCAS adopted a water policy in 2009, in a bid to develop the region’s water resources.
SADC recognizes how crucial major water infrastructure is for regional economic integration and poverty eradi-cation. One result is the Regional Strategic Action Plan on Integrated Water Resources Management, which has five-year phases. Another is the SADC Regional Strategic Water Infrastructure Development Programme, which aims to rehabilitate, expand and build facilities regionally. Table 7.11 presents selected strategic projects in SADC.
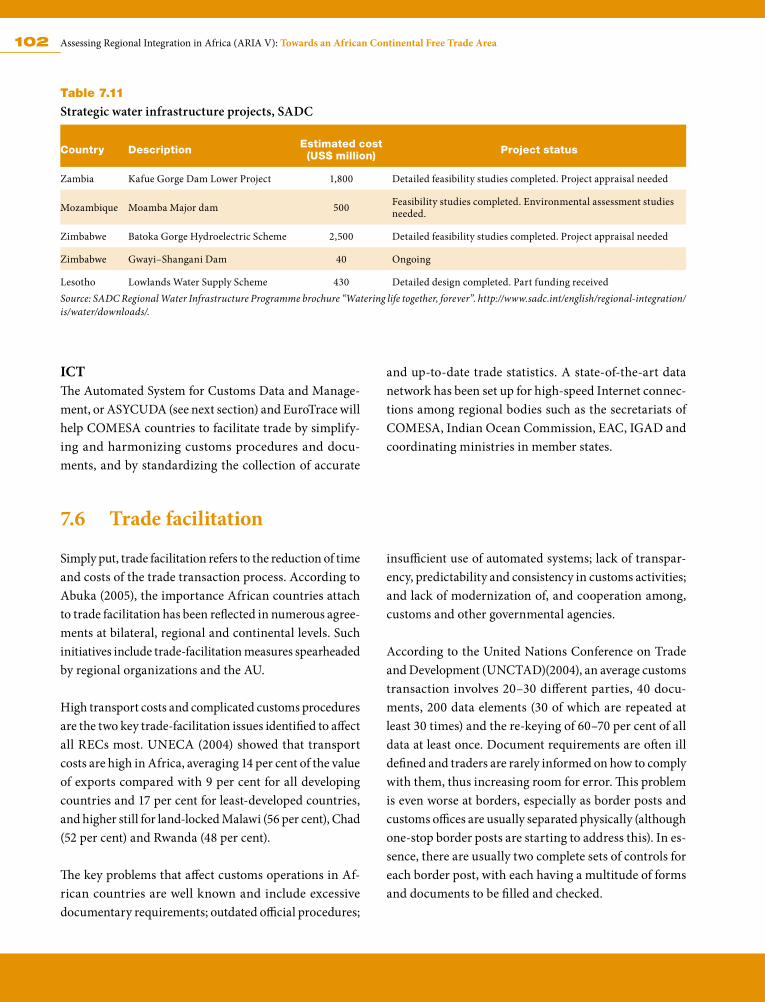
102 Assessing Regional Integration in Africa (ARIA V): Towards an African Continental Free Trade Area
Table 7.11
Strategic water infrastructure projects, SADC
Country Description Estimated cost (US$ million) Project status
Zambia Kafue Gorge Dam Lower Project 1,800 Detailed feasibility studies completed. Project appraisal needed
Mozambique Moamba Major dam 500 Feasibility studies completed. Environmental assessment studies needed.
Zimbabwe Batoka Gorge Hydroelectric Scheme 2,500 Detailed feasibility studies completed. Project appraisal needed
Zimbabwe Gwayi–Shangani Dam 40 Ongoing
Lesotho Lowlands Water Supply Scheme 430 Detailed design completed. Part funding receivedSource: SADC Regional Water Infrastructure Programme brochure “Watering life together, forever”. http://www.sadc.int/english/regional-integration/is/water/downloads/.
ICT The Automated System for Customs Data and Manage-ment, or ASYCUDA (see next section) and EuroTrace will help COMESA countries to facilitate trade by simplify-ing and harmonizing customs procedures and docu-ments, and by standardizing the collection of accurate
and up-to-date trade statistics. A state-of-the-art data network has been set up for high-speed Internet connec-tions among regional bodies such as the secretariats of COMESA, Indian Ocean Commission, EAC, IGAD and coordinating ministries in member states.
7.6 Trade facilitation
Simply put, trade facilitation refers to the reduction of time and costs of the trade transaction process. According to Abuka (2005), the importance African countries attach to trade facilitation has been reflected in numerous agree-ments at bilateral, regional and continental levels. Such initiatives include trade-facilitation measures spearheaded by regional organizations and the AU.
High transport costs and complicated customs procedures are the two key trade-facilitation issues identified to affect all RECs most. UNECA (2004) showed that transport costs are high in Africa, averaging 14 per cent of the value of exports compared with 9 per cent for all developing countries and 17 per cent for least-developed countries, and higher still for land-locked Malawi (56 per cent), Chad (52 per cent) and Rwanda (48 per cent).
The key problems that affect customs operations in Af-rican countries are well known and include excessive documentary requirements; outdated official procedures;
insufficient use of automated systems; lack of transpar-ency, predictability and consistency in customs activities; and lack of modernization of, and cooperation among, customs and other governmental agencies.
According to the United Nations Conference on Trade and Development (UNCTAD)(2004), an average customs transaction involves 20–30 different parties, 40 docu-ments, 200 data elements (30 of which are repeated at least 30 times) and the re-keying of 60–70 per cent of all data at least once. Document requirements are often ill defined and traders are rarely informed on how to comply with them, thus increasing room for error. This problem is even worse at borders, especially as border posts and customs offices are usually separated physically (although one-stop border posts are starting to address this). In es-sence, there are usually two complete sets of controls for each border post, with each having a multitude of forms and documents to be filled and checked.
103Chapter Seven: Movement of Goods and Services in Africa
As with the issues, the measures required are also well known, and include simplifying requirements, harmoniz-ing procedures and documentation, standardizing com-mercial practices and introducing agreed codes for the presentation of information. In most African countries, documentation requirements often lack transparency and are duplicative, a problem often compounded by a
lack of cooperation between traders and official agencies. Despite advances in information technology, electronic data submission is not widely used. Reducing bureaucratic interference and simplifying procedures can be achieved, but only if the countries involved display a greater commit-ment to international, regional, sub regional and bilateral agreements.
7.6.1 Regional programmes
Many African RECs and governments, working with international organizations like UNCTAD, the World Bank, World Customs Organization and the WTO, have in recent years implemented trade-facilitation initiatives. Most of their efforts are focused on removing non-physical transport barriers along major transit corridors, especially those connecting land-locked countries to seaports.
COMESACOMESA has a wide range of initiatives on trade liber-alization and facilitation.
The Harmonized Commodity Description Coding System (HS). Member states have adopted this system, which provides a realistic approach to customs tariffs integration and trade statistics nomenclatures. The HS also provided the basis for COMESA’s common tariff nomenclature (CTN) and CET.
CTN. COMESA has now compiled a CTN that is based on the HS 2002 for COMESA countries. The CTN is a prerequisite for the CET under the customs union. The CTN has been harmonized at eight-digit level.
COMESA Customs Declaration Document (COMESA-CD). This is an integral part of the COMESA Trade and Transit Transport Facilitation Programme, and forms part of customs modernization and automation. In some member states, it has replaced 32 documents. The document caters for imports, exports, transit and warehousing. Hence, it is no longer necessary to complete different documents for specific customs transactions.
Advance Cargo Information System (ACIS). This is an in-tegrated transport logistics management tool for tracking
transport equipment and cargo on railways, through ports (port tracker), on roads (road tracker), etc. ACIS helps businesses and transport operators to track movements of transport equipment and cargo throughout the COMESA region, enabling statistics generation.
ASYCUDA. COMESA has introduced ASYCUDA to computerize customs and international trade statistics, with EU assistance. It enables customs administrations to facilitate trade within and outside COMESA without compromising the objective of maximizing revenues. When it was introduced in Mauritius, for example, it dramatically cut the time required to process a declaration at the airport from 24–48 hours to 30 minutes.
External trade statistics. COMESA’s foreign trade statistics are managed through the Ex-Trade computerized system, which helps in producing time series analysis, validating data, aggregating data and producing statistical tables.
Harmonized road transit charges. Under this scheme, introduced in 1991, heavy goods trucks with more than three axles pay a road charge of US$ 10 per 100 km, trucks with up to three axles pay a charge of US$ 6 per 100 km and buses with a capacity of more than 25 passengers pay US$ 5 per 100 km.
COMESA carrier’s licence. This allows commercial goods vehicles to operate in all member states on a single licence.
Harmonized axle loading and maximum vehicle dimen-sions. To safeguard the region’s roads against overload-ing, COMESA has set axle load limits for heavy goods vehicles.
104 Assessing Regional Integration in Africa (ARIA V): Towards an African Continental Free Trade Area
COMESA Yellow Card Scheme. This is a vehicle insurance scheme covering third-party liability and medical ex-penses. Motor vehicles can travel in participating countries using a single insurance policy, and over 130 insurance companies are involved. It has been a great success in facilitating cross-border motor vehicle movement.
EACEvery EAC partner state has recently complained of NTBs: Rwanda objects to insecurity along the Northern Corridor; Kenya is raising issues about arrests of its truck drivers in Burundi; Tanzania recently imposed new diamond quality standards to be embossed on Kenyan goods before they are exported to Tanzania; and Uganda has serious issues concerning customs delays at the port of Mombasa. Any of these barriers contribute to transport bottlenecks, which have multiplier effects in regional economies.
Added to this is piracy. The EAC, with the partner states, is implementing the East African Trade and Transport Facilitation Project (EATTF under the Northern Corridor Transit Transport Coordinating Authority). Its main ob-jective is to reduce NTBs and uncertainty of transit time along the key corridors.
» The EAC launched a US$ 300 million infrastructure and border management project that seeks to cut the cost of doing business in the region by 40 per cent. The project involves automating ports, weighbridges, customs department and all other national agencies that manage the region’s key transport corridors and border points. The project is funded by the Trade Mark East Africa, and will also establish common road networks linking markets in the region to those in COMESA and SADC countries. Improved effi-ciency at ports and transport corridors is expected to reduce cost of intra-regional transactions by 30 per cent and raise exports to non-EAC markets by 10 per cent in four years.
ECCAS and CEMAC The goal of the CEMAC Trade Corridor project is to fa-cilitate efficient regional trade among CEMAC member states and improve access to world markets; hence some projects from CEMAC are beneficial to ECCAS as its
members are also part of the regional grouping. ECCAS is implementing the Trade Facilitation and Regional In-tegration project in Central Africa with support from the World Bank.
ECOWAS and UEMOASome recent or current programmes in West Africa are as follows.
The West Africa Road Transport and Transit Facilitation. The project aims to improve access by Burkina Faso and Mali to Ghanaian ports, improve port operations and make traffic move more efficiently along the Tema–Oua-gadougou–Bamako transport corridor.
The Abidjan–Lagos Transport and Trade Facilitation (Ivory Coast, Ghana, Togo, Benin, Nigeria). A joint UEMOA–ECOWAS programme, its objective is to reduce trade and transport barriers in the ports and on the roads along the Abidjan–Lagos coastal corridor by defining a mechanism that grants positive discrimination for compliant opera-tors (traders and related services), using the authorized economic operator approach developed by the World Customs Organization, or a customized version adequate to the environment and to a specific subset of issues.
Other programmes. These include the Brown Card In-surance scheme (similar to the COMESA Yellow Card), a vehicle insurance programme that covers third-party liability and medical expenses; and the Inter-State Road Transit scheme to ease road transit and transport across borders.
AfDB has been closely involved in trade-facilitation ac-tivities in West Africa (box 7.4).
SADCAccording to the World Bank’s Trading Across Borders category of the 2010 Doing Business Report, the Southern African region, on a weighted average, would be ranked 149 out of 183 countries. One reason is that on average it takes 35 days for cargo to be exported and 42 days to be imported. In addition, it costs an average of US$ 1,899 to export and US$ 2,410 to import a 20-foot container of non-sensitive goods, with an average of eight documents
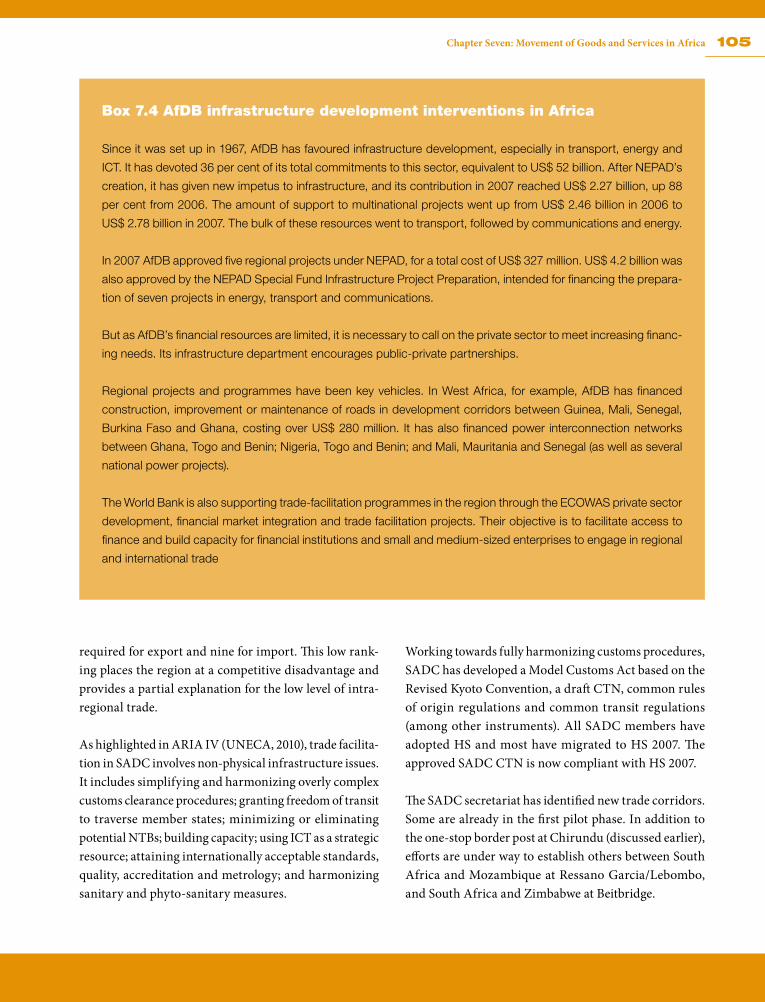
105Chapter Seven: Movement of Goods and Services in Africa
required for export and nine for import. This low rank-ing places the region at a competitive disadvantage and provides a partial explanation for the low level of intra-regional trade.
As highlighted in ARIA IV (UNECA, 2010), trade facilita-tion in SADC involves non-physical infrastructure issues. It includes simplifying and harmonizing overly complex customs clearance procedures; granting freedom of transit to traverse member states; minimizing or eliminating potential NTBs; building capacity; using ICT as a strategic resource; attaining internationally acceptable standards, quality, accreditation and metrology; and harmonizing sanitary and phyto-sanitary measures.
Working towards fully harmonizing customs procedures, SADC has developed a Model Customs Act based on the Revised Kyoto Convention, a draft CTN, common rules of origin regulations and common transit regulations (among other instruments). All SADC members have adopted HS and most have migrated to HS 2007. The approved SADC CTN is now compliant with HS 2007.
The SADC secretariat has identified new trade corridors. Some are already in the first pilot phase. In addition to the one-stop border post at Chirundu (discussed earlier), efforts are under way to establish others between South Africa and Mozambique at Ressano Garcia/Lebombo, and South Africa and Zimbabwe at Beitbridge.
Box 7.4 AfDB infrastructure development interventions in Africa
Since it was set up in 1967, AfDB has favoured infrastructure development, especially in transport, energy and
ICT. It has devoted 36 per cent of its total commitments to this sector, equivalent to US$ 52 billion. After NEPAD’s
creation, it has given new impetus to infrastructure, and its contribution in 2007 reached US$ 2.27 billion, up 88
per cent from 2006. The amount of support to multinational projects went up from US$ 2.46 billion in 2006 to
US$ 2.78 billion in 2007. The bulk of these resources went to transport, followed by communications and energy.
In 2007 AfDB approved five regional projects under NEPAD, for a total cost of US$ 327 million. US$ 4.2 billion was
also approved by the NEPAD Special Fund Infrastructure Project Preparation, intended for financing the prepara-
tion of seven projects in energy, transport and communications.
But as AfDB’s financial resources are limited, it is necessary to call on the private sector to meet increasing financ-
ing needs. Its infrastructure department encourages public-private partnerships.
Regional projects and programmes have been key vehicles. In West Africa, for example, AfDB has financed
construction, improvement or maintenance of roads in development corridors between Guinea, Mali, Senegal,
Burkina Faso and Ghana, costing over US$ 280 million. It has also financed power interconnection networks
between Ghana, Togo and Benin; Nigeria, Togo and Benin; and Mali, Mauritania and Senegal (as well as several
national power projects).
The World Bank is also supporting trade-facilitation programmes in the region through the ECOWAS private sector
development, financial market integration and trade facilitation projects. Their objective is to facilitate access to
finance and build capacity for financial institutions and small and medium-sized enterprises to engage in regional
and international trade
106 Assessing Regional Integration in Africa (ARIA V): Towards an African Continental Free Trade Area
7.6.2 Gains from trade facilitation
Simplified, transparent trade procedures are a key compo-nent of good trade policy and vital for economic growth. Cumbersome, outdated bureaucracies and infrastructure stifle trade and entrepreneurship, discourage investment
and encourage corruption—too often in Africa. And the costs of new systems are minimal—Chile spent US$ 5 million on automating its customs systems, and recouped the investment in just over a year.
7.7 Identifying trade opportunities in Africa
All African countries have great potential and a plethora of opportunities in such areas as agriculture and agro-businesses, mining, energy generation, surface and air transport, and many creative industries. Yet most African countries are still importing the same products that other African countries are exporting to the rest of the world. Thus Africa has the potential to reap vast trade and in-vestment opportunities in most product groups. Tables 7.12–7.15 indicate the products that selected African RECs in 2010 exported outside Africa that are at the same time imported back into the continent.
The tables show that the four RECs often still source their products from outside Africa, suggesting that intra-African trade-facilitating efforts have not been successful. Yet they also show—with better trade facilitation—the great potential for trade and investment among African RECs. Intra-Africa investment opportunities abound in mineral extraction, heavy industrial products and raw-material processing.
For four RECs specific ally, the tables indicate the follow-ing major trade opportunities.
COMESACOMESA has a high potential market in Africa for ores, slag and ash; copper and articles thereof; mineral fuels; coffee, tea and spices; base metals; edible fruits, nuts; vegetable products and live trees, plants and cut flowers, among many other products (table 7.13). It is surprising that COMESA is exporting most of these to the world when there is high demand for the same products within Africa as shown by high imports of the same product lines from the rest of the world, underlining the great potential for COMESA members to trade with their fel-low African countries.
EACEAC has trade opportunities in Africa for coffee, tea and spices; base metals; edible fruits, nuts; vegetable products and live trees, plants and cut flowers (table 7.14). However, its exports to Africa can only satisfy 2 per cent of Africa’s import demands of all the products imported by Africa.
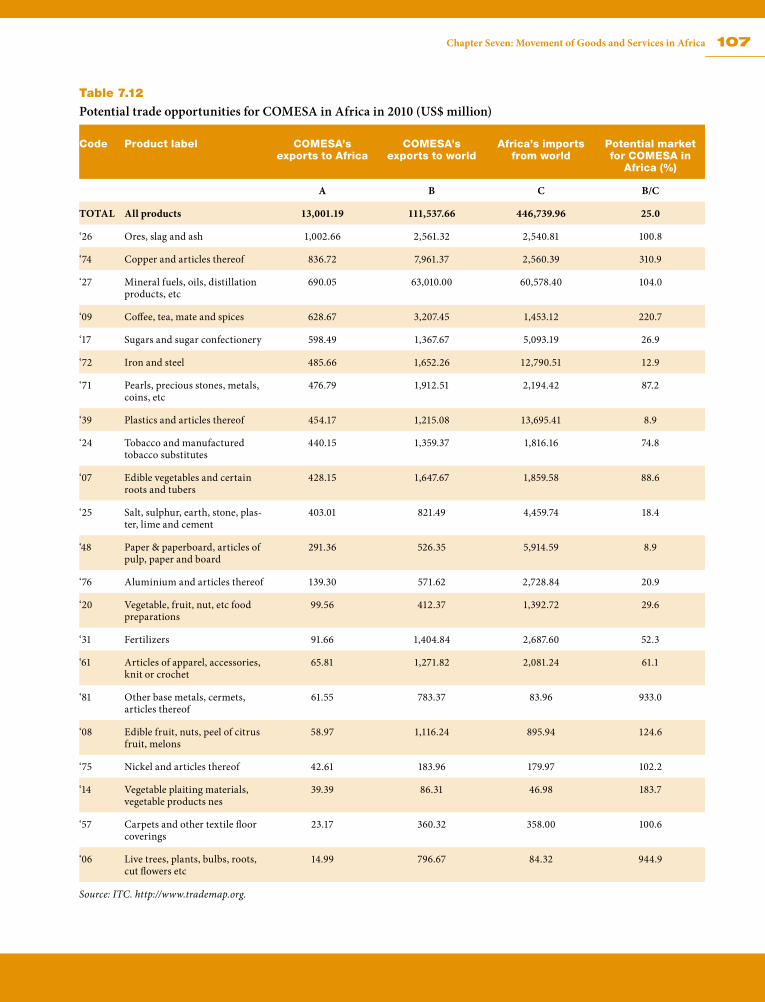
107Chapter Seven: Movement of Goods and Services in Africa
Table 7.12
Potential trade opportunities for COMESA in Africa in 2010 (US$ million)
Code Product label COMESA’s exports to Africa
COMESA’s exports to world
Africa’s imports from world
Potential market for COMESA in
Africa (%)
A B C B/C
TOTAL All products 13,001.19 111,537.66 446,739.96 25.0
‘26 Ores, slag and ash 1,002.66 2,561.32 2,540.81 100.8
‘74 Copper and articles thereof 836.72 7,961.37 2,560.39 310.9
‘27 Mineral fuels, oils, distillation products, etc
690.05 63,010.00 60,578.40 104.0
‘09 Coffee, tea, mate and spices 628.67 3,207.45 1,453.12 220.7
‘17 Sugars and sugar confectionery 598.49 1,367.67 5,093.19 26.9
‘72 Iron and steel 485.66 1,652.26 12,790.51 12.9
‘71 Pearls, precious stones, metals, coins, etc
476.79 1,912.51 2,194.42 87.2
‘39 Plastics and articles thereof 454.17 1,215.08 13,695.41 8.9
‘24 Tobacco and manufactured tobacco substitutes
440.15 1,359.37 1,816.16 74.8
‘07 Edible vegetables and certain roots and tubers
428.15 1,647.67 1,859.58 88.6
‘25 Salt, sulphur, earth, stone, plas-ter, lime and cement
403.01 821.49 4,459.74 18.4
‘48 Paper & paperboard, articles of pulp, paper and board
291.36 526.35 5,914.59 8.9
‘76 Aluminium and articles thereof 139.30 571.62 2,728.84 20.9
‘20 Vegetable, fruit, nut, etc food preparations
99.56 412.37 1,392.72 29.6
‘31 Fertilizers 91.66 1,404.84 2,687.60 52.3
‘61 Articles of apparel, accessories, knit or crochet
65.81 1,271.82 2,081.24 61.1
‘81 Other base metals, cermets, articles thereof
61.55 783.37 83.96 933.0
‘08 Edible fruit, nuts, peel of citrus fruit, melons
58.97 1,116.24 895.94 124.6
‘75 Nickel and articles thereof 42.61 183.96 179.97 102.2
‘14 Vegetable plaiting materials, vegetable products nes
39.39 86.31 46.98 183.7
‘57 Carpets and other textile floor coverings
23.17 360.32 358.00 100.6
‘06 Live trees, plants, bulbs, roots, cut flowers etc
14.99 796.67 84.32 944.9
Source: ITC. http://www.trademap.org.
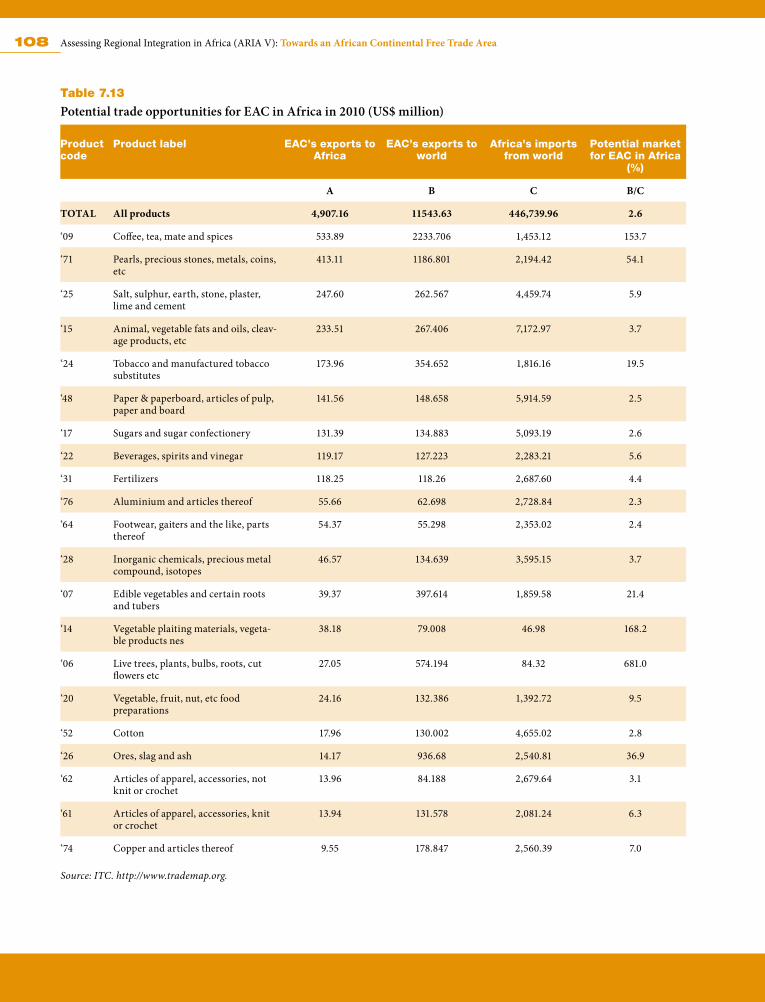
108 Assessing Regional Integration in Africa (ARIA V): Towards an African Continental Free Trade Area
Table 7.13
Potential trade opportunities for EAC in Africa in 2010 (US$ million)
Product code
Product label EAC’s exports to Africa
EAC’s exports to world
Africa’s imports from world
Potential market for EAC in Africa
(%)
A B C B/C
TOTAL All products 4,907.16 11543.63 446,739.96 2.6
‘09 Coffee, tea, mate and spices 533.89 2233.706 1,453.12 153.7
‘71 Pearls, precious stones, metals, coins, etc
413.11 1186.801 2,194.42 54.1
‘25 Salt, sulphur, earth, stone, plaster, lime and cement
247.60 262.567 4,459.74 5.9
‘15 Animal, vegetable fats and oils, cleav-age products, etc
233.51 267.406 7,172.97 3.7
‘24 Tobacco and manufactured tobacco substitutes
173.96 354.652 1,816.16 19.5
‘48 Paper & paperboard, articles of pulp, paper and board
141.56 148.658 5,914.59 2.5
‘17 Sugars and sugar confectionery 131.39 134.883 5,093.19 2.6
‘22 Beverages, spirits and vinegar 119.17 127.223 2,283.21 5.6
‘31 Fertilizers 118.25 118.26 2,687.60 4.4
‘76 Aluminium and articles thereof 55.66 62.698 2,728.84 2.3
‘64 Footwear, gaiters and the like, parts thereof
54.37 55.298 2,353.02 2.4
‘28 Inorganic chemicals, precious metal compound, isotopes
46.57 134.639 3,595.15 3.7
‘07 Edible vegetables and certain roots and tubers
39.37 397.614 1,859.58 21.4
‘14 Vegetable plaiting materials, vegeta-ble products nes
38.18 79.008 46.98 168.2
‘06 Live trees, plants, bulbs, roots, cut flowers etc
27.05 574.194 84.32 681.0
‘20 Vegetable, fruit, nut, etc food preparations
24.16 132.386 1,392.72 9.5
‘52 Cotton 17.96 130.002 4,655.02 2.8
‘26 Ores, slag and ash 14.17 936.68 2,540.81 36.9
‘62 Articles of apparel, accessories, not knit or crochet
13.96 84.188 2,679.64 3.1
‘61 Articles of apparel, accessories, knit or crochet
13.94 131.578 2,081.24 6.3
‘74 Copper and articles thereof 9.55 178.847 2,560.39 7.0
Source: ITC. http://www.trademap.org.
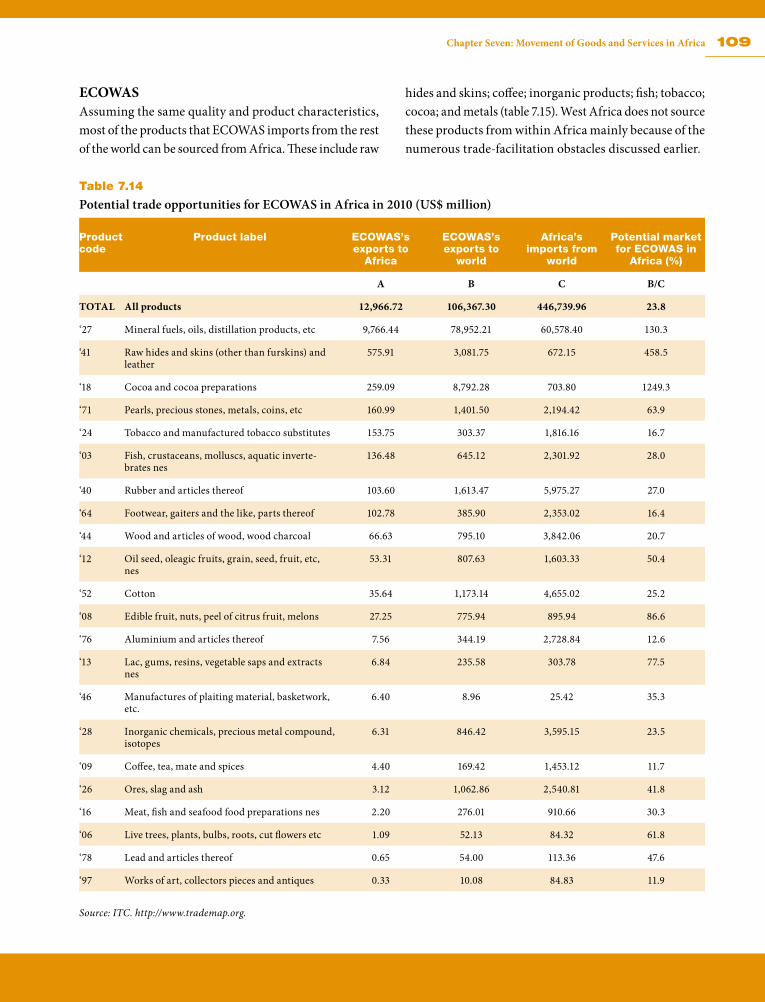
109Chapter Seven: Movement of Goods and Services in Africa
ECOWASAssuming the same quality and product characteristics, most of the products that ECOWAS imports from the rest of the world can be sourced from Africa. These include raw
hides and skins; coffee; inorganic products; fish; tobacco; cocoa; and metals (table 7.15). West Africa does not source these products from within Africa mainly because of the numerous trade-facilitation obstacles discussed earlier.
Table 7.14
Potential trade opportunities for ECOWAS in Africa in 2010 (US$ million)
Product code
Product label ECOWAS’s exports to
Africa
ECOWAS’s exports to
world
Africa’s imports from
world
Potential market for ECOWAS in
Africa (%)
A B C B/C
TOTAL All products 12,966.72 106,367.30 446,739.96 23.8
‘27 Mineral fuels, oils, distillation products, etc 9,766.44 78,952.21 60,578.40 130.3
‘41 Raw hides and skins (other than furskins) and leather
575.91 3,081.75 672.15 458.5
‘18 Cocoa and cocoa preparations 259.09 8,792.28 703.80 1249.3
‘71 Pearls, precious stones, metals, coins, etc 160.99 1,401.50 2,194.42 63.9
‘24 Tobacco and manufactured tobacco substitutes 153.75 303.37 1,816.16 16.7
‘03 Fish, crustaceans, molluscs, aquatic inverte-brates nes
136.48 645.12 2,301.92 28.0
‘40 Rubber and articles thereof 103.60 1,613.47 5,975.27 27.0
‘64 Footwear, gaiters and the like, parts thereof 102.78 385.90 2,353.02 16.4
‘44 Wood and articles of wood, wood charcoal 66.63 795.10 3,842.06 20.7
‘12 Oil seed, oleagic fruits, grain, seed, fruit, etc, nes
53.31 807.63 1,603.33 50.4
‘52 Cotton 35.64 1,173.14 4,655.02 25.2
‘08 Edible fruit, nuts, peel of citrus fruit, melons 27.25 775.94 895.94 86.6
‘76 Aluminium and articles thereof 7.56 344.19 2,728.84 12.6
‘13 Lac, gums, resins, vegetable saps and extracts nes
6.84 235.58 303.78 77.5
‘46 Manufactures of plaiting material, basketwork, etc.
6.40 8.96 25.42 35.3
‘28 Inorganic chemicals, precious metal compound, isotopes
6.31 846.42 3,595.15 23.5
‘09 Coffee, tea, mate and spices 4.40 169.42 1,453.12 11.7
‘26 Ores, slag and ash 3.12 1,062.86 2,540.81 41.8
‘16 Meat, fish and seafood food preparations nes 2.20 276.01 910.66 30.3
‘06 Live trees, plants, bulbs, roots, cut flowers etc 1.09 52.13 84.32 61.8
‘78 Lead and articles thereof 0.65 54.00 113.36 47.6
‘97 Works of art, collectors pieces and antiques 0.33 10.08 84.83 11.9
Source: ITC. http://www.trademap.org.
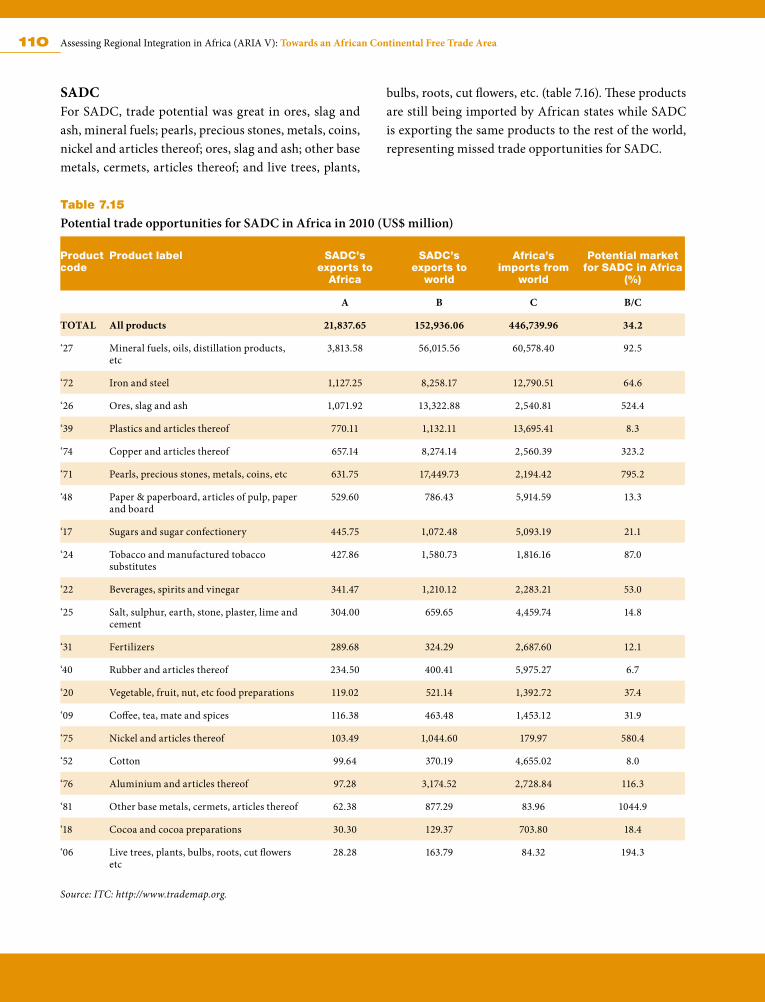
110 Assessing Regional Integration in Africa (ARIA V): Towards an African Continental Free Trade Area
SADCFor SADC, trade potential was great in ores, slag and ash, mineral fuels; pearls, precious stones, metals, coins, nickel and articles thereof; ores, slag and ash; other base metals, cermets, articles thereof; and live trees, plants,
bulbs, roots, cut flowers, etc. (table 7.16). These products are still being imported by African states while SADC is exporting the same products to the rest of the world, representing missed trade opportunities for SADC.
Table 7.15
Potential trade opportunities for SADC in Africa in 2010 (US$ million)
Product code
Product label SADC’s exports to
Africa
SADC’s exports to
world
Africa’s imports from
world
Potential market for SADC in Africa
(%)
A B C B/C
TOTAL All products 21,837.65 152,936.06 446,739.96 34.2
‘27 Mineral fuels, oils, distillation products, etc
3,813.58 56,015.56 60,578.40 92.5
‘72 Iron and steel 1,127.25 8,258.17 12,790.51 64.6
‘26 Ores, slag and ash 1,071.92 13,322.88 2,540.81 524.4
‘39 Plastics and articles thereof 770.11 1,132.11 13,695.41 8.3
‘74 Copper and articles thereof 657.14 8,274.14 2,560.39 323.2
‘71 Pearls, precious stones, metals, coins, etc 631.75 17,449.73 2,194.42 795.2
‘48 Paper & paperboard, articles of pulp, paper and board
529.60 786.43 5,914.59 13.3
‘17 Sugars and sugar confectionery 445.75 1,072.48 5,093.19 21.1
‘24 Tobacco and manufactured tobacco substitutes
427.86 1,580.73 1,816.16 87.0
‘22 Beverages, spirits and vinegar 341.47 1,210.12 2,283.21 53.0
‘25 Salt, sulphur, earth, stone, plaster, lime and cement
304.00 659.65 4,459.74 14.8
‘31 Fertilizers 289.68 324.29 2,687.60 12.1
‘40 Rubber and articles thereof 234.50 400.41 5,975.27 6.7
‘20 Vegetable, fruit, nut, etc food preparations 119.02 521.14 1,392.72 37.4
‘09 Coffee, tea, mate and spices 116.38 463.48 1,453.12 31.9
‘75 Nickel and articles thereof 103.49 1,044.60 179.97 580.4
‘52 Cotton 99.64 370.19 4,655.02 8.0
‘76 Aluminium and articles thereof 97.28 3,174.52 2,728.84 116.3
‘81 Other base metals, cermets, articles thereof 62.38 877.29 83.96 1044.9
‘18 Cocoa and cocoa preparations 30.30 129.37 703.80 18.4
‘06 Live trees, plants, bulbs, roots, cut flowers etc
28.28 163.79 84.32 194.3
Source: ITC: http://www.trademap.org.
111Chapter Seven: Movement of Goods and Services in Africa
7.8 Conclusion
Many African countries have taken measures to ease the movement of goods and services within their respective REC. Many are signatories to bilateral and regional agree-ments to reduce and eliminate tariffs and NTBs. RECs have generally used a gradual tariff phase down, although implementation has varied. Yet despite encouraging com-mitments to remove tariffs and NTBs, intra-regional trade remains weak and much needs to be done to eliminate NTBs, robustly. This is especially important as Africa has the potential to supply its import needs from its own sources in some product categories, particularly fuels, beverages and tobacco, ores, metals and precious stones.
Infrastructure development is also a priority for most RECs and all of them have policies for developing in-ter-REC cross-border transport, ICT connection, water transport and power supply. Most African countries are therefore fully aware of their infrastructure development needs, yet implementation often lags far behind. Lack of funding is one issue; weak policy coordination another.
In conclusion, in establishing an African CFTA, countries need to adopt progressive measures and frameworks at the continental level, but with short time-frames and tight enforcement.
Annex.
A7.1 Scope of trade complementarity
Chauvin and Gaulier (2002) noted that Africa is character-ized by a small base of intra-industry trade mainly because exports from many sub-Saharan African countries are highly concentrated in very similar primary products and because their common characteristics preclude gains from their exchange. They realized that while production shar-ing and intra-industry trade can be an important factor for promoting regional integration, there is no evidence that they are occurring in Africa.
In considering establishing a CFTA, it is crucial to set the scope of increasing intra-African trade based on an assessment of production and trade complementarity. On the one hand, if production and trade are complementary among partner states, the potential of an CFTA increasing intra-Africa trade is high; where production structures and traded goods are similar or competitive, the potential of the CFTA to enhance intra Africa trade is limited. To establish the level of production and trade complemen-tarity in Africa we use a number of SITC indices with data from UNCTADstat. Specifically, we calculate the regional orientation index, and the revealed comparative advantage and complementarity indices.
Regional orientation indexBefore Africa’s leaders set up an FTA it is critical to assess whether African countries’ exports of particular products are more inclined towards the African market than to other destinations. To do this, we calculate the regional orientation index, a variant of the revealed comparative advantage index. This index attempts to show the extent of a regional bias in exports at sectoral level. The index is formed by taking the ratio of the share of intra-regional trade to extra-regional trade. It is calculated using the formula below:
. . . . . . . . . . . . . . . . . . . . . . . . . . . . 1
where s is the source country, i is the industry, and d is the region of interest and n is the set of all other countries. The index must lie between 0 and ∞, with values greater than 1 revealing a regional bias. Table A7.1 shows Africa’s exports of various products to Africa and to the world.
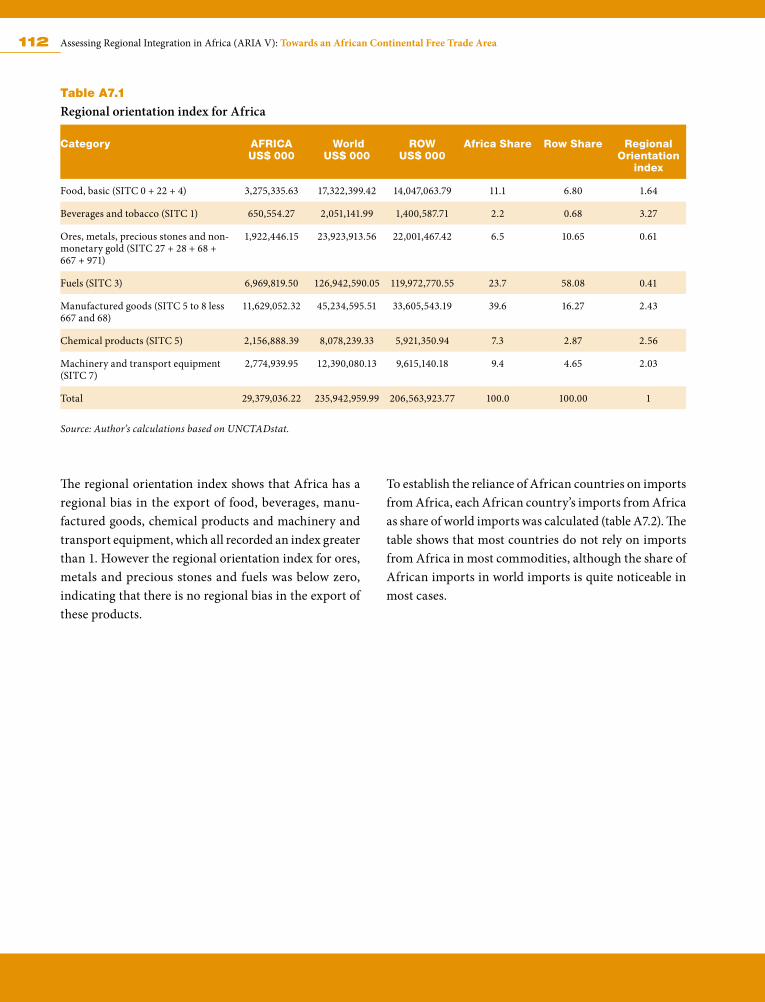
112 Assessing Regional Integration in Africa (ARIA V): Towards an African Continental Free Trade Area
Table A7.1
Regional orientation index for Africa
Category AFRICA US$ 000
WorldUS$ 000
ROWUS$ 000
Africa Share Row Share Regional Orientation
index
Food, basic (SITC 0 + 22 + 4) 3,275,335.63 17,322,399.42 14,047,063.79 11.1 6.80 1.64
Beverages and tobacco (SITC 1) 650,554.27 2,051,141.99 1,400,587.71 2.2 0.68 3.27
Ores, metals, precious stones and non-monetary gold (SITC 27 + 28 + 68 + 667 + 971)
1,922,446.15 23,923,913.56 22,001,467.42 6.5 10.65 0.61
Fuels (SITC 3) 6,969,819.50 126,942,590.05 119,972,770.55 23.7 58.08 0.41
Manufactured goods (SITC 5 to 8 less 667 and 68)
11,629,052.32 45,234,595.51 33,605,543.19 39.6 16.27 2.43
Chemical products (SITC 5) 2,156,888.39 8,078,239.33 5,921,350.94 7.3 2.87 2.56
Machinery and transport equipment (SITC 7)
2,774,939.95 12,390,080.13 9,615,140.18 9.4 4.65 2.03
Total 29,379,036.22 235,942,959.99 206,563,923.77 100.0 100.00 1
Source: Author’s calculations based on UNCTADstat.
The regional orientation index shows that Africa has a regional bias in the export of food, beverages, manu-factured goods, chemical products and machinery and transport equipment, which all recorded an index greater than 1. However the regional orientation index for ores, metals and precious stones and fuels was below zero, indicating that there is no regional bias in the export of these products.
To establish the reliance of African countries on imports from Africa, each African country’s imports from Africa as share of world imports was calculated (table A7.2). The table shows that most countries do not rely on imports from Africa in most commodities, although the share of African imports in world imports is quite noticeable in most cases.
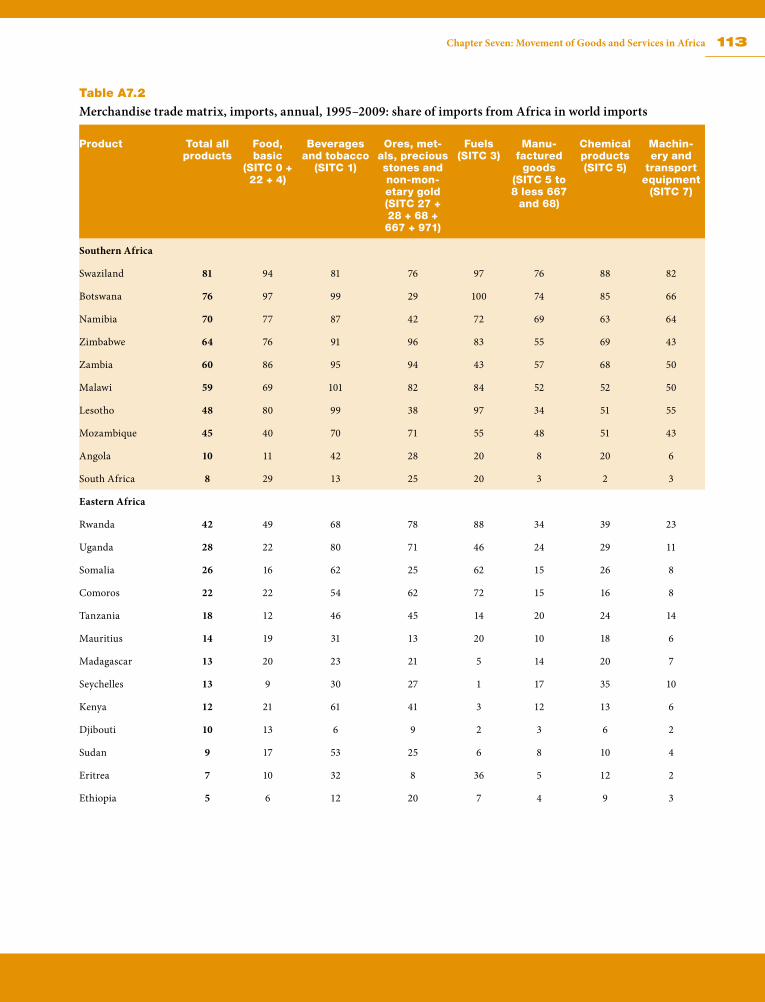
113Chapter Seven: Movement of Goods and Services in Africa
Table A7.2
Merchandise trade matrix, imports, annual, 1995–2009: share of imports from Africa in world imports
Product Total all products
Food, basic
(SITC 0 + 22 + 4)
Beverages and tobacco
(SITC 1)
Ores, met-als, precious stones and non-mon-etary gold (SITC 27 + 28 + 68 + 667 + 971)
Fuels (SITC 3)
Manu-factured
goods (SITC 5 to 8 less 667
and 68)
Chemical products (SITC 5)
Machin-ery and
transport equipment
(SITC 7)
Southern Africa
Swaziland 81 94 81 76 97 76 88 82
Botswana 76 97 99 29 100 74 85 66
Namibia 70 77 87 42 72 69 63 64
Zimbabwe 64 76 91 96 83 55 69 43
Zambia 60 86 95 94 43 57 68 50
Malawi 59 69 101 82 84 52 52 50
Lesotho 48 80 99 38 97 34 51 55
Mozambique 45 40 70 71 55 48 51 43
Angola 10 11 42 28 20 8 20 6
South Africa 8 29 13 25 20 3 2 3
Eastern Africa
Rwanda 42 49 68 78 88 34 39 23
Uganda 28 22 80 71 46 24 29 11
Somalia 26 16 62 25 62 15 26 8
Comoros 22 22 54 62 72 15 16 8
Tanzania 18 12 46 45 14 20 24 14
Mauritius 14 19 31 13 20 10 18 6
Madagascar 13 20 23 21 5 14 20 7
Seychelles 13 9 30 27 1 17 35 10
Kenya 12 21 61 41 3 12 13 6
Djibouti 10 13 6 9 2 3 6 2
Sudan 9 17 53 25 6 8 10 4
Eritrea 7 10 32 8 36 5 12 2
Ethiopia 5 6 12 20 7 4 9 3
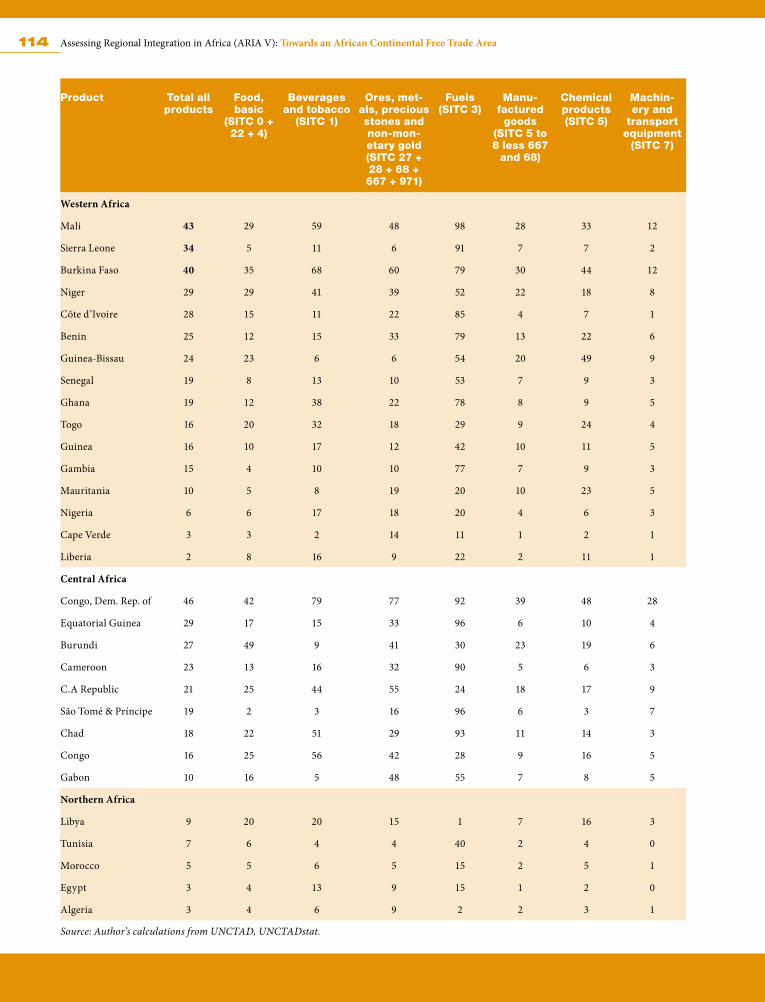
114 Assessing Regional Integration in Africa (ARIA V): Towards an African Continental Free Trade Area
Product Total all products
Food, basic
(SITC 0 + 22 + 4)
Beverages and tobacco
(SITC 1)
Ores, met-als, precious stones and non-mon-etary gold (SITC 27 + 28 + 68 + 667 + 971)
Fuels (SITC 3)
Manu-factured
goods (SITC 5 to 8 less 667
and 68)
Chemical products (SITC 5)
Machin-ery and
transport equipment
(SITC 7)
Western Africa
Mali 43 29 59 48 98 28 33 12
Sierra Leone 34 5 11 6 91 7 7 2
Burkina Faso 40 35 68 60 79 30 44 12
Niger 29 29 41 39 52 22 18 8
Côte d’Ivoire 28 15 11 22 85 4 7 1
Benin 25 12 15 33 79 13 22 6
Guinea-Bissau 24 23 6 6 54 20 49 9
Senegal 19 8 13 10 53 7 9 3
Ghana 19 12 38 22 78 8 9 5
Togo 16 20 32 18 29 9 24 4
Guinea 16 10 17 12 42 10 11 5
Gambia 15 4 10 10 77 7 9 3
Mauritania 10 5 8 19 20 10 23 5
Nigeria 6 6 17 18 20 4 6 3
Cape Verde 3 3 2 14 11 1 2 1
Liberia 2 8 16 9 22 2 11 1
Central Africa
Congo, Dem. Rep. of 46 42 79 77 92 39 48 28
Equatorial Guinea 29 17 15 33 96 6 10 4
Burundi 27 49 9 41 30 23 19 6
Cameroon 23 13 16 32 90 5 6 3
C.A Republic 21 25 44 55 24 18 17 9
São Tomé & Príncipe 19 2 3 16 96 6 3 7
Chad 18 22 51 29 93 11 14 3
Congo 16 25 56 42 28 9 16 5
Gabon 10 16 5 48 55 7 8 5
Northern Africa
Libya 9 20 20 15 1 7 16 3
Tunisia 7 6 4 4 40 2 4 0
Morocco 5 5 6 5 15 2 5 1
Egypt 3 4 13 9 15 1 2 0
Algeria 3 4 6 9 2 2 3 1
Source: Author’s calculations from UNCTAD, UNCTADstat.
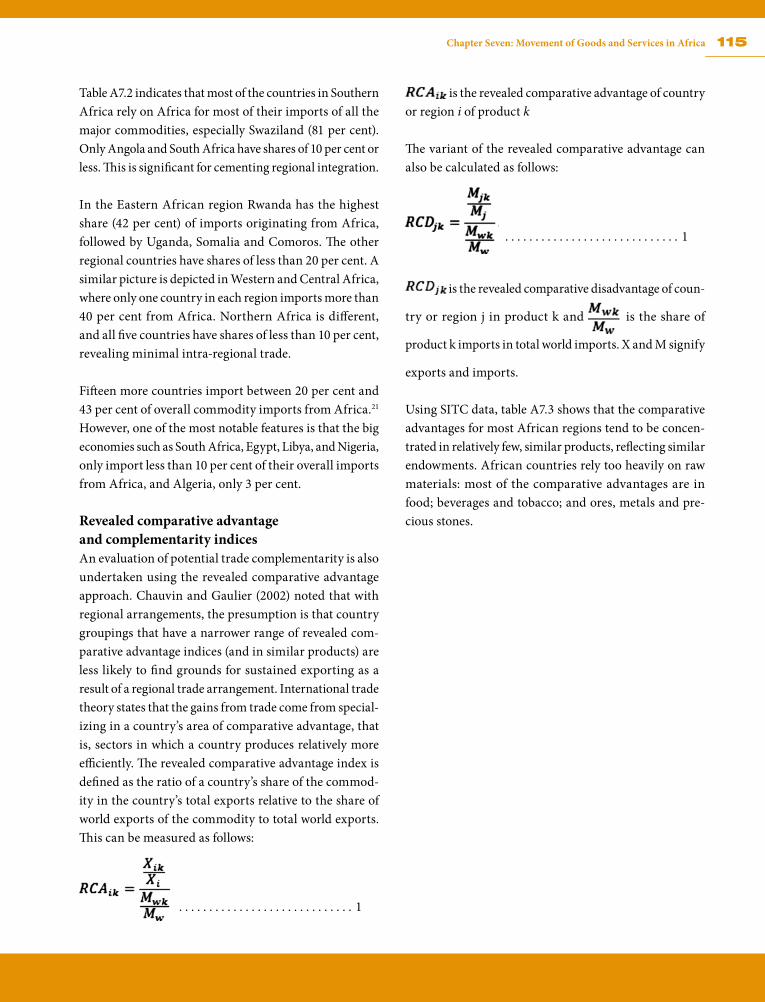
115Chapter Seven: Movement of Goods and Services in Africa
Table A7.2 indicates that most of the countries in Southern Africa rely on Africa for most of their imports of all the major commodities, especially Swaziland (81 per cent). Only Angola and South Africa have shares of 10 per cent or less. This is significant for cementing regional integration.
In the Eastern African region Rwanda has the highest share (42 per cent) of imports originating from Africa, followed by Uganda, Somalia and Comoros. The other regional countries have shares of less than 20 per cent. A similar picture is depicted in Western and Central Africa, where only one country in each region imports more than 40 per cent from Africa. Northern Africa is different, and all five countries have shares of less than 10 per cent, revealing minimal intra-regional trade.
Fifteen more countries import between 20 per cent and 43 per cent of overall commodity imports from Africa.21 However, one of the most notable features is that the big economies such as South Africa, Egypt, Libya, and Nigeria, only import less than 10 per cent of their overall imports from Africa, and Algeria, only 3 per cent.
Revealed comparative advantage and complementarity indicesAn evaluation of potential trade complementarity is also undertaken using the revealed comparative advantage approach. Chauvin and Gaulier (2002) noted that with regional arrangements, the presumption is that country groupings that have a narrower range of revealed com-parative advantage indices (and in similar products) are less likely to find grounds for sustained exporting as a result of a regional trade arrangement. International trade theory states that the gains from trade come from special-izing in a country’s area of comparative advantage, that is, sectors in which a country produces relatively more efficiently. The revealed comparative advantage index is defined as the ratio of a country’s share of the commod-ity in the country’s total exports relative to the share of world exports of the commodity to total world exports. This can be measured as follows:
. . . . . . . . . . . . . . . . . . . . . . . . . . . . . 1
is the revealed comparative advantage of country or region i of product k
The variant of the revealed comparative advantage can also be calculated as follows:
. . . . . . . . . . . . . . . . . . . . . . . . . . . . . 1
is the revealed comparative disadvantage of coun-
try or region j in product k and is the share of
product k imports in total world imports. X and M signify
exports and imports.
Using SITC data, table A7.3 shows that the comparative advantages for most African regions tend to be concen-trated in relatively few, similar products, reflecting similar endowments. African countries rely too heavily on raw materials: most of the comparative advantages are in food; beverages and tobacco; and ores, metals and pre-cious stones.
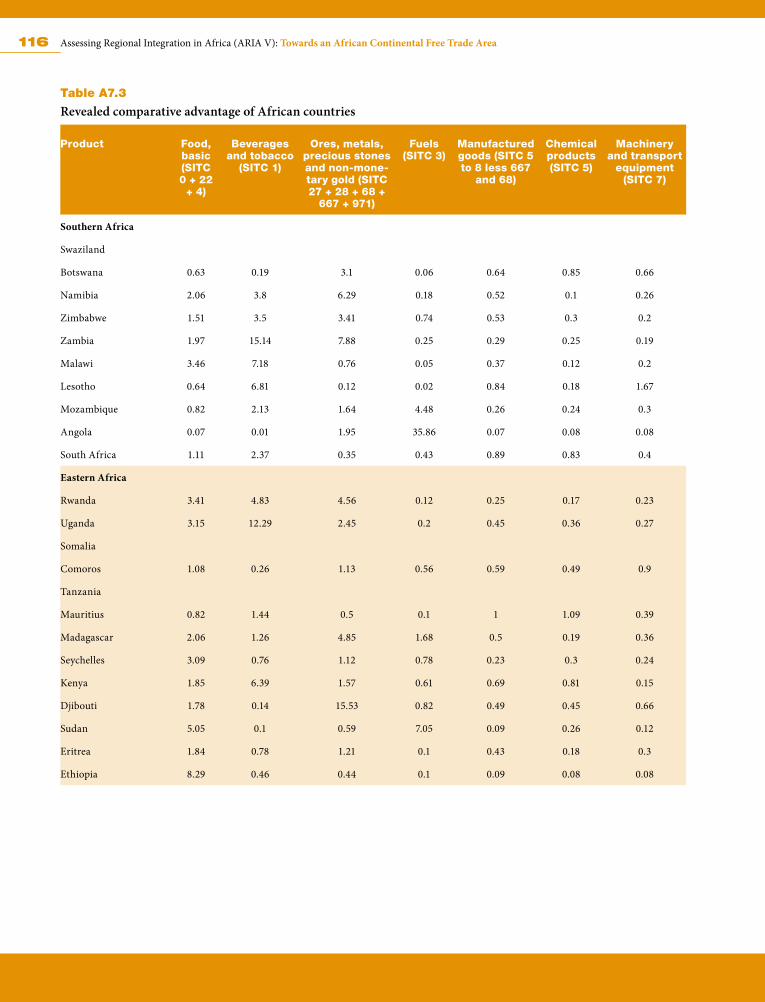
116 Assessing Regional Integration in Africa (ARIA V): Towards an African Continental Free Trade Area
Table A7.3
Revealed comparative advantage of African countries
Product Food, basic (SITC 0 + 22
+ 4)
Beverages and tobacco
(SITC 1)
Ores, metals, precious stones and non-mone-tary gold (SITC 27 + 28 + 68 +
667 + 971)
Fuels (SITC 3)
Manufactured goods (SITC 5 to 8 less 667
and 68)
Chemical products (SITC 5)
Machinery and transport
equipment (SITC 7)
Southern Africa
Swaziland
Botswana 0.63 0.19 3.1 0.06 0.64 0.85 0.66
Namibia 2.06 3.8 6.29 0.18 0.52 0.1 0.26
Zimbabwe 1.51 3.5 3.41 0.74 0.53 0.3 0.2
Zambia 1.97 15.14 7.88 0.25 0.29 0.25 0.19
Malawi 3.46 7.18 0.76 0.05 0.37 0.12 0.2
Lesotho 0.64 6.81 0.12 0.02 0.84 0.18 1.67
Mozambique 0.82 2.13 1.64 4.48 0.26 0.24 0.3
Angola 0.07 0.01 1.95 35.86 0.07 0.08 0.08
South Africa 1.11 2.37 0.35 0.43 0.89 0.83 0.4
Eastern Africa
Rwanda 3.41 4.83 4.56 0.12 0.25 0.17 0.23
Uganda 3.15 12.29 2.45 0.2 0.45 0.36 0.27
Somalia
Comoros 1.08 0.26 1.13 0.56 0.59 0.49 0.9
Tanzania
Mauritius 0.82 1.44 0.5 0.1 1 1.09 0.39
Madagascar 2.06 1.26 4.85 1.68 0.5 0.19 0.36
Seychelles 3.09 0.76 1.12 0.78 0.23 0.3 0.24
Kenya 1.85 6.39 1.57 0.61 0.69 0.81 0.15
Djibouti 1.78 0.14 15.53 0.82 0.49 0.45 0.66
Sudan 5.05 0.1 0.59 7.05 0.09 0.26 0.12
Eritrea 1.84 0.78 1.21 0.1 0.43 0.18 0.3
Ethiopia 8.29 0.46 0.44 0.1 0.09 0.08 0.08
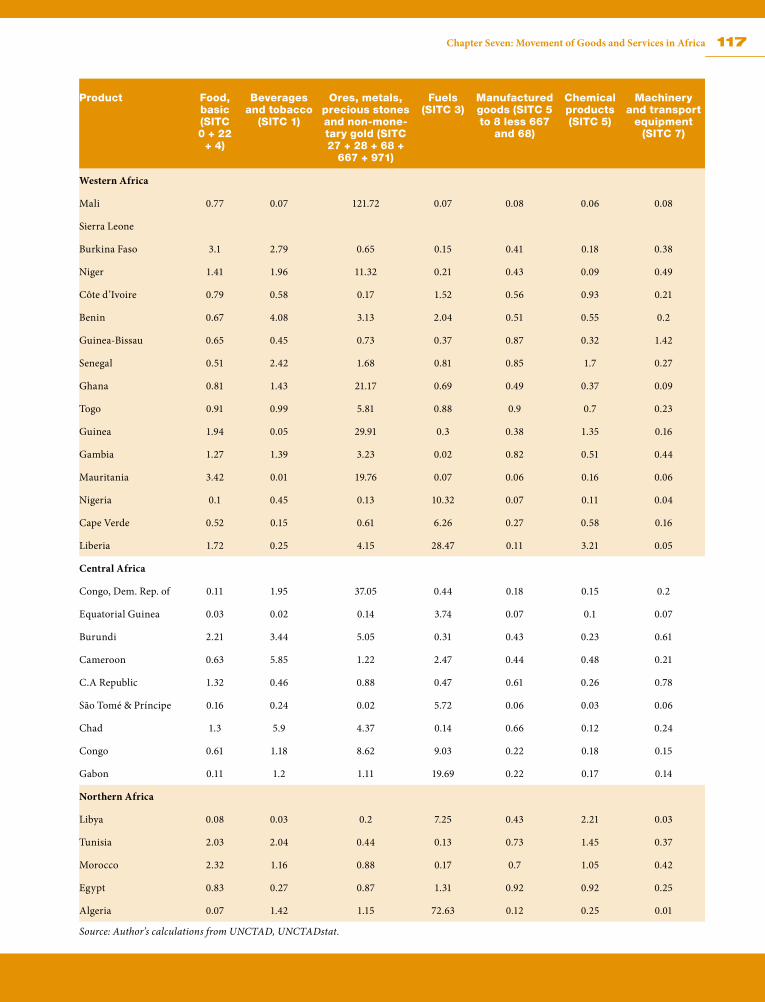
117Chapter Seven: Movement of Goods and Services in Africa
Product Food, basic (SITC 0 + 22
+ 4)
Beverages and tobacco
(SITC 1)
Ores, metals, precious stones and non-mone-tary gold (SITC 27 + 28 + 68 +
667 + 971)
Fuels (SITC 3)
Manufactured goods (SITC 5 to 8 less 667
and 68)
Chemical products (SITC 5)
Machinery and transport
equipment (SITC 7)
Western Africa
Mali 0.77 0.07 121.72 0.07 0.08 0.06 0.08
Sierra Leone
Burkina Faso 3.1 2.79 0.65 0.15 0.41 0.18 0.38
Niger 1.41 1.96 11.32 0.21 0.43 0.09 0.49
Côte d’Ivoire 0.79 0.58 0.17 1.52 0.56 0.93 0.21
Benin 0.67 4.08 3.13 2.04 0.51 0.55 0.2
Guinea-Bissau 0.65 0.45 0.73 0.37 0.87 0.32 1.42
Senegal 0.51 2.42 1.68 0.81 0.85 1.7 0.27
Ghana 0.81 1.43 21.17 0.69 0.49 0.37 0.09
Togo 0.91 0.99 5.81 0.88 0.9 0.7 0.23
Guinea 1.94 0.05 29.91 0.3 0.38 1.35 0.16
Gambia 1.27 1.39 3.23 0.02 0.82 0.51 0.44
Mauritania 3.42 0.01 19.76 0.07 0.06 0.16 0.06
Nigeria 0.1 0.45 0.13 10.32 0.07 0.11 0.04
Cape Verde 0.52 0.15 0.61 6.26 0.27 0.58 0.16
Liberia 1.72 0.25 4.15 28.47 0.11 3.21 0.05
Central Africa
Congo, Dem. Rep. of 0.11 1.95 37.05 0.44 0.18 0.15 0.2
Equatorial Guinea 0.03 0.02 0.14 3.74 0.07 0.1 0.07
Burundi 2.21 3.44 5.05 0.31 0.43 0.23 0.61
Cameroon 0.63 5.85 1.22 2.47 0.44 0.48 0.21
C.A Republic 1.32 0.46 0.88 0.47 0.61 0.26 0.78
São Tomé & Príncipe 0.16 0.24 0.02 5.72 0.06 0.03 0.06
Chad 1.3 5.9 4.37 0.14 0.66 0.12 0.24
Congo 0.61 1.18 8.62 9.03 0.22 0.18 0.15
Gabon 0.11 1.2 1.11 19.69 0.22 0.17 0.14
Northern Africa
Libya 0.08 0.03 0.2 7.25 0.43 2.21 0.03
Tunisia 2.03 2.04 0.44 0.13 0.73 1.45 0.37
Morocco 2.32 1.16 0.88 0.17 0.7 1.05 0.42
Egypt 0.83 0.27 0.87 1.31 0.92 0.92 0.25
Algeria 0.07 1.42 1.15 72.63 0.12 0.25 0.01
Source: Author’s calculations from UNCTAD, UNCTADstat.
118 Assessing Regional Integration in Africa (ARIA V): Towards an African Continental Free Trade Area
Almost all the countries with available data have com-parative advantage in food, especially in Southern Africa. Malawi is the most efficient country (3.46), followed by Namibia, Zambia, Zimbabwe and South Africa. Botswana, Lesotho and Mozambique are inefficient in producing food. Seven countries in the region have comparative advantages in production of beverages and tobacco, with Zambia having the highest (15.4). All countries also have significant efficiencies in production of ores, metals and precious stones, except for Lesotho, South Africa and Malawi. In Southern Africa only Angola (35.86) and Mo-zambique (4.48) have comparative advantage in fuel. All countries have significant inefficiencies in producing manufactured goods, chemical goods and machinery and equipment.
In other regions, too, countries often have a comparative advantage in a few, similar, products. Some countries have significant comparative advantages in fuels: three out of five do in Northern Africa—Algeria (72.63), Libya (7.25) and Egypt (1.31). North African countries also have some comparative advantages in chemical products.
The whole continent indicates comparative disadvantage in manufactured products and in machinery and trans-port, indicating inefficiencies in producing value-added products. This will seriously affect prospects towards a CFTA, as countries are likely to continue relying on foreign imports of the machinery and transport.
Africa has little intra-industry trade, which is partly be-cause most African countries’ exports are concentrated in very similar primary products and their common characteristics preclude gains from their exchange. Intra-industry trade is also affected by logistical and transport challenges. Production sharing and intra-industry trade can promote continental integration, but, similar to Chau-vin and Gaulier (2002), we find no convincing evidence that they are happening in Africa.
Trade complementarity among African countriesAnalysing trade complementarity is important to get a measure of how a country’s (or region’s) export supply fits into the import demand of its trading partners. Trade
complementarily is determined by the structure of pro-duction and the composition of demand in the countries concerned. This section assesses how much products in which African countries are relatively strong in exporting into Africa, coincide with products African countries are relatively dependent on as imports.
To gauge the complementarity of trade a trade comple-mentarity index (TCI) can be designed to summarise certain aspects of sectoral trade. The index can be cal-culated as follows;
. . . . . . . 1
where is the trade complementarity index between country i and country j.
This index considers both exports and imports. In this case, it calculates the African countries’ export commod-ity profile versus other countries’ import commodity profiles relative to the world. The TCI has a threshold of one with an index greater (lower) than one indicating a greater (lower) level of complementarity between trade commodity profiles.
This discussion uses a different measure—a trade comple-mentarity score—to capture a similar aspect of trade rela-tions between pairs of countries. The score between and exporter country i and an importer country j is defined as;
. . . . . . 1
This alternative measure captures how a country’s export structure is measured against the world average, using the traditional concept of revealed comparative advantage as defined by Bela Balassa. The measure is weighted by the product’s share in the country’s total exports ( ). In this way, as observed by the World Bank (2004), it high-lights those products on which a country is significantly dependent for its exports (relative to the world average) and which account for a large share of the country’s total
119Chapter Seven: Movement of Goods and Services in Africa
exports. An analogous feature is embedded in the meas-urement of the importing country using (RCAM), which is the import analogue of the RCA and (import share) as the weighting factor. Log transformation is used to smooth out extreme figures.
Thus this alternative measure takes into account the im-port-export complementarity in trade structures of two countries relative to the rest of the world. In addition, the complementarity is weighted by product shares in each country’s exports/imports.
A matrix of complementarity between African countries as exporters and importers essentially represents goodness of fit of a particular African country’s import profile relative to a particular African country’s export profile relative to the world as a whole, applying revealed comparative advantage to African countries as exporters and the im-port analogy to the countries as importers. Most African countries have lower levels of complementarity between their commodity profiles. The lower complementarity score indicates that there are fewer products in which both countries are, respectively, a significant exporter and importer and have high shares in their respective trade profiles.
A few country pairs, however, revealed some complemen-tarity between their commodity profiles, including Benin and Libya (with a complementarity score of 2.2), Ghana and Libya (2.9), Mozambique and Libya (2.7), Mada-gascar and Angola (1.2), Djibouti and Angola (1.0) and Togo and Angola (1.1). Yet this does not provide in-depth information on trade’s potential. Africa relies heavily on export of primary commodities and the scope for trade between African countries on these products is limited as the natural trading partners for primary products are industrialized countries. Thus the dominance of primary products in Africa’s productive structure constraints the development of trade between them. This lack of comple-mentarity could be due to high levels of trade barriers across Africa and narrowly diversified trade structures.
Low complementarities will persist until the completion of an CFTA,22 and the similarity in African exports is likely to limit any increase in intra-African trade in the
short to medium term, even if the continent overcomes the institutional and infrastructure constraints. Most products exported by African countries are mainly pri-mary commodities, and these are not the main imports of these countries—they consist of manufactures and capital goods, mainly sourced from Europe and other industrialized trading partners.
Africa’s current imports of manufactures, machinery and equipment cannot be domestically produced to expand intra-African trade because most countries lack the capac-ity to do so and hence require a long periods to develop more diversified economies. And African countries need a more diversified export base, as this will enable them to produce a wide range of products that can be exchanged with CFTA members. With only a limited number of such goods, CFTA countries may have to rely heavily on third parties for a high share of their key imports (and as destinations for their main exports), which is likely to seriously undermine commitment to the arrangement.
Despite these low complementarity indices, there is a potential to expand intra-African trade, especially in verti-cally differentiated goods. South Africa, for instance, could specialize in high-quality food products, while importing middle- and low-range products from regional partners.
Yet there might be a need to look beyond the comple-mentarity indices as they might be biased and thus tend to underestimate trade in so far as trade restrictions for certain goods exist, especially on sensitive goods. Given Africa’s numerous trade barriers, the complementarity index can give us a guideline on existing trade but it can-not give a clear picture of potential trade. Those goods that are restricted through immense trade barriers, such as costs of transport, might be the source of trade comple-mentarity. Hence a CFTA might be beneficial in bringing down those trade barriers which will in turn facilitate more trade between member countries and improve trade complementarities.
120 Assessing Regional Integration in Africa (ARIA V): Towards an African Continental Free Trade Area
References
Abdoulahi, M. 2005. Progress report on regional integra-tion efforts in Africa towards the promotion of intra-African trade. http://www.uneca.org/atpc/Work%20in%20progress/30.pdf.
Abuka, C.A. 2005. “An empirical analysis of the impact of trade on productivity in South Africa’s man-ufacturing sector.” Doctoral Thesis, University of Pretoria, Pretoria, South Africa. http://upetd.up.ac.za/thesis/available/etd-04182005-135116/unrestricted/00front.pdf.
ACBF (African Capacity Building Foundation). 2008. A survey of the capacity needs of Africa’s regional economic communities. Harare, Zimbabwe.
AfDB (African Development Bank). 2010a. Report on Session 1, “Global and Regional Outlook on AfT,” of the ECOWAS aid for trade review meeting. Abuja, Nigeria, January 27.
———. 2010b. Eastern Africa regional integration strategy paper 2011–2015. Tunis.
———. 2011a. Southern Africa regional integration strategy paper 2011–2015. Tunis.
Alaba, O.B. 2006. “Non-tariff barriers to trade flows source: EU-ECOWAS EPA: regional integration, trade facilitation and development in West Africa.” A draft paper for presentation at the Global Trade Analysis Project conference, United Nations Eco-nomic Commission for Africa, Addis Ababa, June 15–17.
Amjadi, A., and A.J. Yeats. 1995. “Have transport costs contributed to the relative decline of Sub-Saharan African exports?” Policy Research Working Paper 1559. World Bank, Washington, DC.
ADB (Asian Development Bank). 2010. Methodology for Impact Assessment of Free Trade Agreements. Manila.
AU (African Union). 2010. “Trade liberalization, invest-ment and economic integration in African regional economic communities towards the African com-mon market and economic community.” AU Confer-ence of Ministers of Trade, 6th Ordinary Session, Kigali, Rwanda, October 29–November 2.
AU/NEPAD (The New Partnership for African Develop-ment). 2011. Revision of the AU/NEPAD African action plan 2010–2015: advancing regional and con-tinental integration together through shared values. Abridged Report 2010–2012. Johannesburg.
Buys, P., Deichmann, U., & Wheeler, D. (2006) Road Net-work Upgrading and Overland Trade Expansion in Sub-Saharan Africa. Development Research Group, World Bank. Retrieved from http://www.cgdev.org/doc/event%20docs/TransAfrica%20Network%20%28Color%20Version%29.pdf
Chauvin S, and G. Gaulier. 2002. “Regional trade integra-tion in Southern Africa.” Working Paper 2002-12. Centre d’Etudes Prospectives et d’Informations Internationales, Paris.
Gibb, R. 2006. “Rationalisation or redundancy? Making Eastern & Southern Africa’s regional trade units relevant.” Discussion Paper 3/2006. The Brenthurst Foundation, Johannesburg. http://www.thebren-thurstfoundation.org/Files/Brenthurst_Commi-sioned_Reports/BD0603_Regional_Integration.pdf.
IGAD (Intergovernmental Authority on Development). 2010. Annual report 2009. Djibouti City, Djibouti. http://igad.int/attachments/257_IGAD%20AR%202009-Final+covers.pdf.
JICA (Japan International Cooperation Agency). 2009. The research on the cross-border transport infrastructure: Phase 3. Final Report. Mitsubishi UFJ Research and Consulting Co., Ltd., Tokyo.
121Chapter Seven: Movement of Goods and Services in Africa
Karingizi, S. 2003. “Regional procurement reform ini-tiative.” COMESA Secretariat. Forum on Public Procurement Reform, Dar es Salaam, Tanzania, January 14–17.
Limao, N., and A. Venables. 2000. “Infrastructure, geo-graphical disadvantage and transport costs.” Mimeo. World Bank, Washington, DC; Columbia University, New York.
Nhara, A. 2006. SADC and COMESA integration: sepa-rating myth from reality. Trade and Development Studies Centre, Harare, Zimbabwe.
Oyejide, A., and D. Njinkeu. 2001. “Implementation Of The trade liberalization programs of African re-gional integration arrangements.” Paper Prepared for the 4th Ordinary Session of the Conference of Ministers of Trade of the OAU/AEC, Abuja, Nigeria, September 19–23. AERC, Nairobi.
Peridy, N. 2005. “Towards a pan-Arab free trade area: Assessing trade potential effects of the Agadir Agree-ment.” The Developing Economies 43 (3): 329–45.
SADC (Southern African Development Community). 2010. “Energy in Southern Africa: Energy Policy Brief No. 1.” Southern Africa Today. http://www.reeep.org/file_upload/5368_tmpphp9CSdOC.pdf.
Stahl, H.M. 2005. “Tariff liberalisation impacts of the EAC customs union in perspective.” Working Paper 4/2005. Trade Law Centre for Southern Africa, Cape Town, South Africa.
Teravaninthorn, S., and G. Raballand. 2008. Transport prices and costs in Africa: a review of the main inter-national corridors. Washington, DC: World Bank.
UNCTAD (United Nations Conference Trade and De-velopment). 2004. Trade and Development Report, New York and Geneva. http://www.unctad.org/en/docs/tdr2004_en.pdf .
______. 2009. Economic development in Africa: strength-ening regional economic integration for Africa’s de-velopment. Geneva. http://www.unctad.org/en/docs/tdb56d4_en.pdf.
———. 2011. Recent developments in key commodity mar-kets: trends and challenges. Geneva. www.unctad.info/upload/SUC/MYEM2011/Trends_Challenges.pdf.
UNDP (United Nations Development Programme). 2011. Regional integration and human development: a pathway for Africa. New York.
UNECA (United Nations Economic Commission for Af-rica). 2004. Assessing regional integration in Africa. Addis Ababa. http://www.uneca.org/aria1/.
———. 2006. Assessing regional integration in Africa II: rationalizing regional economic communities. Addis Ababa. http://www.uneca.org/aria2/full_version.pdf.
———. 2007. “Assessment of progress on regional inte-gration in Africa.” Fifth Session of the Committee on Trade, Regional Cooperation and Integration, Addis Ababa, October 8–10.
———. 2008. Assessing regional integration in Africa III: towards monetary and financial integration in Africa. Addis Ababa. http://www.uneca.org/aria3/ARIA3_ENG.pdf.
———. 2010. Assessing regional integration in Africa IV: enhancing intra-African trade. Addis Ababa. http://www.uneca.org/aria4/ARIA4Full.pdf.
World Bank. 2004. “Patterns of Africa–Asia trade and investment: potential for ownership and partner-ship.” Asia-Africa Trade and Investment Conference. Tokyo, November 1–2.
122 Assessing Regional Integration in Africa (ARIA V): Towards an African Continental Free Trade Area
Notes1 Political instability, lack of economic diversification, poor infra-
structure, weak implementation of commonly agreed protocols and decisions, absence of compensation mechanisms, lack of private sector involvement, paltry financial and administrative resources, weak and divergent macro-economic environments, multiple protocols and overlapping membership and lack of harmonized instruments.
2 CEN-SAD, COMESA, EAC, ECCAS, ECOWAS, IGAD, SADC and UMA.
3 The rest of the RECs are EMAC, CEPGAL, IOC, MRU, SACU and UMOA
4 Algeria, Cape Verde, Morocco, Mozambique, Mauritania, São Tomé and Príncipe, Somalia and Tunisia.
5 In 2009, the SADC Committee of Ministers of Trade approved guidelines for accession to the trade protocol to facilitate member states who are not yet party to it.
6 www.bilaterals.org.7 Alaba (2006) classified NTBs into official (government sanctioned)
and unofficial barriers. Official NTBs include government instru-ments such as import prohibition and quota restrictions. Unofficial NTBs that directly impede trade include bureaucracy, corrup-tion in customs processes, slow port operations, poor roads and communication infrastructure, wastage and theft at ports, poor storage conditions, harassment by police and other personnel at numerous road blocks within the region, and inter-country pay-ment difficulties.
8 http://ntb.africanet.com.9 For most African RECs, the origin requirement of the goods is
based on the minimum share of the domestic value added or the maximum share of the imported input in the total product value.
10 http://www.etls.ecowas.int/procedures.php.11 They inspired COMESA member states to slightly relax their rules
of origin in order to match them.
12 Benin, Côte d’Ivoire, Djibouti, Kenya, Niger, Senegal, Togo, Uganda, Zambia and Zimbabwe.
13 Algeria, Angola, Egypt, Libya, Nigeria, Morocco and South Africa.14 Some other countries that import more than 40 per cent of their
total imports from Africa are the Democratic Republic of Congo with 49.3 per cent, Mali 45.5 per cent and Somalia 41.6 per cent.
15 Lesotho, Mali, Niger, Zambia, Botswana, Chad, Burkina Faso, Djibouti and Zimbabwe.
16 Mineral fuels, oils, distillation products; machinery, nuclear reac-tors, boilers; motor vehicles; iron and steel; electrical, electronic equipment; cereals; articles of iron or steel; fertilizers; paper and paper board and plastics.
17 Mineral fuels; oils, distillation products; ores and slags; copper and articles; salt, sulphur, earth, stone, lime and cement; tobacco and manufactured tobacco products; sugars and sugar refinery contributes.
18 For further information see http://www.usaid.gov/missions/warp/ecintegration/wapp/
19 A combination of roads (such as TANZAM between Dar es Salaam and Lusaka), railways (TAZARA—Dar es Salaam to Kapiri Mposhi and Dar es Salaam to Lusaka) and pipeline (TAZAMA).
20 Djibouti, Egypt, Eritrea, Kenya, Libya and Sudan are also members of COMESA while the rest except Cape Verde are members of ECOWAS.
21 Benin, Burkina Faso, Burundi, Cameroon, Comoros, Central Africa Republic, Côte d’lvoire, Equatorial Guinea, Guinea-Bissau, Mali, Niger, Rwanda, Sierra Leone, Somalia, and Uganda.
22 Peridy (2005), for example, assessing the complementarity of trade for Algeria, Egypt, Jordan, Morocco and Tunisia, showed that these countries had low complementarity levels, which could be explained by the great concentration of their comparative advantage (natural gas for Algeria and clothing for other Maghreb countries).
CHAPTER
123
Movement of Investment and Capital in Africa 8During the past two decades, shifting economic paradigms and conditions for investment
and capital flows—globalization—have underlined the importance of African countries’ steps to widen and deepen regional integration. They have, in particular, removed open
impediments to capital flows, enabling investors to freely select among alternative destinations on the basis of comparative advantage. In the destination countries, the recent financial crisis and the consequent reduction in official development assistance have also prompted governments to increase their efforts to mobilize private financial resources for public projects, especially for infrastructure.
African countries’ wish to attract external resources provides an incentive for them to tighten eco-nomic links among themselves and to take steps to boost intra-regional financial flows. Already, some RECs have protocols or agreements encouraging cross-border movement of private investment and capital.1 Economic policies nationally have also enhanced countries’ attractiveness. These moves, coupled with abundant global liquidity, have led to a surge in all types of private capital flows into the continent.
The picture for intra-African financial flows, in contrast, does not look very impressive, although the potential is great—not only are African domestic and regional markets largely unexploited but they are also expected to grow strongly relative to those in other developing regions.
This chapter examines, using the scarce data available, the interface between efforts to deepen regional economic integration in Africa and cross-border movement of private investment and capital within the continent. The discussion is mostly concerned with regional economic integration arrangements (REIAs)89 that have, or aim at, integrated markets, combined with some protocols to liberalize and protect capital and investment within the region.
The analysis revolves around four key questions:
124 Assessing Regional Integration in Africa (ARIA V): Towards an African Continental Free Trade Area
» How do regional and other investment arrangements affect intra-African (within Africa) and inter-regional (between Africa and other regions) investment and capital flows?
» What has been the actual experience in Africa?
» What are the favourable conditions (or opportuni-ties) and challenges (or constraints) for improved performance?
» What are the steps that could be taken at regional and national levels to improve performance?
8.1 What prompts FDI?8.1.1 Cross-border competitive advantages
One prominent framework explaining the cross-border movement of capital and investments is the eclectic para-digm (or OLI theory) introduced by Dunning (1981, 2000 and 2001).3 According to the theory, the tendency of an investor, which may be a multinational enterprise (MNE), to undertake foreign investment or production (and there-fore move its capital and/or investment activities across border) depends on the configuration of its cross-border comparative advantages in terms of ownership, location and internalization—the OLI comparative advantages in the target market.
Ownership (investor/firm specific) advantages are specific to the nature or nationality (or both) of the investor’s ownership and give it competitive advantage in global markets, including access to financial facilities, techno-logical assets, product differentiation, management skills, production efficiencies, size and concentration.
Location advantages occur when the local conditions of a potential host country make it a more attractive site for investment operations than the home country. These advantages—essentially “pull” factors—may be grouped in several ways,4 but for our purpose of covering both FDI and portfolio investment, while explicitly including the listing suggested by Dunning, we adapt the grouping of pull factors proposed by an IMF analysis (2008), which includes the macro-economic situation, financial sector development, and structural and institutional conditions. (We may also include RECs and regional investment agreements (RIAs) as cross-cutting factors relevant for all three categories of locational advantages—table 8.1a and b). The IMF analysis suggested that, while macro-economic conditions are a precondition for attracting
substantial amounts of all kinds of foreign capital and investment, financial sector development is important for attracting portfolio investment, and the structural and institutional situation seems to matter more for FDI.
Internalization advantages exist when internalizing cross-border transactions within a firm becomes a more efficient form of servicing markets than arm’s length transac-tions such as outsourcing, licensing or joint ventures with foreign-based enterprises.
The sum of these advantages must be high enough to war-rant the additional risk and uncertainty that accompanies investment outside the familiar home environment and be sufficient to compensate for the costs of setting up and operating a foreign operation, in addition to those faced by indigenous producers or potential producers. RIAs and other advantages of deepening regional integration (such as market size) are part of the locational advantages. The juxtaposition of the OLI-specific competitive advantages helps to explain whether the MNE will resort to trade or cross-border investment flows with locational advantages (table 8.1a and b).
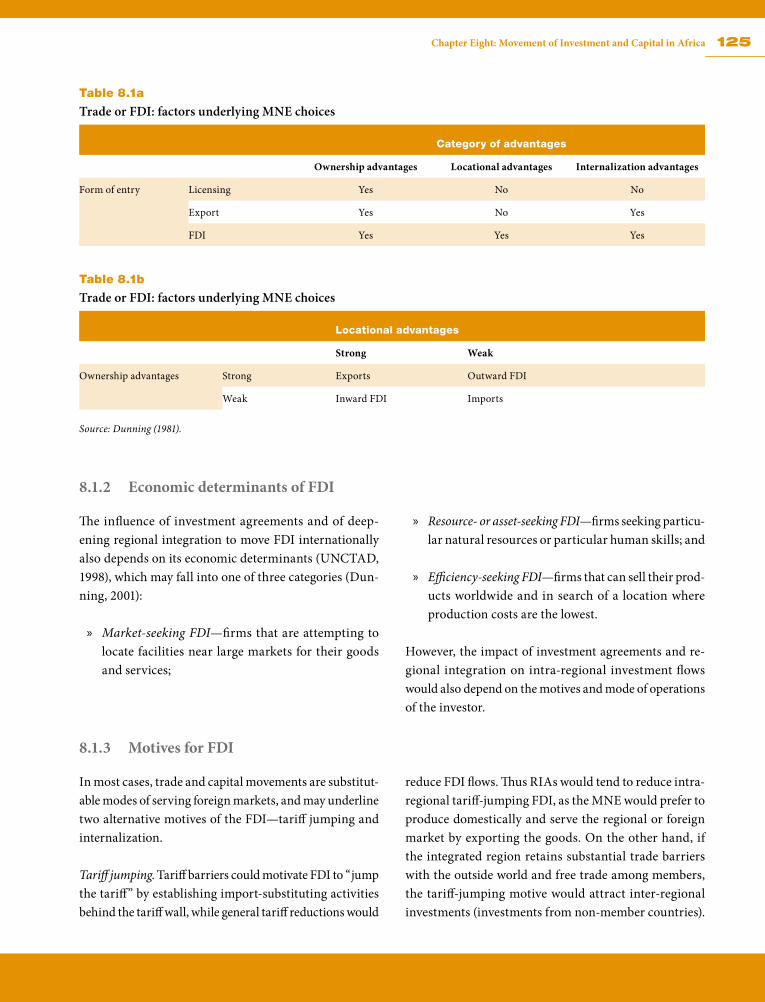
125Chapter Eight: Movement of Investment and Capital in Africa
Table 8.1a
Trade or FDI: factors underlying MNE choices
Category of advantages
Ownership advantages Locational advantages Internalization advantages
Form of entry Licensing Yes No No
Export Yes No Yes
FDI Yes Yes Yes
Table 8.1b
Trade or FDI: factors underlying MNE choices
Locational advantages
Strong Weak
Ownership advantages Strong Exports Outward FDI
Weak Inward FDI Imports
Source: Dunning (1981).
8.1.2 Economic determinants of FDI
The influence of investment agreements and of deep-ening regional integration to move FDI internationally also depends on its economic determinants (UNCTAD, 1998), which may fall into one of three categories (Dun-ning, 2001):
» Market-seeking FDI—firms that are attempting to locate facilities near large markets for their goods and services;
» Resource- or asset-seeking FDI—firms seeking particu-lar natural resources or particular human skills; and
» Efficiency-seeking FDI—firms that can sell their prod-ucts worldwide and in search of a location where production costs are the lowest.
However, the impact of investment agreements and re-gional integration on intra-regional investment flows would also depend on the motives and mode of operations of the investor.
8.1.3 Motives for FDI
In most cases, trade and capital movements are substitut-able modes of serving foreign markets, and may underline two alternative motives of the FDI—tariff jumping and internalization.
Tariff jumping. Tariff barriers could motivate FDI to “jump the tariff” by establishing import-substituting activities behind the tariff wall, while general tariff reductions would
reduce FDI flows. Thus RIAs would tend to reduce intra-regional tariff-jumping FDI, as the MNE would prefer to produce domestically and serve the regional or foreign market by exporting the goods. On the other hand, if the integrated region retains substantial trade barriers with the outside world and free trade among members, the tariff-jumping motive would attract inter-regional investments (investments from non-member countries).
126 Assessing Regional Integration in Africa (ARIA V): Towards an African Continental Free Trade Area
Internalization. FDI movement could also be motivated by the possession of some firm-specific intangible assets (such as technological and marketing expertise, brand image, etc.), which enable the foreign investors to compete with host-country firms that have superior knowledge of the local market, including consumer preferences and
business practices. To exploit firm-specific intangible assets, the investor would prefer to establish affiliates or subsidiaries and produce through them, thus avoiding other modes of international business, including exports and licensing, which could have high transaction costs.
8.1.4 Modes of FDI
The modes of FDI regard how best the MNE expands its investment (vertically or horizontally), taking advantage of the locational opportunities that deepening regional integration brings—that is, making a choice between mov-ing production activities across the border or expanding production in the home market and exporting to markets within the integrated region.
Vertical FDI takes place when a firm geographically frag-ments production by stages to take advantage of location-specific advantages, such as lower factor prices. For exam-ple, as FDI and trade are complements in an integrated region, the MNE can relocate part of its production chain, such as its labour-intensive assembly plant, to a low-wage country, and then re-export final goods.
Horizontal FDI takes place when the MNE produces the same goods and services in various countries to avoid the trade costs of exporting goods, but wishes to exploit its firm-specific advantages in production. Each produc-tion facility supplies the domestic market. The interplay between trade costs and plant-level economies of scale is significant in decisions regarding horizontal location. Larger markets (with deepening integration) that also support scale production would reduce costs and therefore diminish the incentive to produce in multiple country locations. Deepening regional integration would thus tend to reduce horizontal FDI, except for trade in certain services that requires a physical presence.
Analysis combining all possible scenarios provides sev-eral possibilities for investment and capital flows, intra-regional and inter-regional, depending on the locational advantages and additional attractiveness resulting from the REIA and the RIA. Subject to deficiencies related to empirical work on investment flows,5 the results of
several empirical studies indicate the following (though not specifically for Africa):6
» REIAs and RIAs improve the economic determinants of FDI, including provision of larger markets and protection for FDI. However, these are only a part of a whole range of locational advantages. In particular, REIAs and RIAs cannot substitute for an inadequate investment climate and other factors that enhance the pull factor in investment flows. In addition, REIAs and RIAs will not have much effect on capital and in-vestment flows from outside the region, if restrictions on market access are severe and remain unchanged.
» Investment provisions in REIAs have positive impacts on trade and even more so on investment movements, and “agreements with relatively more investment pro-visions impact FDI more profoundly than agreements with fewer provisions”. This suggests the need for REIAs to build in investment provisions rather than treating the investment provisions as just add-ons.
» REIAs among integrating developing countries have a greater (and unambiguous) impact on inter-regional investment and capital flows—especially from more developed regions/countries than on intra-regional flows.
» Similarly, RIAs involving developed countries (or developed regions such as the EU or the US) and inte-grating developing countries (or regions), as in Africa, have a very strong impact on capital and investment flows to the developing countries or regions. A similar impact would also be expected within such RECs as the tripartite arrangement, which groups countries of unequal levels of development. Investment and
127Chapter Eight: Movement of Investment and Capital in Africa
capital flows from the more developed countries (like Mauritius and South Africa) to the less developed ones are likely to be strong. Also, within Africa as a whole, the finding suggests considerable investment movement from the more developed (middle-income) countries to the less developed economies.
» REIAs between developed countries or regions that already have very low (or no) trade barriers would not provide significant benefits to the countries.
» For both intra-regional and inter-regional investment flows, the winners in the integrating region are the countries that have locational advantages (apparently true for tradable goods and for services).
» The importance of bilateral investment treaties (BITs) as a pull factor is confirmed by recent studies as well as various investor surveys (for example, UNCTAD, 2009a). For the majority of investors surveyed, BIT coverage in host developing countries plays a role in making a final decision on where to invest.7
Although no empirical studies on intra-African invest-ment flows covering RECs have been carried out, investor surveys (especially by UNIDO and COMESA), as well as studies on African investments (again, not specifically on RECs), provide some insights into global and intra-African investment flows, as now presented.
8.2 Types, sizes and trends of cross-border investment and capital flows
Intra-African investment and capital flows take place against the backdrop of global flows to Africa, which, ac-cording to all sources—international organizations, and government and private research—have increased rapidly
since the 1990s, for all the various types of private invest-ment and capital, reflecting abundant credit in developed countries and increased global financial integration.8
8.2.1 Inflows to Africa
According to IMF (2008), net private capital flows to sub-Saharan Africa increased more than six-fold from an average of $3.4 billion in 2000–2002 to $21.7 billion in 2010, with inflows growing much faster than outflows.9 Private inflows increased five-fold between 2000 and 2007, overtaking official development assistance flows in 2006. However, the various sources do not agree on the scale of rise of the various components, except that, during this period, the importance of debt-creating flows (bank and other private capital) declined in favour of rising portfolio equity and FDI flows, although, according to IMF esti-mates, bank and other private flows remain a substantial component of the net financial account.
In the last decade nearly half of the FDI inflows went to Nigeria (29.4 per cent) and South Africa (18.2 per cent)—they have substantial locational advantages—and the bulk of portfolio inflows went to South Africa (87.6 per cent)—where the capital market is highly developed. According
to the IMF (2008), Ghana, Kenya, Tanzania, Uganda and Zambia, which have also made impressive progress in economic and financial sector reforms, saw a substantial increase in investment, with very high foreign holdings of domestic public debt in Ghana and Zambia.
According to a UNIDO survey (2005), the large FDI inflows are dominated by MNEs, with historical (United Kingdom and France) or geographical (South Africa) ties, while the small foreign enterprises are developing economies (China, India and Lebanon). About a third of African countries have not, however, benefited from the boom in private capital flows (IMF, 2010), and they lose out to other countries in their regions.
128 Assessing Regional Integration in Africa (ARIA V): Towards an African Continental Free Trade Area
8.2.2 Intra-African flows
It is almost impossible to assess intra-African investment and capital flows because data are extremely patchy (box 8.1). No African country except South Africa compiles data systematically, and even there the data are limited to FDI, which is used as a proxy in this section—although the amount involved is only about 10 per cent of the country’s outward and inward investment flows. UNCTAD (2009b) corroborates these data for South Africa, but admits to difficulties in determining which investments are from domestic corporations in the countries concerned as opposed to local affiliates of MNEs, whose investments dominate global and regional FDI flows.
According to UNCTAD (2009b) data, over the years, the share of intra-African FDI in Africa has not risen much, but fluctuates widely. Intra-African FDI flows were estimated at $2 billion annually during 2002–2004 and, although they fell to $1.6 billion in 2005–2007 (only tiny shares of total FDI inflows to Africa), they are estimated to have recovered.10
Intra-regional investment in Africa is largely concentrated in four major sectors by UNCTAD’s calculations: min-ing, quarrying and petroleum; finance; business services;
and transport, storage and communications (table 8.2). The lack of investment in other sectors could partly be explained by small national markets and lack of strong government commitment to integration arrangements.
The bulk of intra-African FDI goes to finance mergers and acquisitions (M&A) rather than greenfield investments: the share of Africa in total cross-border M&A sales in Africa ranges from 20 per cent to nearly 60 per cent, but in greenfield investments, the share is much lower in each industry (UNCTAD, 2008). This suggests that greenfield investments—still a typical investing mode in Africa—are mainly financed by FDI from outside the continent. But it suggests that intra-African FDI should be attractive to countries privatizing state firms, or needing to increase exportable output from existing firms.
Intra-African investment represents a long-term commit-ment, and can also be quickly and easily assimilated, com-ing as it does from countries with similar institutional and structural conditions. UNIDO surveys (2001, 2003 and 2005) found that FDI from Africa (and other developing countries) usually has a greater impact on employment than FDI from developed countries.
129Chapter Eight: Movement of Investment and Capital in Africa
Box 8.1 Compiling data on investment and capital flows
All countries have difficulties generating data on financial flows. Many African countries (and some other develop-
ing economies) may struggle for several reasons.
First, there are inconsistencies in the data collection and reporting methods of different countries that must be
captured by compilers. Examples include different methods used by host and home countries recording the same
transactions; uneven coverage of FDI flows between countries (e.g. treatment of reinvested earnings); different
exchange rates used for recording FDI transactions; and huge unidentified private capital flows, which appear in
residual categories, and seem to hide FDI data. The size of these unrecorded transfers, whose content is vari-
ously defined by different countries, can be extremely large in some jurisdictions, even reaching or surpassing
that of recorded transfers.
Second, the changing nature of FDI transactions (e.g. investment through exchange of shares between investors
and acquired firms, investment from indirect sources) and their increasing sophistication that can involve different
players (for example, blends of funds from parent firms, government loans and development assistance in the same
package) and the different ways in which they may be handled often make it difficult to allocate exact values to FDI.
Third, sometimes there are problems distinguishing private and official flows, due to increasing interaction between
official institutions, such as the International Finance Corporation (the World Bank’s private-sector investment arm)
and the private sector.
Fourth, increasing sophistication of financial flow transactions sometimes blurs their differences. For example,
the distinction between FDI transactions with “portfolio-like behaviour” and portfolio investment including “hot
money” is vague. Uncertainty may also arise in classifying the “term” (long or short) of flows, because some flows
traditionally classified as long term have proved highly volatile. For example, bonds and bank loans can increasingly
be sold in secondary markets, indicating that there are no longer any true long-term capital flows.
Fifth, weaknesses in the timeliness and periodicity of data compilation, especially mismatches between the report-
ing periods for different types of flows, make it extremely hard to assess their level and composition.
Sixth, the accuracy of FDI reporting may also be affected by increasing volatility in exchange rates (as during
the financial crisis in 2009), making an exact correspondence between home- and host-country reporting more
uncertain (as differences in the timing of records may coincide with major exchange-rate differences).
Finally, skill capacity of compilers may be weak or data reporting by private enterprises inadequate.
Source: UNCTAD (2011).
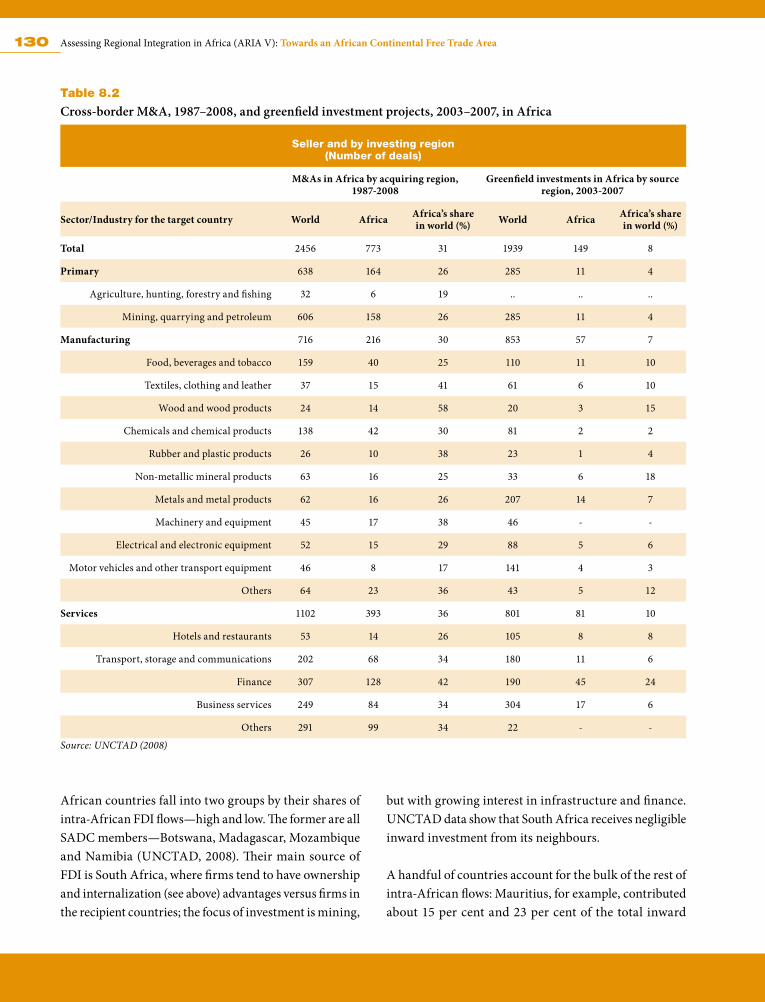
130 Assessing Regional Integration in Africa (ARIA V): Towards an African Continental Free Trade Area
Table 8.2
Cross-border M&A, 1987–2008, and greenfield investment projects, 2003–2007, in Africa
Seller and by investing region(Number of deals)
M&As in Africa by acquiring region, 1987-2008
Greenfield investments in Africa by source region, 2003-2007
Sector/Industry for the target country World Africa Africa’s share in world (%) World Africa Africa’s share
in world (%)
Total 2456 773 31 1939 149 8
Primary 638 164 26 285 11 4
Agriculture, hunting, forestry and fishing 32 6 19 .. .. ..
Mining, quarrying and petroleum 606 158 26 285 11 4
Manufacturing 716 216 30 853 57 7
Food, beverages and tobacco 159 40 25 110 11 10
Textiles, clothing and leather 37 15 41 61 6 10
Wood and wood products 24 14 58 20 3 15
Chemicals and chemical products 138 42 30 81 2 2
Rubber and plastic products 26 10 38 23 1 4
Non-metallic mineral products 63 16 25 33 6 18
Metals and metal products 62 16 26 207 14 7
Machinery and equipment 45 17 38 46 - -
Electrical and electronic equipment 52 15 29 88 5 6
Motor vehicles and other transport equipment 46 8 17 141 4 3
Others 64 23 36 43 5 12
Services 1102 393 36 801 81 10
Hotels and restaurants 53 14 26 105 8 8
Transport, storage and communications 202 68 34 180 11 6
Finance 307 128 42 190 45 24
Business services 249 84 34 304 17 6
Others 291 99 34 22 - -
Source: UNCTAD (2008)
African countries fall into two groups by their shares of intra-African FDI flows—high and low. The former are all SADC members—Botswana, Madagascar, Mozambique and Namibia (UNCTAD, 2008). Their main source of FDI is South Africa, where firms tend to have ownership and internalization (see above) advantages versus firms in the recipient countries; the focus of investment is mining,
but with growing interest in infrastructure and finance. UNCTAD data show that South Africa receives negligible inward investment from its neighbours.
A handful of countries account for the bulk of the rest of intra-African flows: Mauritius, for example, contributed about 15 per cent and 23 per cent of the total inward
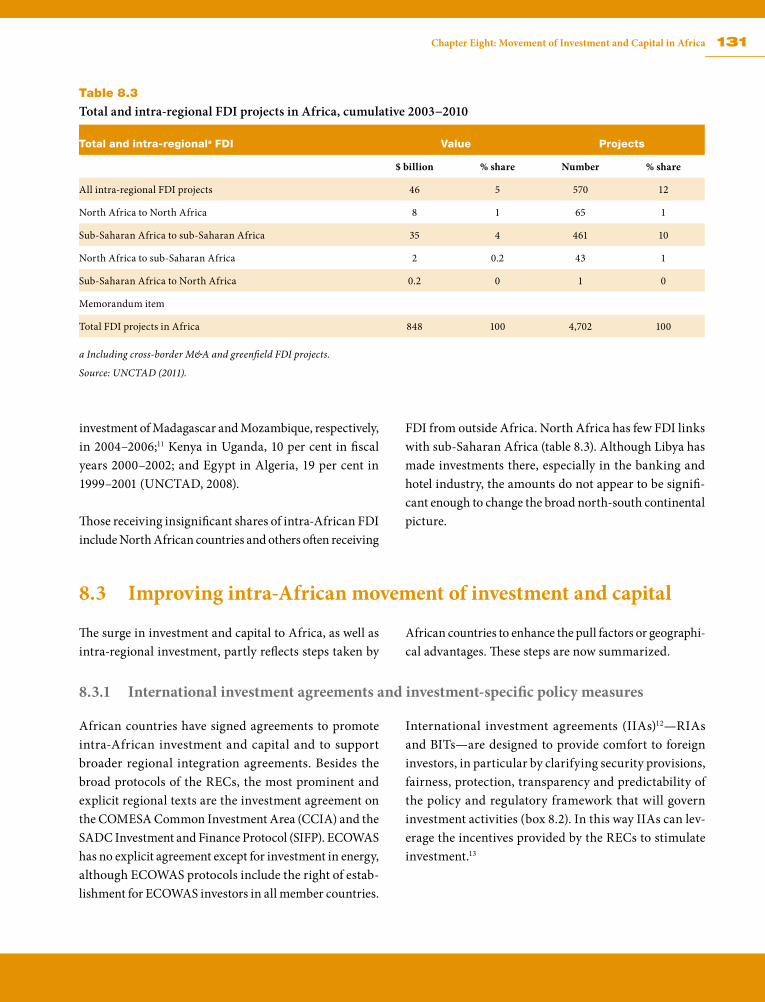
131Chapter Eight: Movement of Investment and Capital in Africa
investment of Madagascar and Mozambique, respectively, in 2004–2006;11 Kenya in Uganda, 10 per cent in fiscal years 2000–2002; and Egypt in Algeria, 19 per cent in 1999–2001 (UNCTAD, 2008).
Those receiving insignificant shares of intra-African FDI include North African countries and others often receiving
FDI from outside Africa. North Africa has few FDI links with sub-Saharan Africa (table 8.3). Although Libya has made investments there, especially in the banking and hotel industry, the amounts do not appear to be signifi-cant enough to change the broad north-south continental picture.
Table 8.3
Total and intra-regional FDI projects in Africa, cumulative 2003−2010
Total and intra-regionala FDI Value Projects
$ billion % share Number % share
All intra-regional FDI projects 46 5 570 12
North Africa to North Africa 8 1 65 1
Sub-Saharan Africa to sub-Saharan Africa 35 4 461 10
North Africa to sub-Saharan Africa 2 0.2 43 1
Sub-Saharan Africa to North Africa 0.2 0 1 0
Memorandum item
Total FDI projects in Africa 848 100 4,702 100
a Including cross-border M&A and greenfield FDI projects.
Source: UNCTAD (2011).
8.3 Improving intra-African movement of investment and capital
The surge in investment and capital to Africa, as well as intra-regional investment, partly reflects steps taken by
African countries to enhance the pull factors or geographi-cal advantages. These steps are now summarized.
8.3.1 International investment agreements and investment-specific policy measures
African countries have signed agreements to promote intra-African investment and capital and to support broader regional integration agreements. Besides the broad protocols of the RECs, the most prominent and explicit regional texts are the investment agreement on the COMESA Common Investment Area (CCIA) and the SADC Investment and Finance Protocol (SIFP). ECOWAS has no explicit agreement except for investment in energy, although ECOWAS protocols include the right of estab-lishment for ECOWAS investors in all member countries.
International investment agreements (IIAs)12—RIAs and BITs—are designed to provide comfort to foreign investors, in particular by clarifying security provisions, fairness, protection, transparency and predictability of the policy and regulatory framework that will govern investment activities (box 8.2). In this way IIAs can lev-erage the incentives provided by the RECs to stimulate investment.13
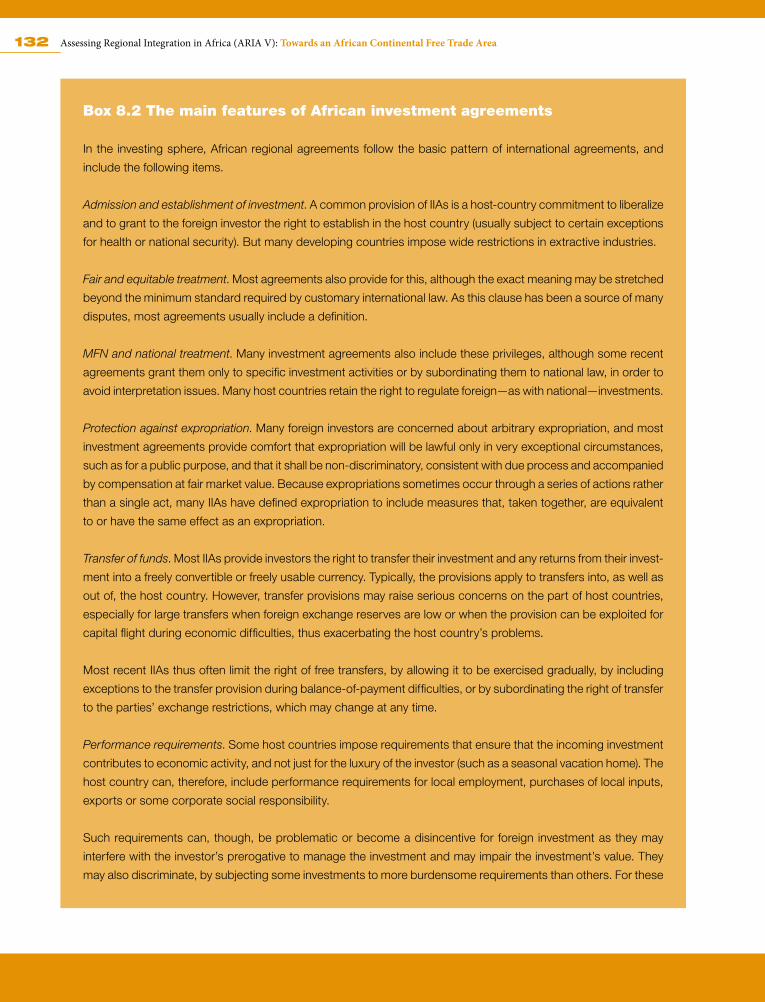
132 Assessing Regional Integration in Africa (ARIA V): Towards an African Continental Free Trade Area
Box 8.2 The main features of African investment agreements
In the investing sphere, African regional agreements follow the basic pattern of international agreements, and
include the following items.
Admission and establishment of investment. A common provision of IIAs is a host-country commitment to liberalize
and to grant to the foreign investor the right to establish in the host country (usually subject to certain exceptions
for health or national security). But many developing countries impose wide restrictions in extractive industries.
Fair and equitable treatment. Most agreements also provide for this, although the exact meaning may be stretched
beyond the minimum standard required by customary international law. As this clause has been a source of many
disputes, most agreements usually include a definition.
MFN and national treatment. Many investment agreements also include these privileges, although some recent
agreements grant them only to specific investment activities or by subordinating them to national law, in order to
avoid interpretation issues. Many host countries retain the right to regulate foreign—as with national—investments.
Protection against expropriation. Many foreign investors are concerned about arbitrary expropriation, and most
investment agreements provide comfort that expropriation will be lawful only in very exceptional circumstances,
such as for a public purpose, and that it shall be non-discriminatory, consistent with due process and accompanied
by compensation at fair market value. Because expropriations sometimes occur through a series of actions rather
than a single act, many IIAs have defined expropriation to include measures that, taken together, are equivalent
to or have the same effect as an expropriation.
Transfer of funds. Most IIAs provide investors the right to transfer their investment and any returns from their invest-
ment into a freely convertible or freely usable currency. Typically, the provisions apply to transfers into, as well as
out of, the host country. However, transfer provisions may raise serious concerns on the part of host countries,
especially for large transfers when foreign exchange reserves are low or when the provision can be exploited for
capital flight during economic difficulties, thus exacerbating the host country’s problems.
Most recent IIAs thus often limit the right of free transfers, by allowing it to be exercised gradually, by including
exceptions to the transfer provision during balance-of-payment difficulties, or by subordinating the right of transfer
to the parties’ exchange restrictions, which may change at any time.
Performance requirements. Some host countries impose requirements that ensure that the incoming investment
contributes to economic activity, and not just for the luxury of the investor (such as a seasonal vacation home). The
host country can, therefore, include performance requirements for local employment, purchases of local inputs,
exports or some corporate social responsibility.
Such requirements can, though, be problematic or become a disincentive for foreign investment as they may
interfere with the investor’s prerogative to manage the investment and may impair the investment’s value. They
may also discriminate, by subjecting some investments to more burdensome requirements than others. For these
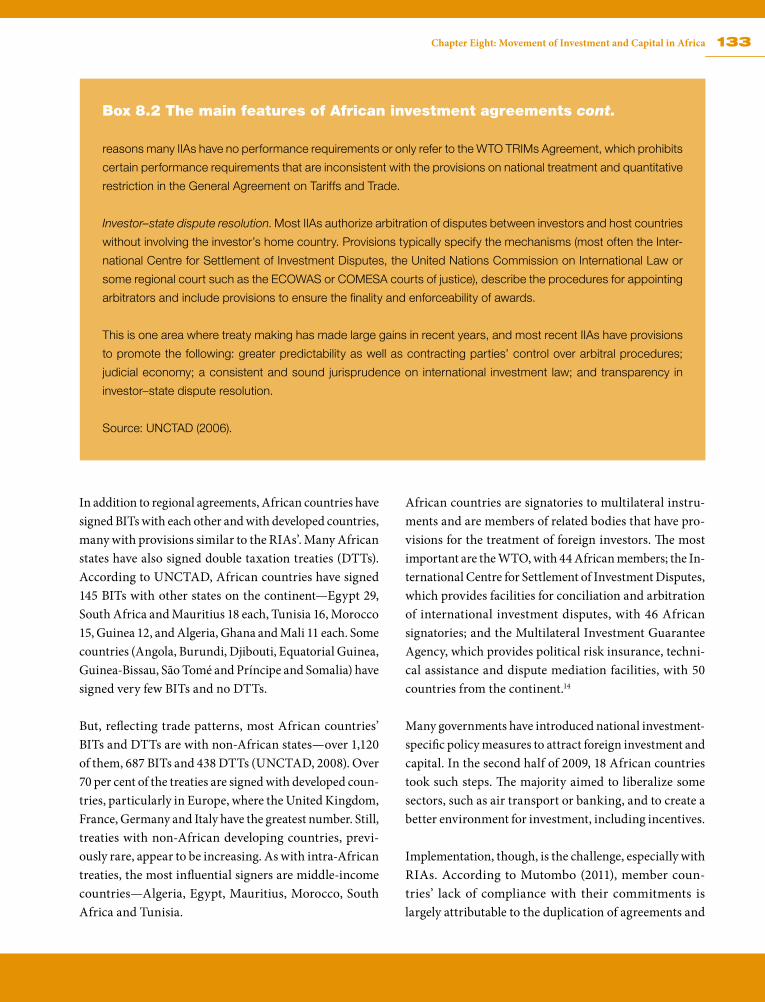
133Chapter Eight: Movement of Investment and Capital in Africa
In addition to regional agreements, African countries have signed BITs with each other and with developed countries, many with provisions similar to the RIAs’. Many African states have also signed double taxation treaties (DTTs). According to UNCTAD, African countries have signed 145 BITs with other states on the continent—Egypt 29, South Africa and Mauritius 18 each, Tunisia 16, Morocco 15, Guinea 12, and Algeria, Ghana and Mali 11 each. Some countries (Angola, Burundi, Djibouti, Equatorial Guinea, Guinea-Bissau, São Tomé and Príncipe and Somalia) have signed very few BITs and no DTTs.
But, reflecting trade patterns, most African countries’ BITs and DTTs are with non-African states—over 1,120 of them, 687 BITs and 438 DTTs (UNCTAD, 2008). Over 70 per cent of the treaties are signed with developed coun-tries, particularly in Europe, where the United Kingdom, France, Germany and Italy have the greatest number. Still, treaties with non-African developing countries, previ-ously rare, appear to be increasing. As with intra-African treaties, the most influential signers are middle-income countries—Algeria, Egypt, Mauritius, Morocco, South Africa and Tunisia.
African countries are signatories to multilateral instru-ments and are members of related bodies that have pro-visions for the treatment of foreign investors. The most important are the WTO, with 44 African members; the In-ternational Centre for Settlement of Investment Disputes, which provides facilities for conciliation and arbitration of international investment disputes, with 46 African signatories; and the Multilateral Investment Guarantee Agency, which provides political risk insurance, techni-cal assistance and dispute mediation facilities, with 50 countries from the continent.14
Many governments have introduced national investment-specific policy measures to attract foreign investment and capital. In the second half of 2009, 18 African countries took such steps. The majority aimed to liberalize some sectors, such as air transport or banking, and to create a better environment for investment, including incentives.
Implementation, though, is the challenge, especially with RIAs. According to Mutombo (2011), member coun-tries’ lack of compliance with their commitments is largely attributable to the duplication of agreements and
Box 8.2 The main features of African investment agreements cont.
reasons many IIAs have no performance requirements or only refer to the WTO TRIMs Agreement, which prohibits
certain performance requirements that are inconsistent with the provisions on national treatment and quantitative
restriction in the General Agreement on Tariffs and Trade.
Investor–state dispute resolution. Most IIAs authorize arbitration of disputes between investors and host countries
without involving the investor’s home country. Provisions typically specify the mechanisms (most often the Inter-
national Centre for Settlement of Investment Disputes, the United Nations Commission on International Law or
some regional court such as the ECOWAS or COMESA courts of justice), describe the procedures for appointing
arbitrators and include provisions to ensure the finality and enforceability of awards.
This is one area where treaty making has made large gains in recent years, and most recent IIAs have provisions
to promote the following: greater predictability as well as contracting parties’ control over arbitral procedures;
judicial economy; a consistent and sound jurisprudence on international investment law; and transparency in
investor–state dispute resolution.
Source: UNCTAD (2006).
134 Assessing Regional Integration in Africa (ARIA V): Towards an African Continental Free Trade Area
overlapping of membership in all RECs, making it hard to harmonize investment programmes across the continent. The COMESA CCIA and SADC’s SIFP are cases in point: they have many common signatories.15
Weakness in compliance also stems partly from RECs’ failure to fully integrate investment provisions, treat-ing them as add-ons. This needs to change, as empirical analysis (above this chapter) shows that REIAs’ investment provisions have positive impacts on trade and even more so on investment, suggesting not only synergy between investment and trade provisions but the need to harmo-nize them.
The tripartite initiative, however, offers an opportunity not only to harmonize IIAs with the trade provisions but also among the different investment agreements (RIAs, BITs and DTTs) of the COMESA, EAC and SADC coun-tries. Similar opportunities are emerging to harmonize within ECOWAS among the UEMOA and West African Monetary Zone countries. These harmonization arrange-ments do not, however, tackle the issue of conflicting IIAs with “non-regionals”. In particular, although the EU–ACP EPA is set to offer opportunities in trade and investment to African countries, it may also have some negative dy-namic impacts because of its fragmented approach that ignores the RECs’ alignments.
8.3.2 Macro-economic environment
Macro-economic reforms led to marked improvements in inflation, fiscal and current account balances and external reserves as well as reductions in key interest rates by 2008. Many African countries have perhaps reached broader macro-economic stability than the 1980 benchmark for the Association of Southeast Asian Nations (ASEAN), with strong growth, moderate inflation and relatively high reserves (IMF, 2008). Although the recent global economic crisis caused large swings in performance—affecting fiscal and current account balances, especially in the precious minerals and oil-exporting countries—its impact did not disrupt the post-2000 trend performance.
Still, significant tasks remain, including strengthening medium-term budgeting frameworks, increasing trans-parency, and strengthening budget execution and audit procedures (OECD-UNECA, 2010). These could disrupt macro-economic performance and eventually also sta-bility and weaken the pull factor appeal for investments. Other areas to tackle are uneven performance across countries, regional macro-economic convergence and the likely divergent benefits of investment flows.
8.3.3 Financial market development
African countries are strengthening financial market institutions. The AUC is working towards setting up three pan-African financial institutions—the African Invest-ment Bank, the African Central Bank and the African Monetary Fund—in line with the Constitutive Act of the AU.
African Investment Bank. Its aim will be to mobilize re-sources to finance regional projects. It is intended that the bank will have an initial capital stock of US$ 25 billion of which 75 per cent is allocated to member states and 25 per cent to the African private sector. The protocol and statute establishing the bank were adopted by the AU Assembly in February and July 2009, respectively.
Since then, legal instruments have been signed by 15 countries and ratified by one of them.16 Fifteen ratifica-tions are required for the instruments to enter into force.
African Central Bank. When formed, this will underpin steps towards an African monetary union (or common currency). The government of Nigeria, host of the steer-ing committee, has provided office facilities to start the committee’s work.
African Monetary Fund. The steering committee for this fund has finalized its work on the necessary protocol and statute. The protocol was considered by the January 2011 AU Summit, which recommended that it be reviewed by
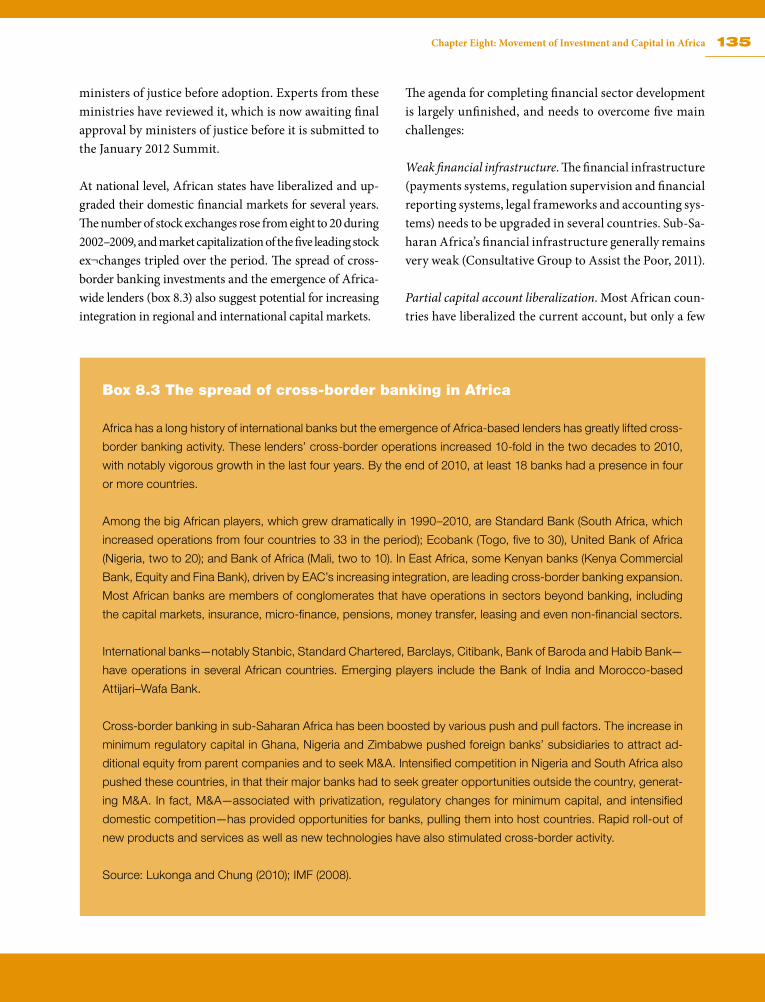
135Chapter Eight: Movement of Investment and Capital in Africa
ministers of justice before adoption. Experts from these ministries have reviewed it, which is now awaiting final approval by ministers of justice before it is submitted to the January 2012 Summit.
At national level, African states have liberalized and up-graded their domestic financial markets for several years. The number of stock exchanges rose from eight to 20 during 2002–2009, and market capitalization of the five leading stock ex¬changes tripled over the period. The spread of cross-border banking investments and the emergence of Africa-wide lenders (box 8.3) also suggest potential for increasing integration in regional and international capital markets.
The agenda for completing financial sector development is largely unfinished, and needs to overcome five main challenges:
Weak financial infrastructure. The financial infrastructure (payments systems, regulation supervision and financial reporting systems, legal frameworks and accounting sys-tems) needs to be upgraded in several countries. Sub-Sa-haran Africa’s financial infrastructure generally remains very weak (Consultative Group to Assist the Poor, 2011).
Partial capital account liberalization. Most African coun-tries have liberalized the current account, but only a few
Box 8.3 The spread of cross-border banking in Africa
Africa has a long history of international banks but the emergence of Africa-based lenders has greatly lifted cross-
border banking activity. These lenders’ cross-border operations increased 10-fold in the two decades to 2010,
with notably vigorous growth in the last four years. By the end of 2010, at least 18 banks had a presence in four
or more countries.
Among the big African players, which grew dramatically in 1990–2010, are Standard Bank (South Africa, which
increased operations from four countries to 33 in the period); Ecobank (Togo, five to 30), United Bank of Africa
(Nigeria, two to 20); and Bank of Africa (Mali, two to 10). In East Africa, some Kenyan banks (Kenya Commercial
Bank, Equity and Fina Bank), driven by EAC’s increasing integration, are leading cross-border banking expansion.
Most African banks are members of conglomerates that have operations in sectors beyond banking, including
the capital markets, insurance, micro-finance, pensions, money transfer, leasing and even non-financial sectors.
International banks—notably Stanbic, Standard Chartered, Barclays, Citibank, Bank of Baroda and Habib Bank—
have operations in several African countries. Emerging players include the Bank of India and Morocco-based
Attijari–Wafa Bank.
Cross-border banking in sub-Saharan Africa has been boosted by various push and pull factors. The increase in
minimum regulatory capital in Ghana, Nigeria and Zimbabwe pushed foreign banks’ subsidiaries to attract ad-
ditional equity from parent companies and to seek M&A. Intensified competition in Nigeria and South Africa also
pushed these countries, in that their major banks had to seek greater opportunities outside the country, generat-
ing M&A. In fact, M&A—associated with privatization, regulatory changes for minimum capital, and intensified
domestic competition—has provided opportunities for banks, pulling them into host countries. Rapid roll-out of
new products and services as well as new technologies have also stimulated cross-border activity.
Source: Lukonga and Chung (2010); IMF (2008).
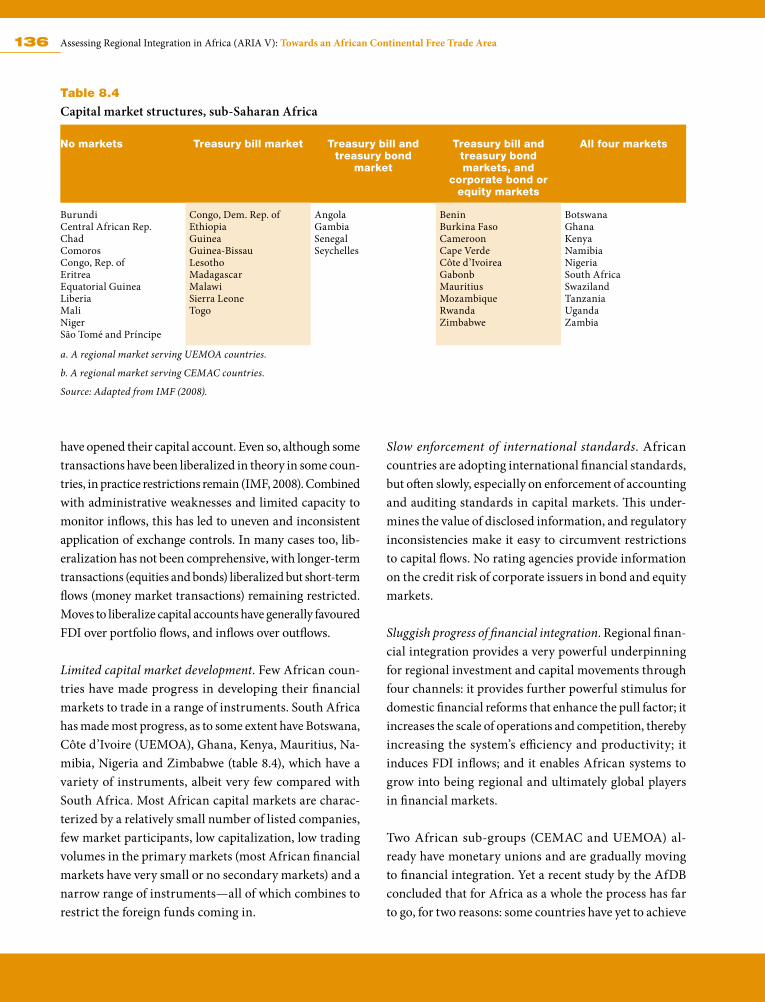
136 Assessing Regional Integration in Africa (ARIA V): Towards an African Continental Free Trade Area
have opened their capital account. Even so, although some transactions have been liberalized in theory in some coun-tries, in practice restrictions remain (IMF, 2008). Combined with administrative weaknesses and limited capacity to monitor inflows, this has led to uneven and inconsistent application of exchange controls. In many cases too, lib-eralization has not been comprehensive, with longer-term transactions (equities and bonds) liberalized but short-term flows (money market transactions) remaining restricted. Moves to liberalize capital accounts have generally favoured FDI over portfolio flows, and inflows over outflows.
Limited capital market development. Few African coun-tries have made progress in developing their financial markets to trade in a range of instruments. South Africa has made most progress, as to some extent have Botswana, Côte d’Ivoire (UEMOA), Ghana, Kenya, Mauritius, Na-mibia, Nigeria and Zimbabwe (table 8.4), which have a variety of instruments, albeit very few compared with South Africa. Most African capital markets are charac-terized by a relatively small number of listed companies, few market participants, low capitalization, low trading volumes in the primary markets (most African financial markets have very small or no secondary markets) and a narrow range of instruments—all of which combines to restrict the foreign funds coming in.
Slow enforcement of international standards. African countries are adopting international financial standards, but often slowly, especially on enforcement of accounting and auditing standards in capital markets. This under-mines the value of disclosed information, and regulatory inconsistencies make it easy to circumvent restrictions to capital flows. No rating agencies provide information on the credit risk of corporate issuers in bond and equity markets.
Sluggish progress of financial integration. Regional finan-cial integration provides a very powerful underpinning for regional investment and capital movements through four channels: it provides further powerful stimulus for domestic financial reforms that enhance the pull factor; it increases the scale of operations and competition, thereby increasing the system’s efficiency and productivity; it induces FDI inflows; and it enables African systems to grow into being regional and ultimately global players in financial markets.
Two African sub-groups (CEMAC and UEMOA) al-ready have monetary unions and are gradually moving to financial integration. Yet a recent study by the AfDB concluded that for Africa as a whole the process has far to go, for two reasons: some countries have yet to achieve
Table 8.4
Capital market structures, sub-Saharan Africa
No markets Treasury bill market Treasury bill and treasury bond
market
Treasury bill and treasury bond markets, and
corporate bond or equity markets
All four markets
BurundiCentral African Rep.ChadComorosCongo, Rep. of EritreaEquatorial GuineaLiberiaMaliNigerSão Tomé and Príncipe
Congo, Dem. Rep. ofEthiopiaGuineaGuinea-BissauLesothoMadagascarMalawiSierra LeoneTogo
AngolaGambiaSenegalSeychelles
BeninBurkina FasoCameroon Cape VerdeCôte d’IvoireaGabonbMauritiusMozambiqueRwandaZimbabwe
BotswanaGhanaKenyaNamibiaNigeriaSouth AfricaSwazilandTanzaniaUgandaZambia
a. A regional market serving UEMOA countries.
b. A regional market serving CEMAC countries.
Source: Adapted from IMF (2008).
137Chapter Eight: Movement of Investment and Capital in Africa
macro-economic stability, which is an essential precon-dition for integrating with a regional financial system, and the modernizing and harmonizing process between member countries is at different stages. Even for the RECs
that have adopted regional action plans (EAC, ECOWAS and COMESA), implementation is slow and target dates for achieving key milestones keep shifting.
8.3.4 Business environment
Starting from a very low base, Africa is improving its regulatory environment. Several countries, including those recovering from conflict, have introduced new, or have reformed existing, laws to improve the business environment (the institutional and structural conditions). A 2010 OECD-UNECA review indicated that “sixty- seven regulatory reforms were registered in sub-Saharan Africa across 29 countries in 2009, building on the 58 registered reforms in 28 countries the previous year”.
Indeed, Africa launched the third-highest number of the world’s reforms to economic regulations in 2005–06 (67 per cent of African countries pushed through with at least one reform, compared with 35 per cent of East Asian economies and 25 per cent in South Asia); Egypt, Ghana and Kenya were among the 10 leading reformers in 2006–07 (Doing Business 2008); and three African countries were among the Doing Business top 10 reformers in 2008–09, when for the first time an African country topped the list.
These reforms focused on improving tax systems and making it easier to start a business as well as improving trade across borders, including streamlining business-registration procedures; setting up one-stop shops and
service desks bringing together relevant ministries and agencies; improving customs processes and border co-operation, with one-stop shops for commercial trade documents, to expedite trade times and reduce costs; and revising labour codes, making it easier to employ workers.
Many African countries have also taken steps to improve transparency and reduce corruption. The AU Convention on Preventing and Combating Corruption entered into force in 2006 and has been ratified by 31 countries. Many African countries have also shown great interest in the Extractive Industries Transparency Initiative (EITI): 18 of 31 candidate countries are African. Of these, one has so far been designated as EITI.
Nevertheless, the UNECA African Governance Report of 2005 identified a number of specific priorities includ-ing deepening legal and judicial reforms, and removing bottlenecks to private investment. In particular, it saw the need for consistent policies and regulations for setting up and running businesses, protecting property rights and enforcing contracts, enhancing business development and technical support services, and providing good informa-tion on markets and investment opportunities.
8.4 Conclusions and recommendations
Analysis of intra-African investment and capital move-ments is made challenging by lack of data. Much of what is recorded are flows between Africa and other regions. Work needs to be done to upgrade data on intra-regional invest-ment so that the trends of these flows and the strategies for promoting them can be well assessed. Accurate data recording would not only help policymakers to formulate regional strategies but would also help them to avoid un-necessary apprehensions about certain policy directions
(such as liberalizing capital accounts or harmonizing IIAs) and the costs to be incurred for what may turn out to be insignificant results, or even misperceptions of unfair advantages that might worsen relations among countries within RECs.
However, indications from the scant data are that, apart from the positive effect of domestic macro-economic, financial sector and business climate reforms, progress
138 Assessing Regional Integration in Africa (ARIA V): Towards an African Continental Free Trade Area
of regional integration is an important pull factor un-derlying investment and capital flows not only between Africa and other regions but also intra-African. The intra-African pattern also points to some linkage between their flows and trade, and that their development can be co-dependent. In recent years, the trends of intra-African capital and investment flows have been positive, especially for FDI financing of M&A in mining, financial services, telecommunications and resource-based indus-tries in manufacturing, making it attractive to countries
privatizing state assets or seeking to boost exports from existing enterprises.
Another positive consideration is that intra-African FDI has the potential to be long term, and because of the ac-tivities in which it is involved it can be quickly and easily absorbed in recipient countries. Therefore, within the RECs, countries need to enhance intra-African invest-ment and capital flows, similar to the policies required generally, as now discussed.17
8.4.1 Rationalizing IIAs
Despite their perceived benefits, the proliferation of over-lapping IIAs (RIAs and BITs) makes it hard for countries in a REC to harmonize their investment policies and to benefit from deepening regional integration. States should attempt to consolidate existing arrangements to entangle the “spaghetti bowl” of African regional integration (Mu-tombo, 2011). A customs union will at some stage help to
do this, but in the interim, countries could take steps to harmonize investment policies within RECs by incorpo-rating the investment protocols in the FTA agreements. Countries in the same REC should also stop signing BITs, as they will become redundant anyway with RIAs, and keep to a regional approach with third states, allowing for a gradual transfer of negotiating power to RECs.
8.4.2 Improving macro-economic performance and harmonizing policies
To build on progress towards stabilizing their macro-economic environment, countries need to build institu-tions for, and enhance transparency in, macro-economic
policymaking and management in order to reduce in-efficiencies and risks. Within RECs, countries need to harmonize economic policies more tightly.
8.4.3 Developing and integrating regional financial markets
A study by the AfDB concluded that financial develop-ment and regional integration should not be considered as sequential but as processes that must be encouraged simultaneously (AfDB, 2009).18 An ultimate objective of regional financial integration is to boost finance for larger trade and service transactions in Africa, beyond the gains brought by a formal FTA or customs union.
Steps to integrate national financial markets are neces-sary, as market forces alone will not integrate them at a pace, or in a form, that meets Africa’s requirements to increase trade and investment. The AfDB study (AfDB, 2009) proposed a roadmap for regional financial integra-tion, which marks measures to be carried out at national and regional levels and at various stages (annex A8.1).19
8.4.4 Improving the business environment
Costs, risks, and competition barriers need to be brought down to improve the investment climate, nationally and regionally. Costs are monetary and time (or processing-delay) expenses associated with weak contract enforce-ment, inadequate infrastructure, crime, corruption and regulation. Risks are closely linked to an unstable and
insecure environment, including protection of property rights, policy uncertainty, macro-economic instability and arbitrary regulation. Barriers to competition particularly concern regulation of market entry and exit, and govern-ment response to anti-competitive behaviour by firms (World Bank, 2005a).
139Chapter Eight: Movement of Investment and Capital in Africa
Hence governments need to strengthen the stability and security of property rights by verifying rights to land and other property, strengthening contract enforcement, reducing crime and preventing uncompensated expropria-tion of property.
When tackling these issues of course, states need to bal-ance the needs of investors with those of society.20 Too often, they pursue tax and regulatory approaches that fail to achieve the intended objectives because of widespread informality, yet harm the investment climate by increasing the costs, risks and competition barriers just mentioned. The key is to enhance transparency while removing the NTBs that are such a concern to investors.
A final element in improving the business climate is the labour market. Firms need a skilled workforce if they are to adopt new and more productive technologies. Thus governments, beyond making education more inclusive and relevant to firms’ requirements, need to improve labour market policies to encourage a more skilled and adaptable workforce (World Bank, 2005a).
All these business environment reforms should be encour-aged in regional arrangements to help harmonize rules and standards—and ultimately, boost trade, investment and standards of living throughout the continent.
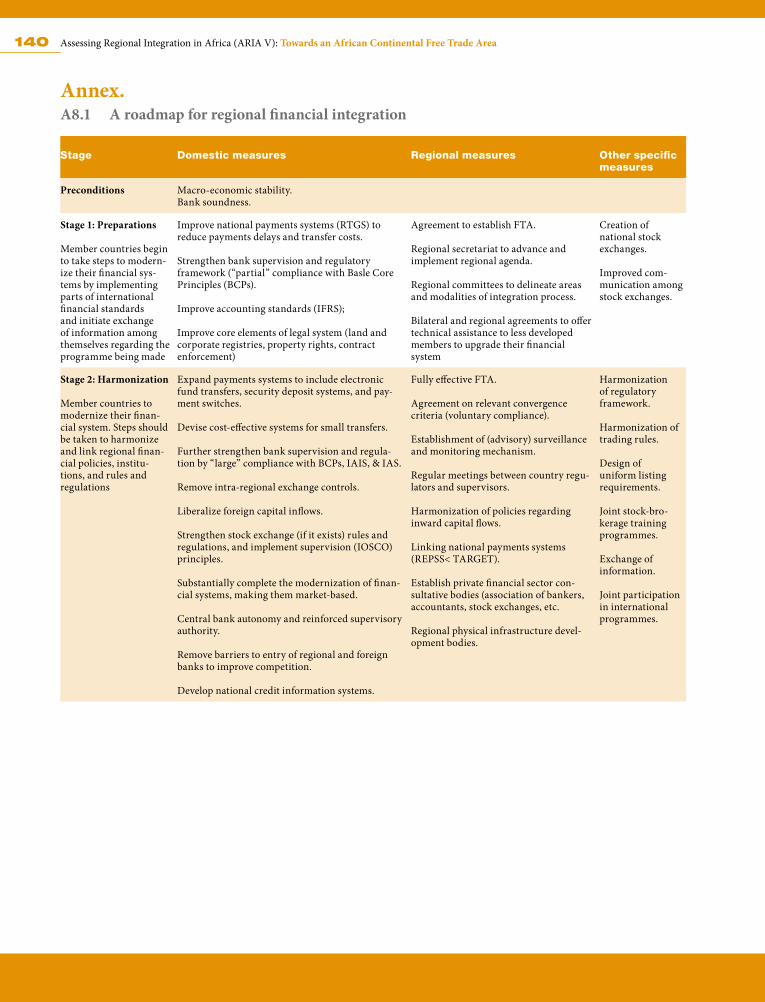
140 Assessing Regional Integration in Africa (ARIA V): Towards an African Continental Free Trade Area
Annex. A8.1 A roadmap for regional financial integration
Stage Domestic measures Regional measures Other specific measures
Preconditions Macro-economic stability.Bank soundness.
Stage 1: Preparations
Member countries begin to take steps to modern-ize their financial sys-tems by implementing parts of international financial standards and initiate exchange of information among themselves regarding the programme being made
Improve national payments systems (RTGS) to reduce payments delays and transfer costs.
Strengthen bank supervision and regulatory framework (“partial” compliance with Basle Core Principles (BCPs).
Improve accounting standards (IFRS);
Improve core elements of legal system (land and corporate registries, property rights, contract enforcement)
Agreement to establish FTA.
Regional secretariat to advance and implement regional agenda.
Regional committees to delineate areas and modalities of integration process.
Bilateral and regional agreements to offer technical assistance to less developed members to upgrade their financial system
Creation of national stock exchanges.
Improved com-munication among stock exchanges.
Stage 2: Harmonization
Member countries to modernize their finan-cial system. Steps should be taken to harmonize and link regional finan-cial policies, institu-tions, and rules and regulations
Expand payments systems to include electronic fund transfers, security deposit systems, and pay-ment switches.
Devise cost-effective systems for small transfers.
Further strengthen bank supervision and regula-tion by “large” compliance with BCPs, IAIS, & IAS.
Remove intra-regional exchange controls.
Liberalize foreign capital inflows.
Strengthen stock exchange (if it exists) rules and regulations, and implement supervision (IOSCO) principles.
Substantially complete the modernization of finan-cial systems, making them market-based.
Central bank autonomy and reinforced supervisory authority.
Remove barriers to entry of regional and foreign banks to improve competition.
Develop national credit information systems.
Fully effective FTA.
Agreement on relevant convergence criteria (voluntary compliance).
Establishment of (advisory) surveillance and monitoring mechanism.
Regular meetings between country regu-lators and supervisors.
Harmonization of policies regarding inward capital flows.
Linking national payments systems (REPSS< TARGET).
Establish private financial sector con-sultative bodies (association of bankers, accountants, stock exchanges, etc.
Regional physical infrastructure devel-opment bodies.
Harmonization of regulatory framework.
Harmonization of trading rules.
Design of uniform listing requirements.
Joint stock-bro-kerage training programmes.
Exchange of information.
Joint participation in international programmes.
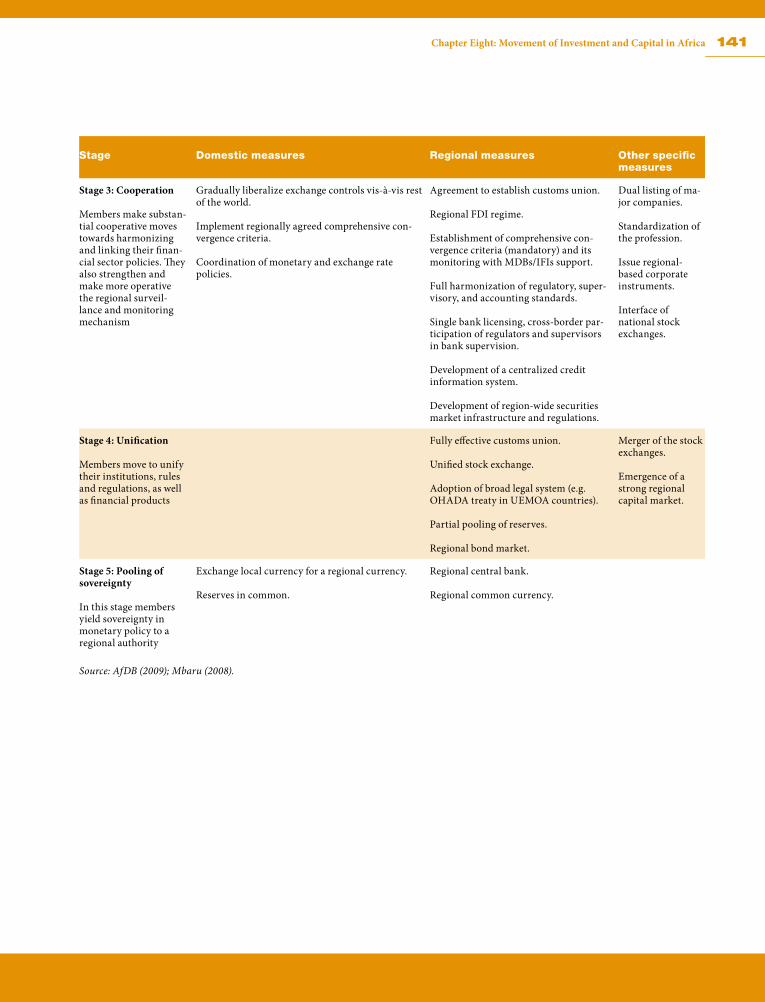
141Chapter Eight: Movement of Investment and Capital in Africa
Stage Domestic measures Regional measures Other specific measures
Stage 3: Cooperation
Members make substan-tial cooperative moves towards harmonizing and linking their finan-cial sector policies. They also strengthen and make more operative the regional surveil-lance and monitoring mechanism
Gradually liberalize exchange controls vis-à-vis rest of the world.
Implement regionally agreed comprehensive con-vergence criteria.
Coordination of monetary and exchange rate policies.
Agreement to establish customs union.
Regional FDI regime.
Establishment of comprehensive con-vergence criteria (mandatory) and its monitoring with MDBs/IFIs support.
Full harmonization of regulatory, super-visory, and accounting standards.
Single bank licensing, cross-border par-ticipation of regulators and supervisors in bank supervision.
Development of a centralized credit information system.
Development of region-wide securities market infrastructure and regulations.
Dual listing of ma-jor companies.
Standardization of the profession.
Issue regional-based corporate instruments.
Interface of national stock exchanges.
Stage 4: Unification
Members move to unify their institutions, rules and regulations, as well as financial products
Fully effective customs union.
Unified stock exchange.
Adoption of broad legal system (e.g. OHADA treaty in UEMOA countries).
Partial pooling of reserves.
Regional bond market.
Merger of the stock exchanges.
Emergence of a strong regional capital market.
Stage 5: Pooling of sovereignty
In this stage members yield sovereignty in monetary policy to a regional authority
Exchange local currency for a regional currency.
Reserves in common.
Regional central bank.
Regional common currency.
Source: AfDB (2009); Mbaru (2008).
142 Assessing Regional Integration in Africa (ARIA V): Towards an African Continental Free Trade Area
References
AfDB (African Development Bank). 2009. Financial sec-tor integration in three subregions of Africa. Tunis.
Blomstrom, M., and A. Kokko. 1997. “Regional integra-tion and foreign direct investment.” Working Paper Series in Economics and Finance 172, World Bank, Washington, DC
Blomstrom, M., A. Kokko, and Globerman, S. 1998. “Re-gional Economic Integration and Foreign Direct Investment: The North American Experience,” Working Paper Series in Economics and Finance 269, Stockholm School of Economics.
Consultative Group to Assist the Poor (CGAP). 2011. Af-rica financial infrastructure survey. Washington, DC.
Deroose, S. 2006. “How the single currency works: EMU after eight years: achievements and challenges.” Presentation at the European Commission, Brussels,
Dunning, J.H. 1981. “Explaining the international direct investment position of countries: towards a dynamic or developmental approach.” Weltwirtschaftliches Archiv. 117 (1): 30–64.
———. 2000. “The eclectic paradigm as an envelope for economic and business theories of MNE activity.” International Business Review 9: 163–90.
———. 2001. “The eclectic (OLI) paradigm of interna-tional production: past, present and future.” Interna-tional Journal of Economics of Business 8 (2): 173–90.
International Monetary Fund. 2008. Regional economic outlook, Sub-Saharan Africa. Washington, DC. http://www.imf.org/external/pubs/ft/reo/2008/afr/eng/sreo0408.pdf.
______. 2010. Regional economic outlook, Sub-Saharan Africa. Washington, DC. http://www.imf.org/exter-nal/pubs/ft/reo/2010/afr/eng/sreo0410.pdf
Laifi, J. 2007. Regional integration and foreign direct invest-ment in banking sector: three case studies. Centre de Recherches Économiques de Saint Étienne. Univer-sité Jean-Monnet, Saint-Étienne, France
Lesher, M., and S. Miroudot. 2006. “Analysis of the eco-nomic impact of investment provisions in regional trade agreements.” Trade Policy Working Paper 36. Paris, Organisation for Economic Co-operation and Development.
Levy Yeyati, E., Stein, E. and Daude, C. (2002). “Regional Integration and the Location of FDI”. Mimeo, Inter American Development Bank.
Lukonga, I., and K. Chung. 2010. “The cross-border expan-sion of African large conglomerate financial institu-tions.” Unpublished Research Paper. International Monetary Fund, Washington, DC.
Maurel, M. 1998. “Régionalisme et désintégration en Europe centrale et orientale—une approche gravi-tationnelle.” Centre National de la Recherche Sci-entifique, Département D’Economie, Paris.
Mbaru, J. 2008. “East Africa capital market integration—it can be done.” Presentation at the 12th African Securities Exchanges Associations, Kampala, No-vember 10–11
Mutombo, T. 2011. “Recent efforts aiming at consolidating international investment rules: disentangling the spaghetti bowl.” Bern, Switzerland.
OECD-UNECA. 2010. Mutual review of development ef-fectiveness in Africa. Paris; Addis Ababa.
Porter, M.E. 1990. The competitive advantage of nations. New York: Free Press.
Salike, N. 2010. Effect of regional integration agreement on foreign direct investment: a theoretical perspective. Asian Development Bank Institute, Tokyo, Japan.
143Chapter Eight: Movement of Investment and Capital in Africa
UNCTAD (United Nations Conference on Trade and Development). 1996. World Investment Report 1996: investment, trade and international policy arrange-ments. New York and Geneva: United Nations.
———. 1998. World Investment Report: trends and deter-minants. New York and Geneva: United Nations.
———. 2002. World Investment Report 2002: transnational corporations and export competitiveness. New York and Geneva: United Nations.
———. 2003. World Investment Report 2003: promoting linkages. New York and Geneva: United Nations.
———. 2006. International Investment Agreements: trends and emerging issues. New York and Geneva: United Nations.
———. 2008. World Investment Directory, Vol. X, Africa. New York and Geneva: United Nations.
———. 2009a. The role of international investment agreements in attracting foreign direct investment
to developing countries. New York and Geneva: United Nations.
———. 2009b. “Intra-regional FDI in Africa and develop-ment.” Unpublished Background Paper Prepared for the Economic Development in Africa Report 2009. Geneva: United Nations.
———. 2009–2010. Investment Policy Monitor, Numbers 1-5. New York and Geneva: United Nations.
———. 2011. World Investment Report 2011: non-equity modes of international production and development. New York and Geneva: United Nations.
UNIDO (United Nations Industrial Development Or-ganization). 2001, 2003, and 2005. Africa Foreign Investor Surveys. Vienna: United Nations.
World Bank. 2005a. World Development Report: a better investment climate for everyone. Washington, DC: World Bank; Oxford University Press: Oxford.
———. 2005b. Global economic prospects. trade, regional-ism and development. Washington, DC.
Notes1 Defined as FDI, portfolio equity and debt (including foreign stocks,
bonds and other financial assets), and bank debt (medium and long term). Portfolio refers to the passive holding of securities, none of which entails active management.
2 In Africa, the RECs.3 Another framework for explaining internationalization of invest-
ments is the diamond theory proposed by Porter (1990).4 Dunning was more focused on FDI and his original grouping of
the locational advantages included only the economic advantages, business environment, and social, political and cultural advantages, which are included in our grouping mostly under structural and institutional factors.
5 Three sets of deficiencies that prevent one from drawing firm policy conclusions stand out: the basic nature of econometric modeling, which requires simplified descriptions of complex realities; the limitations of regressions in that they mainly ascertain relation-ships but not underlying causalities; and data inadequacies in many developing countries (UNCTAD, 2009a).
6 For lack of data, there are no empirical studies to verify the theoreti-cal propositions on the impact of REIAs and RIAs on investment and capital flows in Africa. The studies drawn on here, which looked at other developing regions, include Blomstrom and Kokko
(1997); Blomstrom, Kokko and Globerman (1998); Yeyati, Stein and Daude (2002); UNCTAD (2003); Deroose (2006); World Bank (2005); Lesher and Miroudot (2006); and Laifi (2007).
7 Further evidence that MNEs increasingly use BITs is provided by the rapidly increasing number of investment arbitration cases based on these agreements, which also confirms that foreign investors know about these treaties and the protection they offer.
8 This section draws on various studies by UNCTAD, IMF, the World Bank and AfDB as well as investor surveys by UNIDO and COMESA.
9 According to UNIDO surveys (2001, 2003 and 2005), inflows from emerging economies and other developing countries are growing faster than those from the developed countries, reflecting greater optimism of investors from the former group in African economic prospects.
10 Official development assistance in 2006 was an estimated $40 billion, while private capital flows that year were $48 billion, ac-cording to OECD’s Development Assistance Committee and IMF sources.
11 FDI from Africa in many small African economies may well be understated in official FDI data, as much of it probably goes to the informal sector, which is not included in government statistics.
144 Assessing Regional Integration in Africa (ARIA V): Towards an African Continental Free Trade Area
12 Such investment is mainly made by foreign companies operating in Mauritius.
13 IIAs are treaties between countries that address issues of protec-tion, promotion and liberalisation of cross boarder investments with emphasis on FDIs and portfolio investments.
14 In the second half of 2009, seven African countries signed IIAs (UNCTAD, 2009–2010).
15 WTO has agreements that are directly relevant to FDI, namely the General Agreement on Trade in Services (GATS) that covers, among others, the international delivery of services through the cross-border establishment of production facilities (mode three), the Agreement on Trade-Related Investment Measures (TRIMS) that prohibits a number of trade-in-goods-related performance requirements, and the Agreement on Trade-Related Aspects of Intellectual Property Rights (TRIPs) that deals with intellectual property as one form of investment.
16 Eight common members of both SADC and COMESA are sig-natories to both the CCIA and SIFP, four out of the five member countries of EAC are signatories to the CCIA and one has com-mitments to SIFP. Complicating matters, many countries in the COMESA–EAC–SADC tripartite initiative are also committed to bilateral BITs and DTTs.
17 Benin; Burkina Faso; Côte d’Ivoire; Comoros; Congo, Rep. of; Congo, Dem. Rep. of; Gabon; Gambia; Ghana; Libya; Senegal; Sierra Leone; São Tomé and Príncipe; Togo; and Zambia. Libya has also ratified.
18 The analysis in this chapter by necessity overemphasizes MNEs. Although they dominate private capital flows, the analysis leaves out small and medium-sized companies, which are likely to provide much of Africa’s growth over the long term. However, as data on them become more available, more robust analysis and conclusions will be possible.
19 The findings of the study were validated at a stakeholders’ work-shop that brought together officials from African central banks, ministries of finance and ministries of trade.
20 Although market forces will lead to at least partial regional finan-cial integration following trade integration, the reverse causation (financial leading to trade integration) is not assured.
21 The roadmap proposed by the AfDB confirms a roadmap for regional stock market integration put forward by Mbaru (2008).
22 Most firms complain about taxes, but taxes finance public services that benefit the investment climate and other social goals. Many firms would also prefer to comply with fewer regulations, but sound regulation addresses market failures and can therefore improve the investment climate and protect other social interests.