Embed Size (px)
Citation preview
© 2009 Eaton Corporation. All rights reserved.
Eaton CorporationSandy CutlerChairman and Chief Executive OfficerSanford C. Bernstein Strategic Decisions ConferenceMay 27, 2009
2 2
Forward-looking statements and Non-GAAP financial information
The information provided at our conference today will include forward-looking statements relating to our goals and estimates for future years, including statements about future sales, net income, net income per share, operating earnings, operating earnings per share, worldwide markets, income tax liability, acquisitions and others. Those statements can be identified by the indication that they are for future periods and should be used with caution. They are subject to various risks and uncertainties, many of which are outside the Company’s control. Factors that could cause actual results to differ materially from those in the forward-looking statements include: unanticipated changes in the markets for the Company's business segments; unanticipated downturns in business relationships with customers or their purchases from us; competitive pressures on sales and pricing; unexpected increases in the cost of material and other production costs that cannot be recouped in product pricing; introduction of competing technologies; unexpected technical or marketing difficulties; unexpected claims, charges, litigation or dispute resolutions; income tax liability; acquisitions and divestitures; our ability to integrate recent acquisitions and close pending transactions; new laws and governmental regulations; interest rate changes; stock market fluctuations; and unanticipated deterioration of economic and financial conditions in the United States and around the world. We do not assume any obligation to update these forward-looking statements.
This presentation includes certain non-GAAP measures as defined by SEC rules. A reconciliation of those measures to the most directly comparable GAAP equivalent is provided in your packet.
3 3
Eaton Corporation –Powering Business Worldwide
• Power management company
• Business balance
• Financial overview and 2009 guidance
4 4
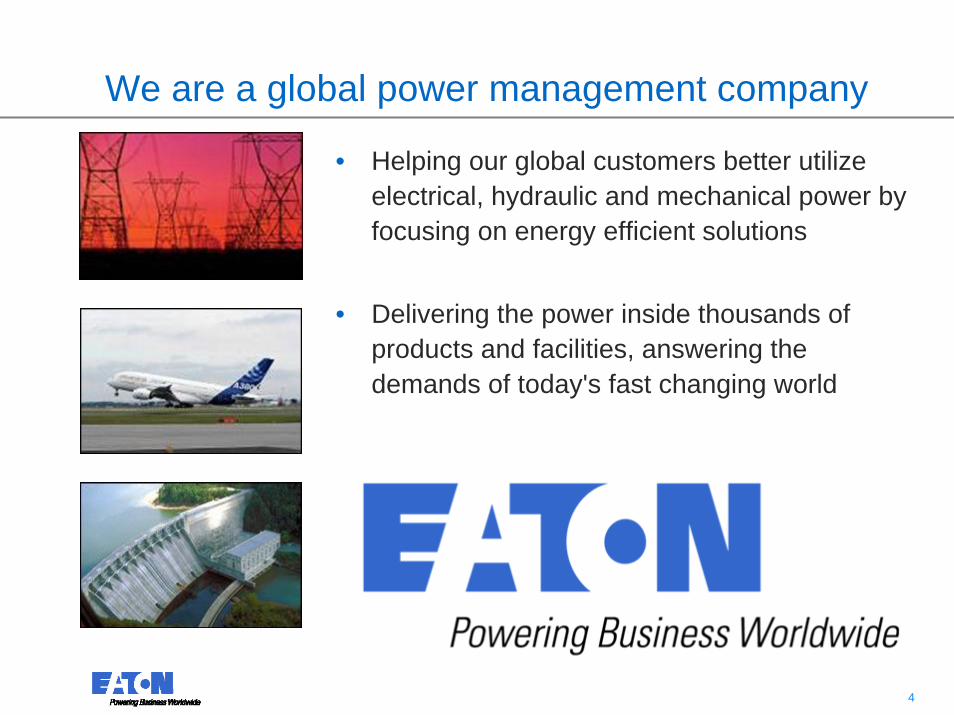
We are a global power management company
• Helping our global customers better utilize electrical, hydraulic and mechanical power by focusing on energy efficient solutions
• Delivering the power inside thousands of products and facilities, answering the demands of today's fast changing world
5 5
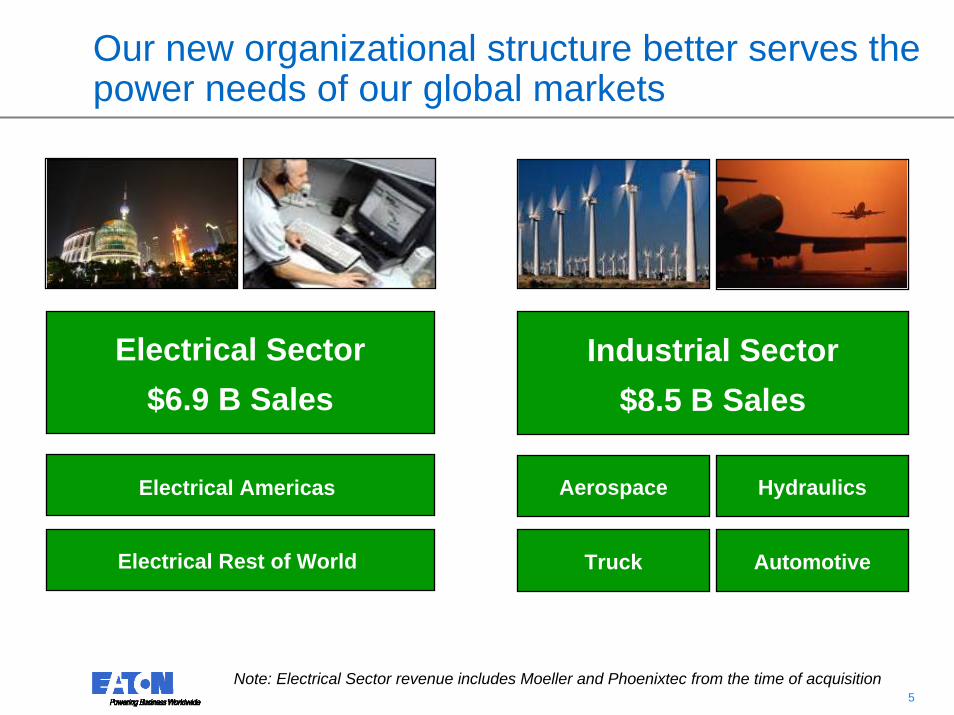
Our new organizational structure better serves the power needs of our global markets
Industrial Sector$8.5 B Sales
Truck
Aerospace Hydraulics
Automotive
Electrical Sector$6.9 B Sales
Electrical Americas
Electrical Rest of World
Note: Electrical Sector revenue includes Moeller and Phoenixtec from the time of acquisition
6 6
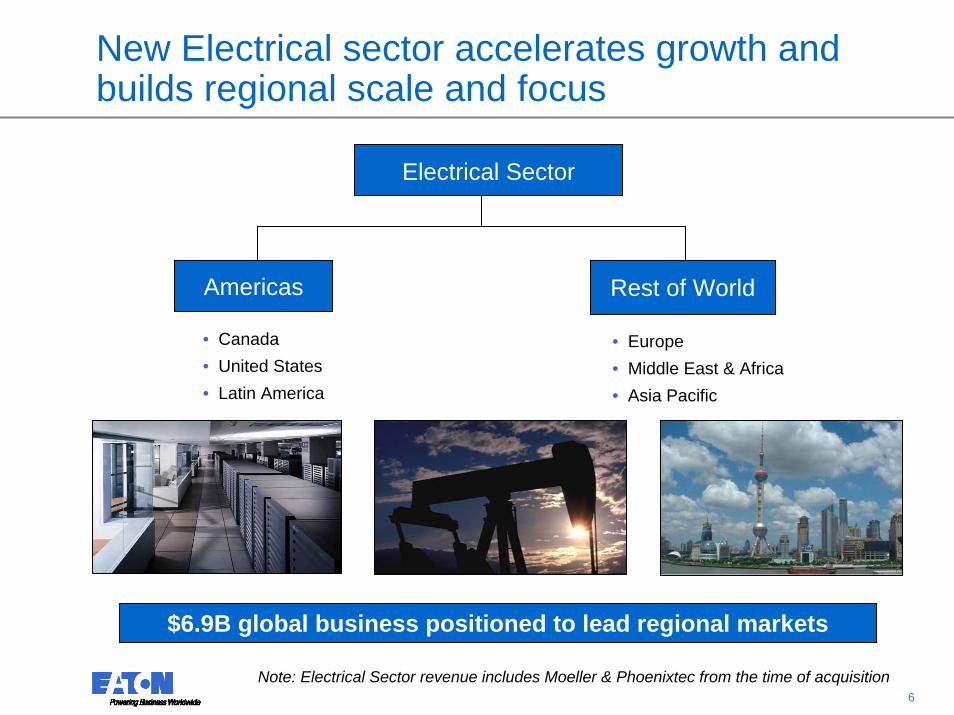
New Electrical sector accelerates growth and builds regional scale and focus
$6.9B global business positioned to lead regional markets
Note: Electrical Sector revenue includes Moeller & Phoenixtec from the time of acquisition
Electrical Sector
Americas
• Canada• United States• Latin America
Rest of World
• Europe• Middle East & Africa• Asia Pacific
7 7
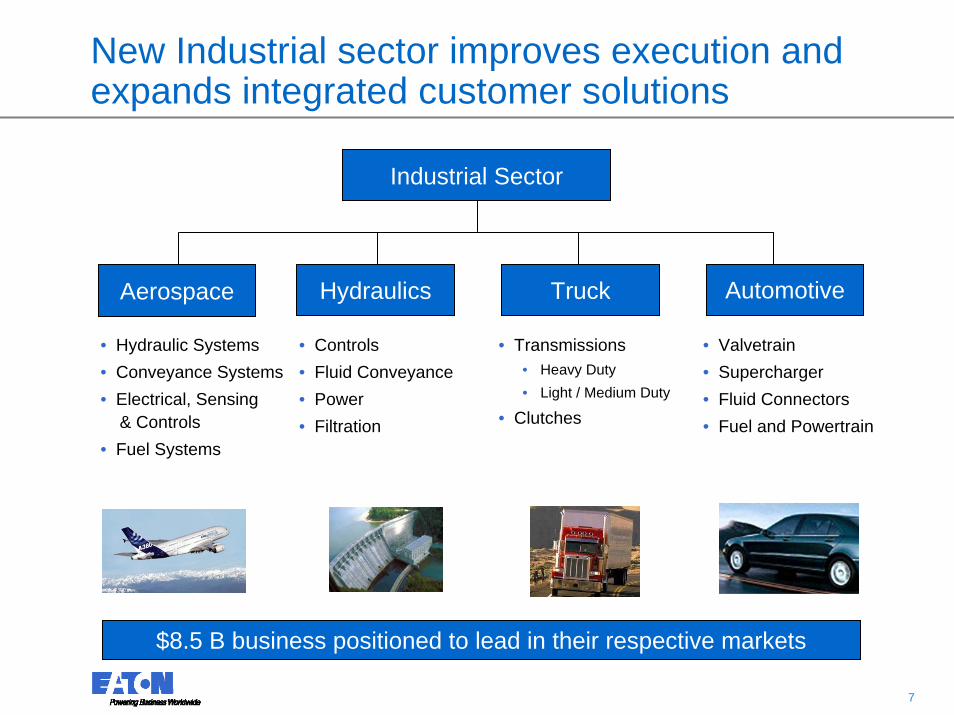
New Industrial sector improves execution and expands integrated customer solutions
$8.5 B business positioned to lead in their respective markets
Industrial Sector
Aerospace Hydraulics Truck Automotive
• Hydraulic Systems• Conveyance Systems• Electrical, Sensing
& Controls• Fuel Systems
• Controls• Fluid Conveyance• Power• Filtration
• Transmissions• Heavy Duty• Light / Medium Duty
• Clutches
• Valvetrain• Supercharger • Fluid Connectors• Fuel and Powertrain
8 8
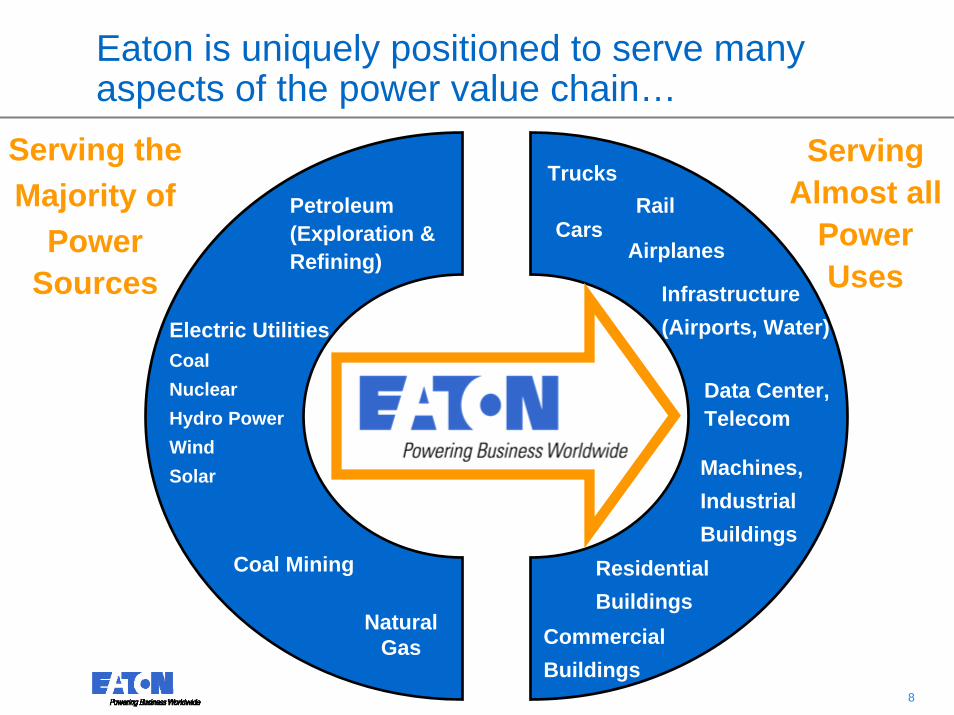
Eaton is uniquely positioned to serve many aspects of the power value chain…
ServingAlmost all
PowerUses
Serving theMajority of
PowerSources
Electric UtilitiesCoalNuclearHydro PowerWindSolar
Coal Mining
Petroleum (Exploration & Refining)
Residential Buildings
Commercial Buildings
Machines,Industrial Buildings
Infrastructure (Airports, Water)
Data Center, Telecom
Cars
TrucksRail
Airplanes
Natural Gas
9 9
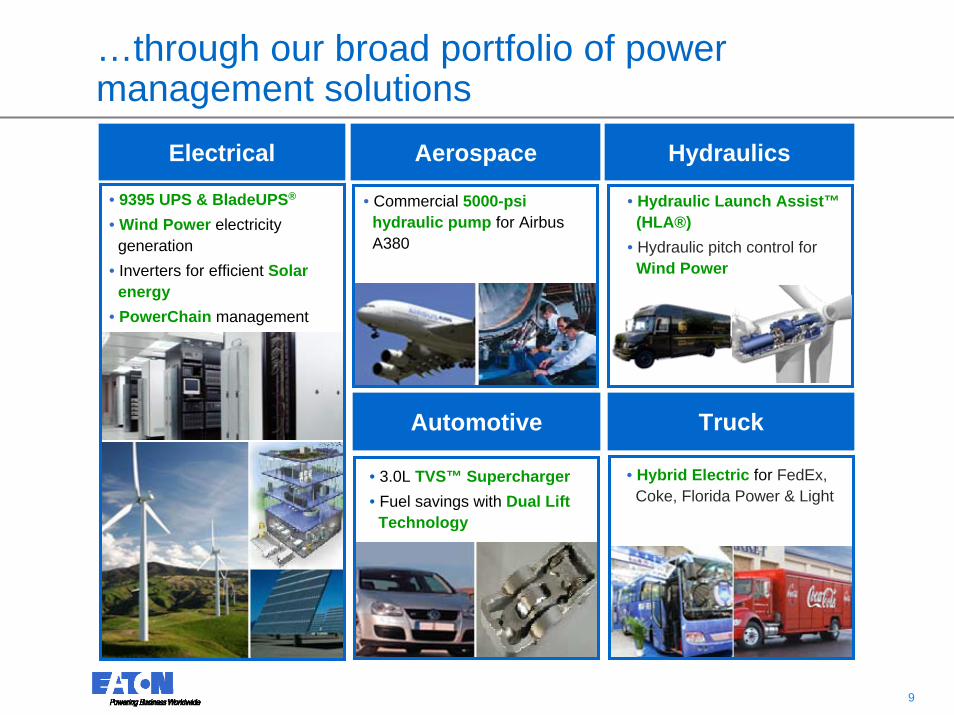
…through our broad portfolio of power management solutions
Electrical Hydraulics
Automotive
Aerospace
Truck
• 9395 UPS & BladeUPS®
• Wind Power electricitygeneration
• Inverters for efficient Solarenergy
• PowerChain management
• Commercial 5000-psi hydraulic pump for Airbus A380
• Hybrid Electric for FedEx,Coke, Florida Power & Light
• 3.0L TVS™ Supercharger• Fuel savings with Dual Lift
Technology
• Hydraulic Launch Assist™(HLA®)
• Hydraulic pitch control for Wind Power
10 10
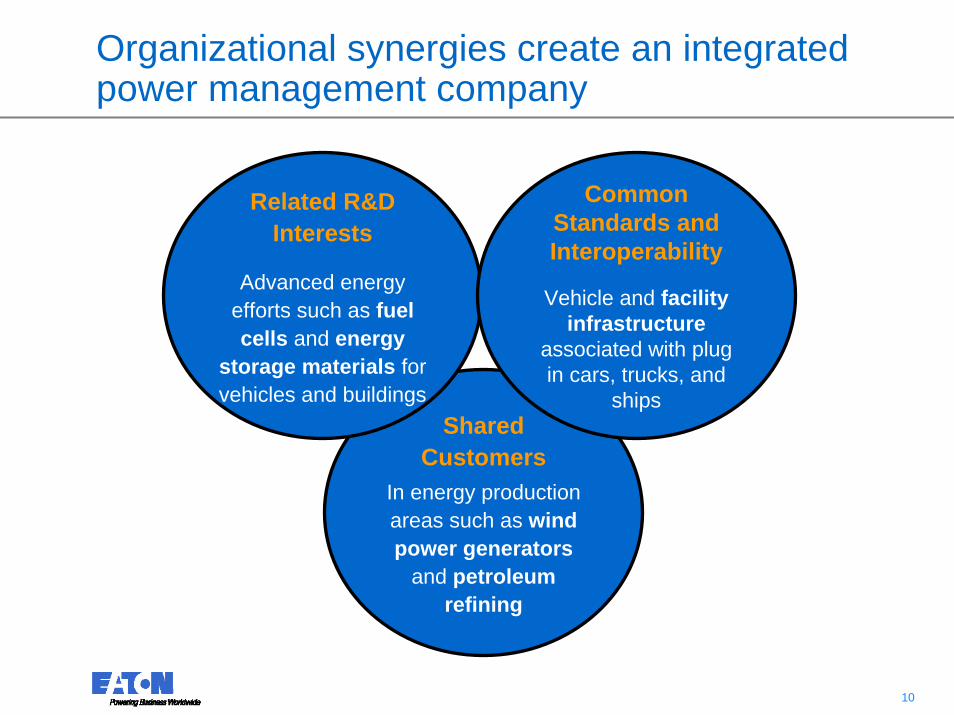
Shared Customers
In energy production areas such as wind power generators
and petroleum refining
Organizational synergies create an integrated power management company
Related R&D Interests
Advanced energy efforts such as fuel cells and energy
storage materials for vehicles and buildings
Common Standards and Interoperability
Vehicle and facility infrastructure
associated with plug in cars, trucks, and
ships
11 11
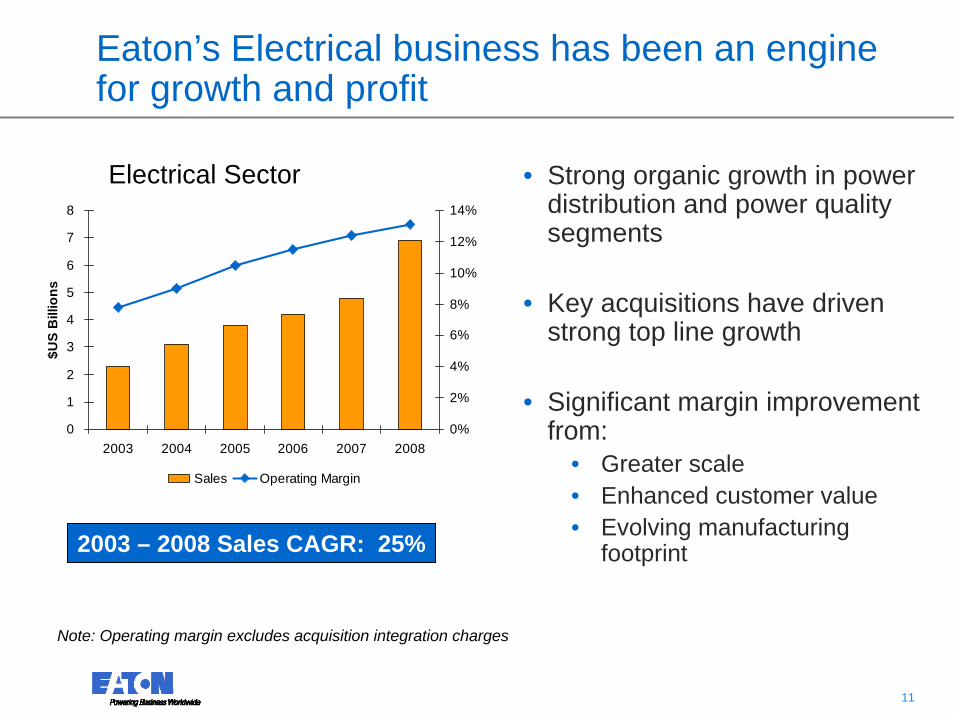
Eaton’s Electrical business has been an engine for growth and profit
Electrical Sector • Strong organic growth in power distribution and power quality segments
• Key acquisitions have driven strong top line growth
• Significant margin improvement from:
• Greater scale • Enhanced customer value• Evolving manufacturing
footprint
Note: Operating margin excludes acquisition integration charges
2003 – 2008 Sales CAGR: 25%
0
1
2
3
4
5
6
7
8
2003 2004 2005 2006 2007 2008
$US
Bill
ions
0%
2%
4%
6%
8%
10%
12%
14%
Sales Operating Margin
12 12
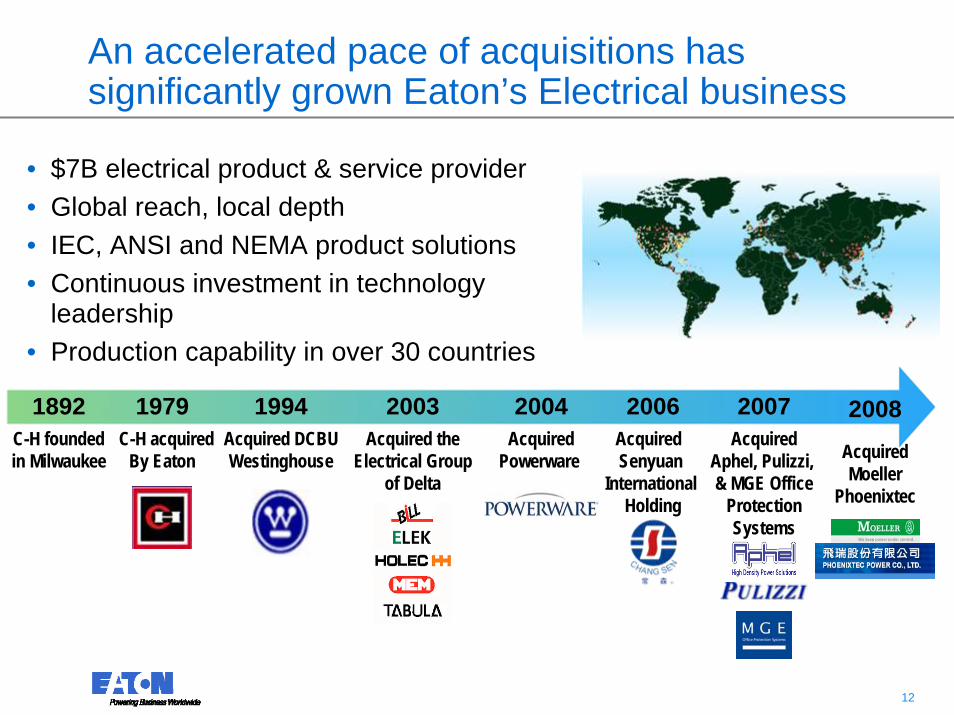
An accelerated pace of acquisitions has significantly grown Eaton’s Electrical business
• $7B electrical product & service provider • Global reach, local depth• IEC, ANSI and NEMA product solutions• Continuous investment in technology
leadership• Production capability in over 30 countries
C-H acquiredBy Eaton
AcquiredPowerware
Acquired theElectrical Group
of Delta
Acquired DCBUWestinghouse
C-H foundedin Milwaukee
1979 2004200319941892Acquired
Aphel, Pulizzi, & MGE Office
ProtectionSystems
20082007
AcquiredMoeller
Phoenixtec
Acquired Senyuan
International Holding
2006
13 13
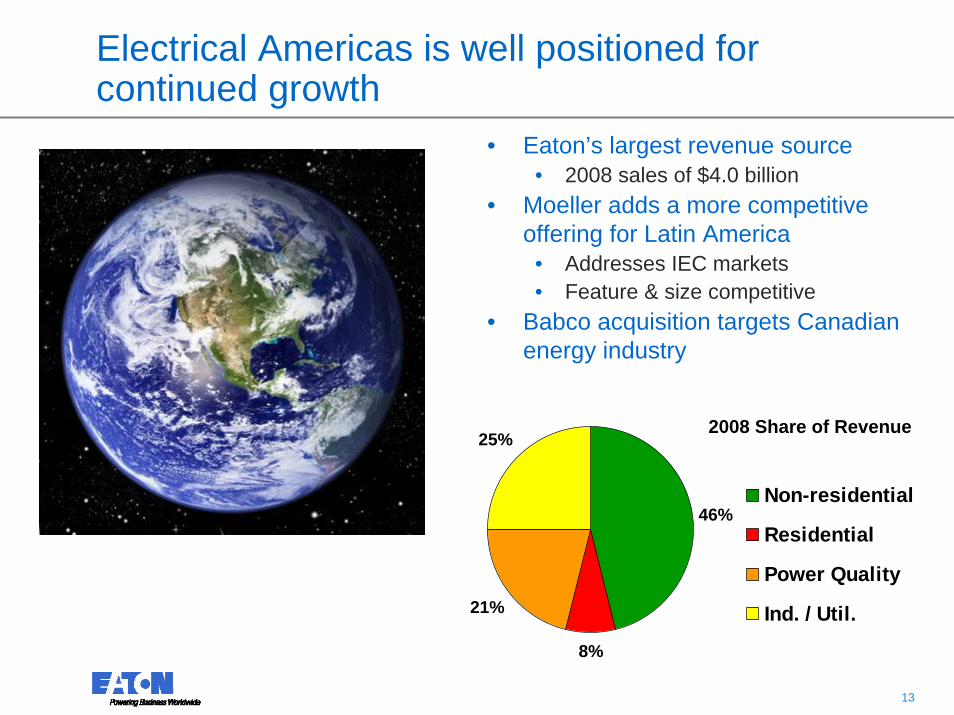
Electrical Americas is well positioned for continued growth
• Eaton’s largest revenue source• 2008 sales of $4.0 billion
• Moeller adds a more competitive offering for Latin America
• Addresses IEC markets• Feature & size competitive
• Babco acquisition targets Canadian energy industry
46%
8%
21%
25%
Non-residential
Residential
Power Quality
Ind. / Util.
2008 Share of Revenue
14 14
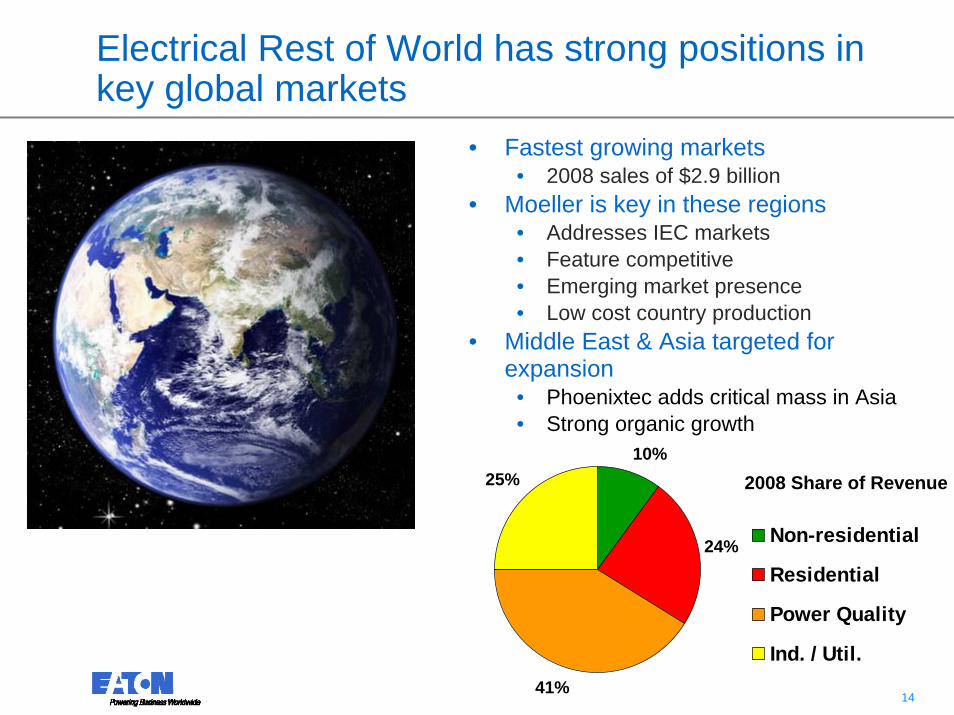
Electrical Rest of World has strong positions in key global markets
• Fastest growing markets• 2008 sales of $2.9 billion
• Moeller is key in these regions • Addresses IEC markets• Feature competitive• Emerging market presence• Low cost country production
• Middle East & Asia targeted for expansion
• Phoenixtec adds critical mass in Asia• Strong organic growth
2008 Share of Revenue10%
24%
41%
25%
Non-residential
Residential
Power Quality
Ind. / Util.
15 15
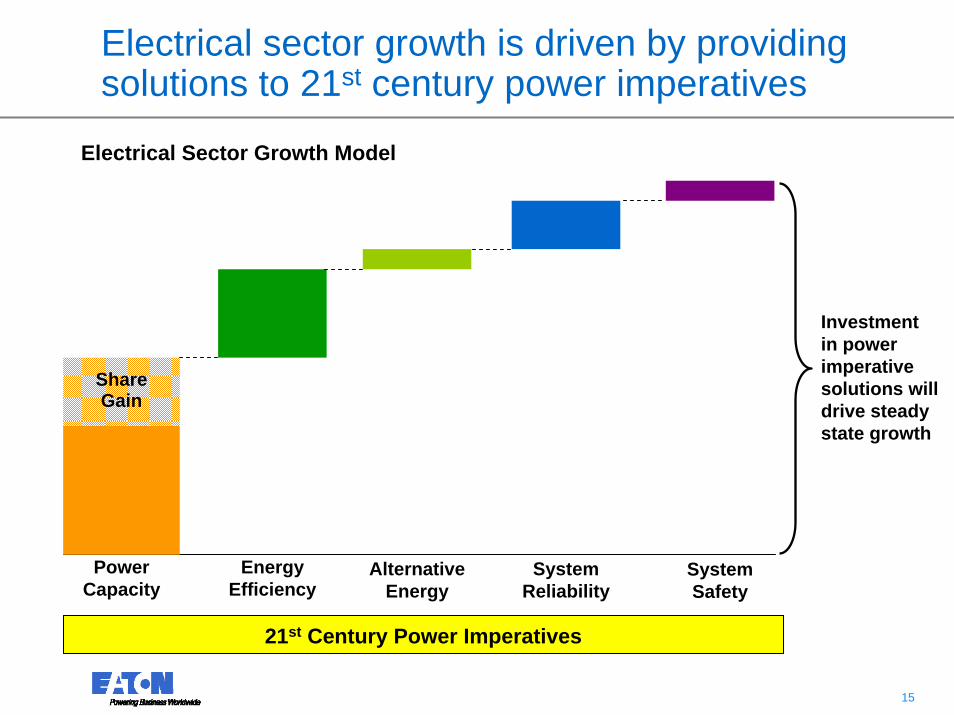
Electrical sector growth is driven by providing solutions to 21st century power imperatives
Power Capacity
Energy Efficiency
Share Gain
System Reliability
Alternative Energy
System Safety
Investment in power imperative solutions will drive steady state growth
Electrical Sector Growth Model
21st Century Power Imperatives
16 16
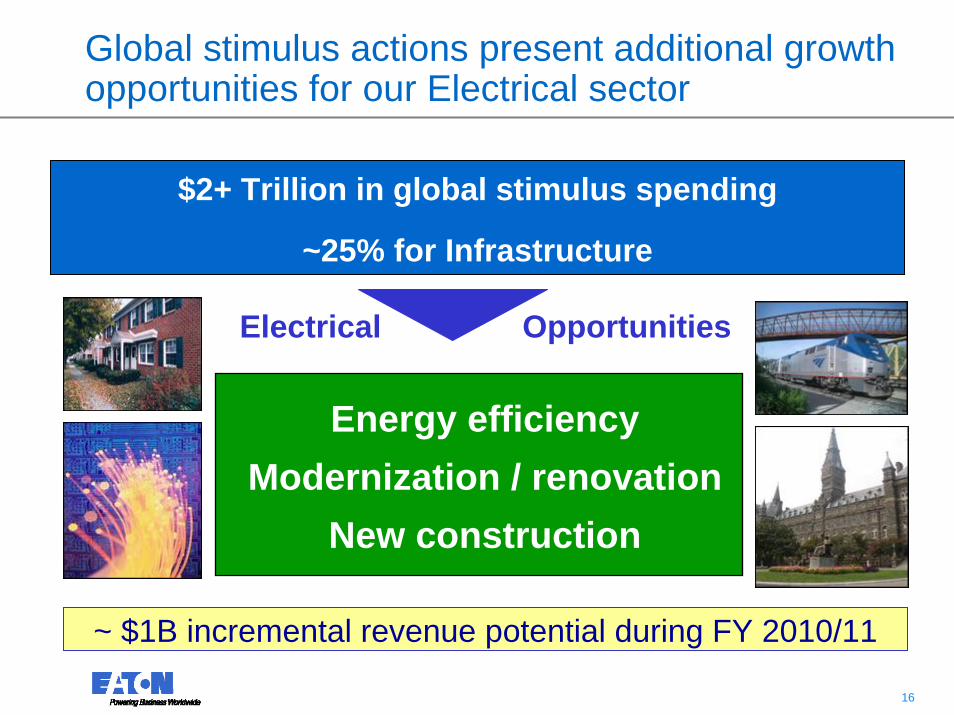
Global stimulus actions present additional growth opportunities for our Electrical sector
Energy efficiencyModernization / renovation
New construction
$2+ Trillion in global stimulus spending
~25% for Infrastructure
Electrical Opportunities
~ $1B incremental revenue potential during FY 2010/11
17 17
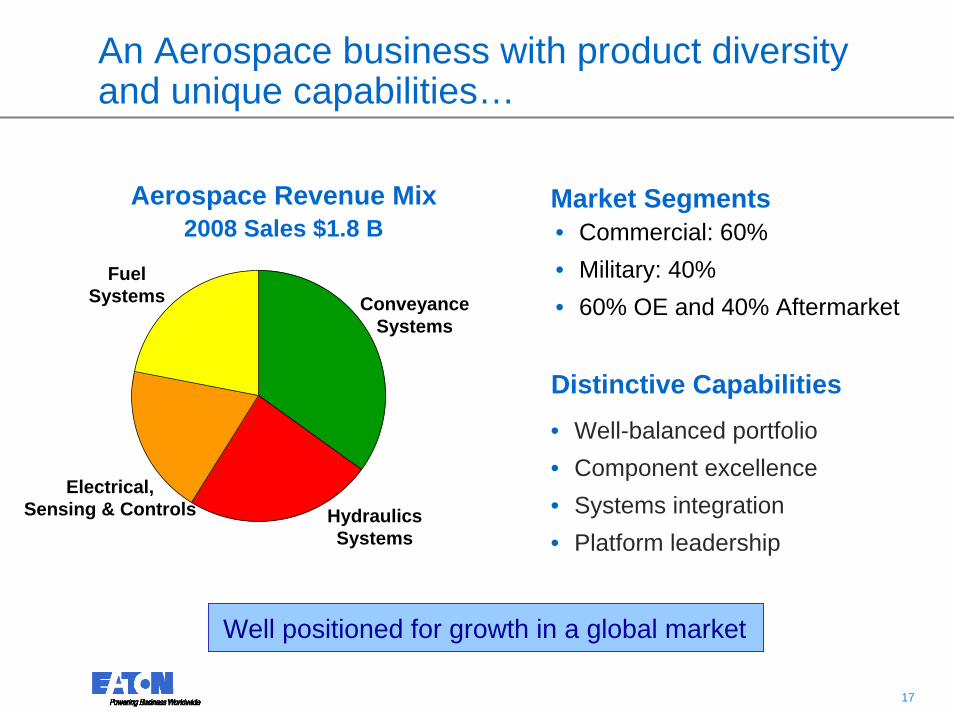
An Aerospace business with product diversity and unique capabilities…
• Well-balanced portfolio• Component excellence• Systems integration• Platform leadership
• Commercial: 60%• Military: 40%• 60% OE and 40% Aftermarket
Market Segments
Distinctive Capabilities
Conveyance Systems
Fuel Systems
Electrical, Sensing & Controls Hydraulics
Systems
Aerospace Revenue Mix2008 Sales $1.8 B
Well positioned for growth in a global market
18 18
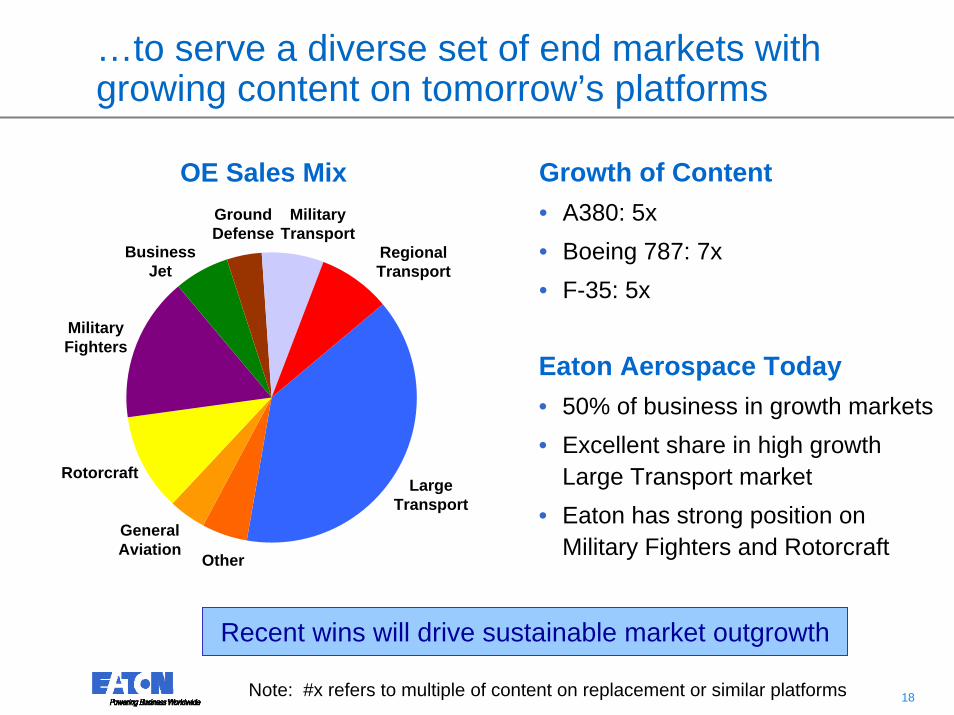
Rotorcraft
Military Fighters
Large Transport
Regional Transport
Business Jet
General Aviation
Military Transport
Ground Defense
Other
…to serve a diverse set of end markets with growing content on tomorrow’s platforms
OE Sales Mix Growth of Content• A380: 5x• Boeing 787: 7x• F-35: 5x
Eaton Aerospace Today• 50% of business in growth markets• Excellent share in high growth
Large Transport market• Eaton has strong position on
Military Fighters and Rotorcraft
Recent wins will drive sustainable market outgrowth
Note: #x refers to multiple of content on replacement or similar platforms
19 19
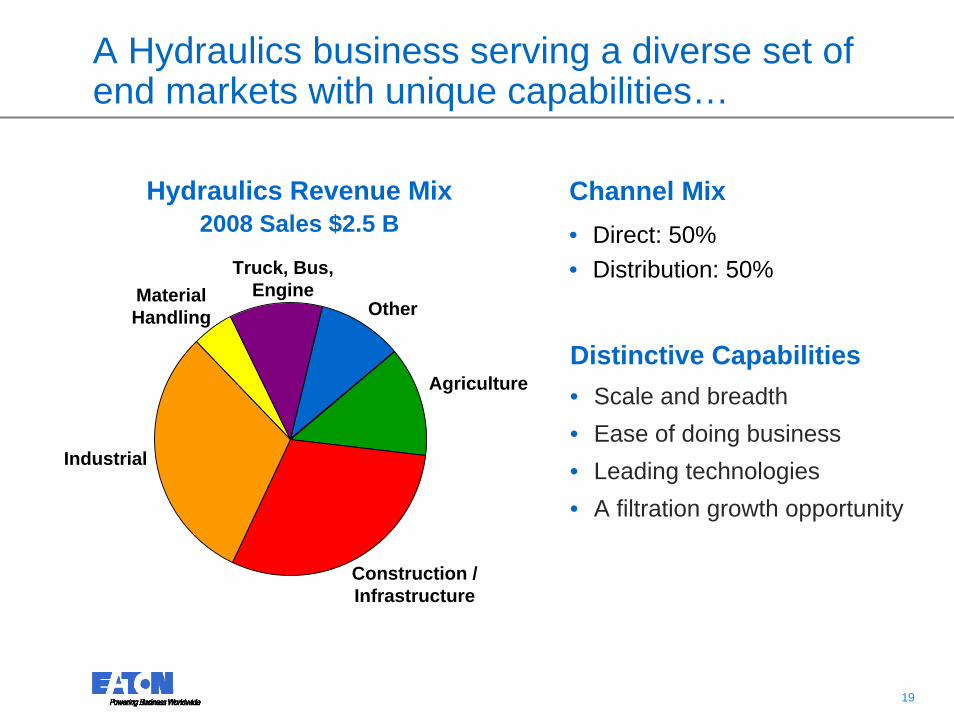
A Hydraulics business serving a diverse set of end markets with unique capabilities…
• Direct: 50%• Distribution: 50%
Channel Mix
• Scale and breadth• Ease of doing business• Leading technologies • A filtration growth opportunity
Distinctive Capabilities
Hydraulics Revenue Mix 2008 Sales $2.5 B
Industrial
Material Handling
Agriculture
Truck, Bus, Engine
Construction / Infrastructure
Other
20 20
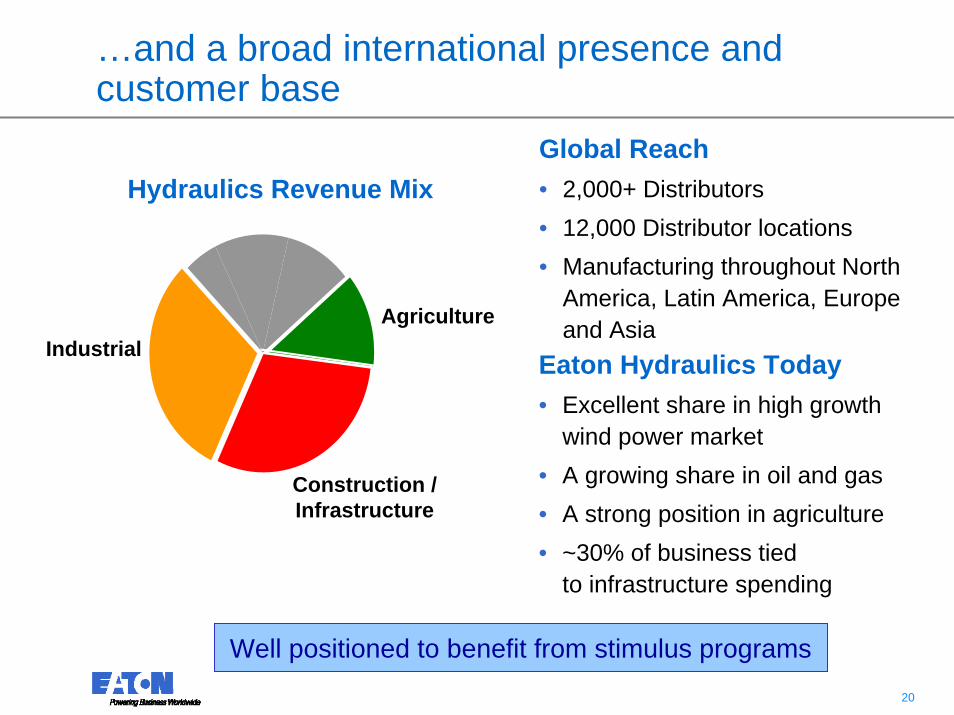
…and a broad international presence and customer base
Hydraulics Revenue MixGlobal Reach• 2,000+ Distributors• 12,000 Distributor locations• Manufacturing throughout North
America, Latin America, Europe and Asia
Eaton Hydraulics Today• Excellent share in high growth
wind power market• A growing share in oil and gas• A strong position in agriculture• ~30% of business tied
to infrastructure spending
IndustrialAgriculture
Construction / Infrastructure
Well positioned to benefit from stimulus programs
21 21
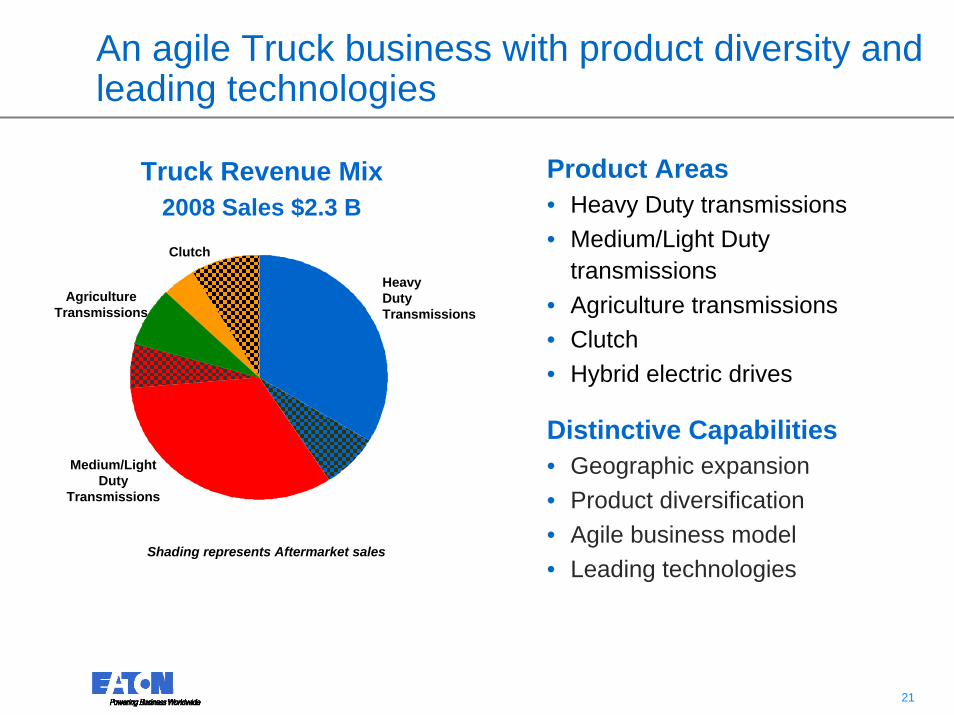
An agile Truck business with product diversity and leading technologies
Truck Revenue Mix 2008 Sales $2.3 B
Product Areas• Heavy Duty transmissions• Medium/Light Duty
transmissions• Agriculture transmissions• Clutch• Hybrid electric drives
Distinctive Capabilities• Geographic expansion • Product diversification• Agile business model• Leading technologies
HeavyDutyTransmissions
Medium/LightDuty
Transmissions
Clutch
AgricultureTransmissions
Shading represents Aftermarket sales
22 22
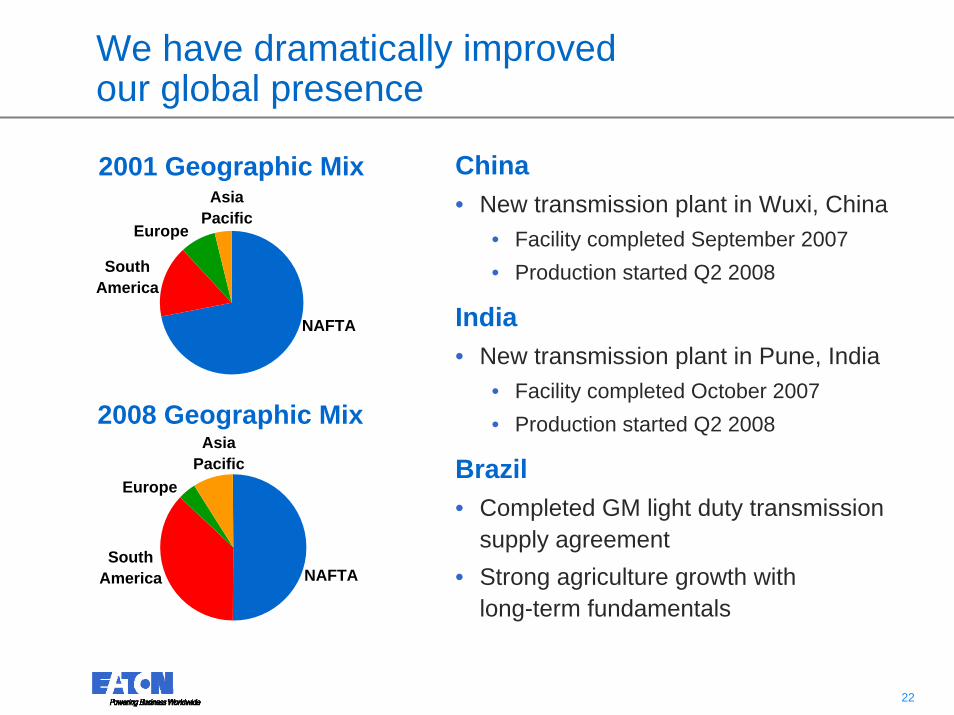
We have dramatically improved our global presence
2001 Geographic Mix
2008 Geographic Mix
China• New transmission plant in Wuxi, China
• Facility completed September 2007• Production started Q2 2008
India• New transmission plant in Pune, India
• Facility completed October 2007• Production started Q2 2008
Brazil• Completed GM light duty transmission
supply agreement• Strong agriculture growth with
long-term fundamentals
NAFTA
Asia Pacific
Europe
South America
NAFTA
Asia Pacific
Europe
South America
23 23
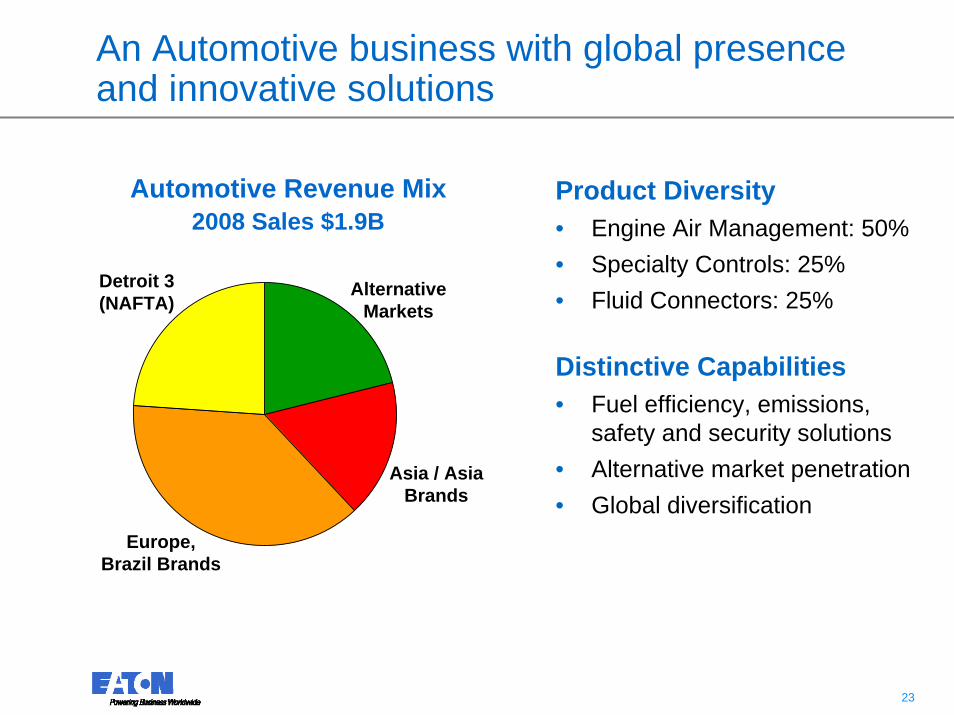
An Automotive business with global presence and innovative solutions
Product Diversity• Engine Air Management: 50%• Specialty Controls: 25%• Fluid Connectors: 25%
Distinctive Capabilities• Fuel efficiency, emissions,
safety and security solutions• Alternative market penetration• Global diversification
Automotive Revenue Mix 2008 Sales $1.9B
Alternative Markets
Asia / Asia Brands
Europe, Brazil Brands
Detroit 3 (NAFTA)
24 24
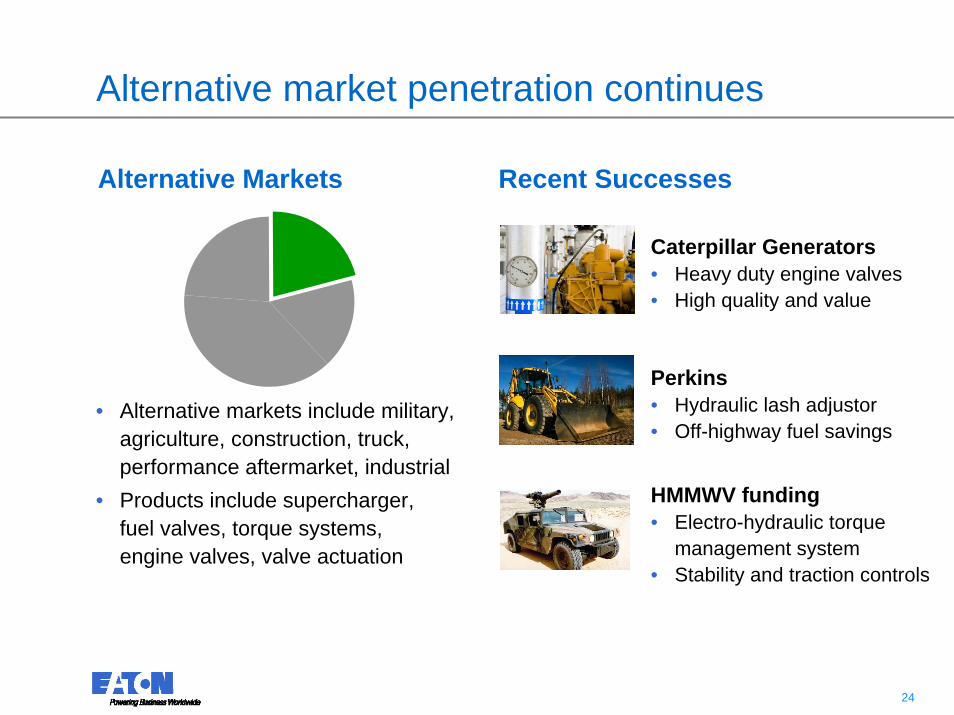
Alternative market penetration continues
Alternative Markets
• Alternative markets include military, agriculture, construction, truck, performance aftermarket, industrial
• Products include supercharger, fuel valves, torque systems, engine valves, valve actuation
Caterpillar Generators• Heavy duty engine valves• High quality and value
Recent Successes
Perkins• Hydraulic lash adjustor• Off-highway fuel savings
HMMWV funding• Electro-hydraulic torque
management system• Stability and traction controls
25 25
Eaton Corporation –Powering Business Worldwide
• Power management company
• Business balance
• Financial overview and 2009 guidance
26 26
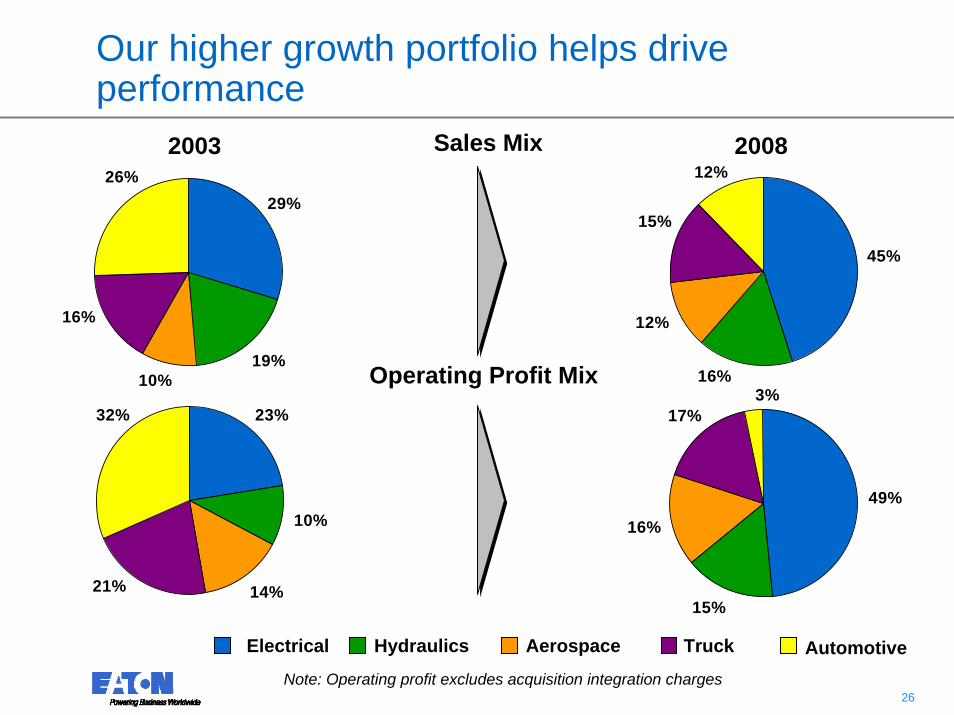
Our higher growth portfolio helps drive performance
29%
19%10%
26%
16%
45%
12%
16%
12%
15%
23%
14%
10%
32%
21%15%
49%
16%
3%17%
Sales Mix
Operating Profit Mix
2003 2008
Electrical Aerospace Truck AutomotiveHydraulics
Note: Operating profit excludes acquisition integration charges
27 27
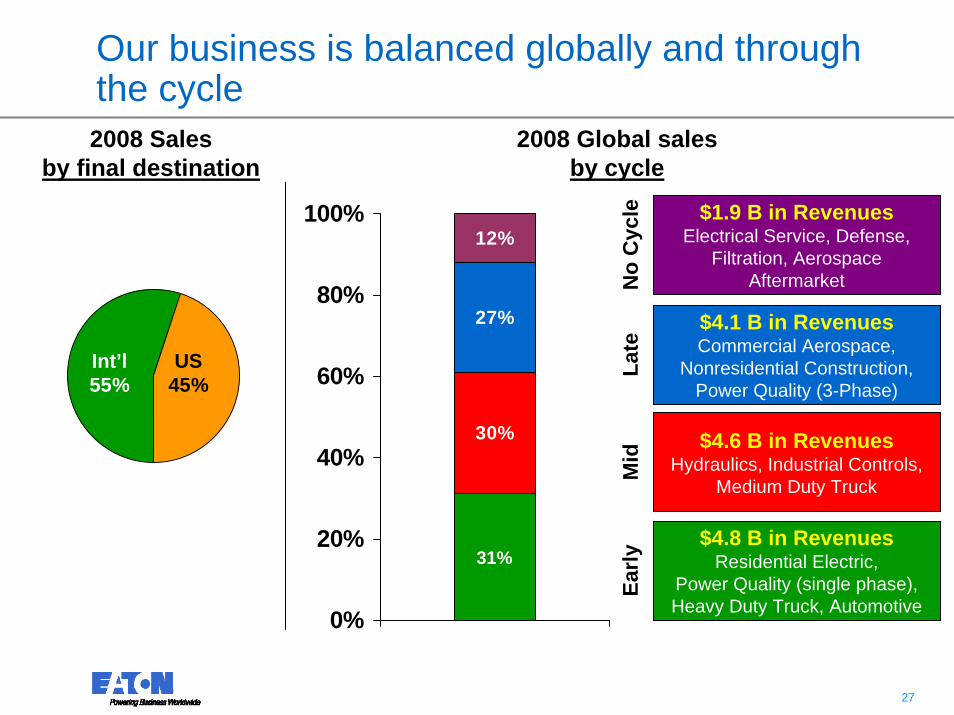
Our business is balanced globally and through the cycle2008 Sales
by final destination
Int’l55%
US45%
27%
12%
31%
30%
0%
20%
40%
60%
80%
100% $1.9 B in RevenuesElectrical Service, Defense,
Filtration, Aerospace Aftermarket
$4.1 B in RevenuesCommercial Aerospace,
Nonresidential Construction, Power Quality (3-Phase)
$4.6 B in RevenuesHydraulics, Industrial Controls,
Medium Duty Truck
$4.8 B in RevenuesResidential Electric,
Power Quality (single phase),Heavy Duty Truck, Automotive
Early
Mid
Late
No
Cyc
le
2008 Global salesby cycle
28 28
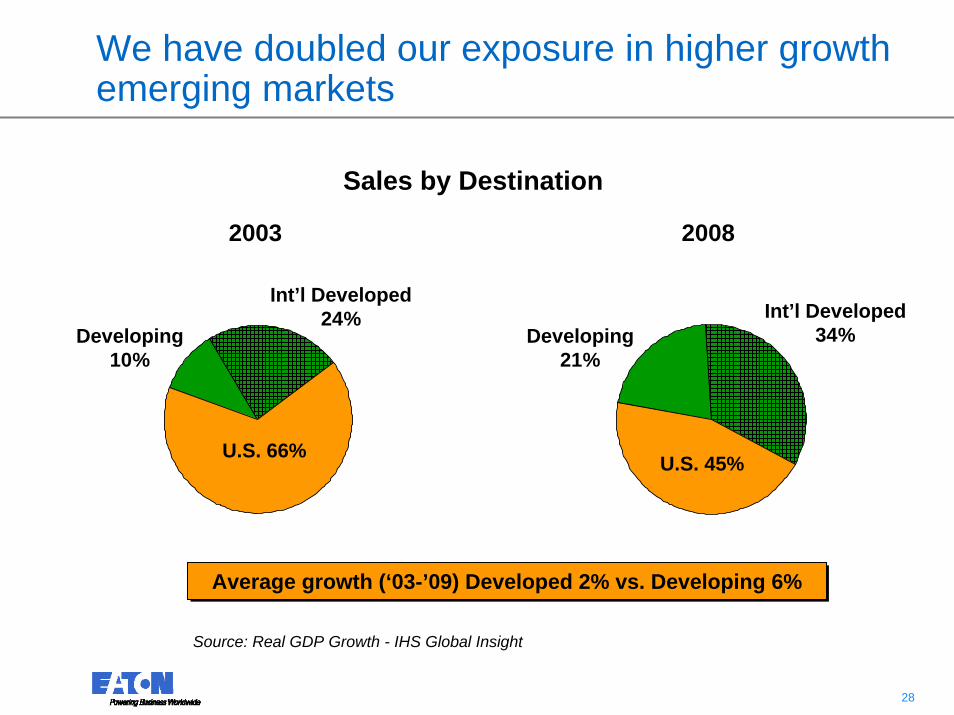
We have doubled our exposure in higher growth emerging markets
Sales by Destination
U.S. 66%
2003 2008
Average growth (‘03-’09) Developed 2% vs. Developing 6%Average growth (‘03-’09) Developed 2% vs. Developing 6%
Source: Real GDP Growth - IHS Global Insight
Developing21%
Developing10%
Int’l Developed24% Int’l Developed
34%
U.S. 45%
29 29
Eaton Corporation –Powering Business Worldwide
• Power management company
• Business balance
• Financial overview and 2009 guidance
30 30
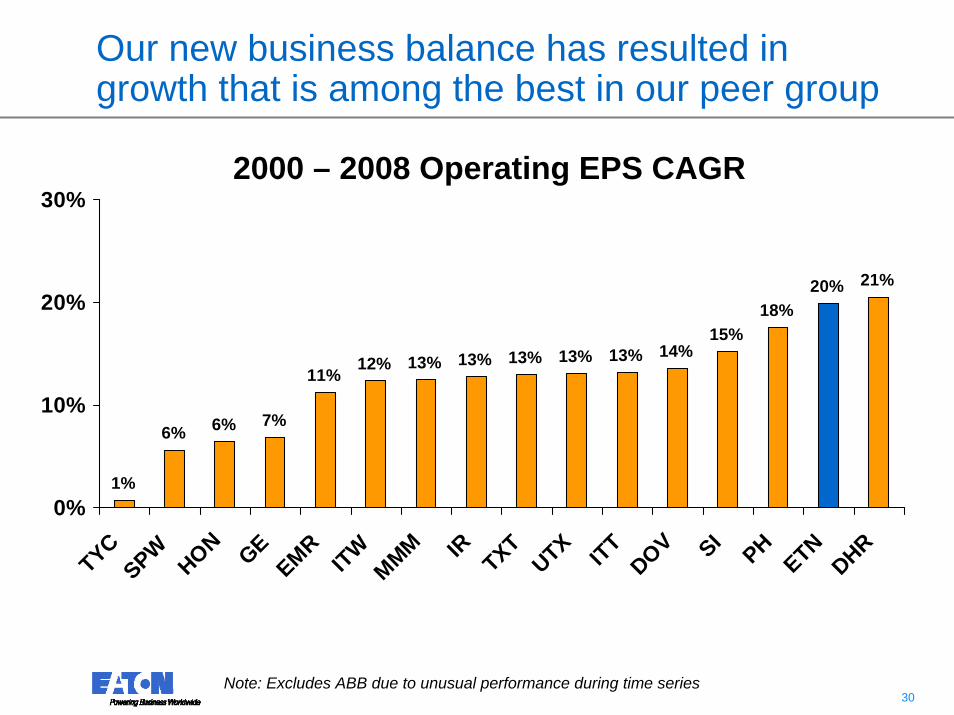
6% 7%
11% 12% 13% 13% 13% 13% 13% 14%15%
18%20% 21%
1%
6%
0%
10%
20%
30%
TYCSPWHON GEEMRITWMMM IR TXT
UTX ITTDOV SI
PHETNDHR
2000 – 2008 Operating EPS CAGR
Note: Excludes ABB due to unusual performance during time series
Our new business balance has resulted in growth that is among the best in our peer group
31 31
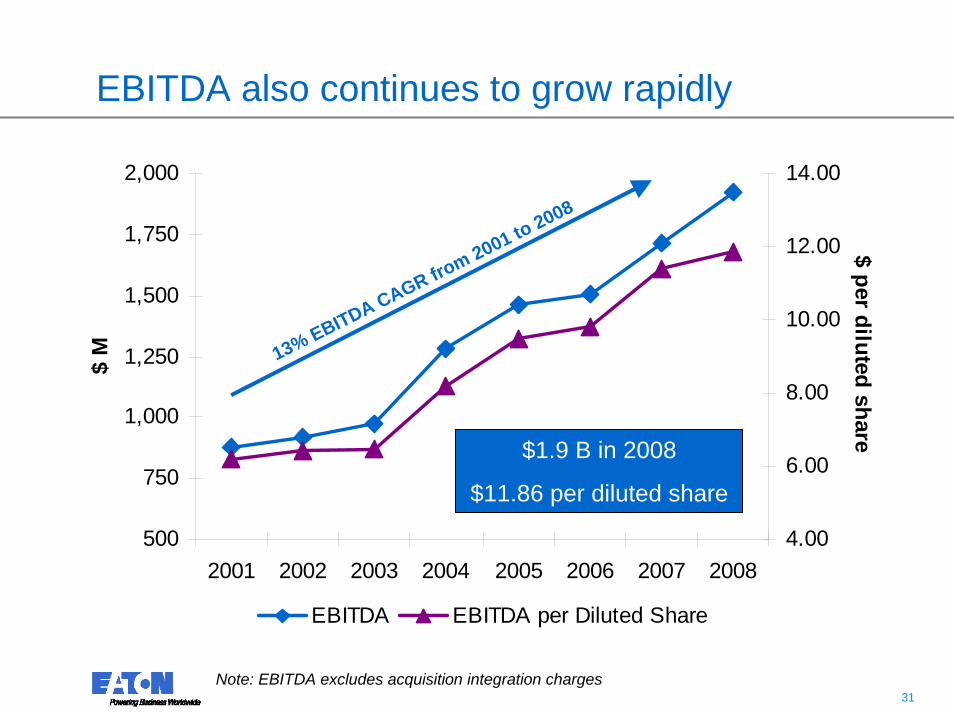
EBITDA also continues to grow rapidly
500
750
1,000
1,250
1,500
1,750
2,000
2001 2002 2003 2004 2005 2006 2007 2008
$ M
4.00
6.00
8.00
10.00
12.00
14.00
$ per diluted share
EBITDA EBITDA per Diluted Share
$1.9 B in 2008
$11.86 per diluted share
13% EBITDA CAGR from 2001 to 2008
Note: EBITDA excludes acquisition integration charges
32 32
We maintain a conservative capital structure
• Debt ratios kept within targeted bands• Maintain three 5-year back-up facilities with
staggered maturities• $1.7 billion in total
• Manage commercial paper maturities to ensure moderate daily funding needs
• Term debt maturities over the next several years are modest• $265 M in 2009• $281 M in 2010• $0 M in 2011
33 33
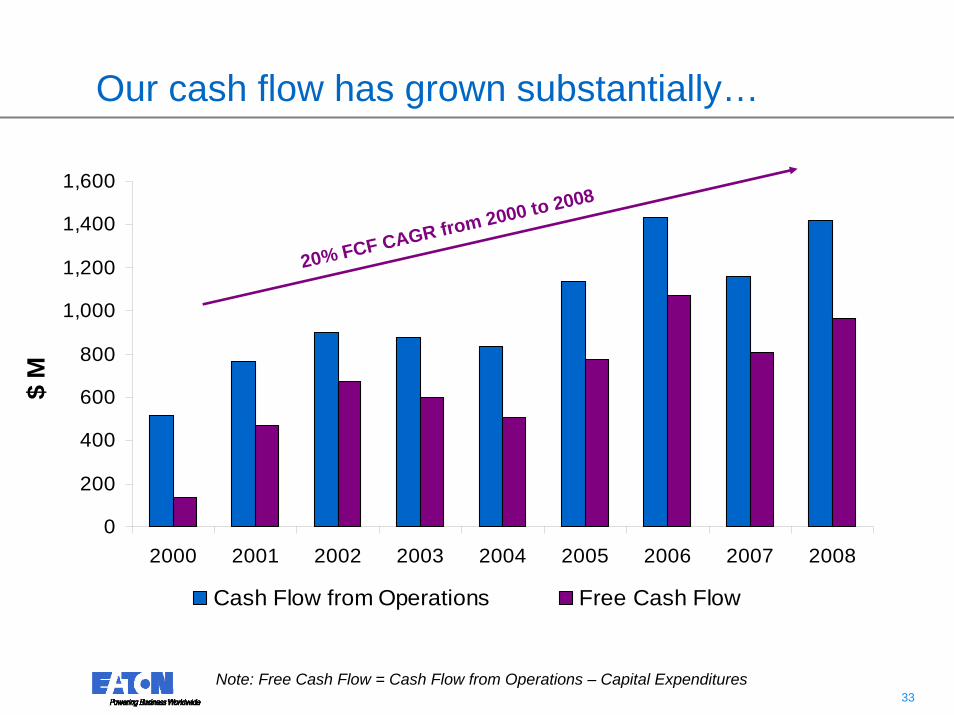
Our cash flow has grown substantially…
0
200
400
600
800
1,000
1,200
1,400
1,600
2000 2001 2002 2003 2004 2005 2006 2007 2008
$ M
Cash Flow from Operations Free Cash Flow
20% FCF CAGR from 2000 to 2008
Note: Free Cash Flow = Cash Flow from Operations – Capital Expenditures
34 34
050
100150200250300350
2000
2001
2002
2003
2004
2005
2006
2007
2008
$ M
$0
$1
$2
$3
$ / basic share
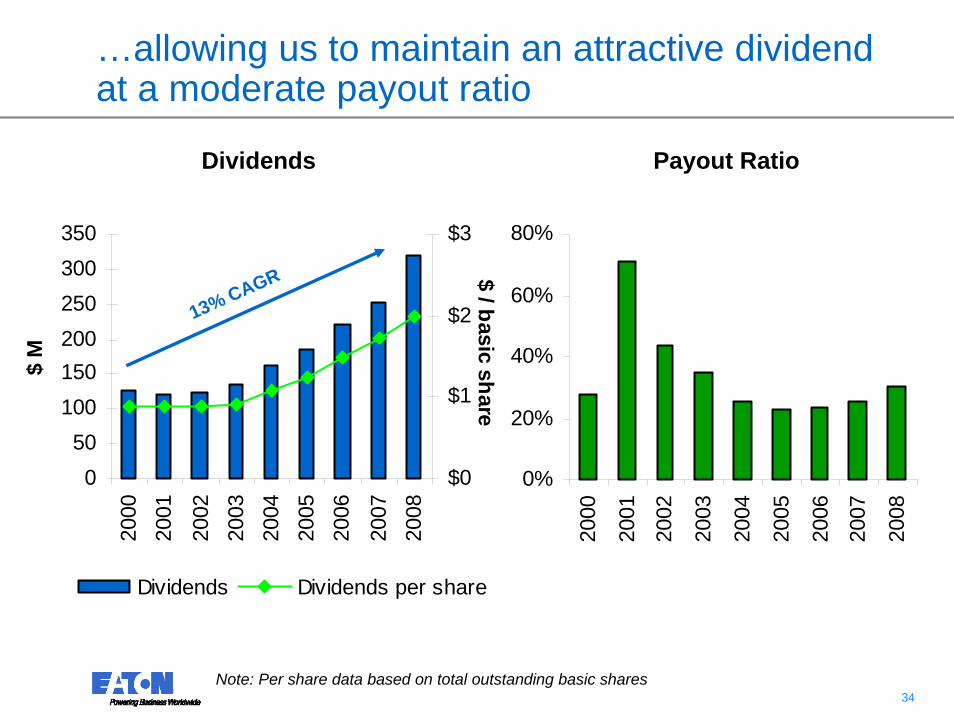
Dividends Dividends per share
0%
20%
40%
60%
80%
2000
2001
2002
2003
2004
2005
2006
2007
2008
…allowing us to maintain an attractive dividend at a moderate payout ratio
13% CAGR
Note: Per share data based on total outstanding basic shares
Payout RatioDividends
35 35
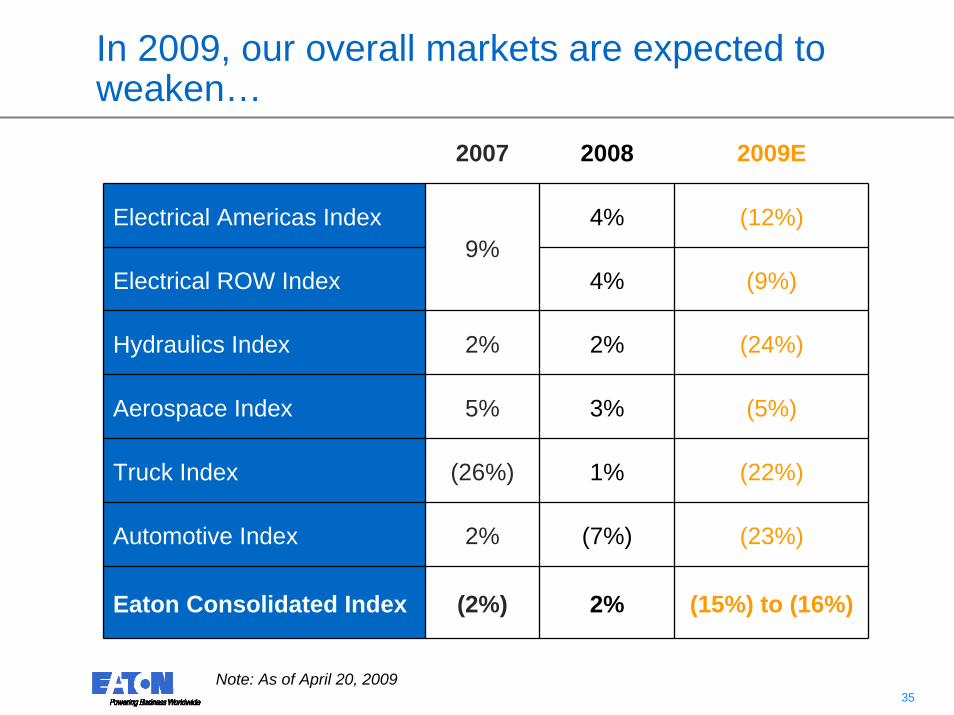
2007 2008 2009E
Electrical Americas Index 4% (12%)
Electrical ROW Index 4% (9%)
Hydraulics Index 2% 2% (24%)
Aerospace Index 5% 3% (5%)
Truck Index (26%) 1% (22%)
(7%)
9%
2%
Automotive Index 2% (23%)
Eaton Consolidated Index (2%) (15%) to (16%)
In 2009, our overall markets are expected to weaken…
Note: As of April 20, 2009
36 36
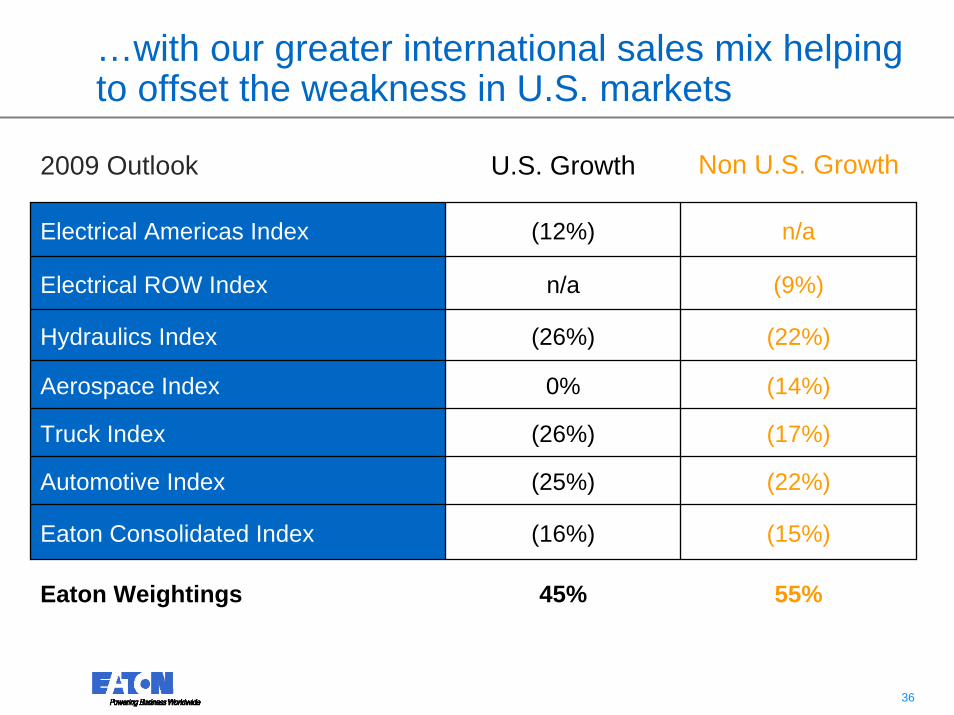
2009 Outlook U.S. Growth Non U.S. Growth
Electrical ROW Index n/a (9%)
Eaton Consolidated Index (16%) (15%)
Electrical Americas Index (12%) n/a
Hydraulics Index (26%) (22%)
Eaton Weightings 45% 55%
Aerospace Index 0% (14%)
Truck Index (26%) (17%)
Automotive Index (25%) (22%)
…with our greater international sales mix helping to offset the weakness in U.S. markets
37 37
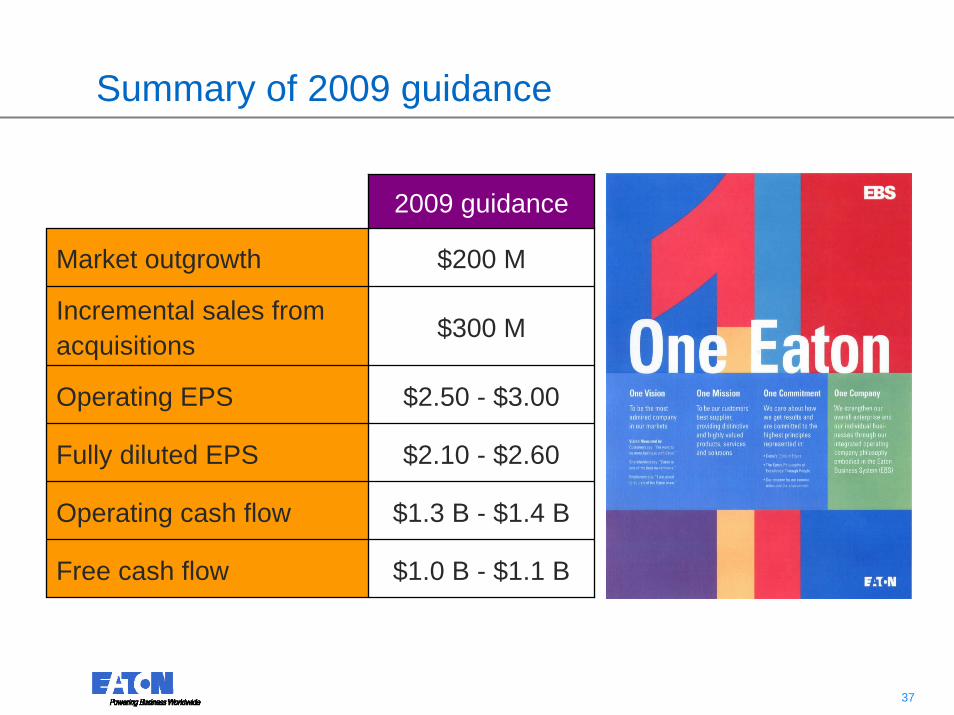
2009 guidance
Market outgrowth $200 M
Incremental sales from acquisitions $300 M
Fully diluted EPS $2.10 - $2.60
Operating EPS $2.50 - $3.00
Operating cash flow $1.3 B - $1.4 B
Free cash flow $1.0 B - $1.1 B
Summary of 2009 guidance
38 38