Embed Size (px)
Citation preview
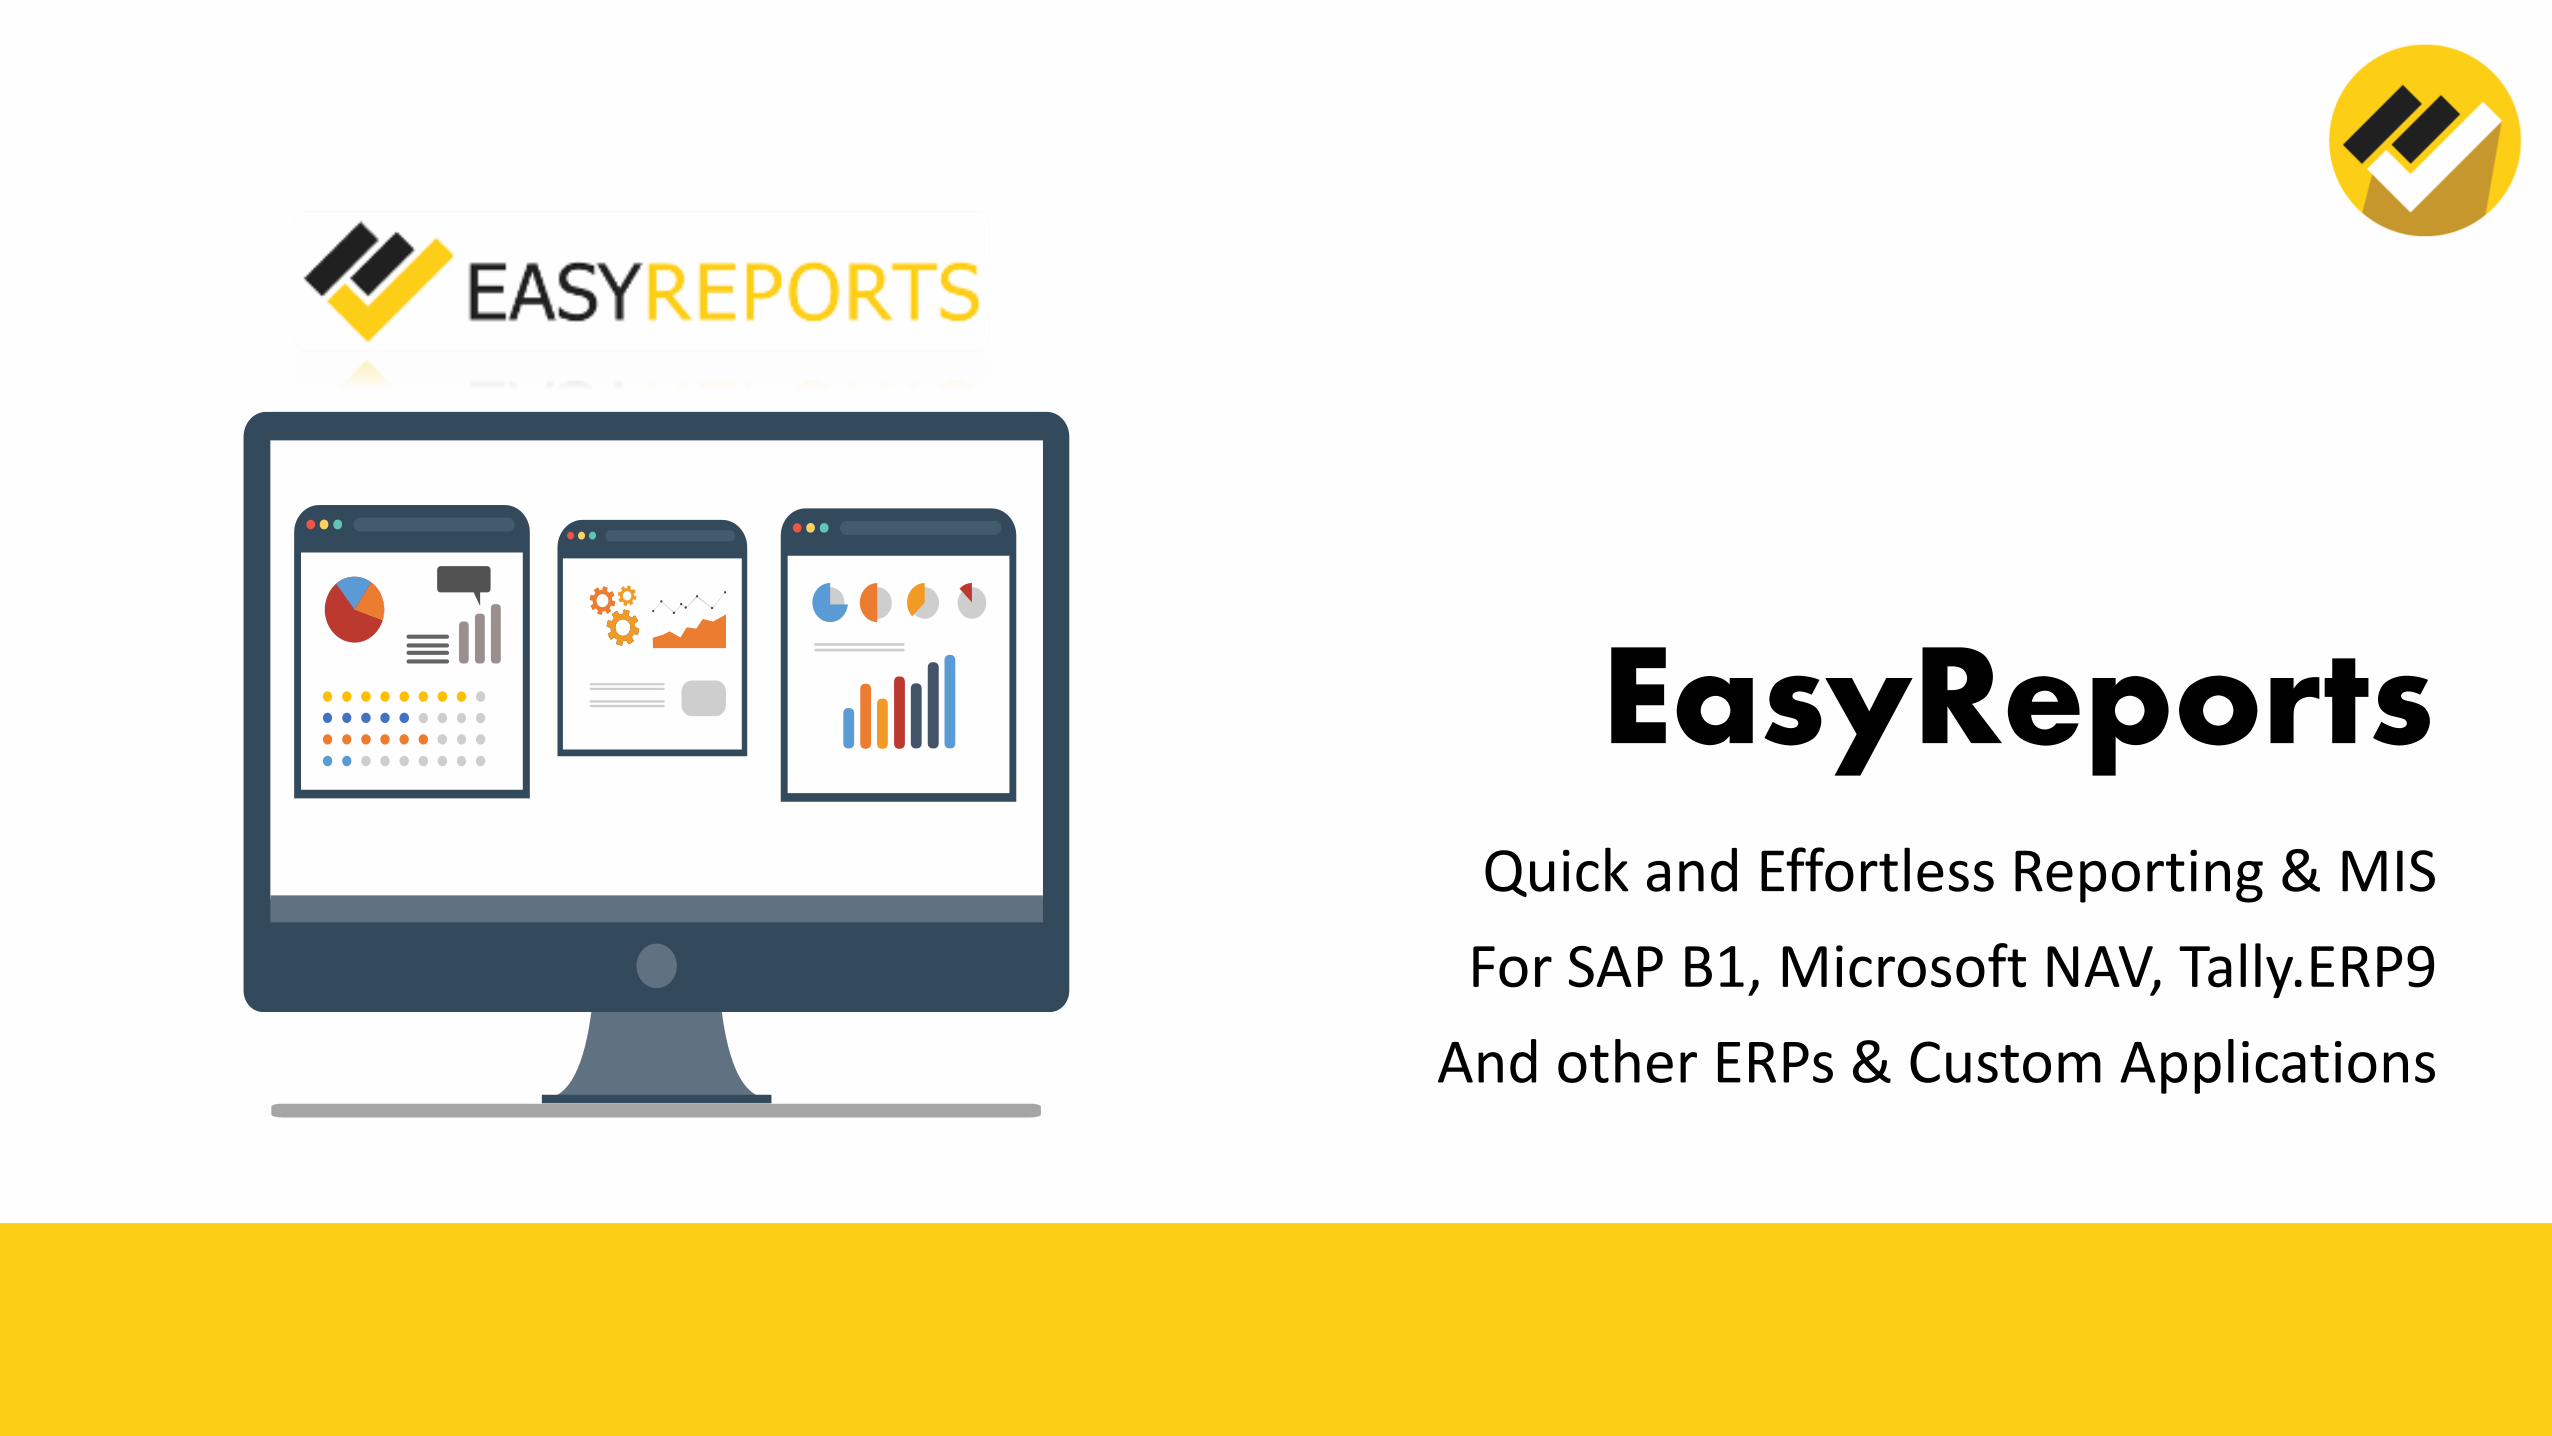
EasyReportsQuick and Effortless Reporting & MIS
For SAP B1, Microsoft NAV, Tally.ERP9
And other ERPs & Custom Applications

• Non-availability of information on time
• Delayed or improper decision making
• Competitive market
• Business performance needs to be analyzed and optimized to beat competition
• Dependence on clerical staff to compile and provide information
• Subject to human error
• Work priorities define the availability of reports
• Wastage of time in repetitive labour of generating reports
• Alternative large IT systems are complex and costly
• Budget issues
• Failed implementations
• Dependence on IT for new reports
• Every new report has a lead time
…it is not about the information
you don’t have;
It is about finding the right meaning
out of what is already there…
Business ProblemsProblems in Reporting & MIS
02
04
03
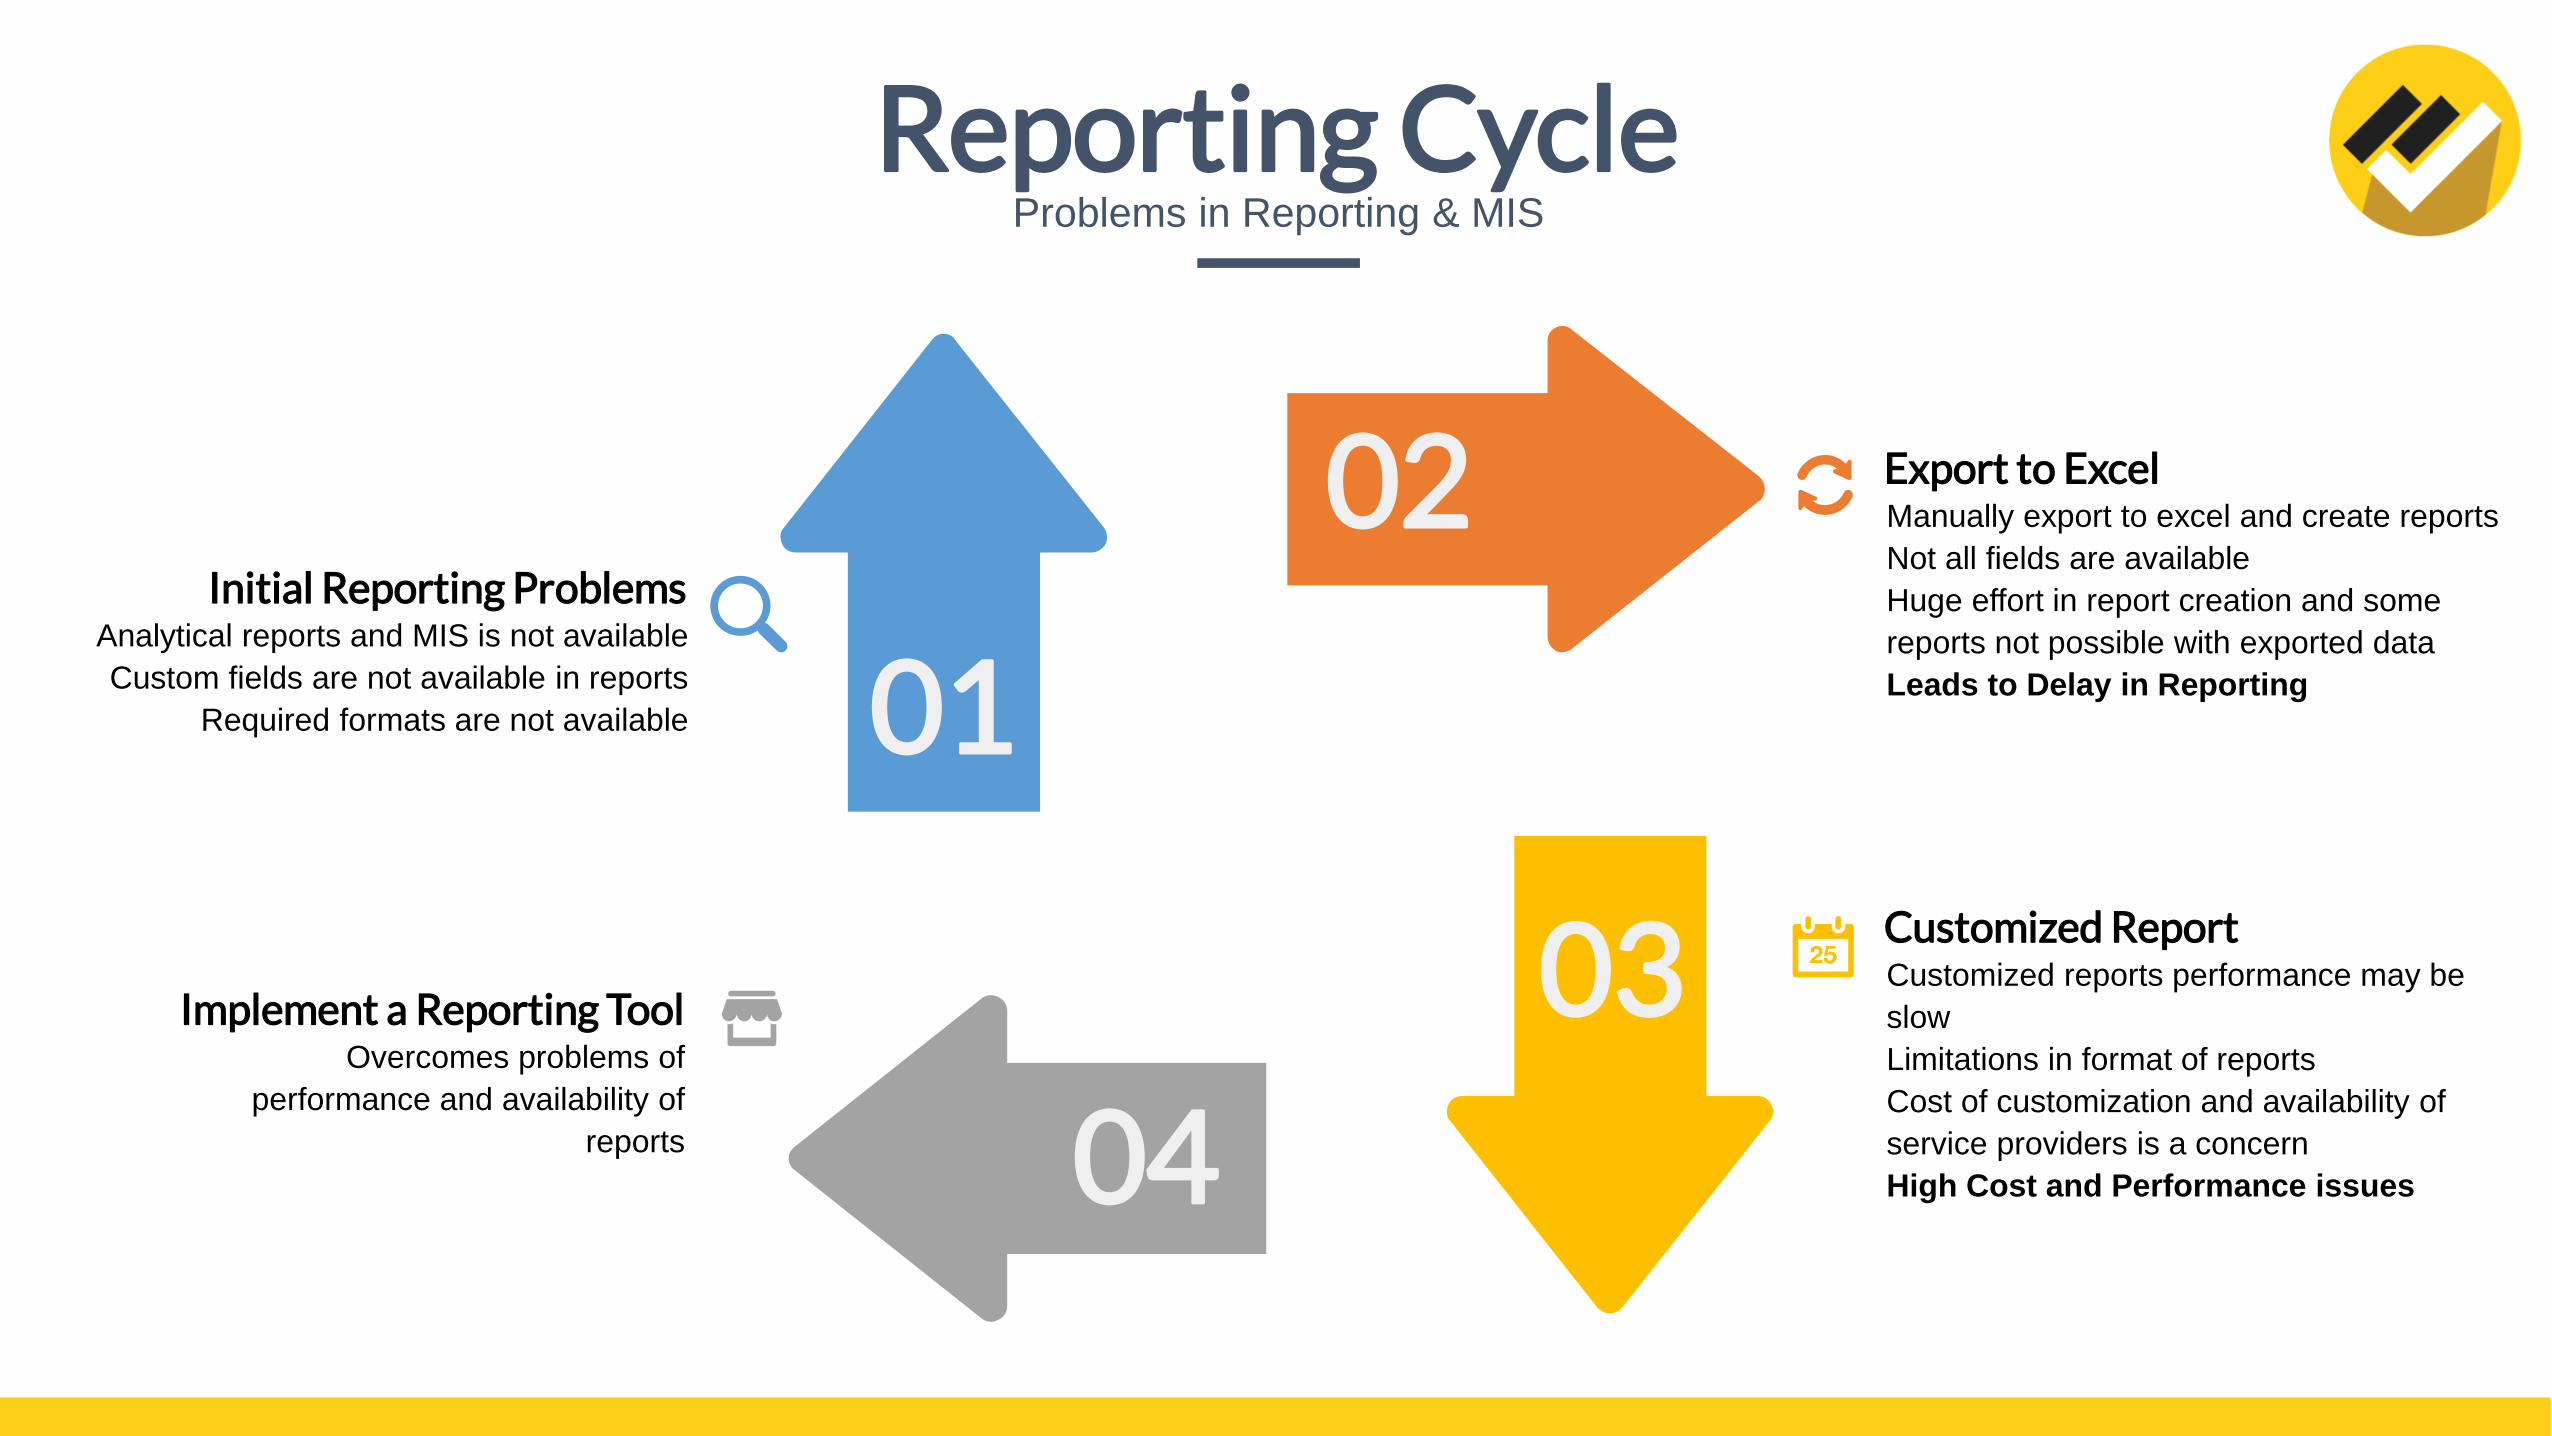
Analytical reports and MIS is not available
Custom fields are not available in reports
Required formats are not available
Initial Reporting Problems
Overcomes problems of
performance and availability of
reports
Implement a Reporting Tool
Manually export to excel and create reports
Not all fields are available
Huge effort in report creation and some
reports not possible with exported data
Leads to Delay in Reporting
Export to Excel
Customized reports performance may be
slow
Limitations in format of reports
Cost of customization and availability of
service providers is a concern
High Cost and Performance issues
Customized Report
01
Reporting CycleProblems in Reporting & MIS

Excel IntegrationBoth export and import of data
from excel customized as per
your needs. Tool for getting
tally data in excel directly
ERP IntegrationReady integration with ERPs
with support for customized
fields
Scheduler based imports
Aggregate & CompareConsolidation across
companies
Compare for MoM, YoY, etc.
Slice and diceTime analysis – weekly,
monthly, quarterly, etc.
Summarize, group, filter and
more…
AnalysisGrowth, contribution and
ranking, Top N, Bottom N, KPIs
and more…
User driven reportsDrag and drop functionality
End user layout saving
Custom and calculated fields
5 64
2 31
Key FeaturesFunctionalities to help businesses

Spend more time on analysisLess effort on manual processes
Effo
rt S
pe
nt
Present
Capture
Store
Discover
Access
Analyse
ERPEASY REPORTS
Activities of highest business value
Activities of highest business value
Capture
Store
Discover
Access
Analyse
Present

• Pre-defined analytical tools• Comparatives for user defined time periods
• Variation – Growth / degrowth for user defined time periods
• Contribution
• Top N / Bottom N
• Grouping
• Average, Min, Max, Count and others
• Custom fields and formulae
• Filters
• Many others
CapabilitiesPre-built one click functions

Sales ReportsSome example sales reporting ideas
Sales analysis by customer, product, timeline,
customer location and group, product group and
category
Salesperson wise reports with team hierarchy as
may be required
Additional dimension wise reports such as
channel, segment, area, region, etc.
Daily, monthly, annual sales with WTD, MTD,
YTD, etc.
Target vs Actual for products, customers and
salespersons
Active / Inactive Products based on user defined
logic. Products not sold for x no of days

Customer ReportsSome example customer reporting ideas
01
02
03
04
05
06
Ageing reports – FIFO with auto adjustment of
outstanding and on account credits with debits –
salesperson, manager, location, etc.
Customer Performance with sales, receipts, credit
notes, returns, orders – all in one screen
Additional dimension wise reports such as
channel, segment, area, region, etc.
Ratio analysis of customers such as Debtors
Turnover, DSO, Credit Limit utilization, etc.
Active / inactive customers by sales history,
receipts, order history – find out which customers
are not active and prevent loss of business
Customer wise product wise invoice wise sales
history with other dimensions as required

Financial ReportsSome example customer reporting ideas
Profitability analysis by branch, division, profit
centres and cost centres
Budget vs Actuals, Variance Analysis, Run Rate,
Budget Analysis, Monthly, Quarterly and Annual
Working Capital Analysis, Cash Flow and Fund
Flow Reports
Fund Position, Bank and Cash Position,
Receivables and Payables Projection
Extensive Cost Centre reports including trial,
monthly, quarterly, growth, contribution, matrix
report
Expense analysis by month, missing expenses or
provisions, expense summary by cost centre, etc.
$$

End user driven reportingDrag and drop for easy report creation
Pivot with your data
Drag and drop to create your own
report
Convert any report to monthly,
quarterly, annual columnar report
Export to excel and PDF formats
Integrated charting
Add custom fields and even
calculated fields

Some CapabilitiesPowerful reporting out of the box
Exception Report
Grid ReportChart
Integration

KPIsPowerful reporting out of the box

DashboardsOne screen view of your business
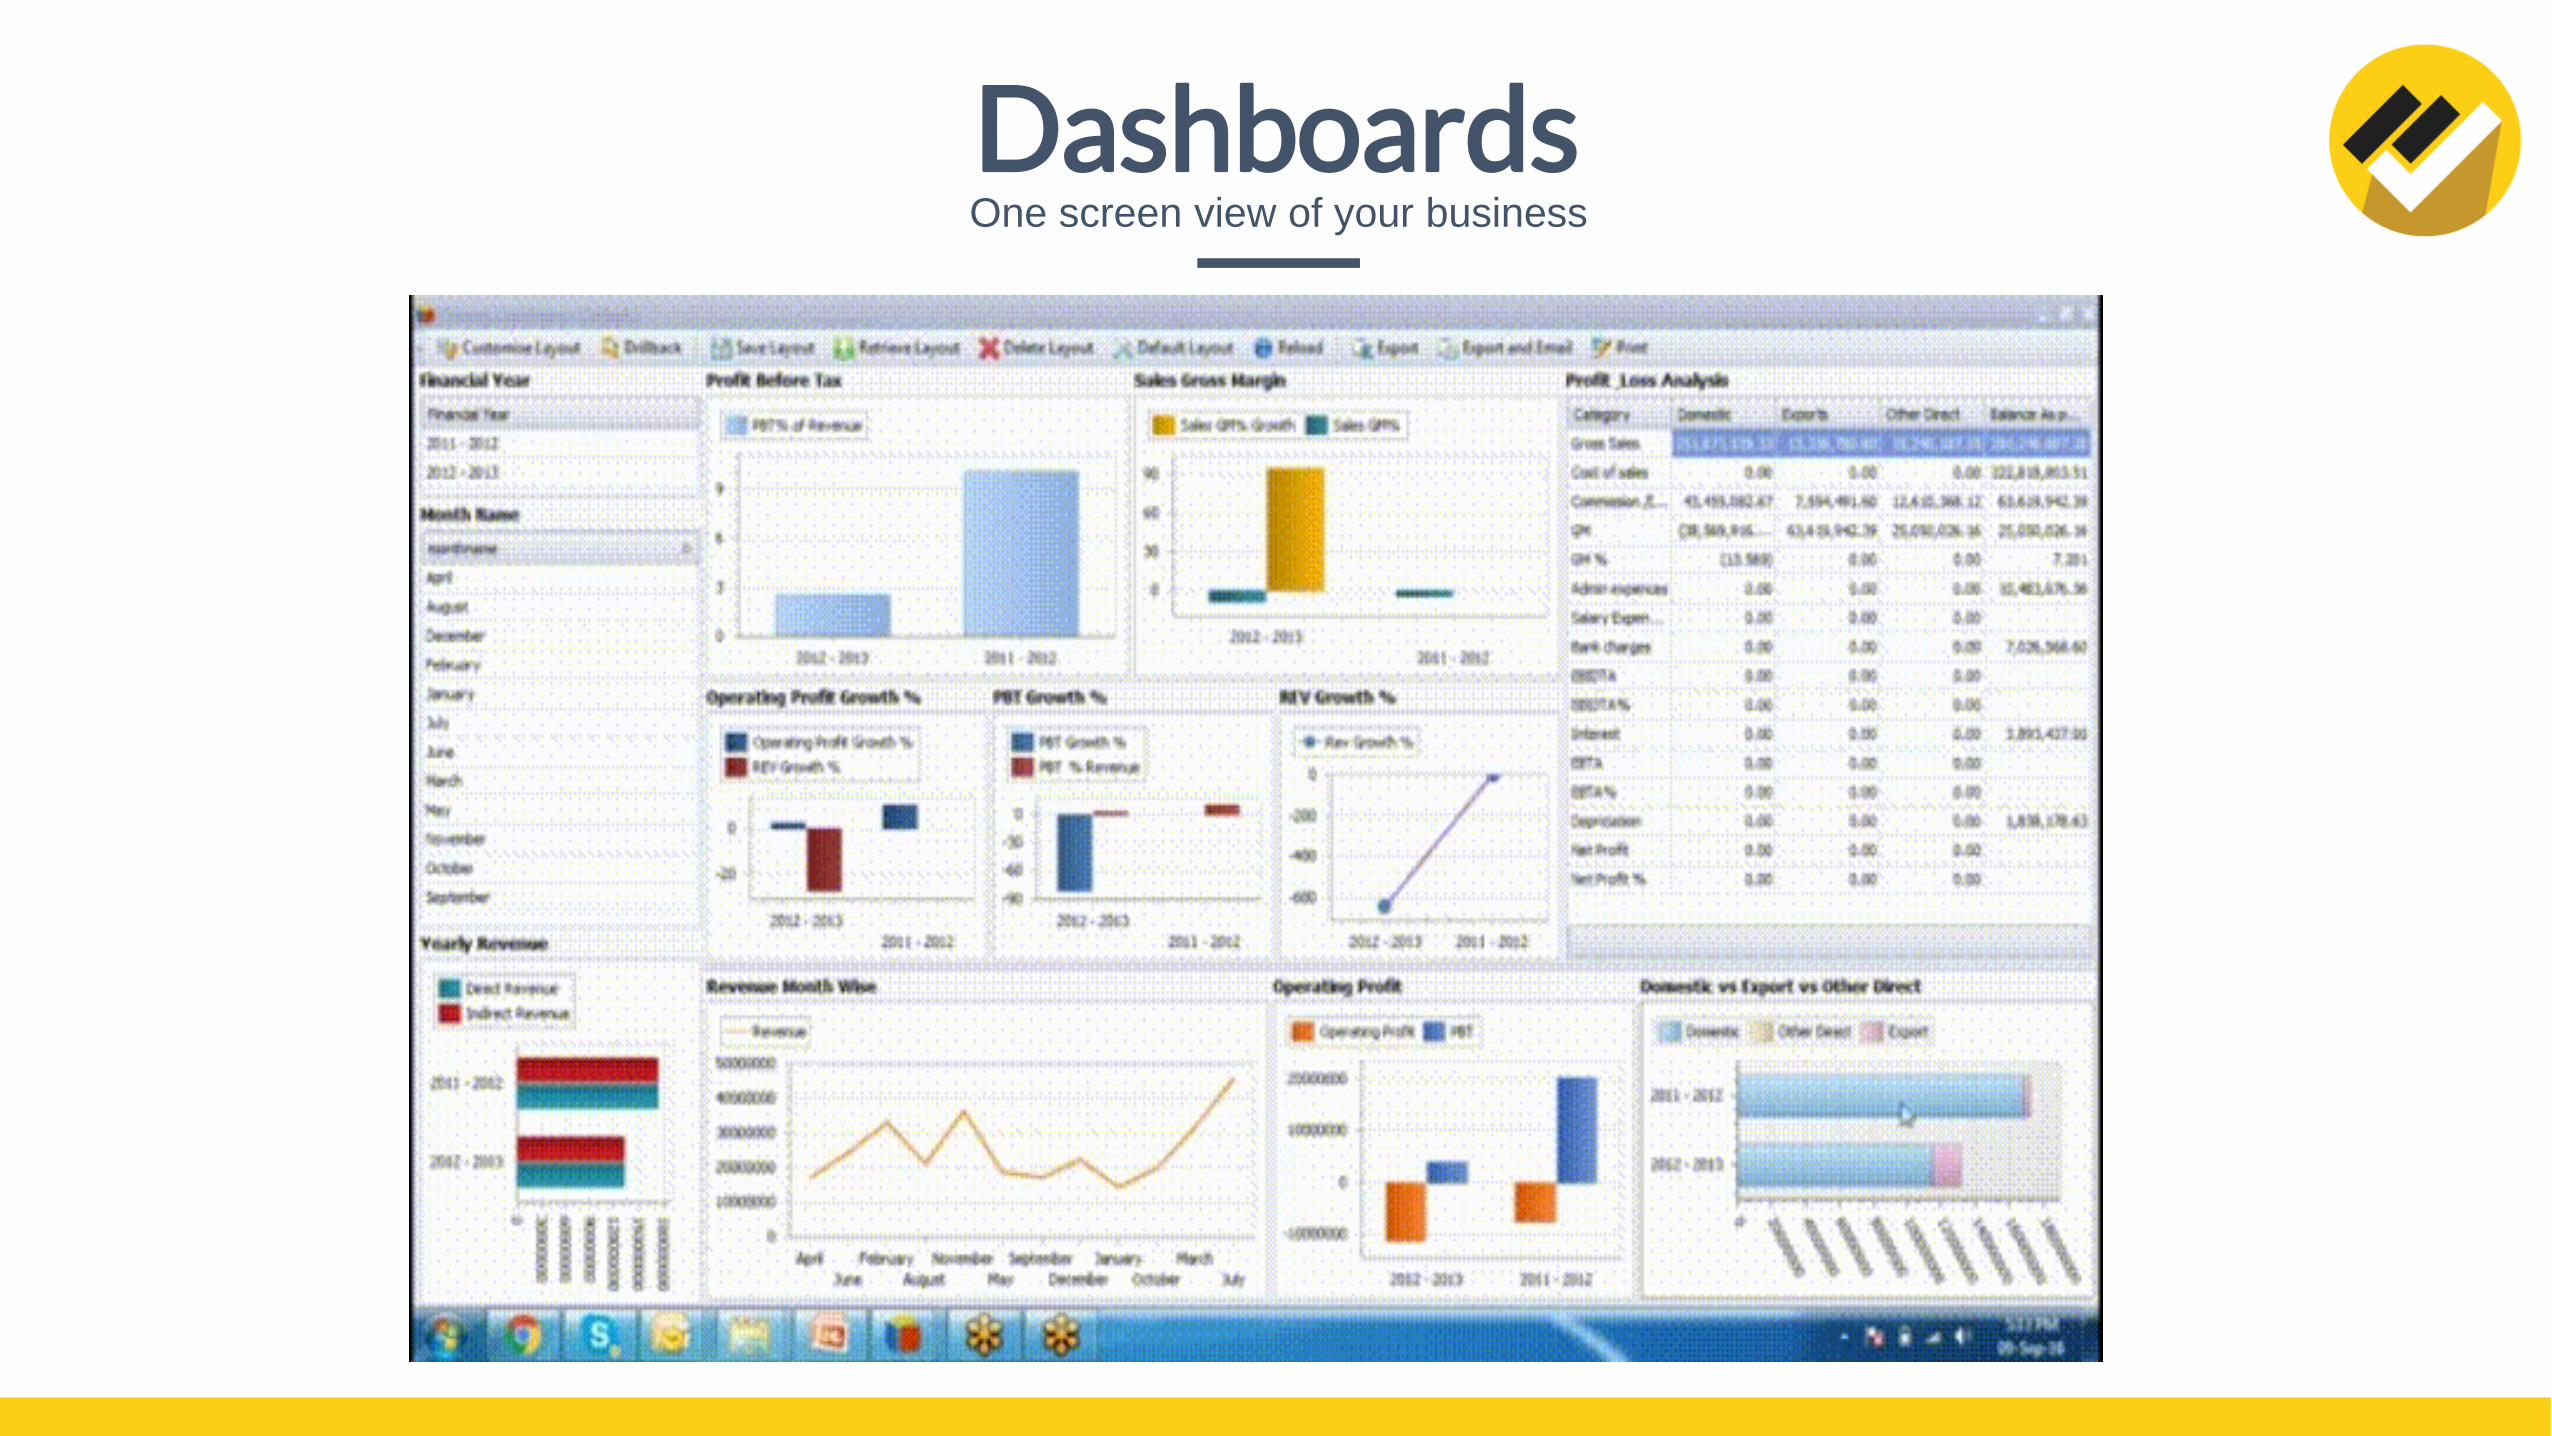
DashboardsOne screen view of your business

DashboardsOne screen view of your business
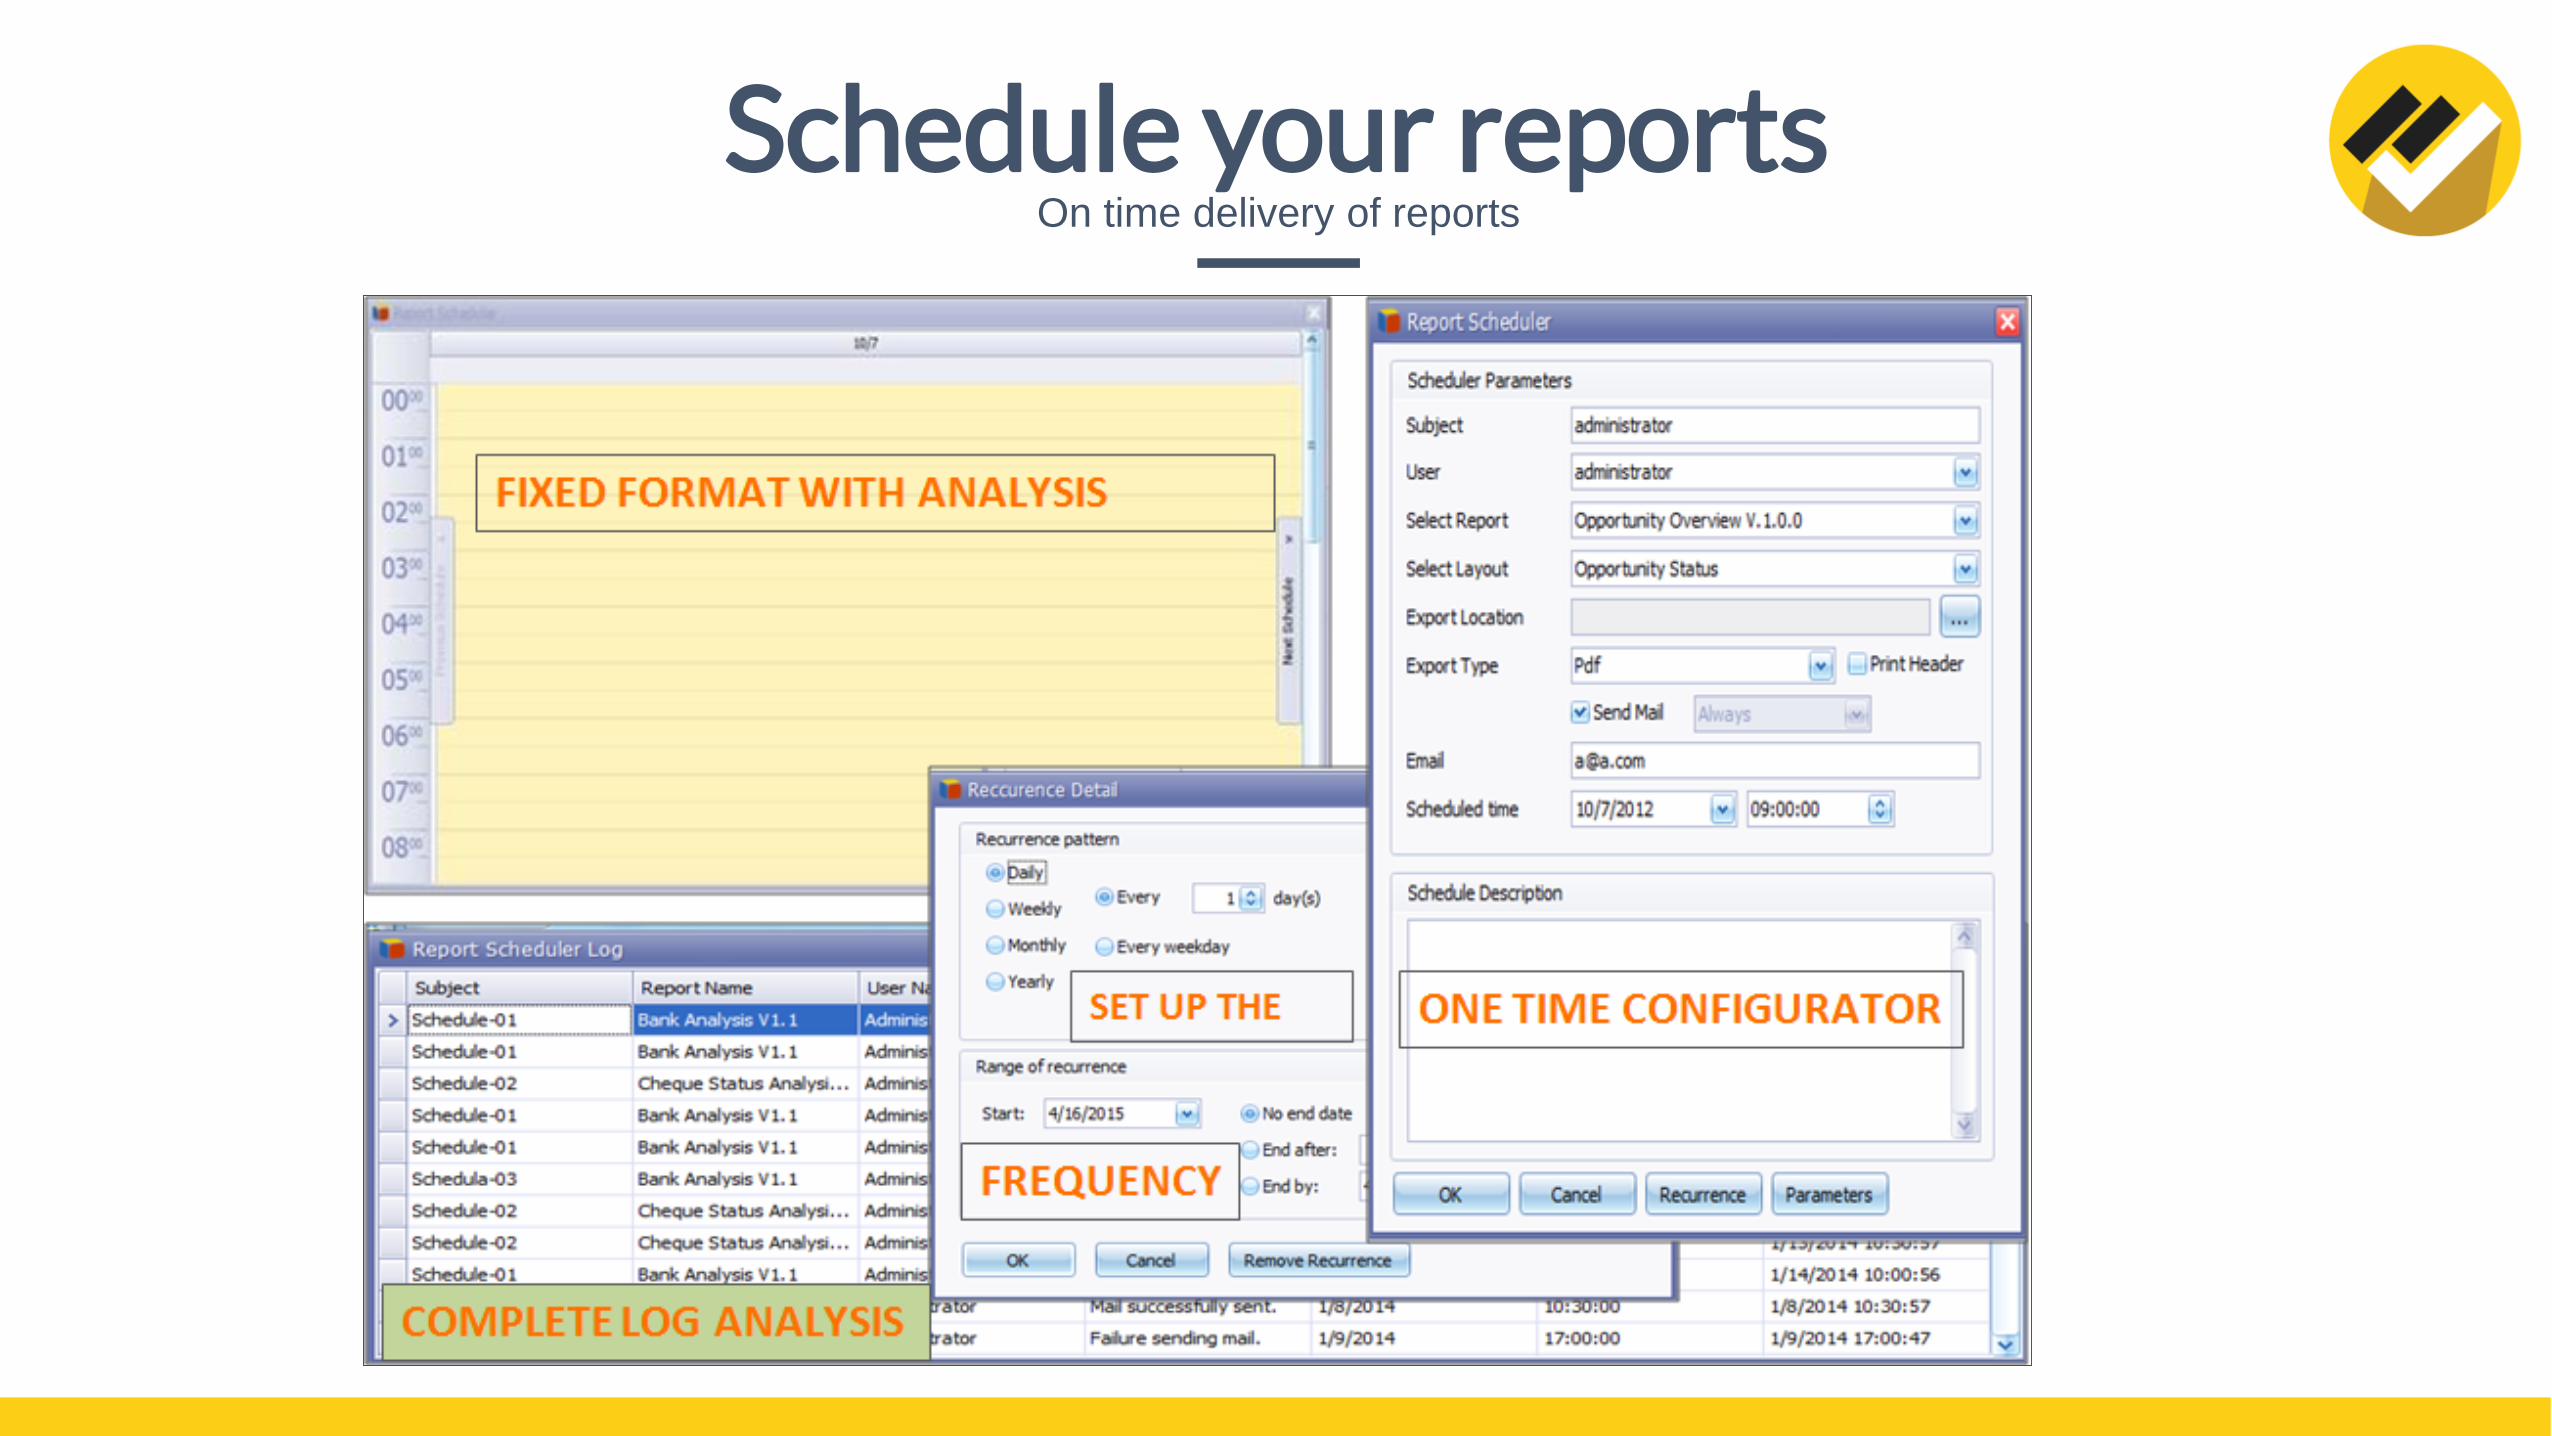
Schedule your reportsOn time delivery of reports

Watch a short video of our experience
Our Journey
2010Idea of Reporting Solution
2011Solution Launched
20141000+ reports deployed
20162000+ reports deployed
2009Tally.ERP9 Launched
https://goo.gl/UBEHfZ

Our earlier tally
customizations could not
support the reporting
requirements and data
volume. The
implementation of
automated reporting has
helped us to regain control
over our business and
reduce inefficiencies
‘‘
’’
“Earlier we used to
manually prepare reports
by downloading data from
Tally. It used to take a lot
of time to prepare reports.
Now we get automated
reports without having to
wait. EasyReports allows
us to save a lot of effort.
We get all required reports
on time!”
‘‘
’’
We thank you for your
support and quick action.
Earlier generation of
reports would slow down
our ERP. With the
reporting solution not only
our reports have been
automated but the problem
of slow running systems
has also been solved.
‘‘
’’
“What Our Clients Are Saying”“We get all required reports on time!”


![[spmsoalan]Soalan SPM 2014 BI.pdf](https://img.pdfslide.us/doc/110x75/55cf91c7550346f57b908fee/spmsoalansoalan-spm-2014-bipdf.jpg)