Embed Size (px)
Citation preview
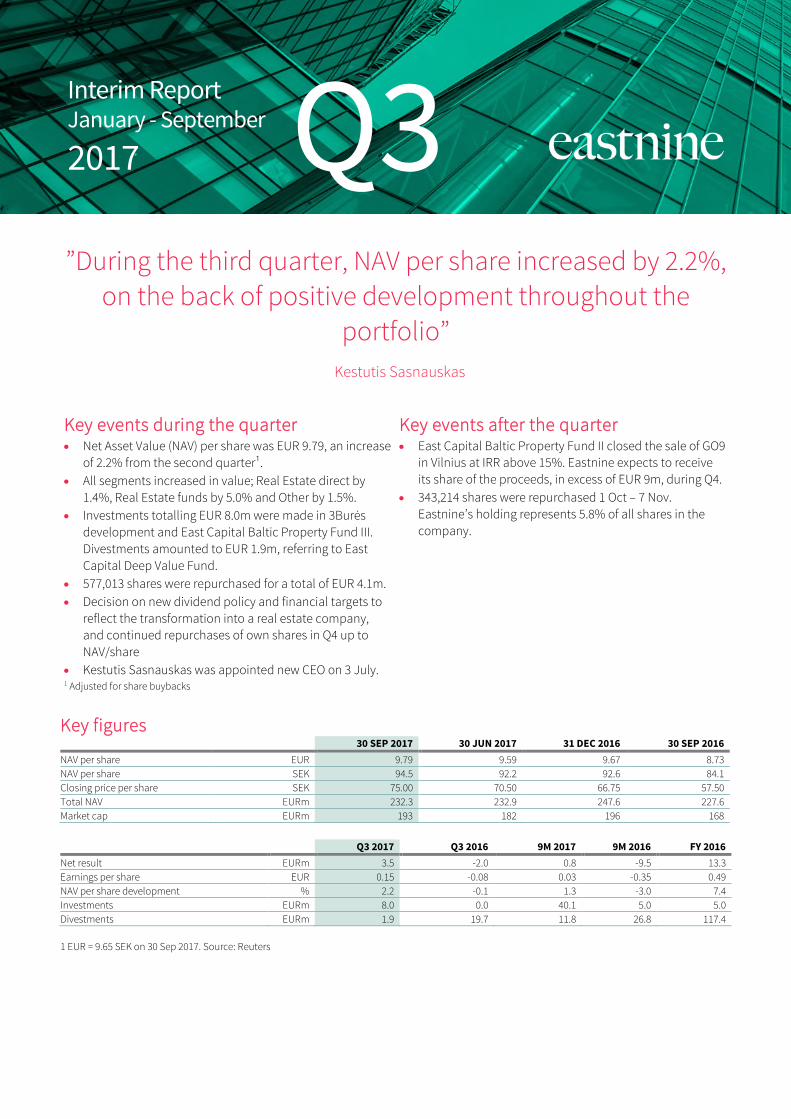
Interim ReportJanuary - September
2017
”During the third quarter, NAV per share increased by 2.2%,
on the back of positive development throughout the
portfolio”
Kestutis Sasnauskas
Key events during the quarter • Net Asset Value (NAV) per share was EUR 9.79, an increase
of 2.2% from the second quarter¹.
• All segments increased in value; Real Estate direct by
1.4%, Real Estate funds by 5.0% and Other by 1.5%.
• Investments totalling EUR 8.0m were made in 3Burės
development and East Capital Baltic Property Fund III.
Divestments amounted to EUR 1.9m, referring to East
Capital Deep Value Fund.
• 577,013 shares were repurchased for a total of EUR 4.1m.
• Decision on new dividend policy and financial targets to
reflect the transformation into a real estate company,
and continued repurchases of own shares in Q4 up to
NAV/share
• Kestutis Sasnauskas was appointed new CEO on 3 July. 1 Adjusted for share buybacks
Key events after the quarter • East Capital Baltic Property Fund II closed the sale of GO9
in Vilnius at IRR above 15%. Eastnine expects to receive
its share of the proceeds, in excess of EUR 9m, during Q4.
• 343,214 shares were repurchased 1 Oct – 7 Nov.
Eastnine’s holding represents 5.8% of all shares in the
company.
Key figures 30 SEP 2017 30 JUN 2017 31 DEC 2016 30 SEP 2016
NAV per share EUR 9.79 9.59 9.67 8.73
NAV per share SEK 94.5 92.2 92.6 84.1
Closing price per share SEK 75.00 70.50 66.75 57.50
Total NAV EURm 232.3 232.9 247.6 227.6
Market cap EURm 193 182 196 168
Q3 2017 Q3 2016 9M 2017 9M 2016 FY 2016
Net result EURm 3.5 -2.0 0.8 -9.5 13.3
Earnings per share EUR 0.15 -0.08 0.03 -0.35 0.49
NAV per share development % 2.2 -0.1 1.3 -3.0 7.4
Investments EURm 8.0 0.0 40.1 5.0 5.0
Divestments EURm 1.9 19.7 11.8 26.8 117.4
1 EUR = 9.65 SEK on 30 Sep 2017. Source: Reuters
EASTNINE AB 2 Interim Report JAN-SEP 2017
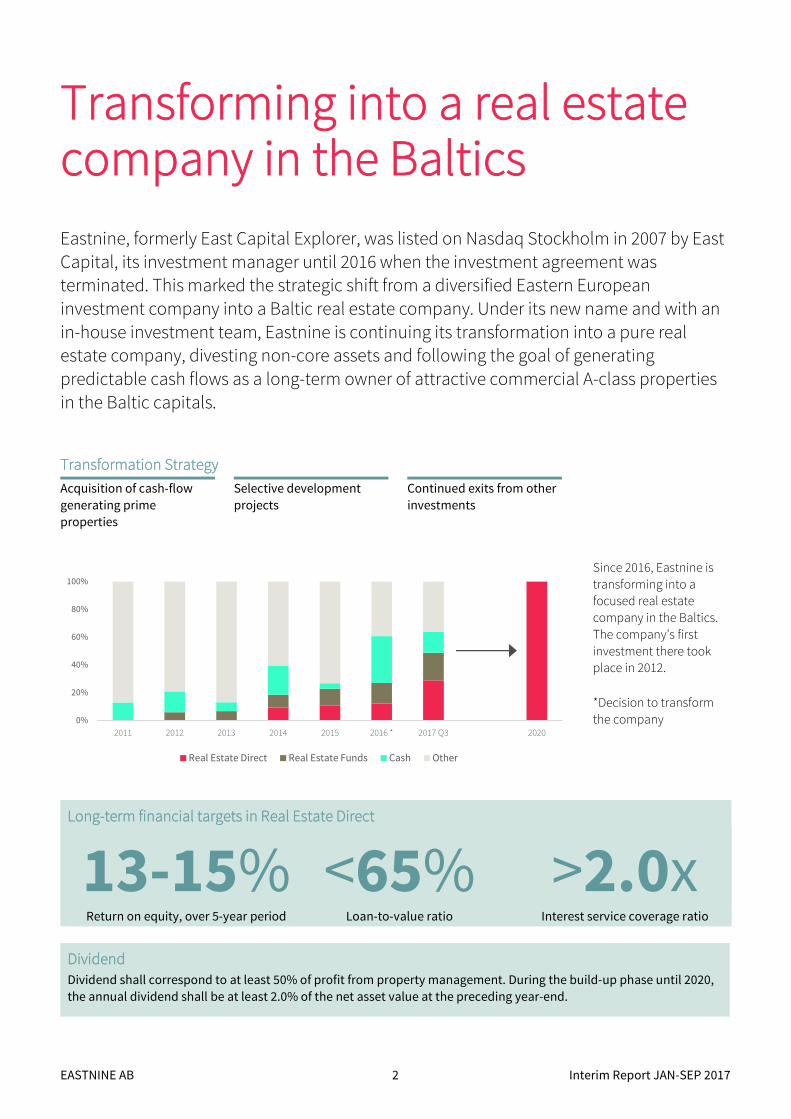
Transforming into a real estate company in the Baltics
Eastnine, formerly East Capital Explorer, was listed on Nasdaq Stockholm in 2007 by East
Capital, its investment manager until 2016 when the investment agreement was terminated. This marked the strategic shift from a diversified Eastern European
investment company into a Baltic real estate company. Under its new name and with an
in-house investment team, Eastnine is continuing its transformation into a pure real estate company, divesting non-core assets and following the goal of generating
predictable cash flows as a long-term owner of attractive commercial A-class properties
in the Baltic capitals.
Transformation Strategy
Acquisition of cash-flow
generating prime
properties
Selective development
projects
Continued exits from other
investments
Since 2016, Eastnine is
transforming into a
focused real estate
company in the Baltics.
The company’s first
investment there took
place in 2012.
*Decision to transform
the company
Long-term financial targets in Real Estate Direct
13-15% <65% >2.0xReturn on equity, over 5-year period Loan-to-value ratio Interest service coverage ratio
Dividend Dividend shall correspond to at least 50% of profit from property management. During the build-up phase until 2020,
the annual dividend shall be at least 2.0% of the net asset value at the preceding year-end.
0%
20%
40%
60%
80%
100%
2011 2012 2013 2014 2015 2016 * 2017 Q3 2020
Real Estate Direct Real Estate Funds Cash Other
EASTNINE AB 3 Interim Report JAN-SEP 2017
New strategy in place
“Once fully transformed to a real estate company, our
return on equity target is 13-15% and more than half of our profit from property management shall be
redistributed to shareholders.”
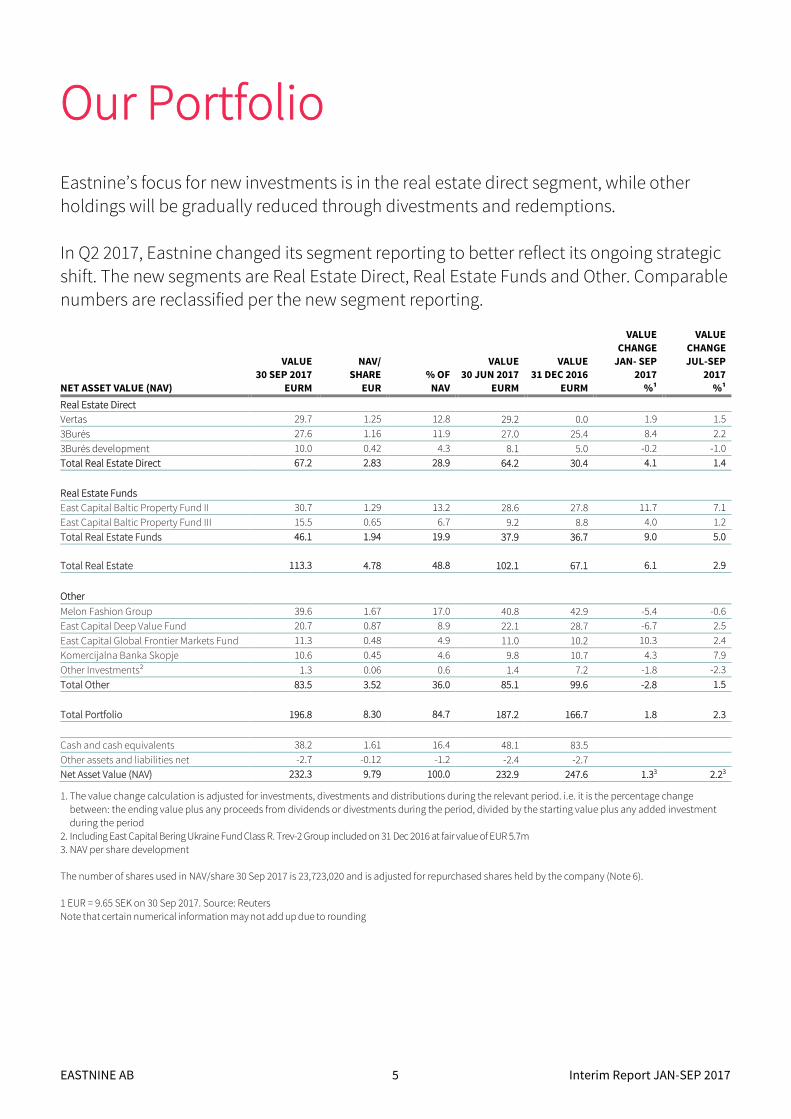
Change in NAV per share during the third quarter, EUR
NAV/share increased by 2.2% in
Q3 2017. Fair value gains in the
core real estate segments and
buybacks contributed EUR
0.19/share. Fair value changes in
the Other segment and dividends
received from Melon Fashion
group, contributed altogether
EUR 0.05/share.
9,790,04
0,09 0,06 0,04 0,04 0,01
9,59
The third quarter held few surprises, with a good
growth in NAV per share.
In September, we took another important step in the
transformation to a Baltic real estate company, by intro-
ducing new financial targets and a new dividend policy for
our strategy, as well as setting goals for the implement-
tation. At the latest by 2020, we shall have transformed our
portfolio to be concentrated on prime office properties in
Vilnius, Riga and Tallinn. For this strategy, our target return
on equity is 13-15% over a five-year period, with loan-to-
value below 65%. Depending on acquisition pace and
leverage, ROE may, however, be lower during the build-up
phase. In the long term, more than half of the profit from
property management shall be distributed to our
shareholders, providing shareholders with a good return,
and at the same time enabling us to grow both the portfolio
and the dividend. Until our profit from property
management is fully built-up, we will propose an annual
dividend of at least 2.0% of NAV. In addition, if our share
trades below its NAV, we will continue buying back our
own shares, but now without the previous NAV discount
limitation of 20%. Altogether, these guidelines represent the
company we envisage for the coming years. Until then, we
have a significant but rewarding task to, on the one hand,
identify and carry out the right real estate acquisitions in line
with our strategy – the pipeline is well-stocked – and on the
other hand, continue to divest the other holdings in the most
value creative way for each individual holding. Certain
holdings are more liquid, while other divestments will require
some time in order to be well executed.
NAV per share increased by 2.2% in the third quarter, with
a stable development throughout all segments. No revalua-
tions were made and the rouble, relevant for Melon Fashion
Group, was close to unchanged. The real estate segment
increased in value by 2.9% and Other by 1.5%. East Capital
Baltic Property Fund II’s sale of GO9 shopping centre
contributed positively, and will realize more than EUR 9m to
Eastnine in the fourth quarter. We are also happy to see MFG
performing well, with 14.3% sales growth and a gross margin
of 52.3% - up from 45.5% a year ago.
Kestutis Sasnauskas, CEO

EASTNINE AB 4 Interim Report JAN-SEP 2017
Performance
EASTNINE AB 5 Interim Report JAN-SEP 2017
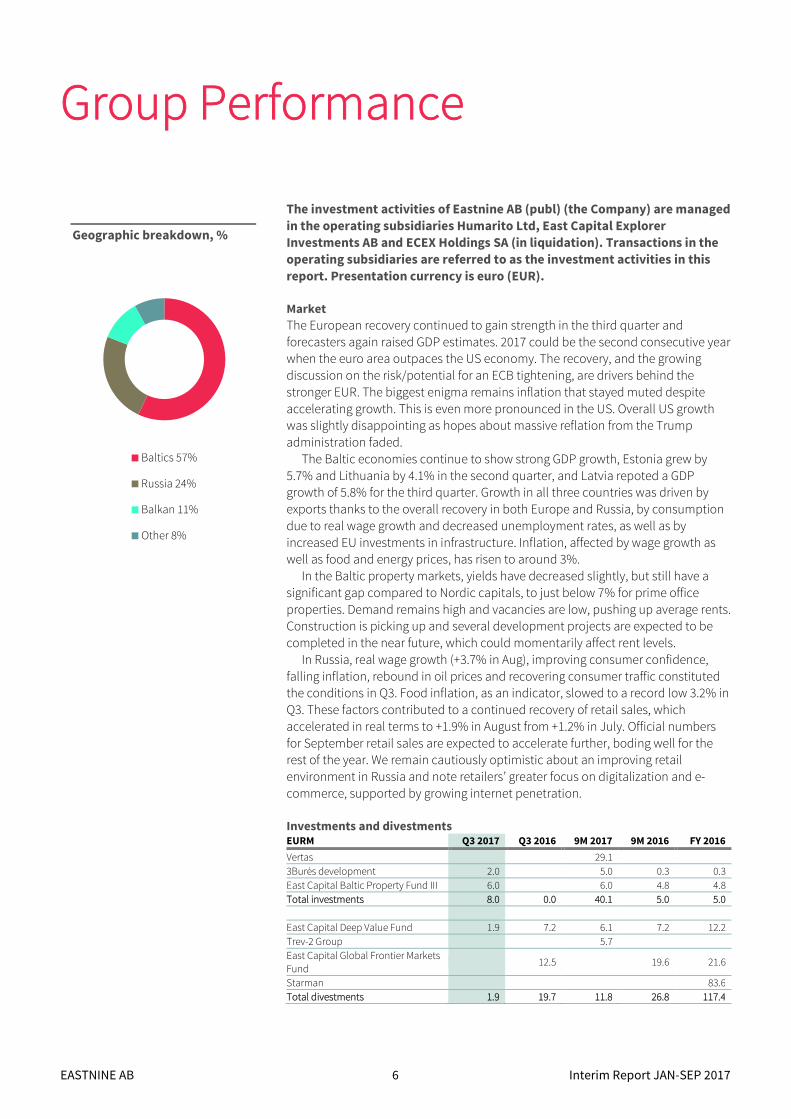
Our Portfolio
Eastnine’s focus for new investments is in the real estate direct segment, while other
holdings will be gradually reduced through divestments and redemptions.
In Q2 2017, Eastnine changed its segment reporting to better reflect its ongoing strategic
shift. The new segments are Real Estate Direct, Real Estate Funds and Other. Comparable numbers are reclassified per the new segment reporting.
NET ASSET VALUE (NAV)
VALUE30 SEP 2017
EURM
NAV/ SHARE
EUR
% OF
NAV
VALUE30 JUN 2017
EURM
VALUE31 DEC 2016
EURM
VALUE
CHANGE
JAN- SEP 2017
%¹
VALUE
CHANGE
JUL-SEP 2017
%¹
Real Estate Direct
Vertas 29.7 1.25 12.8 29.2 0.0 1.9 1.5
3Burės 27.6 1.16 11.9 27.0 25.4 8.4 2.2
3Burės development 10.0 0.42 4.3 8.1 5.0 -0.2 -1.0
Total Real Estate Direct 67.2 2.83 28.9 64.2 30.4 4.1 1.4
Real Estate Funds
East Capital Baltic Property Fund II 30.7 1.29 13.2 28.6 27.8 11.7 7.1
East Capital Baltic Property Fund III 15.5 0.65 6.7 9.2 8.8 4.0 1.2
Total Real Estate Funds 46.1 1.94 19.9 37.9 36.7 9.0 5.0
Total Real Estate 113.3 4.78 48.8 102.1 67.1 6.1 2.9
Other
Melon Fashion Group 39.6 1.67 17.0 40.8 42.9 -5.4 -0.6
East Capital Deep Value Fund 20.7 0.87 8.9 22.1 28.7 -6.7 2.5
East Capital Global Frontier Markets Fund 11.3 0.48 4.9 11.0 10.2 10.3 2.4
Komercijalna Banka Skopje 10.6 0.45 4.6 9.8 10.7 4.3 7.9
Other Investments² 1.3 0.06 0.6 1.4 7.2 -1.8 -2.3
Total Other 83.5 3.52 36.0 85.1 99.6 -2.8 1.5
Total Portfolio 196.8 8.30 84.7 187.2 166.7 1.8 2.3
Cash and cash equivalents 38.2 1.61 16.4 48.1 83.5
Other assets and liabilities net -2.7 -0.12 -1.2 -2.4 -2.7
Net Asset Value (NAV) 232.3 9.79 100.0 232.9 247.6 1.33 2.23
1. The value change calculation is adjusted for investments, divestments and distributions during the relevant period. i.e. it is the percentage change
between: the ending value plus any proceeds from dividends or divestments during the period, divided by the starting value plus any added investment
during the period
2. Including East Capital Bering Ukraine Fund Class R. Trev-2 Group included on 31 Dec 2016 at fair value of EUR 5.7m
3. NAV per share development
The number of shares used in NAV/share 30 Sep 2017 is 23,723,020 and is adjusted for repurchased shares held by the company (Note 6).
1 EUR = 9.65 SEK on 30 Sep 2017. Source: Reuters
Note that certain numerical information may not add up due to rounding
EASTNINE AB 6 Interim Report JAN-SEP 2017
Group Performance
The investment activities of Eastnine AB (publ) (the Company) are managed
in the operating subsidiaries Humarito Ltd, East Capital Explorer
Investments AB and ECEX Holdings SA (in liquidation). Transactions in the
operating subsidiaries are referred to as the investment activities in this
report. Presentation currency is euro (EUR).
Market
The European recovery continued to gain strength in the third quarter and
forecasters again raised GDP estimates. 2017 could be the second consecutive year
when the euro area outpaces the US economy. The recovery, and the growing
discussion on the risk/potential for an ECB tightening, are drivers behind the
stronger EUR. The biggest enigma remains inflation that stayed muted despite
accelerating growth. This is even more pronounced in the US. Overall US growth
was slightly disappointing as hopes about massive reflation from the Trump
administration faded.
The Baltic economies continue to show strong GDP growth, Estonia grew by
5.7% and Lithuania by 4.1% in the second quarter, and Latvia repoted a GDP
growth of 5.8% for the third quarter. Growth in all three countries was driven by
exports thanks to the overall recovery in both Europe and Russia, by consumption
due to real wage growth and decreased unemployment rates, as well as by
increased EU investments in infrastructure. Inflation, affected by wage growth as
well as food and energy prices, has risen to around 3%.
In the Baltic property markets, yields have decreased slightly, but still have a
significant gap compared to Nordic capitals, to just below 7% for prime office
properties. Demand remains high and vacancies are low, pushing up average rents.
Construction is picking up and several development projects are expected to be
completed in the near future, which could momentarily affect rent levels.
In Russia, real wage growth (+3.7% in Aug), improving consumer confidence,
falling inflation, rebound in oil prices and recovering consumer traffic constituted
the conditions in Q3. Food inflation, as an indicator, slowed to a record low 3.2% in
Q3. These factors contributed to a continued recovery of retail sales, which
accelerated in real terms to +1.9% in August from +1.2% in July. Official numbers
for September retail sales are expected to accelerate further, boding well for the
rest of the year. We remain cautiously optimistic about an improving retail
environment in Russia and note retailers’ greater focus on digitalization and e-
commerce, supported by growing internet penetration.
Investments and divestments EURM Q3 2017 Q3 2016 9M 2017 9M 2016 FY 2016
Vertas 29.1
3Burės development 2.0 5.0 0.3 0.3
East Capital Baltic Property Fund III 6.0 6.0 4.8 4.8
Total investments 8.0 0.0 40.1 5.0 5.0
East Capital Deep Value Fund 1.9 7.2 6.1 7.2 12.2
Trev-2 Group 5.7
East Capital Global Frontier Markets Fund
12.5 19.6 21.6
Starman 83.6
Total divestments 1.9 19.7 11.8 26.8 117.4
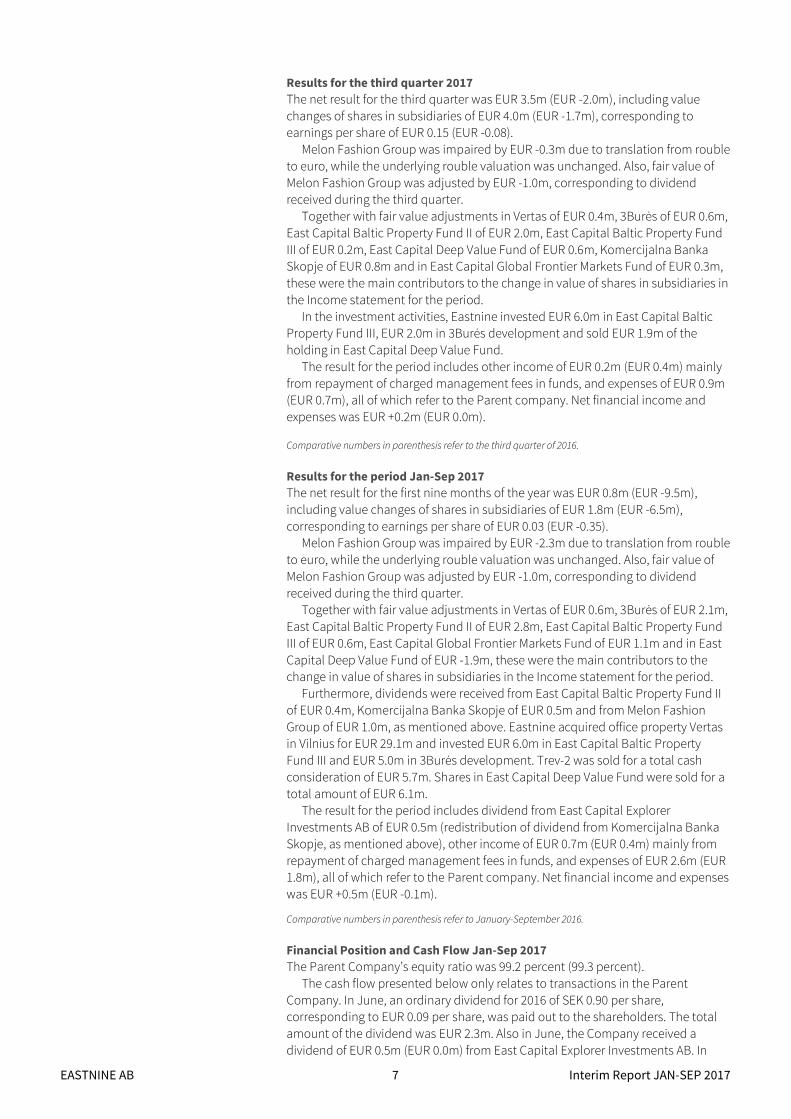
Geographic breakdown, %
Baltics 57%
Russia 24%
Balkan 11%
Other 8%
EASTNINE AB 7 Interim Report JAN-SEP 2017
Results for the third quarter 2017
The net result for the third quarter was EUR 3.5m (EUR -2.0m), including value
changes of shares in subsidiaries of EUR 4.0m (EUR -1.7m), corresponding to
earnings per share of EUR 0.15 (EUR -0.08).
Melon Fashion Group was impaired by EUR -0.3m due to translation from rouble
to euro, while the underlying rouble valuation was unchanged. Also, fair value of
Melon Fashion Group was adjusted by EUR -1.0m, corresponding to dividend
received during the third quarter.
Together with fair value adjustments in Vertas of EUR 0.4m, 3Burės of EUR 0.6m,
East Capital Baltic Property Fund II of EUR 2.0m, East Capital Baltic Property Fund
III of EUR 0.2m, East Capital Deep Value Fund of EUR 0.6m, Komercijalna Banka
Skopje of EUR 0.8m and in East Capital Global Frontier Markets Fund of EUR 0.3m,
these were the main contributors to the change in value of shares in subsidiaries in
the Income statement for the period.
In the investment activities, Eastnine invested EUR 6.0m in East Capital Baltic
Property Fund III, EUR 2.0m in 3Burės development and sold EUR 1.9m of the
holding in East Capital Deep Value Fund.
The result for the period includes other income of EUR 0.2m (EUR 0.4m) mainly
from repayment of charged management fees in funds, and expenses of EUR 0.9m
(EUR 0.7m), all of which refer to the Parent company. Net financial income and
expenses was EUR +0.2m (EUR 0.0m).
Comparative numbers in parenthesis refer to the third quarter of 2016.
Results for the period Jan-Sep 2017
The net result for the first nine months of the year was EUR 0.8m (EUR -9.5m),
including value changes of shares in subsidiaries of EUR 1.8m (EUR -6.5m),
corresponding to earnings per share of EUR 0.03 (EUR -0.35).
Melon Fashion Group was impaired by EUR -2.3m due to translation from rouble
to euro, while the underlying rouble valuation was unchanged. Also, fair value of
Melon Fashion Group was adjusted by EUR -1.0m, corresponding to dividend
received during the third quarter.
Together with fair value adjustments in Vertas of EUR 0.6m, 3Burės of EUR 2.1m,
East Capital Baltic Property Fund II of EUR 2.8m, East Capital Baltic Property Fund
III of EUR 0.6m, East Capital Global Frontier Markets Fund of EUR 1.1m and in East
Capital Deep Value Fund of EUR -1.9m, these were the main contributors to the
change in value of shares in subsidiaries in the Income statement for the period.
Furthermore, dividends were received from East Capital Baltic Property Fund II
of EUR 0.4m, Komercijalna Banka Skopje of EUR 0.5m and from Melon Fashion
Group of EUR 1.0m, as mentioned above. Eastnine acquired office property Vertas
in Vilnius for EUR 29.1m and invested EUR 6.0m in East Capital Baltic Property
Fund III and EUR 5.0m in 3Burės development. Trev-2 was sold for a total cash
consideration of EUR 5.7m. Shares in East Capital Deep Value Fund were sold for a
total amount of EUR 6.1m.
The result for the period includes dividend from East Capital Explorer
Investments AB of EUR 0.5m (redistribution of dividend from Komercijalna Banka
Skopje, as mentioned above), other income of EUR 0.7m (EUR 0.4m) mainly from
repayment of charged management fees in funds, and expenses of EUR 2.6m (EUR
1.8m), all of which refer to the Parent company. Net financial income and expenses
was EUR +0.5m (EUR -0.1m).
Comparative numbers in parenthesis refer to January-September 2016.
Financial Position and Cash Flow Jan-Sep 2017
The Parent Company’s equity ratio was 99.2 percent (99.3 percent).
The cash flow presented below only relates to transactions in the Parent
Company. In June, an ordinary dividend for 2016 of SEK 0.90 per share,
corresponding to EUR 0.09 per share, was paid out to the shareholders. The total
amount of the dividend was EUR 2.3m. Also in June, the Company received a
dividend of EUR 0.5m (EUR 0.0m) from East Capital Explorer Investments AB. In
EASTNINE AB 8 Interim Report JAN-SEP 2017
September, an add-on investment of EUR 2.0m was made in 3Burės development.
During the period, Jan–Sep 2017, Eastnine repurchased a total of 1,881,443 shares
for an amount equivalent to EUR 13.8m.
Cash and cash equivalent at the end of the period amounted to EUR 10.7m (EUR
30.3m), all of which refer to the Parent Company.
At the end of the period, cash and cash equivalents in the investment activities
amounted to EUR 38.2m (EUR 83.5m). Please refer to the breakdown of values in
subsidiaries on pages 19-21 for more details regarding the investment activities.
Comparative numbers in parenthesis refer to 31 December 2016.
Commitments
On 10 July 2015, the Company announced a commitment to invest EUR 20m in
total in East Capital Baltic Property Fund III. Of this, EUR 14.1m has been drawn
down by the fund and the outstanding commitment on 30 September 2017
amounted to EUR 5.9m.
EASTNINE AB 9 Interim Report JAN-SEP 2017
Real Estate Direct
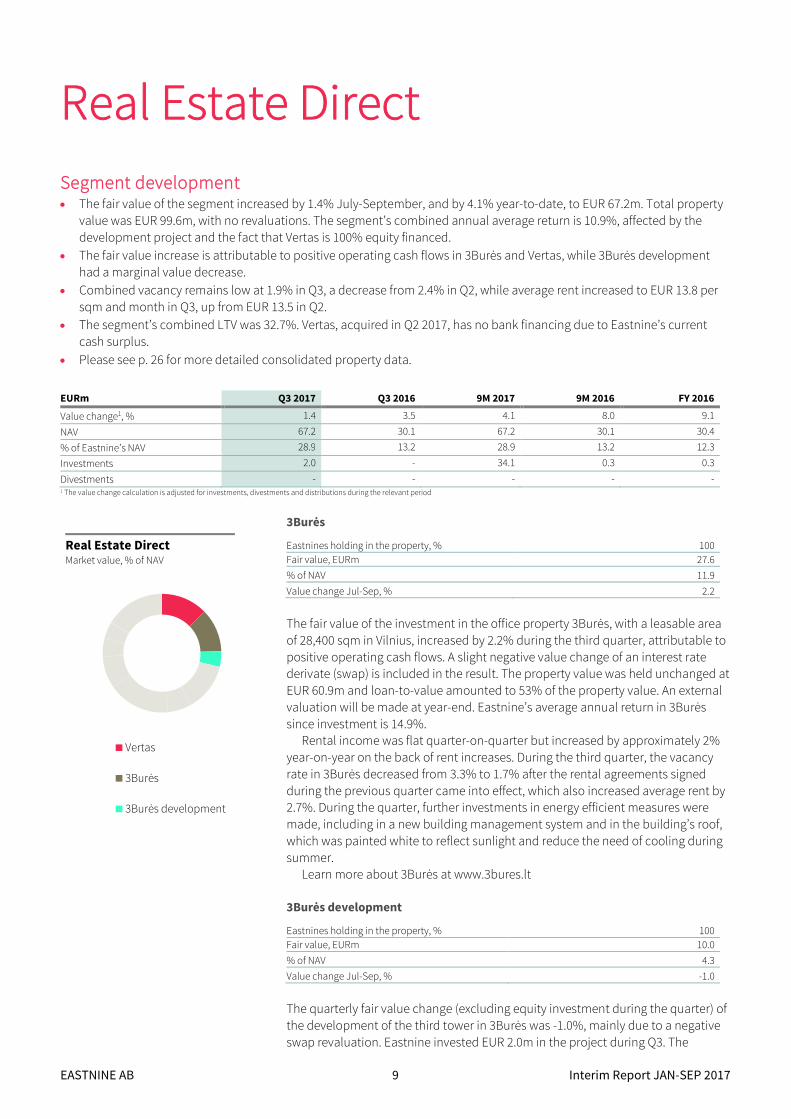
Segment development • The fair value of the segment increased by 1.4% July-September, and by 4.1% year-to-date, to EUR 67.2m. Total property
value was EUR 99.6m, with no revaluations. The segment’s combined annual average return is 10.9%, affected by the
development project and the fact that Vertas is 100% equity financed.
• The fair value increase is attributable to positive operating cash flows in 3Burės and Vertas, while 3Burės development
had a marginal value decrease.
• Combined vacancy remains low at 1.9% in Q3, a decrease from 2.4% in Q2, while average rent increased to EUR 13.8 per
sqm and month in Q3, up from EUR 13.5 in Q2.
• The segment’s combined LTV was 32.7%. Vertas, acquired in Q2 2017, has no bank financing due to Eastnine’s current
cash surplus.
• Please see p. 26 for more detailed consolidated property data.
EURm Q3 2017 Q3 2016 9M 2017 9M 2016 FY 2016
Value change1, % 1.4 3.5 4.1 8.0 9.1
NAV 67.2 30.1 67.2 30.1 30.4
% of Eastnine’s NAV 28.9 13.2 28.9 13.2 12.3
Investments 2.0 - 34.1 0.3 0.3
Divestments - - - - - 1 The value change calculation is adjusted for investments, divestments and distributions during the relevant period
3Burės
Eastnines holding in the property, % 100
Fair value, EURm 27.6
% of NAV 11.9
Value change Jul-Sep, % 2.2
The fair value of the investment in the office property 3Burės, with a leasable area
of 28,400 sqm in Vilnius, increased by 2.2% during the third quarter, attributable to
positive operating cash flows. A slight negative value change of an interest rate
derivate (swap) is included in the result. The property value was held unchanged at
EUR 60.9m and loan-to-value amounted to 53% of the property value. An external
valuation will be made at year-end. Eastnine’s average annual return in 3Burės
since investment is 14.9%.
Rental income was flat quarter-on-quarter but increased by approximately 2%
year-on-year on the back of rent increases. During the third quarter, the vacancy
rate in 3Burės decreased from 3.3% to 1.7% after the rental agreements signed
during the previous quarter came into effect, which also increased average rent by
2.7%. During the quarter, further investments in energy efficient measures were
made, including in a new building management system and in the building’s roof,
which was painted white to reflect sunlight and reduce the need of cooling during
summer.
Learn more about 3Burės at www.3bures.lt
3Burės development
Eastnines holding in the property, % 100
Fair value, EURm 10.0
% of NAV 4.3
Value change Jul-Sep, % -1.0
The quarterly fair value change (excluding equity investment during the quarter) of
the development of the third tower in 3Burės was -1.0%, mainly due to a negative
swap revaluation. Eastnine invested EUR 2.0m in the project during Q3. The
Real Estate Direct Market value, % of NAV
Vertas
3Burės
3Burės development
EASTNINE AB 10 Interim Report JAN-SEP 2017
property value increased to EUR 10.2m because of investments, with no change in
the underlying valuation. An external valuation of the development project will be
made at year-end. The development, which thus far is equity financed, will as of
2018 use bank financing.
The construction continued according to schedule and by the quarter-end,
eleven of twenty-three floors had been risen. The property, which is expected to be
completed by the end of 2018 with a leasable area of 12,800 sqm, is 98% pre-let to
Swedbank and Visma.
Vertas
Eastnines holding in the property, % 100
Fair value, EURm 29.7
% of NAV 12.8
Value change Jul-Sep, % 1.5
The fair value of the investment in Vertas, the office property in central Vilnius
acquired in June 2017, increased by 1.5% during the third quarter due to positive
operating cash flows. The property value is unchanged since acquisition. Vertas
will be valued by an external appraiser when it has been owned 12 months.
The property, with a leasable area of 9,400 sqm, reported a vacancy of 2.7% for
the end of September. Vertas is short-term financed without bank loans due to
Eastnine’s strong cash position.
Learn more about Vertas at www.vertas.lt
EASTNINE AB 11 Interim Report JAN-SEP 2017
Real Estate Funds
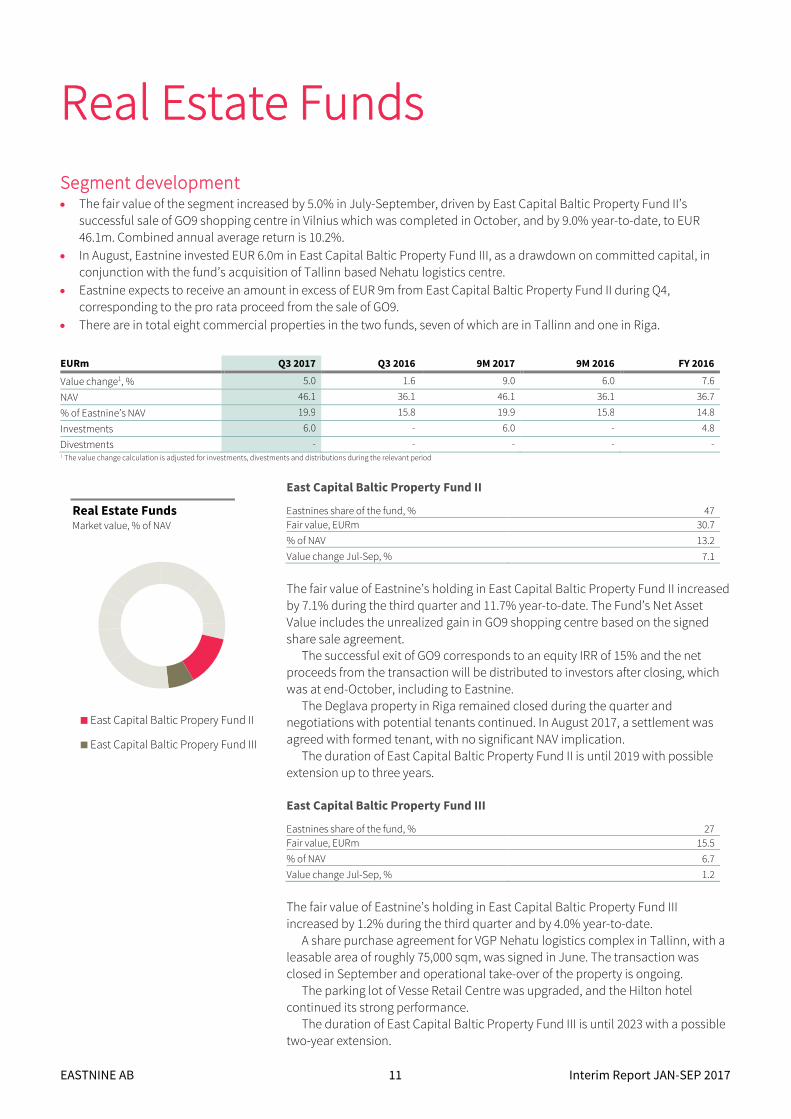
Segment development • The fair value of the segment increased by 5.0% in July-September, driven by East Capital Baltic Property Fund II’s
successful sale of GO9 shopping centre in Vilnius which was completed in October, and by 9.0% year-to-date, to EUR
46.1m. Combined annual average return is 10.2%.
• In August, Eastnine invested EUR 6.0m in East Capital Baltic Property Fund III, as a drawdown on committed capital, in
conjunction with the fund’s acquisition of Tallinn based Nehatu logistics centre.
• Eastnine expects to receive an amount in excess of EUR 9m from East Capital Baltic Property Fund II during Q4,
corresponding to the pro rata proceed from the sale of GO9.
• There are in total eight commercial properties in the two funds, seven of which are in Tallinn and one in Riga.
EURm Q3 2017 Q3 2016 9M 2017 9M 2016 FY 2016
Value change1, % 5.0 1.6 9.0 6.0 7.6
NAV 46.1 36.1 46.1 36.1 36.7
% of Eastnine’s NAV 19.9 15.8 19.9 15.8 14.8
Investments 6.0 - 6.0 - 4.8
Divestments - - - - -1 The value change calculation is adjusted for investments, divestments and distributions during the relevant period
East Capital Baltic Property Fund II
Eastnines share of the fund, % 47
Fair value, EURm 30.7
% of NAV 13.2
Value change Jul-Sep, % 7.1
The fair value of Eastnine’s holding in East Capital Baltic Property Fund II increased
by 7.1% during the third quarter and 11.7% year-to-date. The Fund’s Net Asset
Value includes the unrealized gain in GO9 shopping centre based on the signed
share sale agreement.
The successful exit of GO9 corresponds to an equity IRR of 15% and the net
proceeds from the transaction will be distributed to investors after closing, which
was at end-October, including to Eastnine.
The Deglava property in Riga remained closed during the quarter and
negotiations with potential tenants continued. In August 2017, a settlement was
agreed with formed tenant, with no significant NAV implication.
The duration of East Capital Baltic Property Fund II is until 2019 with possible
extension up to three years.
East Capital Baltic Property Fund III
Eastnines share of the fund, % 27
Fair value, EURm 15.5
% of NAV 6.7
Value change Jul-Sep, % 1.2
The fair value of Eastnine’s holding in East Capital Baltic Property Fund III
increased by 1.2% during the third quarter and by 4.0% year-to-date.
A share purchase agreement for VGP Nehatu logistics complex in Tallinn, with a
leasable area of roughly 75,000 sqm, was signed in June. The transaction was
closed in September and operational take-over of the property is ongoing.
The parking lot of Vesse Retail Centre was upgraded, and the Hilton hotel
continued its strong performance.
The duration of East Capital Baltic Property Fund III is until 2023 with a possible
two-year extension.
Real Estate Funds Market value, % of NAV
East Capital Baltic Propery Fund II
East Capital Baltic Propery Fund III
EASTNINE AB 12 Interim Report JAN-SEP 2017
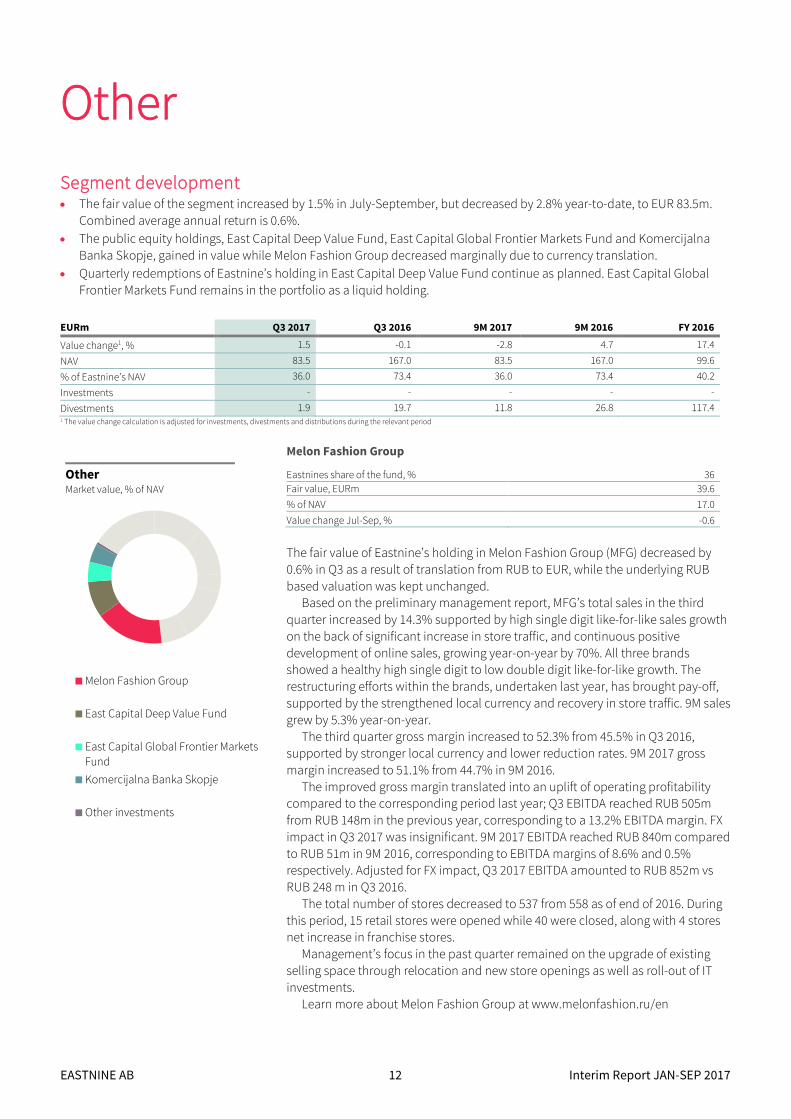
Other
Segment development • The fair value of the segment increased by 1.5% in July-September, but decreased by 2.8% year-to-date, to EUR 83.5m.
Combined average annual return is 0.6%.
• The public equity holdings, East Capital Deep Value Fund, East Capital Global Frontier Markets Fund and Komercijalna
Banka Skopje, gained in value while Melon Fashion Group decreased marginally due to currency translation.
• Quarterly redemptions of Eastnine’s holding in East Capital Deep Value Fund continue as planned. East Capital Global
Frontier Markets Fund remains in the portfolio as a liquid holding.
EURm Q3 2017 Q3 2016 9M 2017 9M 2016 FY 2016
Value change1, % 1.5 -0.1 -2.8 4.7 17.4
NAV 83.5 167.0 83.5 167.0 99.6
% of Eastnine’s NAV 36.0 73.4 36.0 73.4 40.2
Investments - - - - -
Divestments 1.9 19.7 11.8 26.8 117.41 The value change calculation is adjusted for investments, divestments and distributions during the relevant period
Melon Fashion Group
Eastnines share of the fund, % 36
Fair value, EURm 39.6
% of NAV 17.0
Value change Jul-Sep, % -0.6
The fair value of Eastnine’s holding in Melon Fashion Group (MFG) decreased by
0.6% in Q3 as a result of translation from RUB to EUR, while the underlying RUB
based valuation was kept unchanged.
Based on the preliminary management report, MFG’s total sales in the third
quarter increased by 14.3% supported by high single digit like-for-like sales growth
on the back of significant increase in store traffic, and continuous positive
development of online sales, growing year-on-year by 70%. All three brands
showed a healthy high single digit to low double digit like-for-like growth. The
restructuring efforts within the brands, undertaken last year, has brought pay-off,
supported by the strengthened local currency and recovery in store traffic. 9M sales
grew by 5.3% year-on-year.
The third quarter gross margin increased to 52.3% from 45.5% in Q3 2016,
supported by stronger local currency and lower reduction rates. 9M 2017 gross
margin increased to 51.1% from 44.7% in 9M 2016.
The improved gross margin translated into an uplift of operating profitability
compared to the corresponding period last year; Q3 EBITDA reached RUB 505m
from RUB 148m in the previous year, corresponding to a 13.2% EBITDA margin. FX
impact in Q3 2017 was insignificant. 9M 2017 EBITDA reached RUB 840m compared
to RUB 51m in 9M 2016, corresponding to EBITDA margins of 8.6% and 0.5%
respectively. Adjusted for FX impact, Q3 2017 EBITDA amounted to RUB 852m vs
RUB 248 m in Q3 2016.
The total number of stores decreased to 537 from 558 as of end of 2016. During
this period, 15 retail stores were opened while 40 were closed, along with 4 stores
net increase in franchise stores.
Management’s focus in the past quarter remained on the upgrade of existing
selling space through relocation and new store openings as well as roll-out of IT
investments.
Learn more about Melon Fashion Group at www.melonfashion.ru/en
Other Market value, % of NAV
Melon Fashion Group
East Capital Deep Value Fund
East Capital Global Frontier Markets
Fund
Komercijalna Banka Skopje
Other investments
EASTNINE AB 13 Interim Report JAN-SEP 2017
East Capital Deep Value Fund
Eastnines share of the fund, % 72
Fair value, EURm 20.7
% of NAV 8.9
Value change Jul-Sep, % 2.5
The fair value of Eastnine’s investment in the fund increased by 2.5% during the
third quarter, and Eastnine divested fund shares corresponding to EUR 1.9m during
the same period. In general, macro is improving throughout Eastern Europe, with
several countries showing strong recovery and GDP growth among the highest in
Europe, including Russia and the Balkan countries. The biggest movers were
Romanian real estate developer Impact +47.9%, Slovenian insurance company
Sava Re +7.9%, Serbian media company B92 -24.7%, and Serbian Putevi -18.1%.
The fund’s focus going forward will be on small and mid-cap Eastern European
companies with slightly higher liquidity. Following this change in investment
strategy, the fund’s name will change to East Capital Eastern Europe Small Cap,
effective 1 December 2017.
East Capital Global Frontier Markets Fund
Eastnines share of the fund, % 28
Fair value, EURm 11.3
% of NAV 4.9
Value change Jul-Sep, % 2.4
The value of Eastnine’s holding in East Capital Global Frontier Markets Fund gained
2.4% and 10.3% year-to-date, while the MSCI Frontier Markets index increased by
4.2% during the third quarter. The fund underperformed its index primarily due to a
large underweight in Kuwait, a large weight of the index performing strong during
the period.
Argentina had a strong quarter, where Grupo Supervielle was a strong positive
contributor, gaining 29.5%. The Nigerian economy is turning around and showing
positive GDP growth in Q3, for the first time in over a year. The Pakistan market lost
another 14%, as Prime Minister Nawaz Sharif was disqualified by the Supreme
Court and fear of Rupee depreciation intensified.
Komercijalna Banka Skopje
Eastnines holding in the company, % 10
Fair value, EURm 10.6
% of NAV1 4.6
Value change Jul-Sep, % 7.9 1. Direct investment and through East Capital Deep Value Fund
Komercijalna Banka Skopje’s (KBS) shares increased by 7.9% (in EUR) on the
Macedonian exchange during the quarter. Macedonia shows a strong economic
recovery, with an expected GDP growth of 3% in 2017 and KBS continues to benefit
from the strong macroeconomic environment.
However, KBS reported a nine-month net profit of MKD 106m compared to MKD
526m for the same period the previous year. The result was held down mainly due
to an increase of the provisioning of the corporate loans, which was above
expectations in the reporting period.
Learn more about Komercijalna Banka Skopje at www.kb.com.mk
EASTNINE AB 14 Interim Report JAN-SEP 2017
Other information
Risks and uncertainties
The dominant risk in Eastnine’s operations is commercial risk in the form of exposure to specific sectors, geographic regions
or individual holdings and financial risk in the form of market risk, equity price risk, foreign exchange risk and interest rate
risk. A more detailed description of Eastnine’s material risks and uncertainties is provided in the Company’s Annual Report
2016 on pages 60-61. An assessment for the coming months is provided in the Market comment on page 6.
In addition, through the business activities of the holdings, i.e. their offerings of products and services, within the
respective sectors, the investments are also exposed to legal/regulatory risk and political risk, for example political decisions
on public sector expenditures and industry regulations.
Organisational and investment structure
Eastnine AB (publ) is a Swedish investment company listed on Nasdaq Stockholm. Eastnine’s business concept is to
maximise risk-adjusted shareholder return by offering shareholders exposure to a portfolio of primarily real estate
investments in the Baltic countries, mainly through direct ownership. Eastnine also holds other private equity and fund
investments in Eastern Europe, that are expected to be divested within the next few years.
The Company is currently transitioning into a pure Baltic real estate company, with an aim to generate predictable cash
flows by being a long-term owner of attractive commercial properties with stable tenants in prime locations in the Baltic
capitals.
Eastnine has seven full-time employees in its Stockholm headquarters. For further information about the organizational
and investment structure of the Company, please see the Company’s latest Annual Report, under the section ‘Corporate
Governance’.
The CEO certifies that the interim report presents a true and fair view of the Company's and the Group’s operations, financial
position and profits and describes the significant risks and uncertainties facing the Company and the Group.
Stockholm, 9 November 2017
Kestutis Sasnauskas
Chief Executive Officer
EASTNINE AB 15 Interim Report JAN-SEP 2017
Review Report
To the Board of Eastnine AB (publ)
Corporate identity number 556693-7404
Introduction We have reviewed the summary interim financial information (interim report) of Eastnine AB (publ) as of 30 September 2017
and the nine-month period then ended except for the investment portfolio reporting on pages 9-13 and 26. The Board of
Directors and the Managing Director are responsible for the preparation and presentation of this interim report in accordance
with IAS 34 and the Annual Accounts Act. Our responsibility is to express a conclusion on this interim report based on our review.
Scope of the Review We conducted our review in accordance with the Standard on review engagements (ISRE) 2410 Review of Interim Financial
Information Performed by the Independent Auditor of the Entity. A review of interim financial information consists of making
inquiries, primarily of persons responsible for financial and accounting matters, and applying analytical and other review
procedures. A review is substantially less in scope than an audit conducted in accordance with International Standards on
Auditing and other generally accepted auditing practices. The procedures performed in a review do not enable us to obtain a
level of assurance that would make us aware of all significant matters that might be identified in an audit. Accordingly, we do
not express an audit opinion.
Conclusion Based on our review, nothing has come to our attention that causes us to believe that the interim report is not prepared, in all
material respects, for the Group in accordance with IAS 34 and the Annual Accounts Act, and for the Parent Company in
accordance with the Annual Accounts Act.
Stockholm, 9 November 2017
KPMG AB
Anders Malmeby
Authorised Public Accountant
This review report is a translation of the original review report in Swedish.

EASTNINE AB 16 Interim Report JAN-SEP 2017
Financial Statements
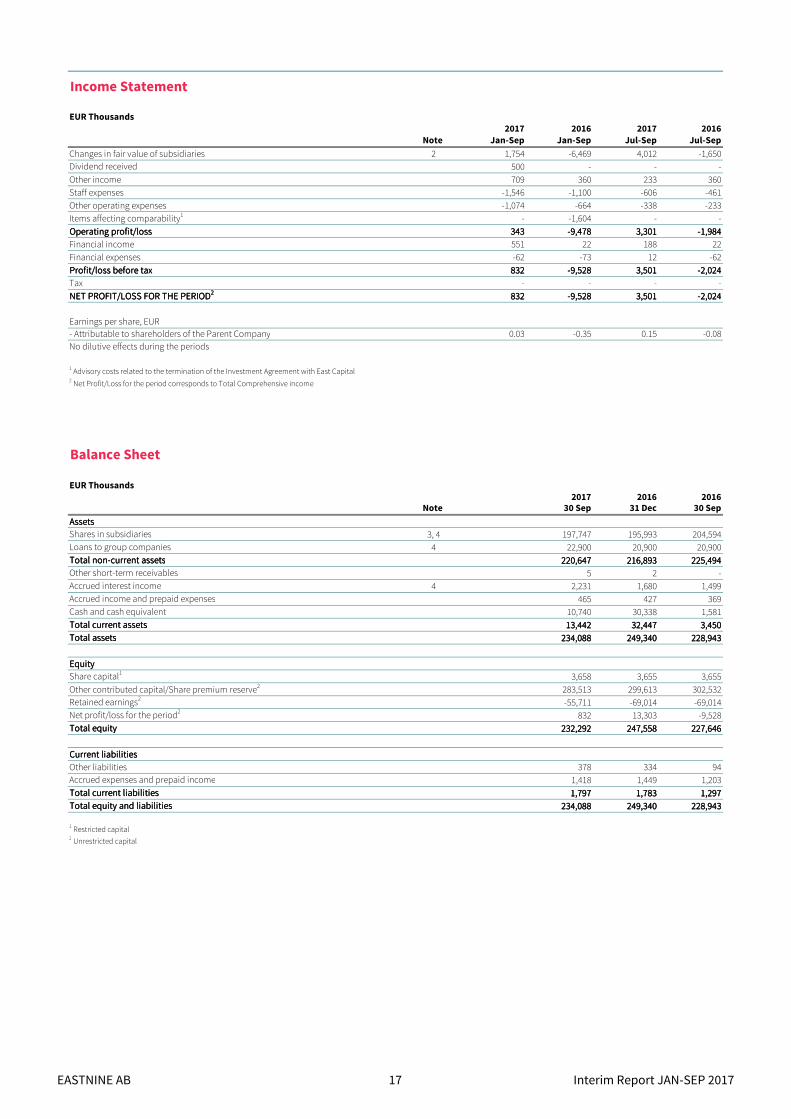
Income Statement
2017 2016 2017 2016
Note Jan-Sep Jan-Sep Jul-Sep Jul-Sep
2 1,754 -6,469 4,012 -1,650Dividend received 500 - - -
709 360 233 360
-1,546 -1,100 -606 -461
-1,074 -664 -338 -233
- -1,604 - -
343343343343 -9,478-9,478-9,478-9,478 3,3013,3013,3013,301 -1,984-1,984-1,984-1,984
551 22 188 22
-62 -73 12 -62
832832832832 -9,528-9,528-9,528-9,528 3,5013,5013,5013,501 -2,024-2,024-2,024-2,024
- - - -
832832832832 -9,528-9,528-9,528-9,528 3,5013,5013,5013,501 -2,024-2,024-2,024-2,024
Earnings per share, EUR0.03 -0.35 0.15 -0.08
No dilutive effects during the periods
2017 2016 2016Note 30 Sep 31 Dec 30 Sep
AssetsAssetsAssetsAssetsShares in subsidiaries 3, 4 197,747 195,993 204,594Loans to group companies 4 22,900 20,900 20,900Total non-current assetsTotal non-current assetsTotal non-current assetsTotal non-current assets 220,647220,647220,647220,647 216,893216,893216,893216,893 225,494225,494225,494225,494Other short-term receivables 5 2 -Accrued interest income 4 2,231 1,680 1,499Accrued income and prepaid expenses 465 427 369Cash and cash equivalent 10,740 30,338 1,581Total current assetsTotal current assetsTotal current assetsTotal current assets 13,44213,44213,44213,442 32,44732,44732,44732,447 3,4503,4503,4503,450Total assetsTotal assetsTotal assetsTotal assets 234,088234,088234,088234,088 249,340249,340249,340249,340 228,943228,943228,943228,943
EquityEquityEquityEquityShare capital1 3,658 3,655 3,655
283,513 299,613 302,532Retained earnings2 -55,711 -69,014 -69,014Net profit/loss for the period2 832 13,303 -9,528Total equityTotal equityTotal equityTotal equity 232,292232,292232,292232,292 247,558247,558247,558247,558 227,646227,646227,646227,646
Current liabilitiesCurrent liabilitiesCurrent liabilitiesCurrent liabilities
Other liabilities 378 334 94Accrued expenses and prepaid income 1,418 1,449 1,203Total current liabilitiesTotal current liabilitiesTotal current liabilitiesTotal current liabilities 1,7971,7971,7971,797 1,7831,7831,7831,783 1,2971,2971,2971,297Total equity and liabilitiesTotal equity and liabilitiesTotal equity and liabilitiesTotal equity and liabilities 234,088234,088234,088234,088 249,340249,340249,340249,340 228,943228,943228,943228,943
1 Restricted capital2 Unrestricted capital
Other income
NET PROFIT/LOSS FOR THE PERIODNET PROFIT/LOSS FOR THE PERIODNET PROFIT/LOSS FOR THE PERIODNET PROFIT/LOSS FOR THE PERIOD2222
Balance Sheet
Items affecting comparability1
2 Net Profit/Loss for the period corresponds to Total Comprehensive income
Tax
Other operating expenses
Operating profit/lossOperating profit/lossOperating profit/lossOperating profit/loss
- Attributable to shareholders of the Parent Company
1 Advisory costs related to the termination of the Investment Agreement with East Capital
EUR Thousands
Changes in fair value of subsidiaries
Financial income
Financial expenses
Profit/loss before taxProfit/loss before taxProfit/loss before taxProfit/loss before tax
Staff expenses
EUR Thousands
Other contributed capital/Share premium reserve2
EASTNINE AB 17 Interim Report JAN-SEP 2017
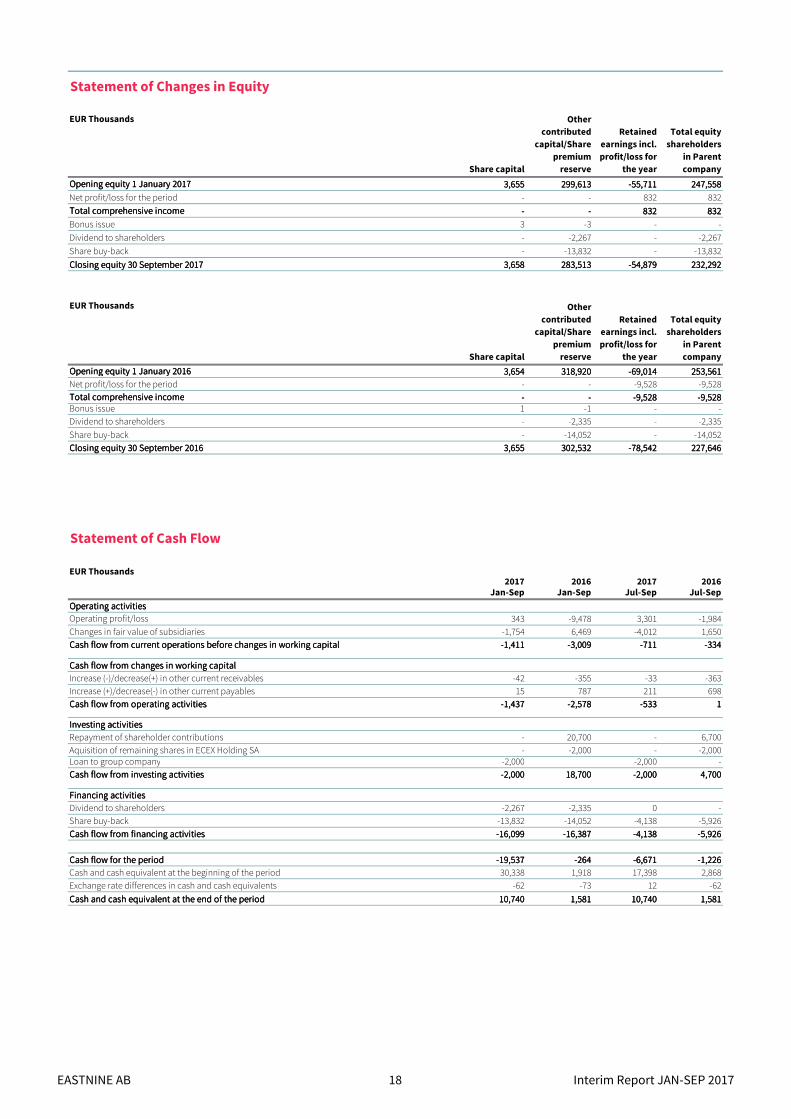
Statement of Changes in Equity
EUR Thousands
Share capital
Other
contributed
capital/Share
premium
reserve
Retained
earnings incl.
profit/loss for
the year
Total equity
shareholders
in Parent
company
Opening equity 1 January 2017Opening equity 1 January 2017Opening equity 1 January 2017Opening equity 1 January 2017 3,6553,6553,6553,655 299,613299,613299,613299,613 -55,711-55,711-55,711-55,711 247,558247,558247,558247,558
Net profit/loss for the period - - 832 832
Total comprehensive incomeTotal comprehensive incomeTotal comprehensive incomeTotal comprehensive income ---- ---- 832832832832 832832832832
Bonus issue 3 -3 - -
Dividend to shareholders - -2,267 - -2,267
Share buy-back - -13,832 - -13,832
3,6583,6583,6583,658 283,513283,513283,513283,513 -54,879-54,879-54,879-54,879 232,292232,292232,292232,292
EUR Thousands
Share capital
Other
contributed
capital/Share
premium
reserve
Retained
earnings incl.
profit/loss for
the year
Total equity
shareholders
in Parent
company
Opening equity 1 January 2016Opening equity 1 January 2016Opening equity 1 January 2016Opening equity 1 January 2016 3,6543,6543,6543,654 318,920318,920318,920318,920 -69,014-69,014-69,014-69,014 253,561253,561253,561253,561
Net profit/loss for the period - - -9,528 -9,528Total comprehensive incomeTotal comprehensive incomeTotal comprehensive incomeTotal comprehensive income ---- ---- -9,528-9,528-9,528-9,528 -9,528-9,528-9,528-9,528Bonus issue 1 -1 - -
Dividend to shareholders - -2,335 - -2,335
Share buy-back - -14,052 - -14,052
3,6553,6553,6553,655 302,532302,532302,532302,532 -78,542-78,542-78,542-78,542 227,646227,646227,646227,646
Statement of Cash Flow
2017 2016 2017 2016Jan-Sep Jan-Sep Jul-Sep Jul-Sep
Operating activitiesOperating activitiesOperating activitiesOperating activitiesOperating profit/loss 343 -9,478 3,301 -1,984
Changes in fair value of subsidiaries -1,754 6,469 -4,012 1,650-1,411-1,411-1,411-1,411 -3,009-3,009-3,009-3,009 -711-711-711-711 -334-334-334-334
Increase (-)/decrease(+) in other current receivables -42 -355 -33 -363
15 787 211 698-1,437-1,437-1,437-1,437 -2,578-2,578-2,578-2,578 -533-533-533-533 1111
Investing activitiesInvesting activitiesInvesting activitiesInvesting activities
Repayment of shareholder contributions - 20,700 - 6,700
Aquisition of remaining shares in ECEX Holding SA - -2,000 - -2,000Loan to group company -2,000 -2,000 -
-2,000-2,000-2,000-2,000 18,70018,70018,70018,700 -2,000-2,000-2,000-2,000 4,7004,7004,7004,700
Financing activitiesFinancing activitiesFinancing activitiesFinancing activities
Dividend to shareholders -2,267 -2,335 0 -
Share buy-back -13,832 -14,052 -4,138 -5,926
-16,099-16,099-16,099-16,099 -16,387-16,387-16,387-16,387 -4,138-4,138-4,138-4,138 -5,926-5,926-5,926-5,926
Cash flow for the periodCash flow for the periodCash flow for the periodCash flow for the period -19,537-19,537-19,537-19,537 -264-264-264-264 -6,671-6,671-6,671-6,671 -1,226-1,226-1,226-1,226
30,338 1,918 17,398 2,868
-62 -73 12 -62
10,74010,74010,74010,740 1,5811,5811,5811,581 10,74010,74010,74010,740 1,5811,5811,5811,581
EUR Thousands
Cash and cash equivalent at the beginning of the period
Closing equity 30 September 2017Closing equity 30 September 2017Closing equity 30 September 2017Closing equity 30 September 2017
Closing equity 30 September 2016Closing equity 30 September 2016Closing equity 30 September 2016Closing equity 30 September 2016
Cash and cash equivalent at the end of the periodCash and cash equivalent at the end of the periodCash and cash equivalent at the end of the periodCash and cash equivalent at the end of the period
Increase (+)/decrease(-) in other current payables
Cash flow from changes in working capitalCash flow from changes in working capitalCash flow from changes in working capitalCash flow from changes in working capital
Exchange rate differences in cash and cash equivalents
Cash flow from financing activitiesCash flow from financing activitiesCash flow from financing activitiesCash flow from financing activities
Cash flow from current operations before changes in working capitalCash flow from current operations before changes in working capitalCash flow from current operations before changes in working capitalCash flow from current operations before changes in working capital
Cash flow from investing activitiesCash flow from investing activitiesCash flow from investing activitiesCash flow from investing activities
Cash flow from operating activitiesCash flow from operating activitiesCash flow from operating activitiesCash flow from operating activities
EASTNINE AB 18 Interim Report JAN-SEP 2017
Note 1 Accounting Principles
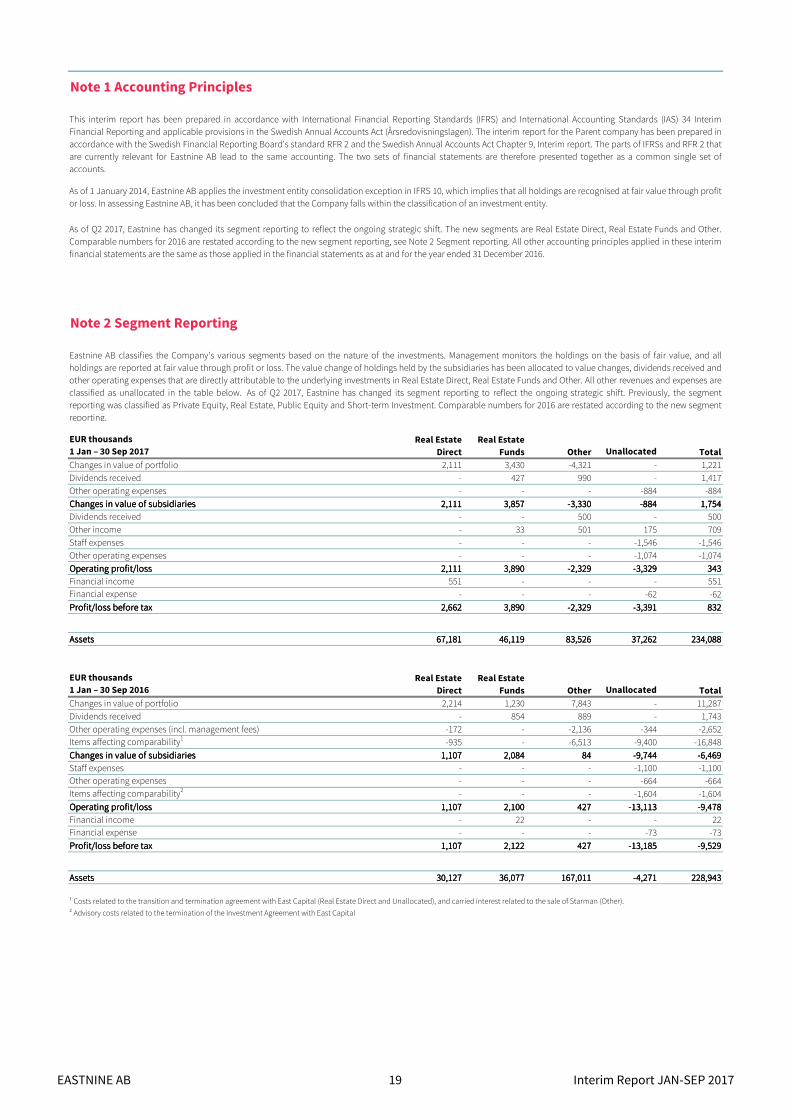
Note 2 Segment Reporting
EUR thousands
1 Jan – 30 Sep 2017 Unallocated
Changes in value of portfolio 2,111 3,430 -4,321 - 1,221
Dividends received - 427 990 - 1,417
Other operating expenses - - - -884 -884
Changes in value of subsidiariesChanges in value of subsidiariesChanges in value of subsidiariesChanges in value of subsidiaries 2,1112,1112,1112,111 3,8573,8573,8573,857 -3,330-3,330-3,330-3,330 -884-884-884-884 1,7541,7541,7541,754
Dividends received - - 500 - 500
Other income - 33 501 175 709
Staff expenses - - - -1,546 -1,546
Other operating expenses - - - -1,074 -1,074
Operating profit/lossOperating profit/lossOperating profit/lossOperating profit/loss 2,1112,1112,1112,111 3,8903,8903,8903,890 -2,329-2,329-2,329-2,329 -3,329-3,329-3,329-3,329 343343343343
Financial income 551 - - - 551Financial expense - - - -62 -62
Profit/loss before taxProfit/loss before taxProfit/loss before taxProfit/loss before tax 2,6622,6622,6622,662 3,8903,8903,8903,890 -2,329-2,329-2,329-2,329 -3,391-3,391-3,391-3,391 832832832832
AssetsAssetsAssetsAssets 67,18167,18167,18167,181 46,11946,11946,11946,119 83,52683,52683,52683,526 37,26237,26237,26237,262 234,088234,088234,088234,088
EUR thousands
1 Jan – 30 Sep 2016 Unallocated
Changes in value of portfolio 2,214 1,230 7,843 - 11,287
Dividends received - 854 889 - 1,743
-172 - -2,136 -344 -2,652Items affecting comparability1 -935 - -6,513 -9,400 -16,848
Changes in value of subsidiariesChanges in value of subsidiariesChanges in value of subsidiariesChanges in value of subsidiaries 1,1071,1071,1071,107 2,0842,0842,0842,084 84848484 -9,744-9,744-9,744-9,744 -6,469-6,469-6,469-6,469
Staff expenses - - - -1,100 -1,100Other operating expenses - - - -664 -664Items affecting comparability2 - - - -1,604 -1,604
Operating profit/lossOperating profit/lossOperating profit/lossOperating profit/loss 1,1071,1071,1071,107 2,1002,1002,1002,100 427427427427 -13,113-13,113-13,113-13,113 -9,478-9,478-9,478-9,478
Financial income - 22 - - 22Financial expense - - - -73 -73
Profit/loss before taxProfit/loss before taxProfit/loss before taxProfit/loss before tax 1,1071,1071,1071,107 2,1222,1222,1222,122 427427427427 -13,185-13,185-13,185-13,185 -9,529-9,529-9,529-9,529
AssetsAssetsAssetsAssets 30,12730,12730,12730,127 36,07736,07736,07736,077 167,011167,011167,011167,011 -4,271-4,271-4,271-4,271 228,943228,943228,943228,943
= Advisory costs related to the termination of the Investment Agreement with East Capital
> Costs related to the transition and termination agreement with East Capital (Real Estate Direct and Unallocated), and carried interest related to the sale of Starman (Other).
This interim report has been prepared in accordance with International Financial Reporting Standards (IFRS) and International Accounting Standards (IAS) 34 InterimFinancial Reporting and applicable provisions in the Swedish Annual Accounts Act (Årsredovisningslagen). The interim report for the Parent company has been prepared inaccordance with the Swedish Financial Reporting Board's standard RFR 2 and the Swedish Annual Accounts Act Chapter 9, Interim report. The parts of IFRSs and RFR 2 thatare currently relevant for Eastnine AB lead to the same accounting. The two sets of financial statements are therefore presented together as a common single set ofaccounts.
TotalOther
Eastnine AB classifies the Company’s various segments based on the nature of the investments. Management monitors the holdings on the basis of fair value, and allholdings are reported at fair value through profit or loss. The value change of holdings held by the subsidiaries has been allocated to value changes, dividends received andother operating expenses that are directly attributable to the underlying investments in Real Estate Direct, Real Estate Funds and Other. All other revenues and expenses areclassified as unallocated in the table below. As of Q2 2017, Eastnine has changed its segment reporting to reflect the ongoing strategic shift. Previously, the segmentreporting was classified as Private Equity, Real Estate, Public Equity and Short-term Investment. Comparable numbers for 2016 are restated according to the new segmentreporting.
Real Estate
Direct
As of 1 January 2014, Eastnine AB applies the investment entity consolidation exception in IFRS 10, which implies that all holdings are recognised at fair value through profitor loss. In assessing Eastnine AB, it has been concluded that the Company falls within the classification of an investment entity.
Other Total
Real Estate
Funds
As of Q2 2017, Eastnine has changed its segment reporting to reflect the ongoing strategic shift. The new segments are Real Estate Direct, Real Estate Funds and Other.Comparable numbers for 2016 are restated according to the new segment reporting, see Note 2 Segment reporting. All other accounting principles applied in these interimfinancial statements are the same as those applied in the financial statements as at and for the year ended 31 December 2016.
Other operating expenses (incl. management fees)
Real Estate
Direct
Real Estate
Funds
EASTNINE AB 19 Interim Report JAN-SEP 2017
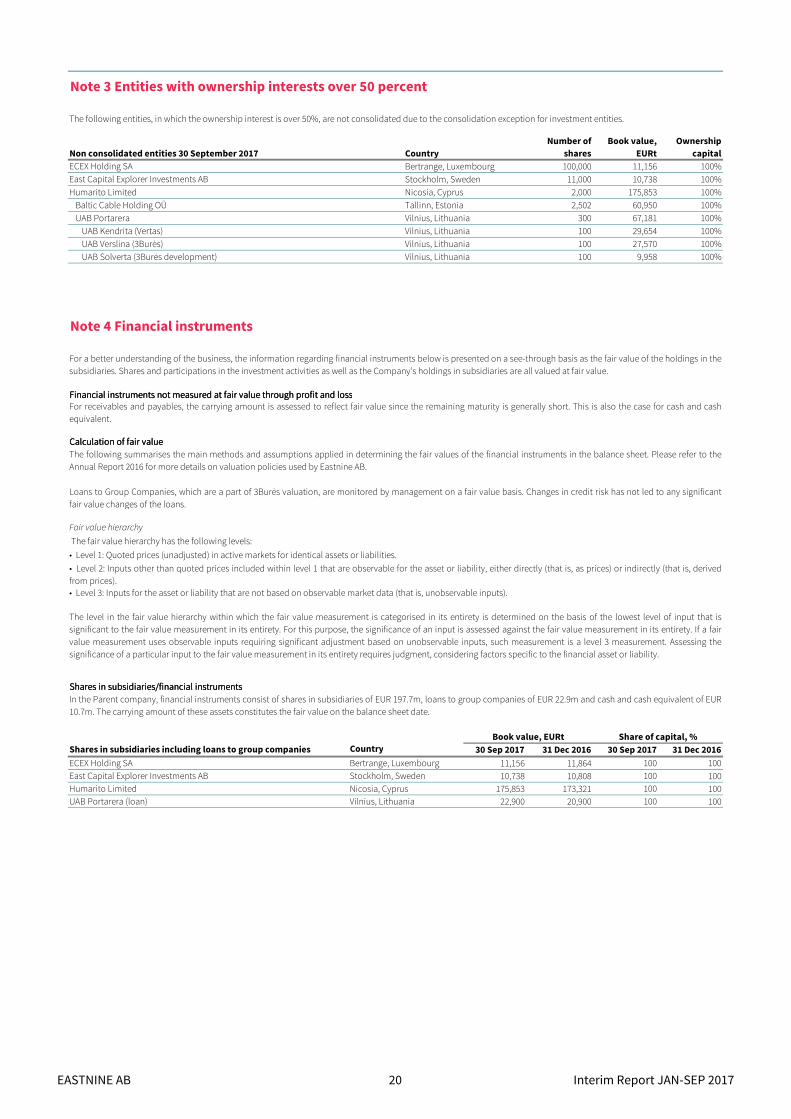
Note 3 Entities with ownership interests over 50 percent
Bertrange, Luxembourg 100,000 11,156 100%
Stockholm, Sweden 11,000 10,738 100%
Humarito Limited Nicosia, Cyprus 2,000 175,853 100%
Baltic Cable Holding OÜ Tallinn, Estonia 2,502 60,950 100%
UAB Portarera Vilnius, Lithuania 300 67,181 100%
UAB Kendrita (Vertas) Vilnius, Lithuania 100 29,654 100%
UAB Verslina (3Burės) Vilnius, Lithuania 100 27,570 100%
UAB Solverta (3Burės development) Vilnius, Lithuania 100 9,958 100%
Note 4 Financial instruments
Calculation of fair valueCalculation of fair valueCalculation of fair valueCalculation of fair value
Shares in subsidiaries/financial instrumentsShares in subsidiaries/financial instrumentsShares in subsidiaries/financial instrumentsShares in subsidiaries/financial instruments
Country 30 Sep 2017 31 Dec 2016 30 Sep 2017 31 Dec 2016
ECEX Holding SA Bertrange, Luxembourg 11,156 11,864 100 100East Capital Explorer Investments AB Stockholm, Sweden 10,738 10,808 100 100 Humarito Limited Nicosia, Cyprus 175,853 173,321 100 100 UAB Portarera (loan) Vilnius, Lithuania 22,900 20,900 100 100
Shares in subsidiaries including loans to group companies
Financial instruments not measured at fair value through profit and lossFinancial instruments not measured at fair value through profit and lossFinancial instruments not measured at fair value through profit and lossFinancial instruments not measured at fair value through profit and lossFor receivables and payables, the carrying amount is assessed to reflect fair value since the remaining maturity is generally short. This is also the case for cash and cashequivalent.
The following summarises the main methods and assumptions applied in determining the fair values of the financial instruments in the balance sheet. Please refer to theAnnual Report 2016 for more details on valuation policies used by Eastnine AB.
Fair value hierarchy
The fair value hierarchy has the following levels:
• Level 1: Quoted prices (unadjusted) in active markets for identical assets or liabilities.
Book value, EURt Share of capital, %
Non consolidated entities 30 September 2017
East Capital Explorer Investments AB
• Level 3: Inputs for the asset or liability that are not based on observable market data (that is, unobservable inputs).
The level in the fair value hierarchy within which the fair value measurement is categorised in its entirety is determined on the basis of the lowest level of input that issignificant to the fair value measurement in its entirety. For this purpose, the significance of an input is assessed against the fair value measurement in its entirety. If a fairvalue measurement uses observable inputs requiring significant adjustment based on unobservable inputs, such measurement is a level 3 measurement. Assessing thesignificance of a particular input to the fair value measurement in its entirety requires judgment, considering factors specific to the financial asset or liability.
In the Parent company, financial instruments consist of shares in subsidiaries of EUR 197.7m, loans to group companies of EUR 22.9m and cash and cash equivalent of EUR10.7m. The carrying amount of these assets constitutes the fair value on the balance sheet date.
ECEX Holding SA
Loans to Group Companies, which are a part of 3Burės valuation, are monitored by management on a fair value basis. Changes in credit risk has not led to any significantfair value changes of the loans.
The following entities, in which the ownership interest is over 50%, are not consolidated due to the consolidation exception for investment entities.
Country
Number of
shares
Book value,
EURt
Ownership
capital
For a better understanding of the business, the information regarding financial instruments below is presented on a see-through basis as the fair value of the holdings in thesubsidiaries. Shares and participations in the investment activities as well as the Company’s holdings in subsidiaries are all valued at fair value.
• Level 2: Inputs other than quoted prices included within level 1 that are observable for the asset or liability, either directly (that is, as prices) or indirectly (that is, derivedfrom prices).
EASTNINE AB 20 Interim Report JAN-SEP 2017
EUR Thousands
30 September 2017
Breakdown of values in subsidiaries
including loans to group companies Total
Opening balance 1 January 2017Opening balance 1 January 2017Opening balance 1 January 2017Opening balance 1 January 2017 28,73928,73928,73928,739 36,65636,65636,65636,656 99,63199,63199,63199,631 53,20153,20153,20153,201 -1,334-1,334-1,334-1,334 216,893216,893216,893216,893
Purchases/additions 34,100 6,033 - -38,133 - 2,000
Divestments/Reductions - - -11,784 11,784 - 0
Other - - - -800 -84 -884
Dividend received - - - 1,917 - 1,917
Dividend paid to parent company - - - -500 - -500
2,111 3,430 -4,321 - - 1,22164,95064,95064,95064,950 46,11946,11946,11946,119 83,52683,52683,52683,526 27,47027,47027,47027,470 -1,418-1,418-1,418-1,418 220,647220,647220,647220,647
EUR Thousands
31 December 2016Breakdown of values in subsidiaries
including loans to group companies Total
Opening balance 1 January 2016Opening balance 1 January 2016Opening balance 1 January 2016Opening balance 1 January 2016 27,64127,64127,64127,641 30,07730,07730,07730,077 185,927185,927185,927185,927 8,5938,5938,5938,593 -98-98-98-98 252,140252,140252,140252,140
Movement of acrrued interest income to Parent company -1,477 - - - - -1,477
Purchases/additions 250 4,770 - -5,020 - 0
Divestments/Reductions - - -117,416 117,416 - 0
Other - - - -17,116 -1,236 -18,352
Repaid shareholders contributions - - - -52,700 - -52,700
Dividend received - - - 2,029 - 2,029
2,326 1,808 31,119 - - 35,25428,73928,73928,73928,739 36,65636,65636,65636,656 99,63199,63199,63199,631 53,20153,20153,20153,201 -1,334-1,334-1,334-1,334 216,893216,893216,893216,893
Holding Class Valuation assumptions
3Burės Real Estate Direct DCF WACC 8%, Exit yield 7%
3Burės development Real Estate Direct DCF WACC 7%, Exit yield 7%
Vertas Real Estate Direct Acquisition value
East Capital Baltic Property Fund II Real Estate Funds DCF WACC 8-10%, Exit yield 7-8%
East Capital Baltic Property Fund III Real Estate Funds DCF WACC 9%, Exit yield 8%
Melon Fashion Group Other DCF
Effect in EUR thousands
30 September 2017
Sensitivity analysis Increase Decrease Increase Decrease
-1,499 1,568 -659 677
Exit yield (0.5% movement) -2,561 2,958 -1,468 1,682
Effect in EUR thousands
30 September 2017
Sensitivity analysis Increase Decrease
Long term growth rate (0.5% movement) 1,594 -1,465
Weighted average cost of capital (WACC) (0.5% movement) -2,194 2,400
Long term operating margin (0.5% movement) 1,501 -1,505
Profit or loss
Closing balance 31 December 2016Closing balance 31 December 2016Closing balance 31 December 2016Closing balance 31 December 2016
Other
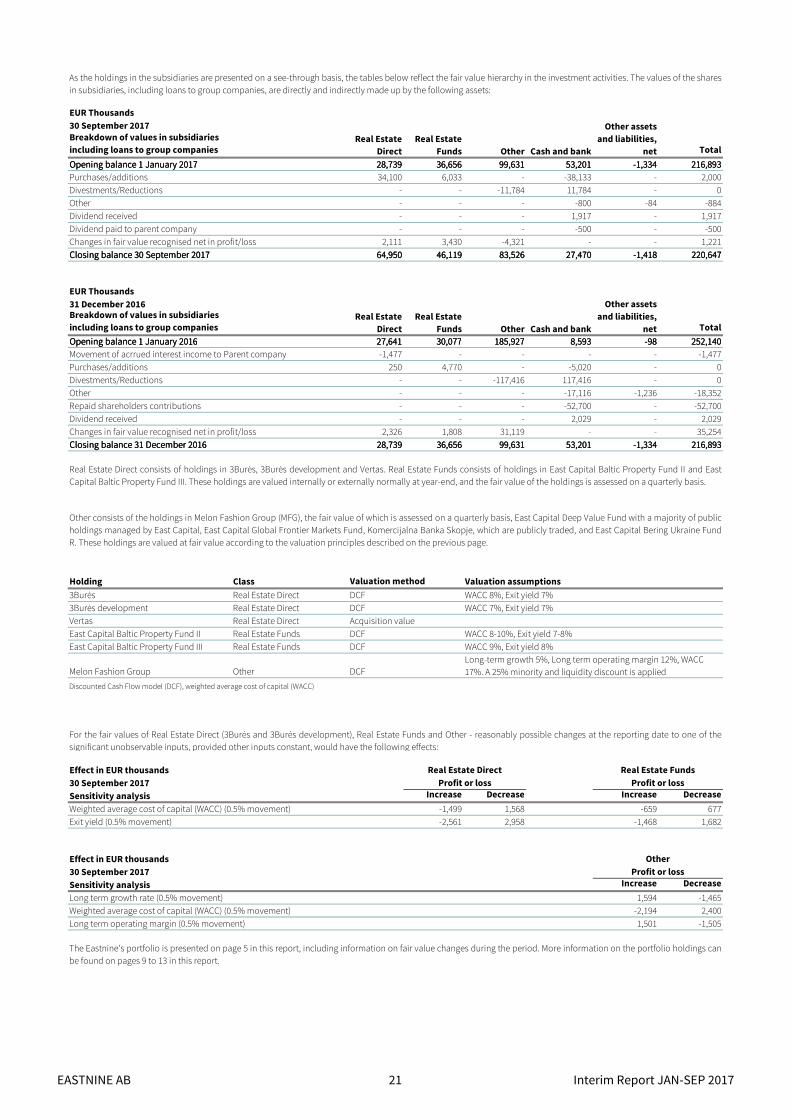
Discounted Cash Flow model (DCF), weighted average cost of capital (WACC)
Real Estate Funds
Cash and bank
Real Estate
Direct
Real Estate
Funds
Other assets
and liabilities,
netOther Cash and bank
Real Estate
Funds
Real Estate
Direct
As the holdings in the subsidiaries are presented on a see-through basis, the tables below reflect the fair value hierarchy in the investment activities. The values of the sharesin subsidiaries, including loans to group companies, are directly and indirectly made up by the following assets:
Changes in fair value recognised net in profit/loss
Other consists of the holdings in Melon Fashion Group (MFG), the fair value of which is assessed on a quarterly basis, East Capital Deep Value Fund with a majority of publicholdings managed by East Capital, East Capital Global Frontier Markets Fund, Komercijalna Banka Skopje, which are publicly traded, and East Capital Bering Ukraine FundR. These holdings are valued at fair value according to the valuation principles described on the previous page.
Real Estate Direct consists of holdings in 3Burės, 3Burės development and Vertas. Real Estate Funds consists of holdings in East Capital Baltic Property Fund II and EastCapital Baltic Property Fund III. These holdings are valued internally or externally normally at year-end, and the fair value of the holdings is assessed on a quarterly basis.
Changes in fair value recognised net in profit/loss
Closing balance 30 September 2017Closing balance 30 September 2017Closing balance 30 September 2017Closing balance 30 September 2017
Other assets
and liabilities,
net
The Eastnine's portfolio is presented on page 5 in this report, including information on fair value changes during the period. More information on the portfolio holdings canbe found on pages 9 to 13 in this report.
Profit or loss
Real Estate Direct
Profit or loss
Other
Long-term growth 5%, Long term operating margin 12%, WACC 17%. A 25% minority and liquidity discount is applied
For the fair values of Real Estate Direct (3Burės and 3Burės development), Real Estate Funds and Other - reasonably possible changes at the reporting date to one of thesignificant unobservable inputs, provided other inputs constant, would have the following effects:
Weighted average cost of capital (WACC) (0.5% movement)
Valuation method
EASTNINE AB 21 Interim Report JAN-SEP 2017
EUR thousands
30 September 2017
Real Estate Direct - 67,181 67,181
Real Estate Funds - 46,119 46,119
Other 42,612 40,914 83,526
Total Total Total Total 42,61242,61242,61242,612 154,215154,215154,215154,215 196,826196,826196,826196,826
EUR thousands
31 December 2016
Real Estate Direct - 30,419 30,419
Real Estate Funds - 36,656 36,656
Other 49,592 50,039 99,631
Total Total Total Total 49,59249,59249,59249,592 117,114117,114117,114117,114 166,706166,706166,706166,706
EUR thousands
30 September 2017
Opening balance 2017Opening balance 2017Opening balance 2017Opening balance 2017 30,41930,41930,41930,419 36,65636,65636,65636,656 50,03950,03950,03950,039 117,114117,114117,114117,114
Purchases/additions 34,100 6,033 - 40,133
Divestments/Reductions - - -5,702 -5,702
Changes in fair value recognised net in profit/loss 2,662 3,430 -3,423 2,66967,18167,18167,18167,181 46,11946,11946,11946,119 40,91440,91440,91440,914 154,215154,215154,215154,215
EUR thousands
31 December 2016
Opening balance 2016Opening balance 2016Opening balance 2016Opening balance 2016 27,64127,64127,64127,641 30,07730,07730,07730,077 105,957105,957105,957105,957 163,675163,675163,675163,675Transfers out of level 31 - - -71,839 -71,839
Purchase/additions 250 4,770 - 5,020
2,529 1,808 15,921 20,25830,41930,41930,41930,419 36,65636,65636,65636,656 50,03950,03950,03950,039 117,114117,114117,114117,114
Risks and uncertaintiesRisks and uncertaintiesRisks and uncertaintiesRisks and uncertainties
Risk factors Change
Fx EUR/RUB +/- 10%
Fx EUR/USD +/- 5%
Equity price +/- 10%
Level 1 Level 3
Effect on net
profit/loss for the period
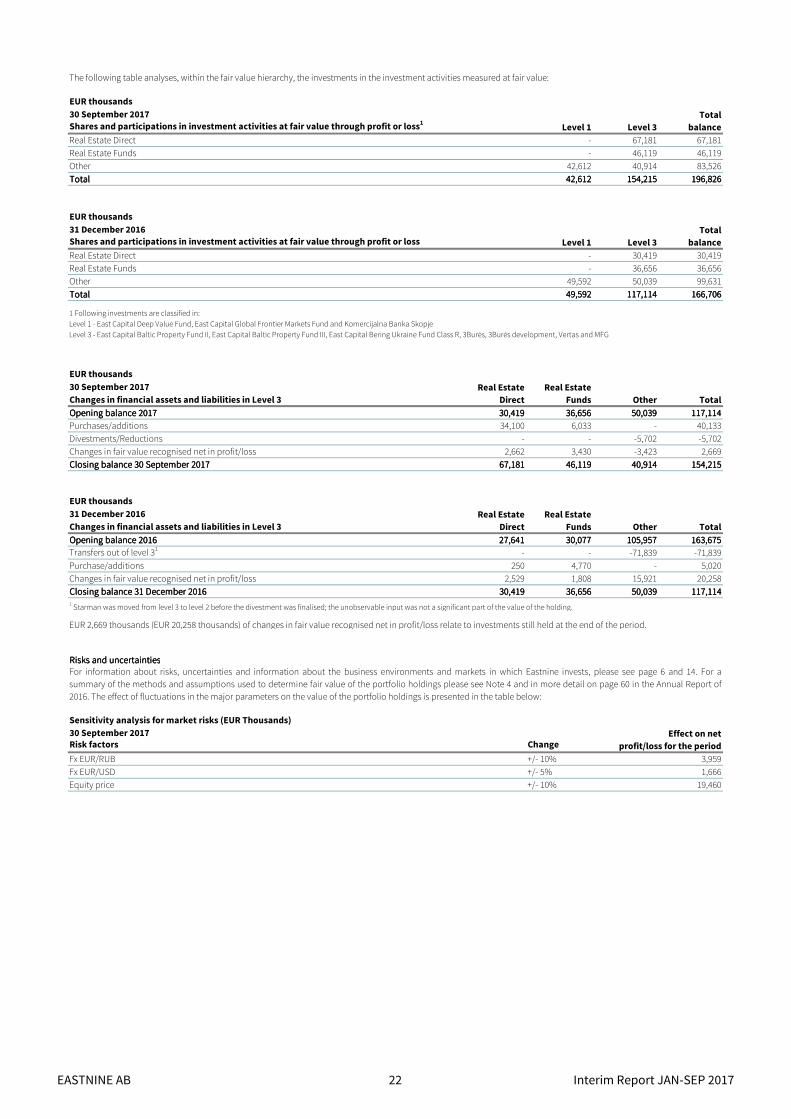
EUR 2,669 thousands (EUR 20,258 thousands) of changes in fair value recognised net in profit/loss relate to investments still held at the end of the period.
Closing balance 30 September 2017Closing balance 30 September 2017Closing balance 30 September 2017Closing balance 30 September 2017
Real Estate
Direct
Closing balance 31 December 2016Closing balance 31 December 2016Closing balance 31 December 2016Closing balance 31 December 2016
Real Estate
Funds
Sensitivity analysis for market risks (EUR Thousands)
1 Starman was moved from level 3 to level 2 before the divestment was finalised; the unobservable input was not a significant part of the value of the holding.
Real Estate
Funds
1,666
19,460
Other
Total
balance
For information about risks, uncertainties and information about the business environments and markets in which Eastnine invests, please see page 6 and 14. For asummary of the methods and assumptions used to determine fair value of the portfolio holdings please see Note 4 and in more detail on page 60 in the Annual Report of2016. The effect of fluctuations in the major parameters on the value of the portfolio holdings is presented in the table below:
30 September 2017
Other Total
The following table analyses, within the fair value hierarchy, the investments in the investment activities measured at fair value:
Level 1Shares and participations in investment activities at fair value through profit or loss
Shares and participations in investment activities at fair value through profit or loss1
Real Estate
Direct Total
1 Following investments are classified in: Level 1 - East Capital Deep Value Fund, East Capital Global Frontier Markets Fund and Komercijalna Banka SkopjeLevel 3 - East Capital Baltic Property Fund II, East Capital Baltic Property Fund III, East Capital Bering Ukraine Fund Class R, 3Burės, 3Burės development, Vertas and MFG
Level 3
Total
balance
3,959
Changes in fair value recognised net in profit/loss
Changes in financial assets and liabilities in Level 3
Changes in financial assets and liabilities in Level 3
EASTNINE AB 22 Interim Report JAN-SEP 2017
Note 5 Related parties
Note 6 Repurchase of shares and dividend
Note 7 Events occurring after the end of the quarter
According to decision by the Board of Directors, the resigned CEO Mia Jurke received a compensation corresponding to six monthly salaries.
At an Extraordinary General Meeting on 23 January 2017, the Meeting approved the Board of Directors’ proposal to reduce the share capital by cancelling of 2,500,000previously repurchased shares and to increase the share capital by way of a bonus issue. On 31 January 2017, the cancelling of 2,500,000 repurchased shares was executed.Further, in accordance with the decision at the Annual General Meeting on 15 May 2017, concerning cancellation of repurchased share and to carry out a bonus issue withoutissuing new shares, 845,530 shares were cancelled.
There have been no other material related party transaction during the year.
Following the termination of the Investment Agreement between Eastnine and East Capital on 9 May 2016, all management fee payments to East Capital were halted, withthe exception of the real estate funds East Capital Baltic Property Fund II and East Capital Baltic Property Fund III. As a consequence, during the period Jan-Sep 2017, theCompany received repayments of EUR 0.5m (EUR 0.0m) regarding management fees originated in the other East Capital funds. Management fees originated in the real estate funds during the period Jan-Sep 2017 amounted to EUR 0.4m (EUR 0.3m).
At the Annual General Meeting 2017, it was resolved to pay an ordinary dividend for 2016 of SEK 0.90 per share, corresponding to EUR 0.09 per share and an increase of12.5% from the previous year. Payment to shareholders was made in June 2017.
Shares in East Capital Deep Value Fund were sold for an amount equivalent to EUR 2.0m.
Eastnine AB’s management, Board members and their close relatives and related companies control 25.5 percent of voting rights in the Company.
The Company repurchased a total of 343,214 shares during the period 1 October - 7 November 2017, corresponding to 1.4 percent of the Company's outstanding shares, at an average price of SEK 76,93 per share.
The total number of shares outstanding in Eastnine as of 30 September 2017 amounted to 24,816,033. Adjusted for repurchased shares held in treasury, the number ofshares outstanding amounted to 23,723,020. The weighted average number of shares outstanding for the reporting period was 24,669,783 adjusted for the repurchasedshares.
Eastnine is transforming from a diversified Eastern European investment company, into a Baltic real estate company. The transformation is expected to be finalised by theend of 2020. Eastnine’s dividend policy states that dividend shall correspond to at least 50% of profit from property management. During the build-up phase, the annualdividend shall be at least 2.0% of the net asset value at the preceding year-end.
On 30 September 2017, Eastnine AB had a related party relationship with its subsidiaries, Board members and employees.
On 20 May 2016, the Company launched a buyback program. As announced on 26 September 2017, buybacks may be carried out as long as the Eastnine share trades at adiscount to its most recently reported Net Asset Value (NAV) per share in EUR. This is an alteration of the original program carried out since May 2016, whereby buybackscould not be made at a price higher than 80% of NAV per share. The Company has a mandate to repurchase up to 10 percent of outstanding shares, until the AGM 2018.
The Company repurchased a total of 1,881,443 shares during the period 1 January through 30 September 2017, corresponding to 7.6 percent of the Company's outstandingshares, at an average price of SEK 70,35 per share. After cancellation of shares, the Company has a total of 1,093,013 repurchased shares held in treasury.
The management fee for East Capital Baltic Property Fund II is 1.75 percent and the rebated management fee for East Capital Baltic Property Fund III is 1.25 percent. Thecarried interest for these funds is 20 percent, on the premise that a threshold value increase of 7 and 8 percent, respectively, per year has been achieved.
EASTNINE AB 23 Interim Report JAN-SEP 2017
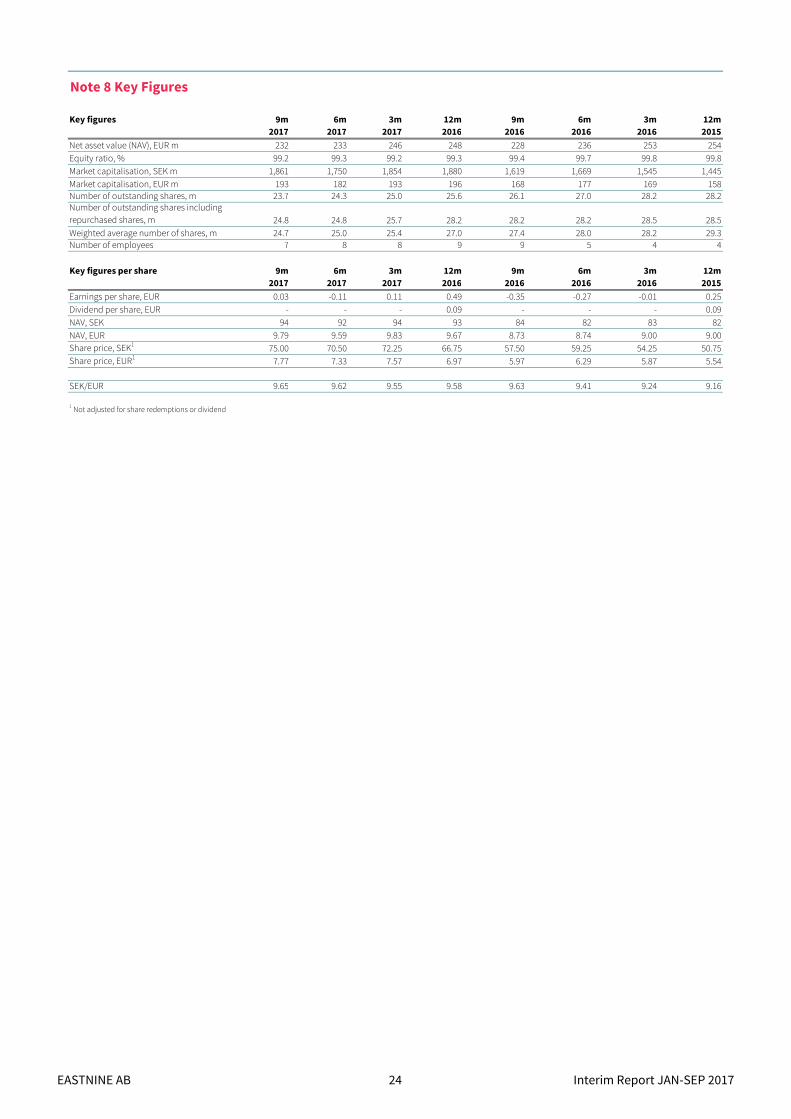
Note 8 Key Figures
Key figures 9m 6m 3m 12m 9m 6m 3m 12m
2017 2017 2017 2016 2016 2016 2016 2015
Net asset value (NAV), EUR m 232 233 246 248 228 236 253 254
Equity ratio, % 99.2 99.3 99.2 99.3 99.4 99.7 99.8 99.8
Market capitalisation, SEK m 1,861 1,750 1,854 1,880 1,619 1,669 1,545 1,445
Market capitalisation, EUR m 193 182 193 196 168 177 169 158Number of outstanding shares, m 23.7 24.3 25.0 25.6 26.1 27.0 28.2 28.2Number of outstanding shares including repurchased shares, m 24.8 24.8 25.7 28.2 28.2 28.2 28.5 28.5
Weighted average number of shares, m 24.7 25.0 25.4 27.0 27.4 28.0 28.2 29.3Number of employees 7 8 8 9 9 5 4 4
Key figures per share 9m 6m 3m 12m 9m 6m 3m 12m
2017 2017 2017 2016 2016 2016 2016 2015
Earnings per share, EUR 0.03 -0.11 0.11 0.49 -0.35 -0.27 -0.01 0.25
Dividend per share, EUR - - - 0.09 - - - 0.09
NAV, SEK 94 92 94 93 84 82 83 82
NAV, EUR 9.79 9.59 9.83 9.67 8.73 8.74 9.00 9.00Share price, SEK1 75.00 70.50 72.25 66.75 57.50 59.25 54.25 50.75Share price, EUR1 7.77 7.33 7.57 6.97 5.97 6.29 5.87 5.54
SEK/EUR 9.65 9.62 9.55 9.58 9.63 9.41 9.24 9.16
1 Not adjusted for share redemptions or dividend
EASTNINE AB 24 Interim Report JAN-SEP 2017
EASTNINE AB 25 Interim Report JAN-SEP 2017
Key Performance Data
Real Estate Direct
EASTNINE AB 26 Interim Report JAN-SEP 2017
0,0
0,5
1,0
1,5
2,0
2,5
2017 2018 2019 2020 2021 2022 2023 2024-
Income-producing properties Developments
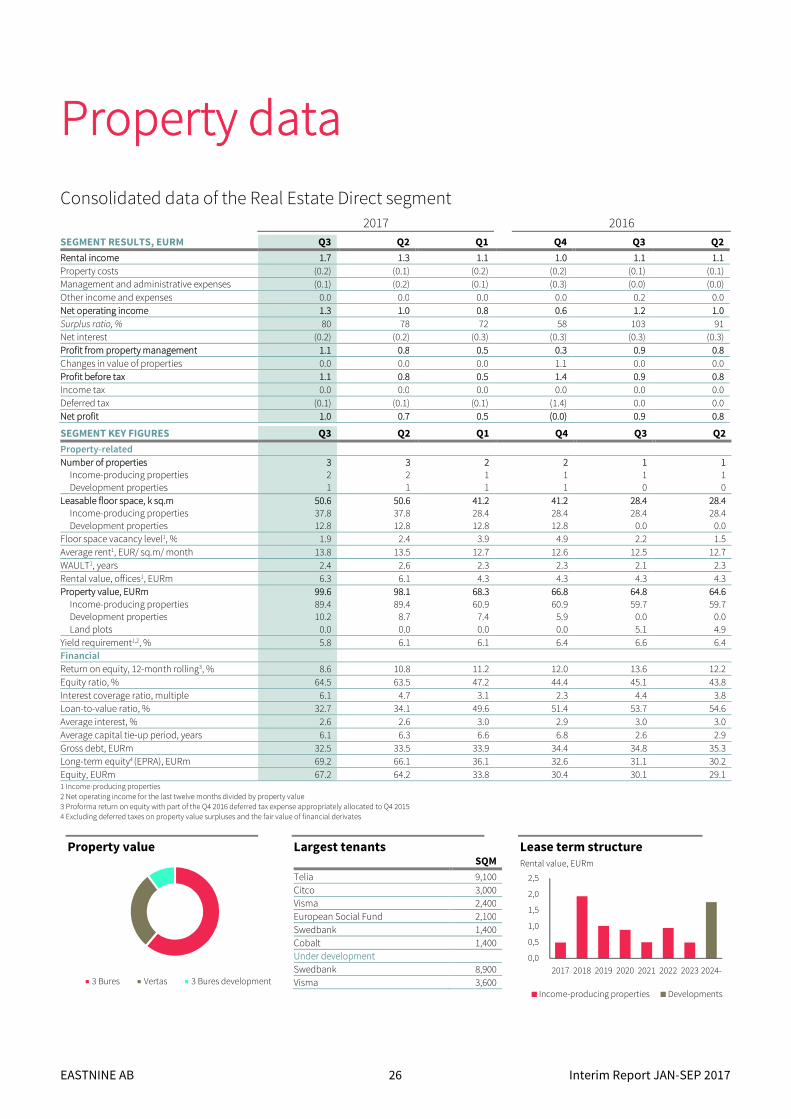
Property data
Consolidated data of the Real Estate Direct segment 2017 2016
SEGMENT RESULTS, EURM Q3 Q2 Q1 Q4 Q3 Q2
Rental income 1.7 1.3 1.1 1.0 1.1 1.1
Property costs (0.2) (0.1) (0.2) (0.2) (0.1) (0.1)
Management and administrative expenses (0.1) (0.2) (0.1) (0.3) (0.0) (0.0)
Other income and expenses 0.0 0.0 0.0 0.0 0.2 0.0
Net operating income 1.3 1.0 0.8 0.6 1.2 1.0
Surplus ratio, % 80 78 72 58 103 91
Net interest (0.2) (0.2) (0.3) (0.3) (0.3) (0.3)
Profit from property management 1.1 0.8 0.5 0.3 0.9 0.8
Changes in value of properties 0.0 0.0 0.0 1.1 0.0 0.0
Profit before tax 1.1 0.8 0.5 1.4 0.9 0.8
Income tax 0.0 0.0 0.0 0.0 0.0 0.0
Deferred tax (0.1) (0.1) (0.1) (1.4) 0.0 0.0
Net profit 1.0 0.7 0.5 (0.0) 0.9 0.8
SEGMENT KEY FIGURES Q3 Q2 Q1 Q4 Q3 Q2
Property-related
Number of properties 3 3 2 2 1 1 Income-producing properties 2 2 1 1 1 1
Development properties 1 1 1 1 0 0
Leasable floor space, k sq.m 50.6 50.6 41.2 41.2 28.4 28.4 Income-producing properties 37.8 37.8 28.4 28.4 28.4 28.4
Development properties 12.8 12.8 12.8 12.8 0.0 0.0
Floor space vacancy level1, % 1.9 2.4 3.9 4.9 2.2 1.5
Average rent1, EUR/ sq.m/ month 13.8 13.5 12.7 12.6 12.5 12.7
WAULT1, years 2.4 2.6 2.3 2.3 2.1 2.3
Rental value, offices1, EURm 6.3 6.1 4.3 4.3 4.3 4.3
Property value, EURm 99.6 98.1 68.3 66.8 64.8 64.6
Income-producing properties 89.4 89.4 60.9 60.9 59.7 59.7 Development properties 10.2 8.7 7.4 5.9 0.0 0.0
Land plots 0.0 0.0 0.0 0.0 5.1 4.9
Yield requirement1,2, % 5.8 6.1 6.1 6.4 6.6 6.4
Financial
Return on equity, 12-month rolling3, % 8.6 10.8 11.2 12.0 13.6 12.2
Equity ratio, % 64.5 63.5 47.2 44.4 45.1 43.8
Interest coverage ratio, multiple 6.1 4.7 3.1 2.3 4.4 3.8
Loan-to-value ratio, % 32.7 34.1 49.6 51.4 53.7 54.6
Average interest, % 2.6 2.6 3.0 2.9 3.0 3.0
Average capital tie-up period, years 6.1 6.3 6.6 6.8 2.6 2.9
Gross debt, EURm 32.5 33.5 33.9 34.4 34.8 35.3
Long-term equity4 (EPRA), EURm 69.2 66.1 36.1 32.6 31.1 30.2
Equity, EURm 67.2 64.2 33.8 30.4 30.1 29.1 1 Income-producing properties
2 Net operating income for the last twelve months divided by property value
3 Proforma return on equity with part of the Q4 2016 deferred tax expense appropriately allocated to Q4 2015
4 Excluding deferred taxes on property value surpluses and the fair value of financial derivates
Property value Largest tenants Lease term structureSQM
Telia 9,100
Citco 3,000
Visma 2,400
European Social Fund 2,100
Swedbank 1,400
Cobalt 1,400
Under development
Swedbank 8,900
Visma 3,600
Rental value, EURm
3 Bures Vertas 3 Bures development
EASTNINE AB 27 Interim Report JAN-SEP 2017
Definitions
Property related Key Figures
Average interest Interest expense divided by average
interest-bearing debt for the period.
Average capital tie-up period Average maturity of gross debt at end of
period.
Average rent, EUR per sq.m Rental income in relation to average
leasable floor space.
Floor space vacancy level Unlet floor space in relation to total floor
space.
Gross debt Total interest-bearing debt at end of
period.
Leasable floor space Total floor space available for leasing.
Long-term equity (EPRA) Reported equity including deferred taxes
on property value surpluses and excluding
the fair value of financial derivates.
Net operating income Total revenues less property costs.
Profit from property management Operating net, administration costs and
net financial items.
Rental income Charged rents, rent surcharges and rental
guarantees less rent discount.
Rental value Rental income and estimated market rent
for vacant units.
Surplus ratio Operating net in relation to total revenues.
WAULT Average remaining lease term to maturity
of the portfolio, weighted according to
contracted rental income (Weighted
average unexpired lease term).
Financial Key Figures
Debt/ equity ratio Interest-bearing net debt in relation to
equity.
EBIT Operating profit after amortisation of
goodwill/ acquisition-related surplus value
and depreciation/ amortisation of non-
current assets (Earnings before Interest
and Tax).
EBITDA Profit before depreciation, amortisation
and impairment (Earnings before Interest,
Tax, Depreciation and Amortisation).
Equity ratio Total equity as a percentage of total assets.
Fair value See market value.
Interest coverage ratio Operating profit excluding financial
expenses, in relation to financial expenses.
IRR (internal rate of return) Annual average return on the invested
amount calculated from the original
investment, final selling amount and other
capital flows, considering when in time
these payments were made to or from
Eastnine.
Loan-to-value ratio Interest-bearing liabilities less cash in
relation to fair value of the holdings.
Market value The value of which a holding is assumed to
be able to be sold for at a given time. Listed
holdings at the bid quote on the balance
sheet date. To establish the market value
of unlisted holdings, various valuation
methods are used as applicable.
NAV The value of the Company’s net assets, i.e.
total assets less net debt.
NAV discountThe difference between net asset value
(NAV) and market capitalisation in relation
to NAV. If market cap is lower than NAV the
shares are traded with a NAV discount; if
market cap is higher, they are traded with a
premium.
Net debt Interest-bearing liabilities including
pension liabilities, less cash, short-term
investments and interest-bearing
receivables.
Operating expenses Expenses directly related to Eastnine’s
business.
Return on equity Profit/ loss for the year as a percentage of
average shareholders’ equity.
Share-related Key Figures
Average number of outstanding
shares Registered number of shares less shares
held by the Company.
Earnings per share Net profit for the period attributable to
equity holders of the Parent Company,
divided by average number of shares
outstanding during the year.
Equity per share Shareholders’ equity, attributable to equity
holders of the Parent Company, divided by
number of outstanding shares at the end of
the period.
NAV per share Net asset value per share in relation to the
total number of registered shares on the
balance sheet date (excluding repurchased
shares).
Share buy-back Purchasing of own shares on the stock
market. Swedish companies have the
option to own up to 10 percent of their
own outstanding shares conditioned AGM
approval.
EASTNINE AB 28 Interim Report JAN-SEP 2017
Contact information Kestutis Sasnauskas, CEO, +46 8 505 977 00
Lena Krauss, CFO, +46 8 505 885 94
Eastnine ABKungsgatan 35, Box 7214
SE-103 88 Stockholm, Sweden
Tel: +46 8 505 977 00
www.eastnine.com
Financial information and calendar Year-end report Q4 2017 – 16 February 2018
Subscribe to financial reports and press releases directly to your e-mail
on: www.eastnine.com or by sending an email to [email protected].
The information in this interim report is the information which Eastnine
AB is required to disclose under the EU Market Abuse Regulation and
the Securities Markets Act. It was released for publication at 08.00 a.m.
on 9 November 2017