Embed Size (px)
Citation preview
78
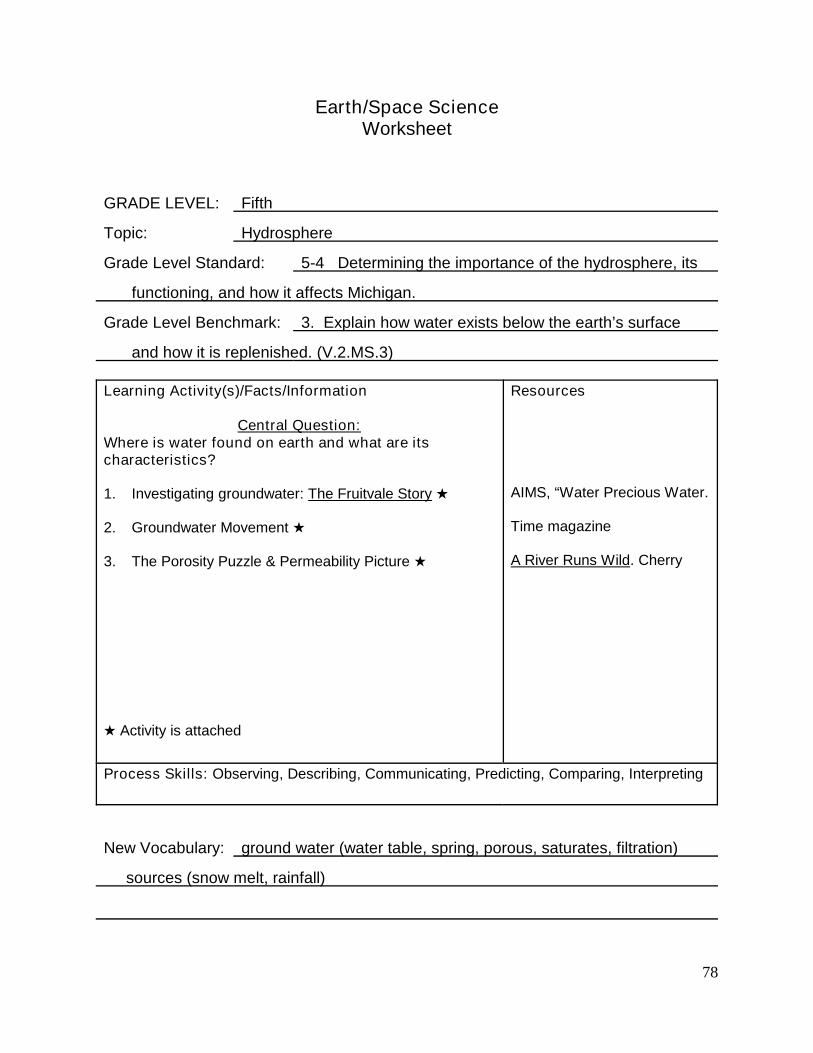
Earth/Space ScienceWorksheet
GRADE LEVEL: Fifth
Topic: Hydrosphere
Grade Level Standard: 5-4 Determining the importance of the hydrosphere, its
functioning, and how it affects Michigan.
Grade Level Benchmark: 3. Explain how water exists below the earth’s surface
and how it is replenished. (V.2.MS.3)
Learning Activity(s)/Facts/Information
Central Question:Where is water found on earth and what are itscharacteristics?
1. Investigating groundwater: The Fruitvale Story
2. Groundwater Movement
3. The Porosity Puzzle & Permeability Picture
Activity is attached
Resources
AIMS, “Water Precious Water.
Time magazine
A River Runs Wild. Cherry
Process Skills: Observing, Describing, Communicating, Predicting, Comparing, Interpreting
New Vocabulary: ground water (water table, spring, porous, saturates, filtration)
sources (snow melt, rainfall)
79
GROUNDWATERInvestigating Groundwater: The Fruitvale Story
OVERVIEW:Students observe differences in the movement of water through individual earthmaterials, such as gravel, sand, and clay, and also in combinations of thesematerials. They then discuss how these observations can be used to predictbehavior and movement of groundwater and compare general characteristics ofaquifers and aquitards.
TIME:Takes 1 ½ - 2 class periods
PurposeThe students will:1. Develop skills in accurately describing experimental results.2. Understand factors affecting groundwater movement through various earth
materials.3. Develop an operational understanding of porosity, permeability, aquifer, and
aquitard.
MATERIALS:For the students: Student sheet 1.1 Solids and Liquids Student sheet 1.2 Groundwater Movement
For the teacher: Clay, approximately 30-35 cm³ Gravel, approximately 30-35 cm³ Sand, approximately 30-35 cm³ Stopwatch or watch with sweep second hand Food coloring (optional) Four 25 cm x 3.75 cm plastic tubes Water Blackline master of student sheet 1.1 Solids and Liquids, and 1.2 Groundwater
Movement
GETTING READY:Make sure the clay, gravel, and sand are dry and ready for use. Label the tubes A-D. Fill one tube with clay, making sure to tamp it down firmly so that there are no airpockets. Repeat for the gravel and sand. Tube D will be used during the activity.Duplicate copies of student worksheets 1.1 and 1.2.
80
THE ACTIVITY
1. IntroductionTell the students they will soon begin to investigate the possible contamination of anunderground water supply. The underground water supplies a town with its drinking water.Before beginning this exploration, they will find it useful to learn more about how watermoves through different earth materials.
Distribute student sheet 1.1. Ask whether anyone knows how water gets undergroundto become groundwater. (Some precipitation does not immediately evaporate or get carriedoff in streams; instead it travels down below the surface of the earth to becomegroundwater.) Explain that groundwater will be explored in this activity.
Challenge the class to think of examples of liquids moving through solids they haveseen in the last week as they respond to question 1 on the student sheet. List someexamples on the overhead. Some possible responses include syrup through pancakes,muddy water through clothes, milk through cereal, rain through sand, and soy saucethrough rice. Then ask the class to answer question 2. When they finish, discuss whatfactors determine whether a liquid might move quickly or slowly through a particular solid.Write some of their responses on the overhead.
Tell the students they will observe liquid flow through earth materials and then discusstheir observations.
2. Comparing tubesDisplay the three filled tubes in front of the class. Make sure that everyone can see theearth materials in the tubes. Identify the contents of each tube, and ask students to recordthe materials in the data table in student sheet 1.1.
Select two tubes and hold them up for the students to see. Ask them to decide whichtube will permit water to pass through more quickly. Discuss any difference in opinion andencourage students to describe the reasons for their choices. Continue this procedure withother pairs of tubes until all combinations have been used. Use students choices andreasons to introduce the concepts of permeability and porosity. Porosity refers to theamount of open space in a material, while permeability refers to how well the pores areconnected.
As a result of the comparisons of the pairs of tubes, ask students to rank thethree materials in the data table on student sheet 1.1 according to their prediction of thespeed at which water will move through them. Use a scale of 1 to 3, where 1 is the fastest.
3. Predicting transmission timesTell the group that you are going to pour equal amounts of water into each tube and
time how long it takes the water to reach the bottom. You may wish to use several drops offood coloring in the water to make the water movement more visible at a distance. The foodcoloring rinses with water, so the earth materials can be reused.
Ask students to predict the length of time it will take for the water to reach the bottomof the tube. Instruct them to record their predictions in their data table. Then pour ameasured amount (30-35 ml is sufficient) of water quickly into the top of one of the tubes. Itis suggested that the materials be tested in order of decreasing permeability. Note theactual elapsed time for the water to move to the bottom. Ask the students whether theynoticed if the speed of the water changes as it moves through each of the earth materials.
81
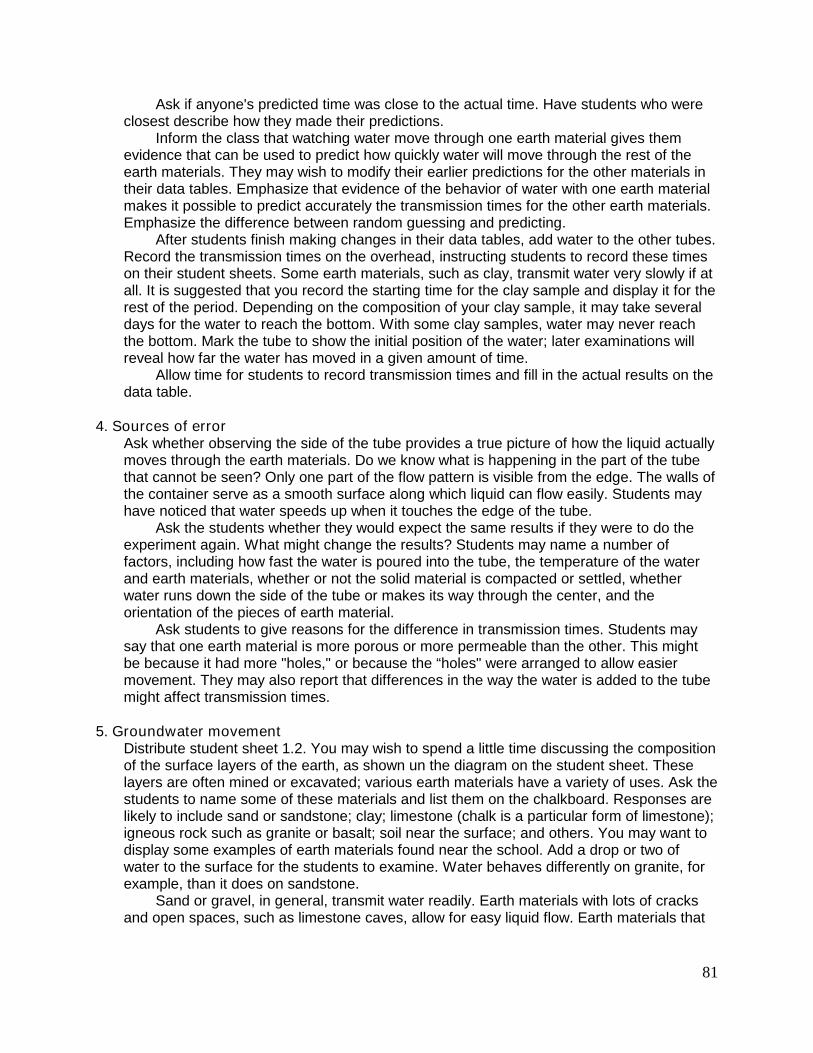
Ask if anyone's predicted time was close to the actual time. Have students who wereclosest describe how they made their predictions.
Inform the class that watching water move through one earth material gives themevidence that can be used to predict how quickly water will move through the rest of theearth materials. They may wish to modify their earlier predictions for the other materials intheir data tables. Emphasize that evidence of the behavior of water with one earth materialmakes it possible to predict accurately the transmission times for the other earth materials.Emphasize the difference between random guessing and predicting.
After students finish making changes in their data tables, add water to the other tubes.Record the transmission times on the overhead, instructing students to record these timeson their student sheets. Some earth materials, such as clay, transmit water very slowly if atall. It is suggested that you record the starting time for the clay sample and display it for therest of the period. Depending on the composition of your clay sample, it may take severaldays for the water to reach the bottom. With some clay samples, water may never reachthe bottom. Mark the tube to show the initial position of the water; later examinations willreveal how far the water has moved in a given amount of time.
Allow time for students to record transmission times and fill in the actual results on thedata table.
4. Sources of errorAsk whether observing the side of the tube provides a true picture of how the liquid actuallymoves through the earth materials. Do we know what is happening in the part of the tubethat cannot be seen? Only one part of the flow pattern is visible from the edge. The walls ofthe container serve as a smooth surface along which liquid can flow easily. Students mayhave noticed that water speeds up when it touches the edge of the tube.
Ask the students whether they would expect the same results if they were to do theexperiment again. What might change the results? Students may name a number offactors, including how fast the water is poured into the tube, the temperature of the waterand earth materials, whether or not the solid material is compacted or settled, whetherwater runs down the side of the tube or makes its way through the center, and theorientation of the pieces of earth material.
Ask students to give reasons for the difference in transmission times. Students maysay that one earth material is more porous or more permeable than the other. This mightbe because it had more "holes," or because the “holes" were arranged to allow easiermovement. They may also report that differences in the way the water is added to the tubemight affect transmission times.
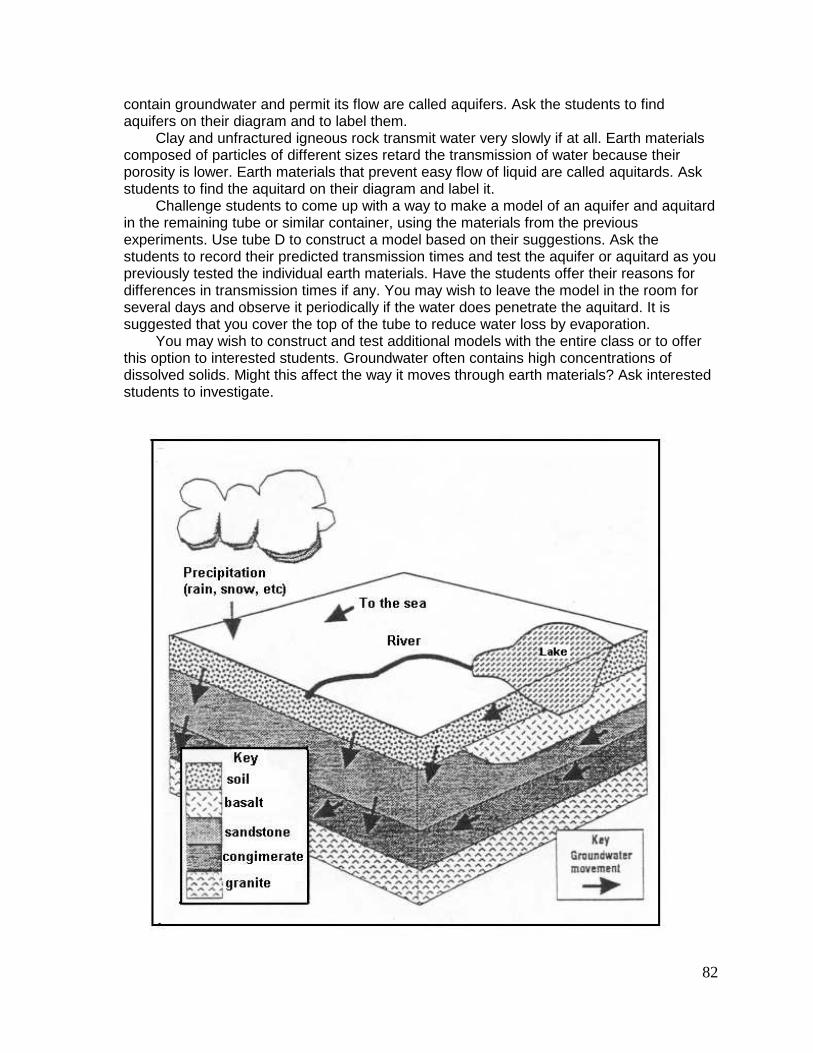
5. Groundwater movementDistribute student sheet 1.2. You may wish to spend a little time discussing the compositionof the surface layers of the earth, as shown un the diagram on the student sheet. Theselayers are often mined or excavated; various earth materials have a variety of uses. Ask thestudents to name some of these materials and list them on the chalkboard. Responses arelikely to include sand or sandstone; clay; limestone (chalk is a particular form of limestone);igneous rock such as granite or basalt; soil near the surface; and others. You may want todisplay some examples of earth materials found near the school. Add a drop or two ofwater to the surface for the students to examine. Water behaves differently on granite, forexample, than it does on sandstone.
Sand or gravel, in general, transmit water readily. Earth materials with lots of cracksand open spaces, such as limestone caves, allow for easy liquid flow. Earth materials that
82
contain groundwater and permit its flow are called aquifers. Ask the students to findaquifers on their diagram and to label them.
Clay and unfractured igneous rock transmit water very slowly if at all. Earth materialscomposed of particles of different sizes retard the transmission of water because theirporosity is lower. Earth materials that prevent easy flow of liquid are called aquitards. Askstudents to find the aquitard on their diagram and label it.
Challenge students to come up with a way to make a model of an aquifer and aquitardin the remaining tube or similar container, using the materials from the previousexperiments. Use tube D to construct a model based on their suggestions. Ask thestudents to record their predicted transmission times and test the aquifer or aquitard as youpreviously tested the individual earth materials. Have the students offer their reasons fordifferences in transmission times if any. You may wish to leave the model in the room forseveral days and observe it periodically if the water does penetrate the aquitard. It issuggested that you cover the top of the tube to reduce water loss by evaporation.
You may wish to construct and test additional models with the entire class or to offerthis option to interested students. Groundwater often contains high concentrations ofdissolved solids. Might this affect the way it moves through earth materials? Ask interestedstudents to investigate.
83
6. ConclusionAsk students to use the clues on the groundwater diagram to describe ways that
groundwater and surface water (oceans, lakes, streams) are related. Groundwater canbecome surface water by bubbling to the surface in the form of springs or artesian wells, orsurface water can penetrate surface soil layers into an aquifer, becoming groundwater .
Ask the student to now consider ways that groundwater might become contaminated.Students responses may include flows from contaminated rivers, lakes, and estuaries; fromaccidental leaks and spills; from precipitation; from agricultural sources such as sprayingand irrigation; and from wells of various types.
Review how the activities and diagrams model the movement of the groundwaterthrough different layers and materials in the earth. Groundwater that had beencontaminated moves in exactly the same way. Remind students that they will apply theirknowledge of groundwater movement to investigating the Fruitvale problem later in themodule.
84
Name __________________________________ Date:______________________
STUDENT SHEET 1.2
Groundwater Movement
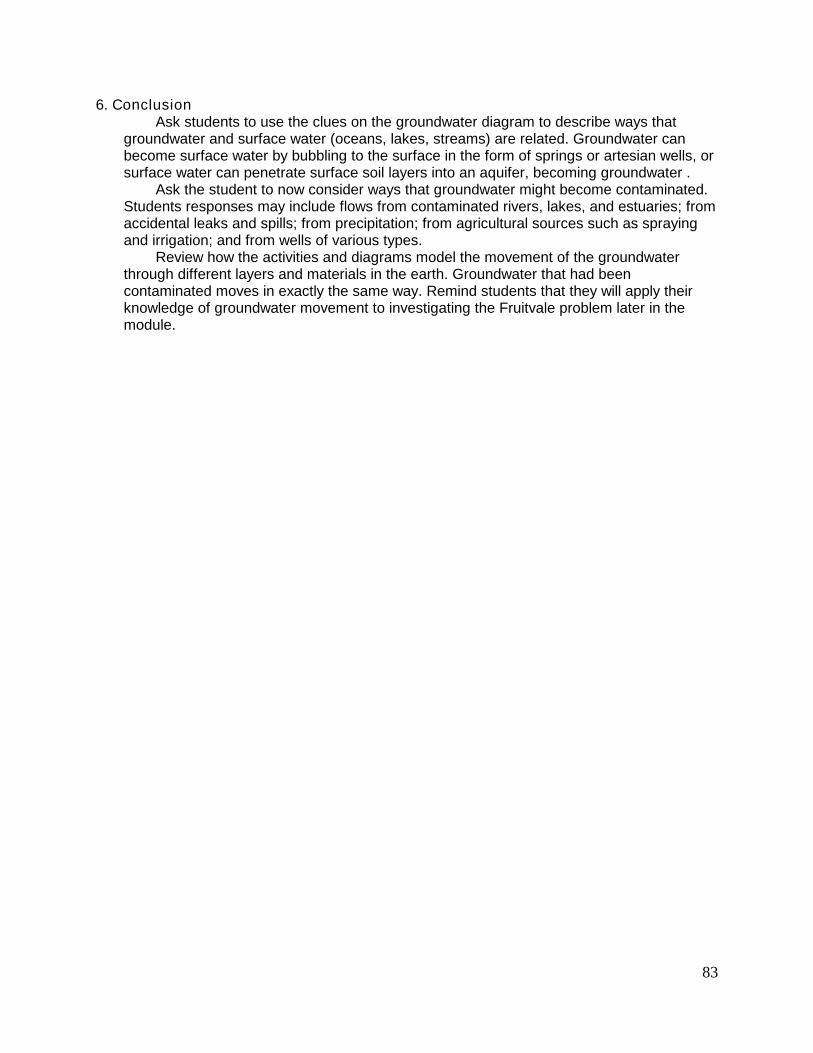
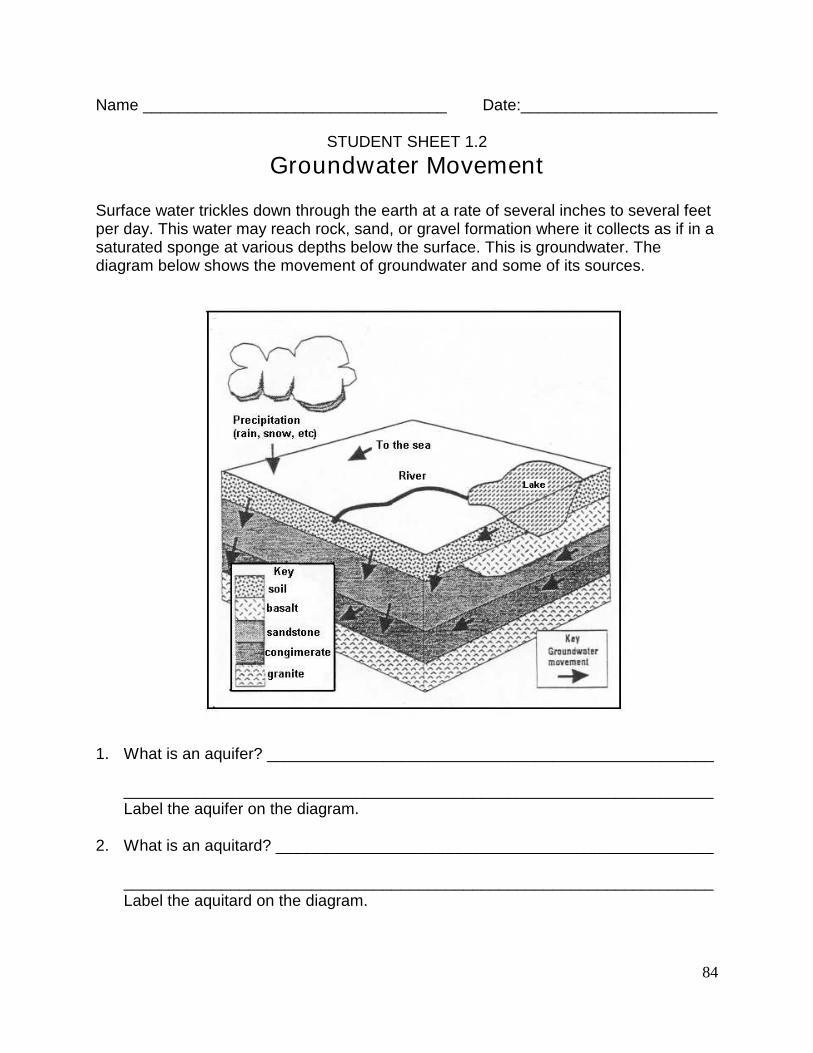
Surface water trickles down through the earth at a rate of several inches to several feetper day. This water may reach rock, sand, or gravel formation where it collects as if in asaturated sponge at various depths below the surface. This is groundwater. Thediagram below shows the movement of groundwater and some of its sources.
1. What is an aquifer? __________________________________________________
__________________________________________________________________Label the aquifer on the diagram.
2. What is an aquitard? _________________________________________________
__________________________________________________________________Label the aquitard on the diagram.
85
THE POROSITY PUZZLE ANDPERMEABILITY PICTURE
SOURCE:Michigan DNRAdapted from Groundwater, Michigan's Hidden Resource
BACKGROUND:All soil contains pores. Porosity, the ratio of open pore space to the total volume of a soilsample, is one of the factors that determines how much water a particular soil can holdand how fast water can move through that soil.
The sizes of the particles in the soil determine the size and number of pores in soil.The size of soil particles also affects the ease of plowing the soil, what crops can begrown, the efficiency of certain fertilizers, and the ability of soil to store water.
The pebbles and sand demonstrate that the pore space is larger in coarse soils. Inactual coarse soils, these spaces may be partially filled with smaller particles, producing aless porous soil. When small particles fill the large pore spaces, there is less "emptyspace" remaining for water to fill. However, soil containing a mixture of large and smallparticles retains its water more efficiently than coarse soils, because the small particlesprovide more surface area for the water to adhere to. Coarse soils dry out much fasterthan do fine soils. You may have noticed, for example, how quickly beach sand dries aftera rainfall.
Soil scientists classify soils according to their particle size. Clay particles are thesmallest (less than 0.004 mm in diameter), followed by silt (up to 0.06 mm in diameter),then sand (up to 2.0 mm). Particles larger than sand are classified as gravel, and range insize from very fine pebbles to large boulders.
PREPARATION:You can buy sand for this activity at most home and garden supply stores. Any reasonablyclean, fine sand may be used. The type of sand sold in large bags for use in children'ssand boxes works very well
Dry the sand by spreading it on a cookie sheet and placing it in an oven set at 180°C(350°F) for 15-30 minutes. Stir it several times while it is heating. Sand dried in thismanner may be stored in plastic bags for several weeks.
In this activity you should make frequent references to the "empty space" between soilparticles. Remind your students that this empty space contains air. The water poured intothe empty space is not filling a vacuum—it is displacing the air that surrounds the particlesof sand or the marbles.
This activity will help participants visualize the concepts of porosity and permeability andhow they impact the movement of groundwater.
MATERIALS: for each group of three people1. 1 cup each of sand, gravel, and clay (fine grain–clumping).2. A one cup measuring device, some duct tape, and a coffee stir stick.3. Dish pan labeled "aquifer."4. Three 16 oz, or larger, clear pop bottles.
86
5. A piece of paper, a watch with a second hand, and a pen or pencil.6. *For teacher - an electric drill with 1/8" bit.
DIRECTIONS:1. Drill one 1/8 inch diameter hole in the bottom of the clear plastic pop bottles. Put a
single piece of duct tape on the bottom of the pop bottle so that it covers all of theholes.
2. Explain that porosity is the percentage of air space in a particular material and thatpermeability is the measurement of a material's ability to allow water to pass throughit. Divide everyone into groups of three, give each group 3 containers and have everygroup measure out 1 cup of each material (sand, clay, gravel) and put them into theirthree plastic containers. (Note: to save time, have the containers already filled with acup of the different materials.)
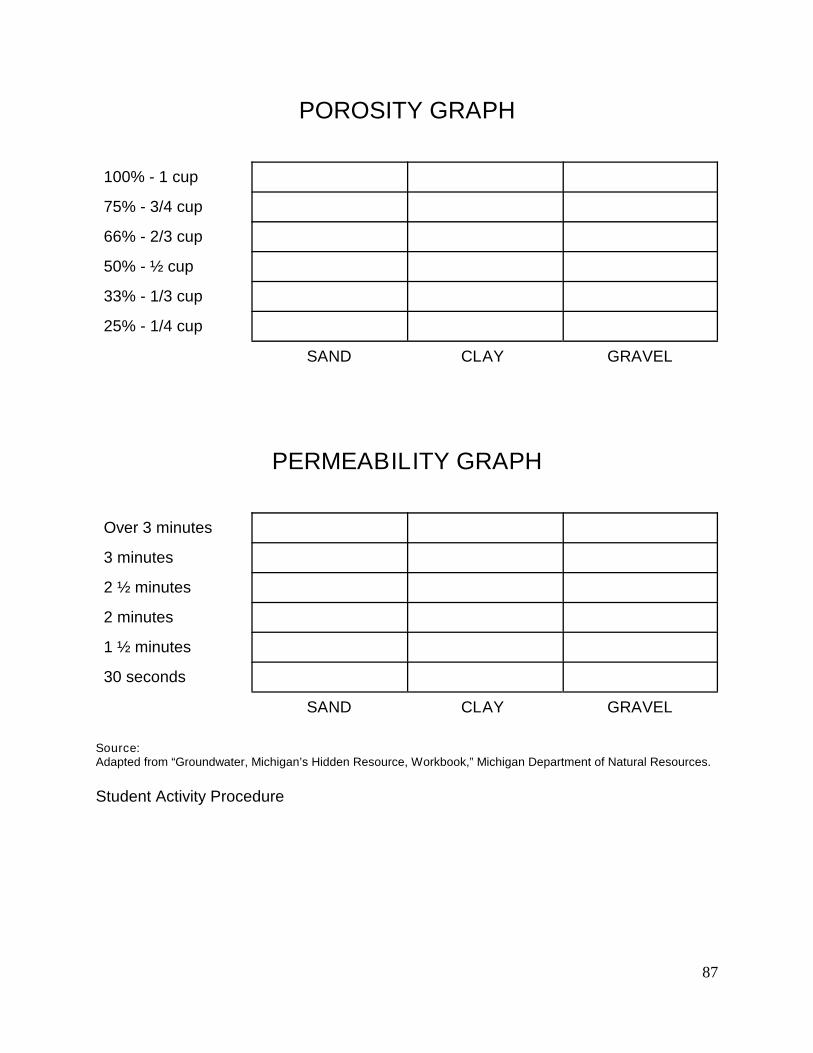
3. Give each group a copy of the porosity and permeability graphs found on the nextpage, and before they pour water into the cups, have them guess how much watereach of the different materials will hold by placing an "X" at the appropriate portionabove the name of each material.
4. Beginning with exactly one cup of water in the group's measuring device, slowly pourthe water over the first material until the level of the water is at the top of the material.If necessary, use a stir stick to poke holes in the clay to help the water get to thebottom of the container.
5. Determine the volume of water that was poured into the material by subtracting theamount of water remaining in the measuring device from the 1 cup of water that youstarted with. Mark this amount on the graph with the "0" above the appropriatematerial. Read to the left to get the porosity in percent. Repeat steps 4 and 5 for theother two materials. Discuss the results with the group. How close were theirguesses? Any surprises?
6. Next, tell the groups that they are going to look at the "Permeability Picture". Using thepermeability graph have the groups guess at the permeability rates for each of thematerials by marking on the graph how much time they think it will take for 1 cup ofwater to move through the material.
7. Beginning with exactly 1 cup of water, pour the entire cup on top of one of thematerials. Now, holding the cup over the aquifer (dish pan) carefully tear the tape offthe bottom of the cup and time how long it takes for the cup of water to move throughthe material. Stop timing when the water goes below the top of the material. Mark theactual times on the graph next to your guesses.
8. Discuss the results. How were the guesses? Which material allowed the cup of waterto move through it in the shortest amount of time (most permeable)? Leastpermeable? Explain that clay has the highest porosity because it has many tiny pores,but it is the least permeable because the pore spaces are not connected very well, sowater has a difficult time moving through it.
87
POROSITY GRAPH
100% - 1 cup
75% - 3/4 cup
66% - 2/3 cup
50% - ½ cup
33% - 1/3 cup
25% - 1/4 cup
SAND CLAY GRAVEL
PERMEABILITY GRAPH
Over 3 minutes
3 minutes
2 ½ minutes
2 minutes
1 ½ minutes
30 seconds
SAND CLAY GRAVEL
Source:Adapted from “Groundwater, Michigan’s Hidden Resource, Workbook,” Michigan Department of Natural Resources.
Student Activity Procedure
88
Name ______________________________ Date:__________ Period: _________
POROSITY and PERMEABILITY
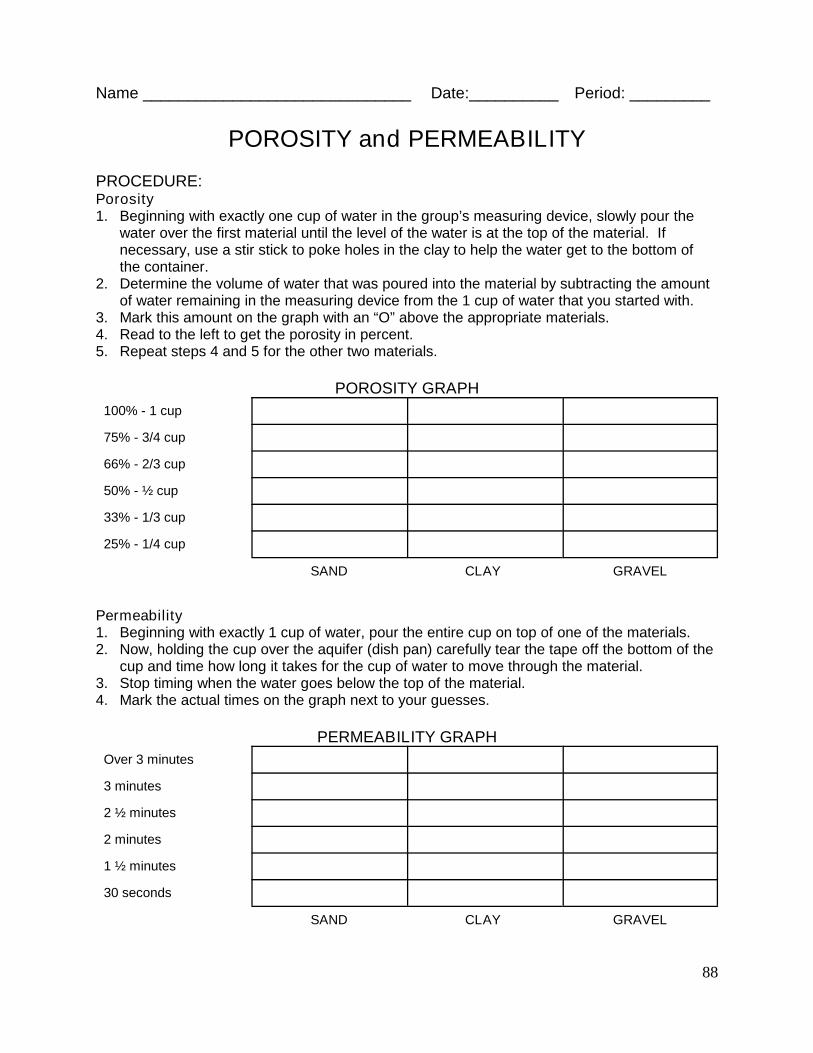
PROCEDURE:Porosity1. Beginning with exactly one cup of water in the group’s measuring device, slowly pour the
water over the first material until the level of the water is at the top of the material. Ifnecessary, use a stir stick to poke holes in the clay to help the water get to the bottom ofthe container.
2. Determine the volume of water that was poured into the material by subtracting the amountof water remaining in the measuring device from the 1 cup of water that you started with.
3. Mark this amount on the graph with an “O” above the appropriate materials.4. Read to the left to get the porosity in percent.5. Repeat steps 4 and 5 for the other two materials.
POROSITY GRAPH
100% - 1 cup
75% - 3/4 cup
66% - 2/3 cup
50% - ½ cup
33% - 1/3 cup
25% - 1/4 cup
SAND CLAY GRAVEL
Permeability1. Beginning with exactly 1 cup of water, pour the entire cup on top of one of the materials.2. Now, holding the cup over the aquifer (dish pan) carefully tear the tape off the bottom of the
cup and time how long it takes for the cup of water to move through the material.3. Stop timing when the water goes below the top of the material.4. Mark the actual times on the graph next to your guesses.
PERMEABILITY GRAPH
Over 3 minutes
3 minutes
2 ½ minutes
2 minutes
1 ½ minutes
30 seconds
SAND CLAY GRAVEL
89
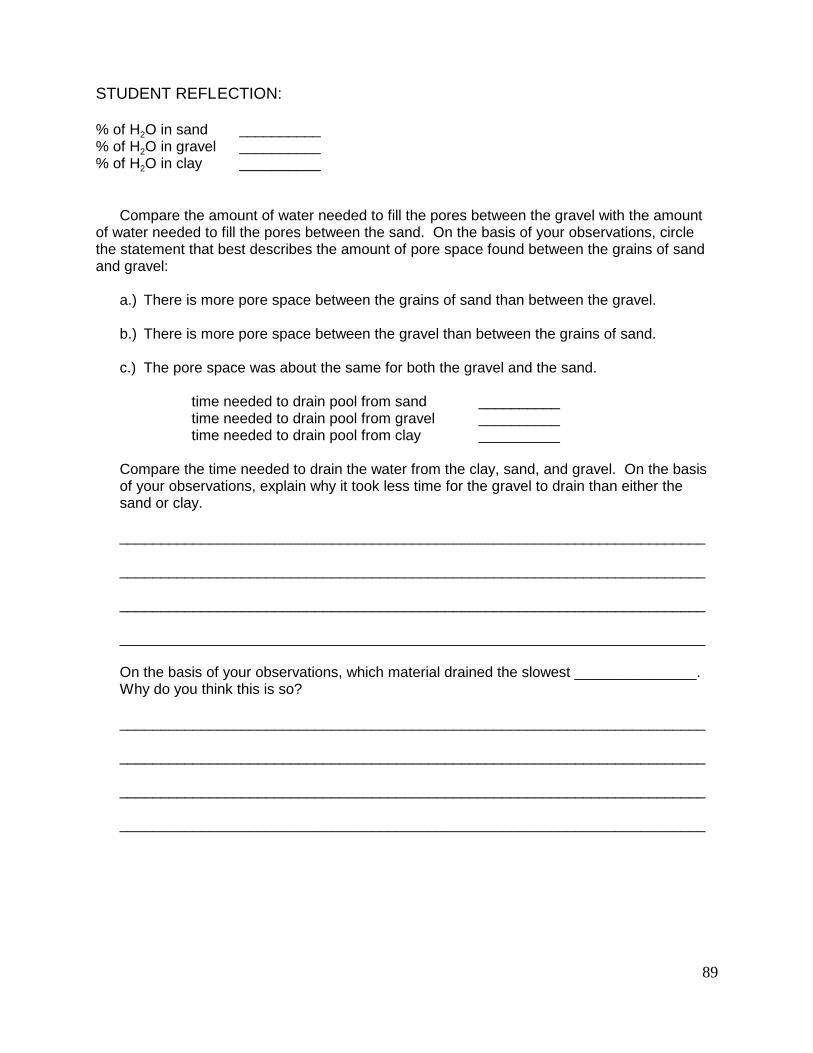
STUDENT REFLECTION:
% of H2O in sand __________% of H2O in gravel __________% of H2O in clay __________
Compare the amount of water needed to fill the pores between the gravel with the amountof water needed to fill the pores between the sand. On the basis of your observations, circlethe statement that best describes the amount of pore space found between the grains of sandand gravel:
a.) There is more pore space between the grains of sand than between the gravel.
b.) There is more pore space between the gravel than between the grains of sand.
c.) The pore space was about the same for both the gravel and the sand.
time needed to drain pool from sand __________time needed to drain pool from gravel __________time needed to drain pool from clay __________
Compare the time needed to drain the water from the clay, sand, and gravel. On the basisof your observations, explain why it took less time for the gravel to drain than either thesand or clay.
________________________________________________________________________
________________________________________________________________________
________________________________________________________________________
________________________________________________________________________
On the basis of your observations, which material drained the slowest _______________.Why do you think this is so?
________________________________________________________________________
________________________________________________________________________
________________________________________________________________________
________________________________________________________________________
90
AssessmentGrade 5
HYDROSPHERE
Classroom Assessment Example SCI.V.2.MS.3
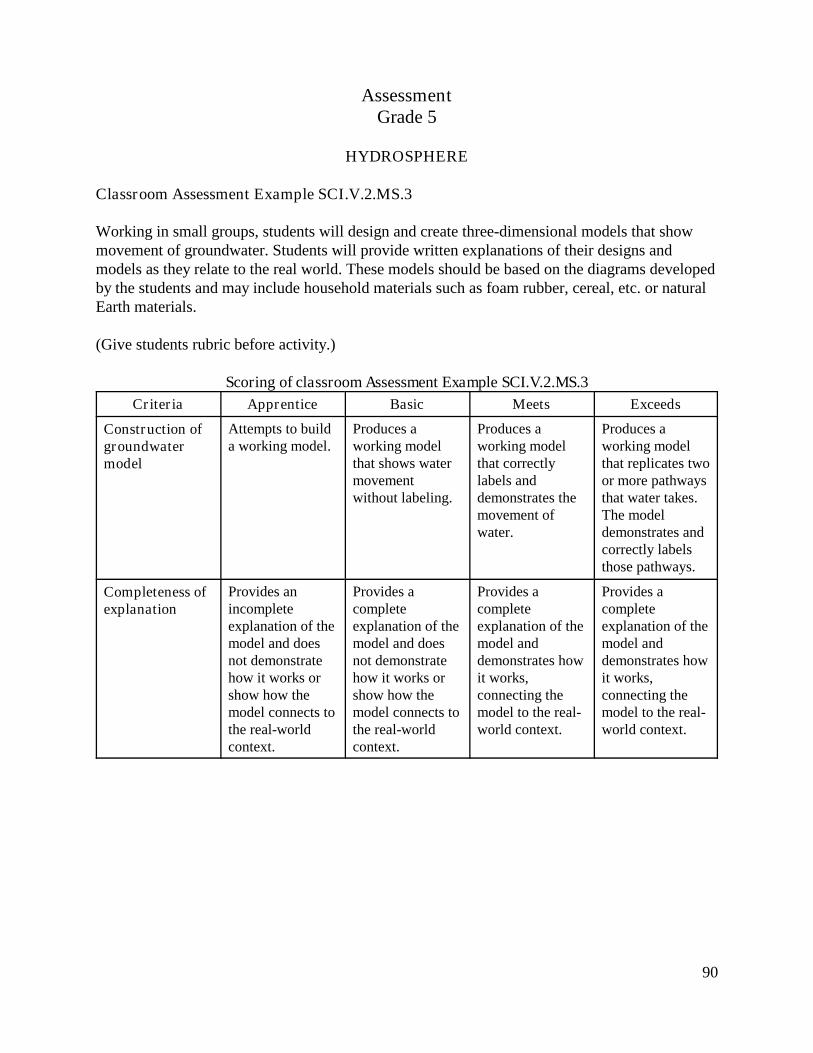
Working in small groups, students will design and create three-dimensional models that showmovement of groundwater. Students will provide written explanations of their designs andmodels as they relate to the real world. These models should be based on the diagrams developedby the students and may include household materials such as foam rubber, cereal, etc. or naturalEarth materials.
(Give students rubric before activity.)
Scoring of classroom Assessment Example SCI.V.2.MS.3
Criteria Apprentice Basic Meets Exceeds
Construction ofgroundwatermodel
Attempts to builda working model.
Produces aworking modelthat shows watermovementwithout labeling.
Produces aworking modelthat correctlylabels anddemonstrates themovement ofwater.
Produces aworking modelthat replicates twoor more pathwaysthat water takes.The modeldemonstrates andcorrectly labelsthose pathways.
Completeness ofexplanation
Provides anincompleteexplanation of themodel and doesnot demonstratehow it works orshow how themodel connects tothe real-worldcontext.
Provides acompleteexplanation of themodel and doesnot demonstratehow it works orshow how themodel connects tothe real-worldcontext.
Provides acompleteexplanation of themodel anddemonstrates howit works,connecting themodel to the real-world context.
Provides acompleteexplanation of themodel anddemonstrates howit works,connecting themodel to the real-world context.
91
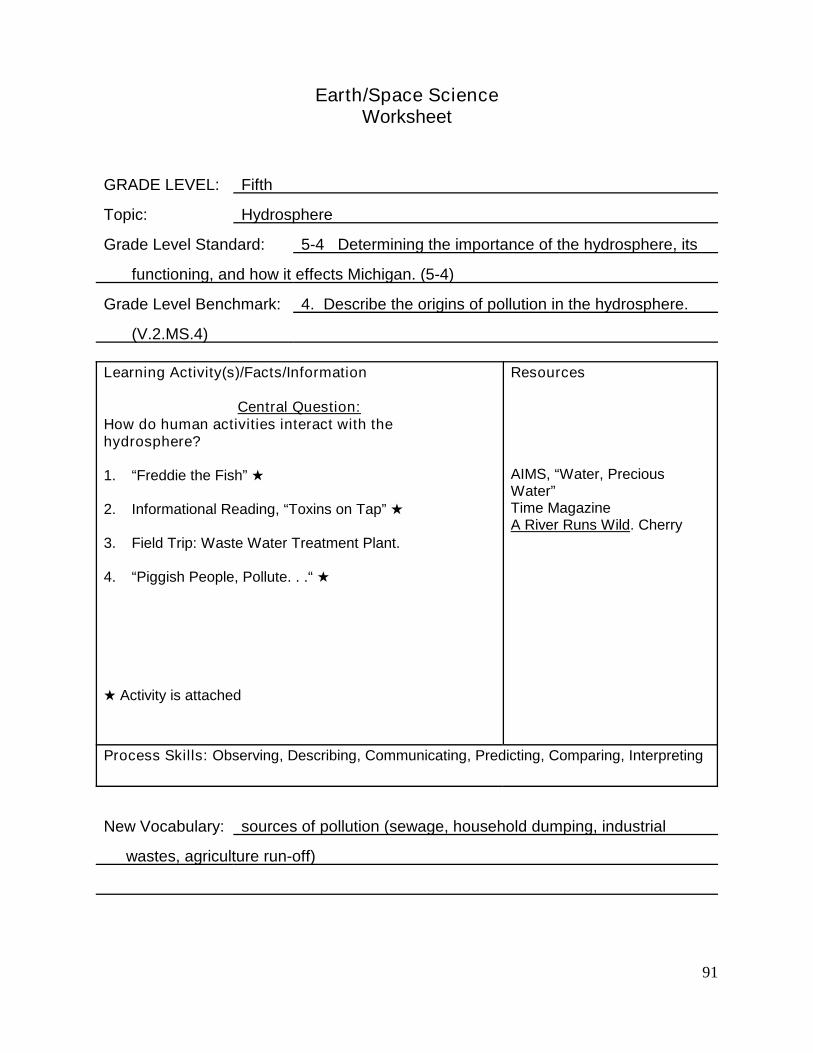
Earth/Space ScienceWorksheet
GRADE LEVEL: Fifth
Topic: Hydrosphere
Grade Level Standard: 5-4 Determining the importance of the hydrosphere, its
functioning, and how it effects Michigan. (5-4)
Grade Level Benchmark: 4. Describe the origins of pollution in the hydrosphere.
(V.2.MS.4)
Learning Activity(s)/Facts/Information
Central Question:How do human activities interact with thehydrosphere?
1. “Freddie the Fish”
2. Informational Reading, “Toxins on Tap”
3. Field Trip: Waste Water Treatment Plant.
4. “Piggish People, Pollute. . .“
Activity is attached
Resources
AIMS, “Water, PreciousWater”Time MagazineA River Runs Wild. Cherry
Process Skills: Observing, Describing, Communicating, Predicting, Comparing, Interpreting
New Vocabulary: sources of pollution (sewage, household dumping, industrial
wastes, agriculture run-off)
92
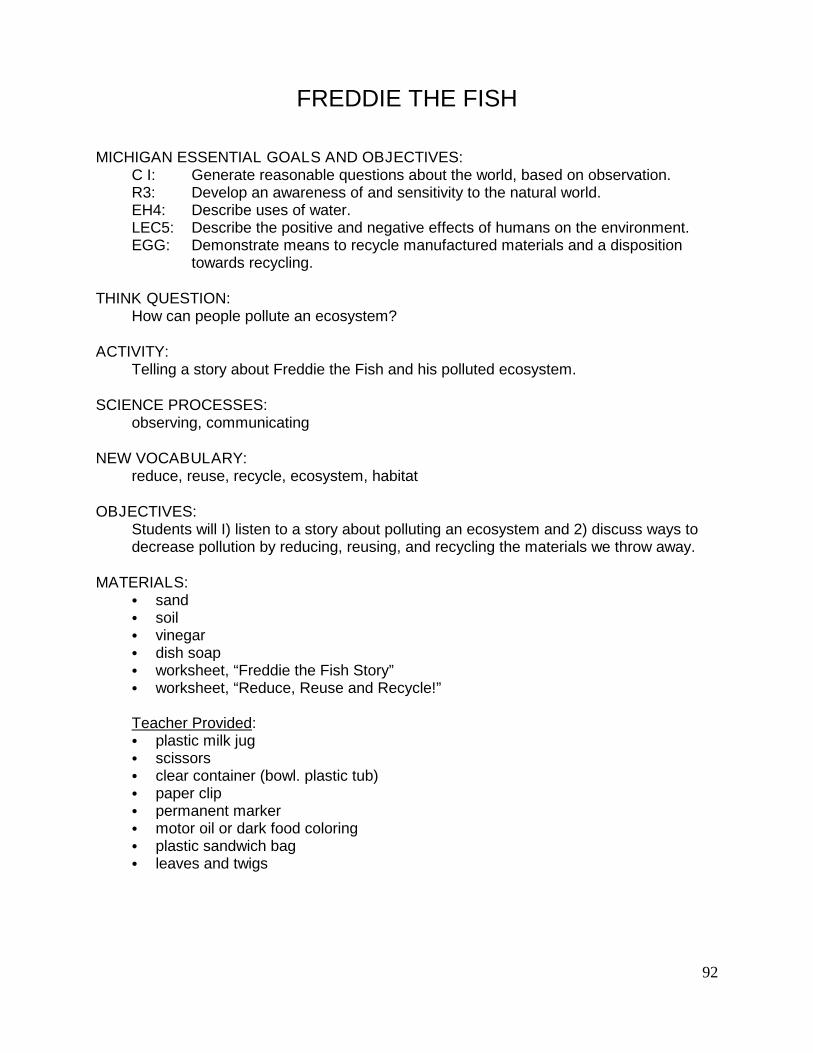
FREDDIE THE FISH
MICHIGAN ESSENTIAL GOALS AND OBJECTIVES:C I: Generate reasonable questions about the world, based on observation.R3: Develop an awareness of and sensitivity to the natural world.EH4: Describe uses of water.LEC5: Describe the positive and negative effects of humans on the environment.EGG: Demonstrate means to recycle manufactured materials and a disposition
towards recycling.
THINK QUESTION:How can people pollute an ecosystem?
ACTIVITY:Telling a story about Freddie the Fish and his polluted ecosystem.
SCIENCE PROCESSES:observing, communicating
NEW VOCABULARY:reduce, reuse, recycle, ecosystem, habitat
OBJECTIVES:Students will I) listen to a story about polluting an ecosystem and 2) discuss ways todecrease pollution by reducing, reusing, and recycling the materials we throw away.
MATERIALS: sand soil vinegar dish soap worksheet, “Freddie the Fish Story” worksheet, “Reduce, Reuse and Recycle!”
Teacher Provided: plastic milk jug scissors clear container (bowl. plastic tub) paper clip permanent marker motor oil or dark food coloring plastic sandwich bag leaves and twigs
93
TIME:20 minutes
PROCEDURE:Prior Teacher Preparation:1. Before the lesson, make Freddie, by cutting out a small fish (3" x 3") from the milk
carton.2. Poke a small hole in the top of the fish.3. Open the paper clip and thread one end through the hole. Use the paper clip to
move Freddie in the water .4. Color Freddie with a permanent marker.5. Find a clear container and fill it 3/4 full with water .6. Collect pollution items listed above: leaves & twigs, motor oil or food coloring,
plastic sandwich bag, sand, soil, vinegar, and dish soap.
Anticipatory Set:1. Ask: Where can fish live (what type of ecosystems)? Brainstorm their ideas.
Discuss how some fish live in salt water and some in fresh water .2. Explain that they will be hearing a story about Freddie the Fish. Freddie must have
fresh water to survive.3. Read the story (or make up your own if you are more creative that I am!) about
Freddie.4. As you read the story, show what happens to Freddie's ecosystem as he travels
down the river.
Input:1. Discuss how the students feel about the pollution in Freddie's river.2. Ask: Did all the pollution have to end up in the river? What are some ways we
could help keep Freddie's water clean?3. Ask: What is recycling? What things can be recycled? What can people do to
reduce the amount of trash they make? Are there some things that can be reusedinstead of thrown out? Discuss their ideas.
4. Read and discuss the worksheet. Reduce, Reuse and Recycle.
DISCUSSION:1. What materials polluted Freddie's river ecosystem?2. What are other ways people pollute ecosystems? (air pollution, water pollution, soil
pollution, litter, etc.)3. What could be done with the trash instead of throwing it into the water?4. How does trash harm bodies of water?5. How does trash harm other ecosystems (lakes, forests, oceans, ponds, farms,
etc.)?6. Why is it important to reduce, reuse, and recycle our garbage?
94
CLOSURE:Have the students brainstorm a list of ways they can reduce the amount of garbagethat entered Freddie's ecosystem. Discuss ways of recycling, reusing, and reducingthe garbage. Ask: What items can be recycled? What items can be reused? What canwe do to reduce the amount of trash we make? Make a chart of their ideas.
NOTES FOR REVISION:
95
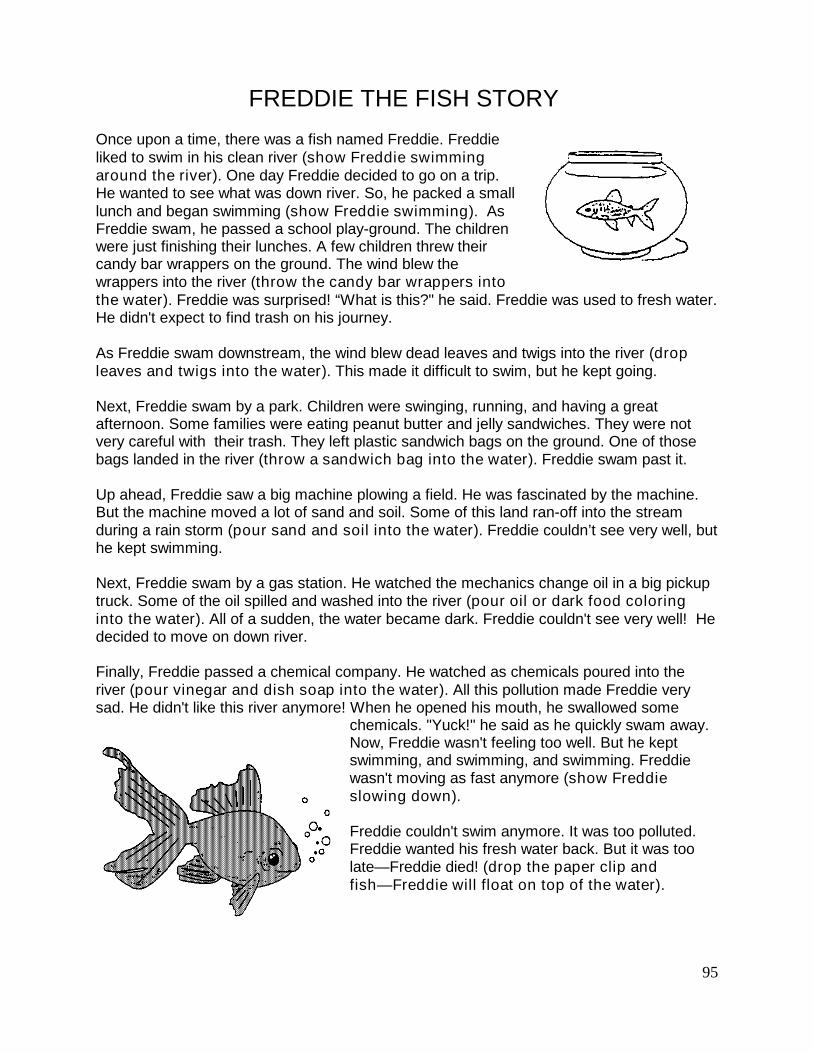
FREDDIE THE FISH STORY
Once upon a time, there was a fish named Freddie. Freddieliked to swim in his clean river (show Freddie swimmingaround the river). One day Freddie decided to go on a trip.He wanted to see what was down river. So, he packed a smalllunch and began swimming (show Freddie swimming). AsFreddie swam, he passed a school play-ground. The childrenwere just finishing their lunches. A few children threw theircandy bar wrappers on the ground. The wind blew thewrappers into the river (throw the candy bar wrappers intothe water). Freddie was surprised! “What is this?" he said. Freddie was used to fresh water.He didn't expect to find trash on his journey.
As Freddie swam downstream, the wind blew dead leaves and twigs into the river (dropleaves and twigs into the water). This made it difficult to swim, but he kept going.
Next, Freddie swam by a park. Children were swinging, running, and having a greatafternoon. Some families were eating peanut butter and jelly sandwiches. They were notvery careful with their trash. They left plastic sandwich bags on the ground. One of thosebags landed in the river (throw a sandwich bag into the water). Freddie swam past it.
Up ahead, Freddie saw a big machine plowing a field. He was fascinated by the machine.But the machine moved a lot of sand and soil. Some of this land ran-off into the streamduring a rain storm (pour sand and soil into the water). Freddie couldn’t see very well, buthe kept swimming.
Next, Freddie swam by a gas station. He watched the mechanics change oil in a big pickuptruck. Some of the oil spilled and washed into the river (pour oil or dark food coloringinto the water). All of a sudden, the water became dark. Freddie couldn't see very well! Hedecided to move on down river.
Finally, Freddie passed a chemical company. He watched as chemicals poured into theriver (pour vinegar and dish soap into the water). All this pollution made Freddie verysad. He didn't like this river anymore! When he opened his mouth, he swallowed some
chemicals. "Yuck!" he said as he quickly swam away.Now, Freddie wasn't feeling too well. But he keptswimming, and swimming, and swimming. Freddiewasn't moving as fast anymore (show Freddieslowing down).
Freddie couldn't swim anymore. It was too polluted.Freddie wanted his fresh water back. But it was toolate—Freddie died! (drop the paper clip andfish—Freddie will float on top of the water).
96
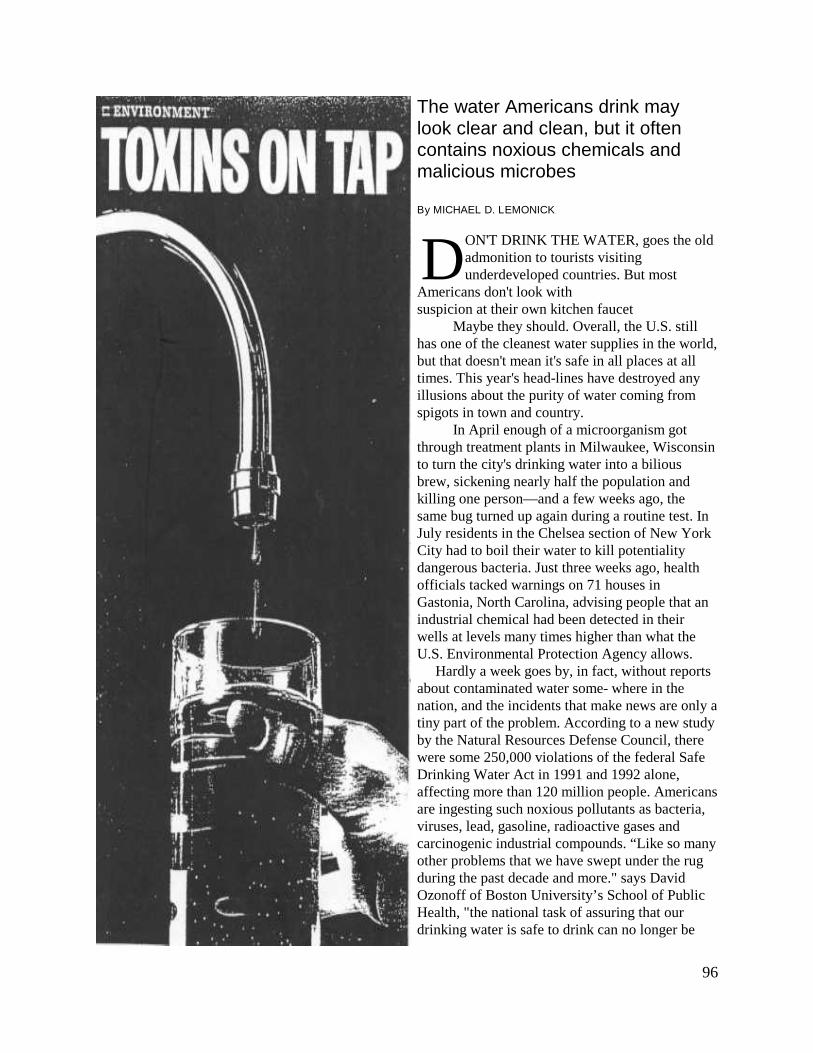
The water Americans drink maylook clear and clean, but it oftencontains noxious chemicals andmalicious microbes
By MICHAEL D. LEMONICK
DON'T DRINK THE WATER, goes the oldadmonition to tourists visitingunderdeveloped countries. But most
Americans don't look withsuspicion at their own kitchen faucet
Maybe they should. Overall, the U.S. stillhas one of the cleanest water supplies in the world,but that doesn't mean it's safe in all places at alltimes. This year's head-lines have destroyed anyillusions about the purity of water coming fromspigots in town and country.
In April enough of a microorganism gotthrough treatment plants in Milwaukee, Wisconsinto turn the city's drinking water into a biliousbrew, sickening nearly half the population andkilling one person—and a few weeks ago, thesame bug turned up again during a routine test. InJuly residents in the Chelsea section of New YorkCity had to boil their water to kill potentialitydangerous bacteria. Just three weeks ago, healthofficials tacked warnings on 71 houses inGastonia, North Carolina, advising people that anindustrial chemical had been detected in theirwells at levels many times higher than what theU.S. Environmental Protection Agency allows.
Hardly a week goes by, in fact, without reportsabout contaminated water some- where in thenation, and the incidents that make news are only atiny part of the problem. According to a new studyby the Natural Resources Defense Council, therewere some 250,000 violations of the federal SafeDrinking Water Act in 1991 and 1992 alone,affecting more than 120 million people. Americansare ingesting such noxious pollutants as bacteria,viruses, lead, gasoline, radioactive gases andcarcinogenic industrial compounds. “Like so manyother problems that we have swept under the rugduring the past decade and more." says DavidOzonoff of Boston University’s School of PublicHealth, "the national task of assuring that ourdrinking water is safe to drink can no longer be
97
The 10 Worst StatesPercentage of the population servedby water systems cited in 1992 forviolating he Safe Drinking Water Act
Arizona 26%New Jersey 22Idaho 21New Hampshire 20Vermont 18Oklahoma 17Washington 15Louisiana 14Illinois 13South Carolina 12
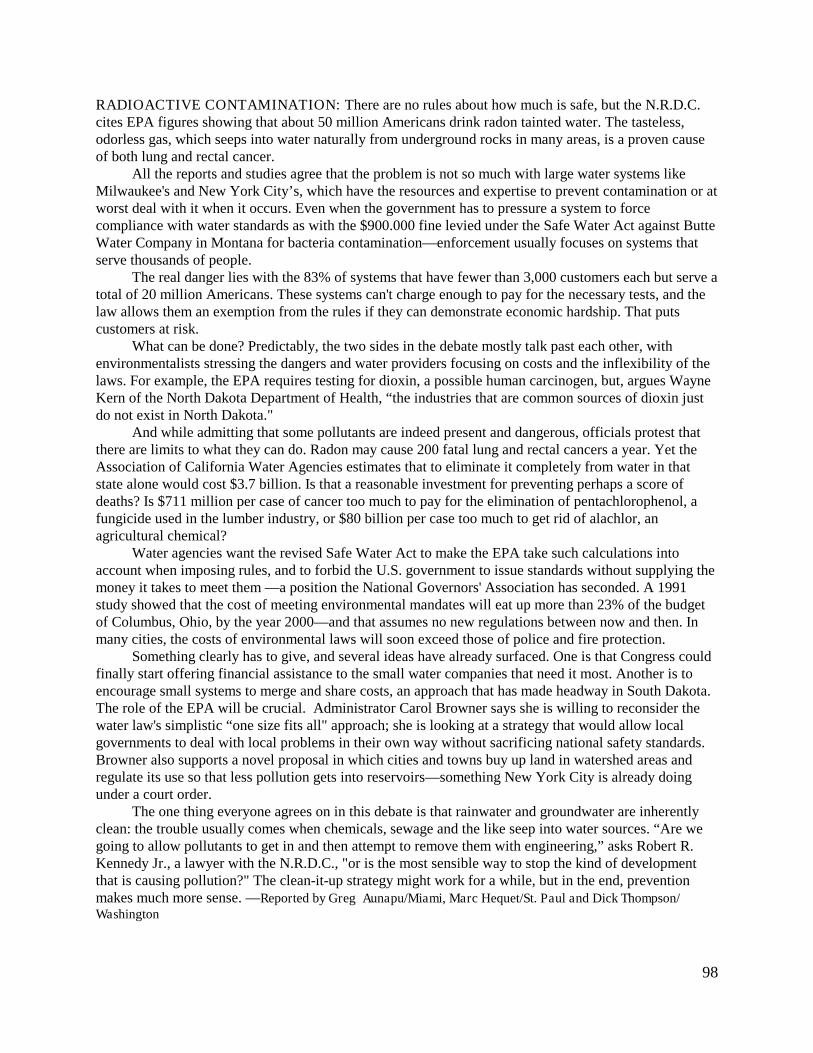
Laid low by a nasty microorganism last spring, Milwaukee promptly spent$1 million to upgrade treatment plants like this one, which filters waterthrough sand.
postponed."Fortunately, it doesn’t have to be. The Senate has
begun hearings that will ultimately lead to the re-authorization, and possible strengthening, of the 1974 SafeDrinking Water Act. But the debate will be long anddifficult. Environmental groups such as the N.R.D.C. wantstricter enforcement of the existing rules, along with newor tougher standards on contaminants like radioactiveradon gas and arsenic. Lined up on the other side are stateand local governments and water utilities, which insistthey don't have enough money to comply with the law as itis, let alone additional rules. The regulations should berelaxed, they say, not strengthened.
It's true that the N.R.D.C. report is far from perfect.Many of the violations it cites involve nothing more thanlate filing of field reports, and its complaint that only 1
percent of violations result in “final formal enforcement actions" is misleading. Says James Cleland ofthe Michigan public service department: “In our state, we address 99% of the violations, but we don'taddress them all with formal enforcement. Sometimes all it takes is a telephone call."
Yet it isn't just the environmentalists who see a problem. A survey by the federal Centers forDisease Control shows that in 1989 and 1990, 4,288 people in 16 states got sick, and four died, frombacteria and viruses in their water. And last spring the nonpartisan General Accounting Office found,among other things, that many water systems do not test for all the pollutants the EPA considersdangerous, and don't evaluate distribution systems, operators, or inspectors. Based on these and otherstudies, the N.R.D.C. has identified several especially worrisome hazards:PATHOGENS: These include bacteria, viruses, and protozoa such as the cryptosporidium that struckMilwaukee. These sicken 900,000 people a year, says the N.R.D.C. report and kill perhaps 900, usuallythose with weak immune systems (the very young and very old, AIDS sufferers, and organ-transplantpatients).TRIHALOMETHANES: Ironically, these compounds are by-products of the chlorine used to killwater-borne pathogens. The N.R.D.C. estimates that these chemicals may cause more than 10,000bladder and rectal cancers a year.ARSENIC: The dangers of low-level exposure are still beingdebated, but some 350,000 peoplemay be taking in more than theEPA allows.LEAD: The risks have been knownfor years, but plenty of lead stillgets into drinking water, sincetesting for the heavy metal is notuniversal. About 560,000 childrenhave unacceptably high levels oflead in their blood, which couldlead to neurological problems. TheEPA also calculates that 680,000cases of high blood pressure inadult men could be prevented byreducing lead in drinking water.
98
RADIOACTIVE CONTAMINATION: There are no rules about how much is safe, but the N.R.D.C.cites EPA figures showing that about 50 million Americans drink radon tainted water. The tasteless,odorless gas, which seeps into water naturally from underground rocks in many areas, is a proven causeof both lung and rectal cancer.
All the reports and studies agree that the problem is not so much with large water systems likeMilwaukee's and New York City’s, which have the resources and expertise to prevent contamination or atworst deal with it when it occurs. Even when the government has to pressure a system to forcecompliance with water standards as with the $900.000 fine levied under the Safe Water Act against ButteWater Company in Montana for bacteria contamination—enforcement usually focuses on systems thatserve thousands of people.
The real danger lies with the 83% of systems that have fewer than 3,000 customers each but serve atotal of 20 million Americans. These systems can't charge enough to pay for the necessary tests, and thelaw allows them an exemption from the rules if they can demonstrate economic hardship. That putscustomers at risk.
What can be done? Predictably, the two sides in the debate mostly talk past each other, withenvironmentalists stressing the dangers and water providers focusing on costs and the inflexibility of thelaws. For example, the EPA requires testing for dioxin, a possible human carcinogen, but, argues WayneKern of the North Dakota Department of Health, “the industries that are common sources of dioxin justdo not exist in North Dakota."
And while admitting that some pollutants are indeed present and dangerous, officials protest thatthere are limits to what they can do. Radon may cause 200 fatal lung and rectal cancers a year. Yet theAssociation of California Water Agencies estimates that to eliminate it completely from water in thatstate alone would cost $3.7 billion. Is that a reasonable investment for preventing perhaps a score ofdeaths? Is $711 million per case of cancer too much to pay for the elimination of pentachlorophenol, afungicide used in the lumber industry, or $80 billion per case too much to get rid of alachlor, anagricultural chemical?
Water agencies want the revised Safe Water Act to make the EPA take such calculations intoaccount when imposing rules, and to forbid the U.S. government to issue standards without supplying themoney it takes to meet them —a position the National Governors' Association has seconded. A 1991study showed that the cost of meeting environmental mandates will eat up more than 23% of the budgetof Columbus, Ohio, by the year 2000—and that assumes no new regulations between now and then. Inmany cities, the costs of environmental laws will soon exceed those of police and fire protection.
Something clearly has to give, and several ideas have already surfaced. One is that Congress couldfinally start offering financial assistance to the small water companies that need it most. Another is toencourage small systems to merge and share costs, an approach that has made headway in South Dakota.The role of the EPA will be crucial. Administrator Carol Browner says she is willing to reconsider thewater law's simplistic “one size fits all" approach; she is looking at a strategy that would allow localgovernments to deal with local problems in their own way without sacrificing national safety standards.Browner also supports a novel proposal in which cities and towns buy up land in watershed areas andregulate its use so that less pollution gets into reservoirs—something New York City is already doingunder a court order.
The one thing everyone agrees on in this debate is that rainwater and groundwater are inherentlyclean: the trouble usually comes when chemicals, sewage and the like seep into water sources. “Are wegoing to allow pollutants to get in and then attempt to remove them with engineering,” asks Robert R.Kennedy Jr., a lawyer with the N.R.D.C., "or is the most sensible way to stop the kind of developmentthat is causing pollution?" The clean-it-up strategy might work for a while, but in the end, preventionmakes much more sense. —Reported by Greg Aunapu/Miami, Marc Hequet/St. Paul and Dick Thompson/Washington
99
How to Protect Yourself
IS YOUR WATER SAFE? The company ormunicipal authority that supplies it is required byfederal law to give you an analysis and disclose
any violation of health standards. But even if you cantrust the company, the report won’t tell you whathappens to the water in the dank recesses of your ownplumbing system. The only way to know preciselywhat’s coming out of your tap is to have your watertested. The EPA’s Safe Drinking Water Hotline (800-426-4791) offers names of testing laboratories inindividual states. The hot line can also answertechnical and health questions such as “How muchcryptosporidium is too much?”
Special mail-order labs can help as well. Theysend you empty bottles and instructions; you shipback samples and receive a detailed analysis. Twoparticularly reliable labs are Suburban Water TestingLaboratories (800-433-6595) and National TestingLaboratories (800-458-3330). Prices range from $25for a simple test for lead to $178 for the works,including screening for bacteria, nitrate, lead andPCB levels.
What if the lab raises the red flag? Let’s takelead as an example, since it’s one of the mostcommon problems. Too much lead (more than 15parts per billion) tends to show up in older, turn-of-the-century houses with lead pipes and in homeswhere lead solder has been used to join and repairplumbing. Lead solder was banned in 1986, but it istill around in older pipes.
The longer water sits in the system, the morelead it absorbs, So let the water run for at least twominutes, until it is cold to the touch, before using it.That way you’re using water from the main linesunder the street, which do no contain lead.(Apartment dwellers can’t do this if their building’splumbing system is huge.) Don’t cook with watercoming from the hot water tap; it draws more leadfrom pipes than cold water does.
If you’re dissatisfied with your municipalwater supply, you can always buy bottled water. Butit is not always free of contaminants either (evenPerrier had that little problem with the chemicalbenzene). Look for a seal of approval from NSFInternational, an Ann Arbor, Michigan, company thatcertifies bottled water as safe. Unfortunately, NSFdoes not analyze all brands.
Another option is to buy one of the manyfilters or other water-purifying devices on the market.Be sure to choose one that specifically removed thetoxins turning up in your water. Carbon filters, forexample, are good at purging organic compounds,
such as pesticides and solvents, but they will notremove minerals or most heavy metals. And one ofthe more elaborate devices, a distiller, is excellent attaking away heavy metals but is not effective againstchloroform and benzene.
Before investing in a treatment device, whichranges from $30 for a simple filter to $850 for areverse-osmosis system, check that it is certifiedeffective by NSF. Above all, remember that homedevices need plenty of maintenance. If they are notcleaned or their filters are not replaced regularly, theyput back into your water the very pollutants theyremoved and they wind up a health hazardthemselves.
By Janice M. Horowitz
100
PIGGISH PEOPLE POLLUTE . . .WATER CLEAN-UP MACHINES
(1-2 days)
MICHIGAN ESSENTIAL GOALS AND OBJECTIVES:EH4: Describe uses of water.LEC5: Describe positive and negative effects of humans on the environment.R3: Develop an awareness of and sensitively to the natural world.
THINK QUESTION:How can fresh water become polluted?
BACKGROUND:When the dye is first put into the water, it is visible. This is because the moleculesof red color are compacted (close together). As water is added, the colormolecules continue to spread evenly. As they spread, the color becomes less andless visible.
This is the same thing that happens to many pollutants that enter our waterways.The substances may be visible where they are dumped, but soon spread out sothat they are no longer noticeable. This process is called diffusion. Even thoughthe pollutant cannot be seen, it does not mean that it is gone. These pollutants canaffect our drinking water and plant/animal life. Often, the pollutants have negativeaffects on the environment many miles from the original dumping site.
There are two hydrogen atoms and one oxygen atom in every water molecule.Water molecules are held together so that they draw substances in to fill thespaces. Therefore, water can dissolve many things. Unfortunately, this propertymakes water an easy target for pollution. There is no absolutely pure waterexisting in nature. All water contains natural pollutants.
The definition of water pollution is contamination of water. Water pollution isbroken down into four categories.
Sediment: It is the largest water pollutant that exists. It is a mineral or organicsolid material that has washed or blown from the land into lakes, rivers, orstreams. Sources include: construction, row-cropping, livestock operations,logging, flooding, and urban runoff.
Nutrients: A certain amount of nutrients are necessary to maintain healthy water.However, an excessive amount can be damaging. Sources include: sewage andseptic runoff, livestock waste, fertilizer runoff, detergents, and industrial wastes.
101
Bacteria: Bacteria play an important role in the decomposition of organic materialsin water. Too much bacteria will compete with other water organisms for oxygen.If the oxygen supply is used up, plants, fish, and insects will be killed off. Sourcesinclude: runoff, industrial wastes, paper mills, and poorly managed landfills.Toxins: Safe chemicals can become toxic if improperly disposed of. The negativeeffects of toxins can be delayed for many years before resulting in sickness,disease, or death. Sources include: industry, agriculture, and household cleaners.
ACTIVITY:Discovering how pollutants travel undetected in our environment and designing animaginary water clean-up machine.
SCIENCE PROCESSES:experimenting, observing, predicting, recognizing, relationships
NEW VOCABULARY:garbage, habitat, destruction, land management, resource management
OBJECTIVES:Students will 1) discuss why clean water is necessary for survival, 2) observe ademonstration to see how polluted water can be invisible, and 3) design a waterclean-up machine that can be used to protect our water supply.
MATERIALS: measuring cup red food coloring
Teacher Provided: large, clear container bowl salad oil
TIME:30-45 minutes each day
PROCEDURE:Anticipatory Set:1. Ask: Why do we need clean water?2. Have you seen polluted water? What kinds of pollution did you see? How
would pollution affect animals? plants?3. How do water supplies become polluted?
102
Input:1. Gather the students so that they can see the clear container. Note: It takes a
lot of water to dilute the food coloring.2. Ask: Can you always see pollution? Can you always tell if water is polluted?3. Explain that the experiment that the class will conduct today will show how
pollution can get into our drinking sources without our knowledge.4. Pour ½ cup water into a gallon jug.5. Add and stir in one drop of red food coloring.6. Add one cup of water at a time to the container until the red color disappears.7. Explain that pollution is not always visible and animal life in the stream is
affected by pollutants many miles from the source.8. Can we get rid of all pollution? Why or why not?
CLOSURE:Have the students design a water clean-up machine. Fill a bowl with water. Addpollutants, such as salad oil and/or garbage to the water. Explain that studentsneed to design a machine (that can be built from common household items) thatwill clean up the water. For example, students might create a machine using apaper towel or cotton ball to absorb the oil. Students should first draw a diagram oftheir machine on paper. They should describe how their machine works, label theparts, and give it a title. Next, have them bring the materials from home to buildtheir machine in class. Have them try to use their machine to clean up the water.Use the grading rubric to assess the activity.
EXTENSION:Look for newspaper articles concerning pollution. Assign as homework: cut outarticles from newspapers or magazines that discuss water pollution. Bring thearticles to class to be shared. Then glue the articles into the student journals.
103
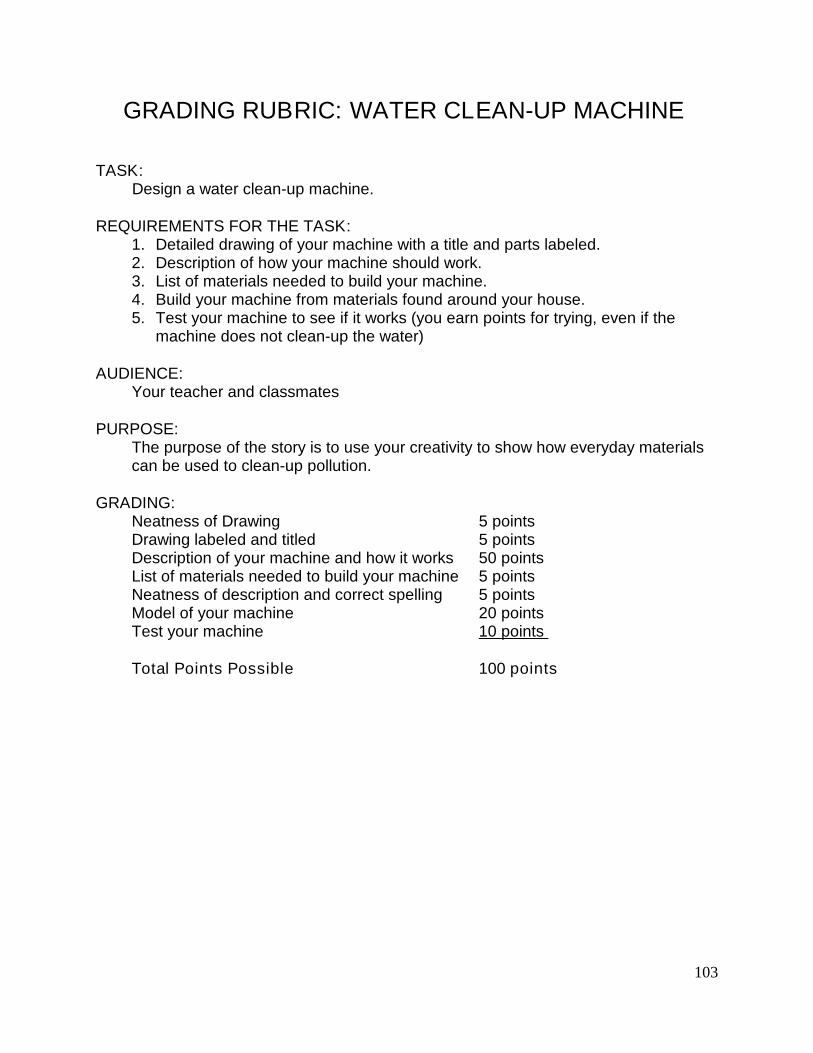
GRADING RUBRIC: WATER CLEAN-UP MACHINE
TASK:Design a water clean-up machine.
REQUIREMENTS FOR THE TASK:1. Detailed drawing of your machine with a title and parts labeled.2. Description of how your machine should work.3. List of materials needed to build your machine.4. Build your machine from materials found around your house.5. Test your machine to see if it works (you earn points for trying, even if the
machine does not clean-up the water)
AUDIENCE:Your teacher and classmates
PURPOSE:The purpose of the story is to use your creativity to show how everyday materialscan be used to clean-up pollution.
GRADING:Neatness of Drawing 5 pointsDrawing labeled and titled 5 pointsDescription of your machine and how it works 50 pointsList of materials needed to build your machine 5 pointsNeatness of description and correct spelling 5 pointsModel of your machine 20 pointsTest your machine 10 points
Total Points Possible 100 points
104
AssessmentGrade 5
HYDROSPHERE
Classroom Assessment Example SCI.V.2.MS.4
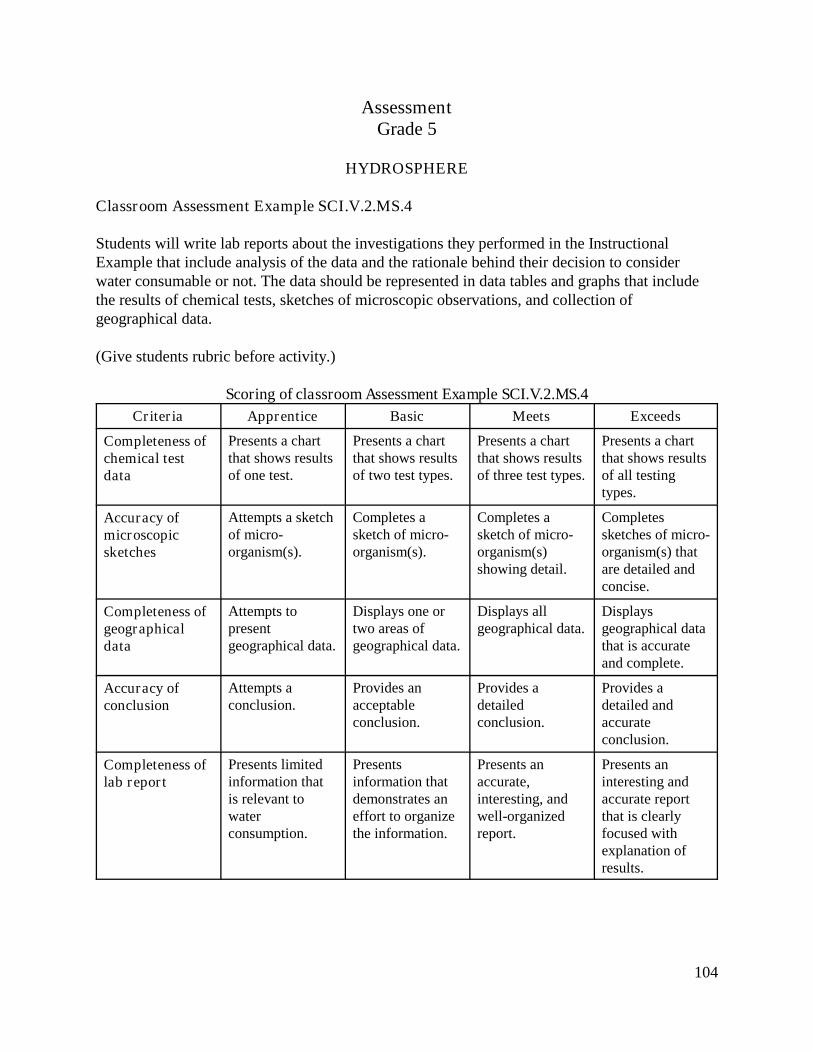
Students will write lab reports about the investigations they performed in the InstructionalExample that include analysis of the data and the rationale behind their decision to considerwater consumable or not. The data should be represented in data tables and graphs that includethe results of chemical tests, sketches of microscopic observations, and collection ofgeographical data.
(Give students rubric before activity.)
Scoring of classroom Assessment Example SCI.V.2.MS.4
Criteria Apprentice Basic Meets Exceeds
Completeness ofchemical testdata
Presents a chartthat shows resultsof one test.
Presents a chartthat shows resultsof two test types.
Presents a chartthat shows resultsof three test types.
Presents a chartthat shows resultsof all testingtypes.
Accuracy ofmicroscopicsketches
Attempts a sketchof micro-organism(s).
Completes asketch of micro-organism(s).
Completes asketch of micro-organism(s)showing detail.
Completessketches of micro-organism(s) thatare detailed andconcise.
Completeness ofgeographicaldata
Attempts topresentgeographical data.
Displays one ortwo areas ofgeographical data.
Displays allgeographical data.
Displaysgeographical datathat is accurateand complete.
Accuracy ofconclusion
Attempts aconclusion.
Provides anacceptableconclusion.
Provides adetailedconclusion.
Provides adetailed andaccurateconclusion.
Completeness oflab report
Presents limitedinformation thatis relevant towaterconsumption.
Presentsinformation thatdemonstrates aneffort to organizethe information.
Presents anaccurate,interesting, andwell-organizedreport.
Presents aninteresting andaccurate reportthat is clearlyfocused withexplanation ofresults.