Embed Size (px)
Citation preview
Earth System Data Record (ESDR) for Global Evapotranspiration.
Eric Wood Princeton University
©Princeton University

1. Strategy for developing ESDR
2. Potential algorithms: A micro-meteorology approach (e.g. SEBS)A resistance approach
2. Potential data sources:Terra and Aqua-based (2000 onwards, one or twice per day)ISCCP (~20 yrs, 3-hrly, low resolution (0.5 to 2.5-degrees)
3. Some initial results, and future plans
4. Some challenges
Outline of this talk
©Princeton University

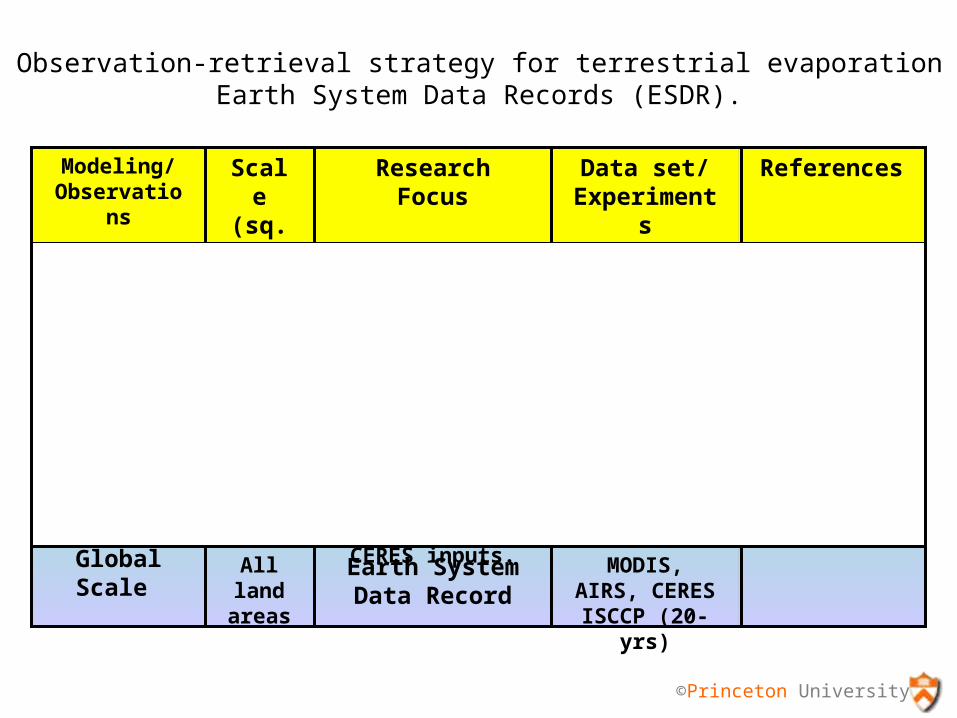
Observation-retrieval strategy for terrestrial evaporation Earth System Data Records (ESDR).
Modeling/Observatio
ns
Scale
(sq. km)
Research Focus
Data set/Experimen
ts
References
Small Tower Scale
0.1 - 1.0
Algorithm development
and validation
SMACEX02CEOP,
Fluxnet sites
Su et al. (2005)
Su et al. (2006)Medium
Scale1.0 - 102
Algorithm testing with
MODIS-based inputs, Error
analysis
SMACEX02NAME
Wood et al. (2003)
McCabe and Wood (2006)
Large Scale
102 - 106
Scaling/interpolationTesting with MODIS, AIRS and CERES
inputs.
OK mesonet Wood et al. (2006)
Global Scale
All land areas
Earth System Data Record
MODIS, AIRS, CERES
ISCCP (20-yrs)
©Princeton University

Potential algorithms:
A micro-meteorology surface energy balance approach (e.g. Surface Energy Balance System (Su et al), ALEXI (Norman et al.) SEBAL, etc.)We’ve been applying SEBS with MODIS and AIRS data with success, and will continue to use this.
A vegetation resistance approach. Steve Running has used Penman-Montheith with GMAO forcing data, where he adjusts the surface resistance based on surface conditions.
Surface radiation/resistance approachesPriestley-Taylor approach where the corefficient is adjected for surface conditions.
©Princeton University

Observation-retrieval strategy for terrestrial evaporation Earth System Data Records (ESDR).
Modeling/Observatio
ns
Scale
(sq. km)
Research Focus
Data set/Experimen
ts
References
Small Tower Scale
0.1 - 1.0
Algorithm development
and validation
SMACEX02CEOP,
Fluxnet sites
Su et al. (2005)
Su et al. (2006)Medium
Scale1.0 - 102
Algorithm testing with
MODIS-based inputs, Error
analysis
SMACEX02NAME
Wood et al. (2003)
McCabe and Wood (2006)
Large Scale
102 - 106
Scaling/interpolationTesting with MODIS, AIRS and CERES
inputs.
OK mesonet Wood et al. (2006)
Global Scale
All land areas
Earth System Data Record
MODIS, AIRS, CERES
ISCCP (20-yrs)
©Princeton University

We’re using the Surface Energy Balance Model (SEBS) to determine daily/10-daily ET predictions (limited by surface temperature).
SEBS Model Description
Components of the radiation balance are used to determine the net radiation (Rn) – SW , α, ε, Ts, LW
Rn – G = H + LE
Rn = (1- α) SW + ε LW - εσ 4sT
The ground heat flux (G) is parameterized as a function of fractional cover – LAI/NDVI relationships.
©Princeton University

SEBS Model Description
Wind, air temperature, humidity(aerodynamic roughness,
thermal dynamic roughness)
SEBS (Su, HESS 2002) calculates H using similarity theory:
Various sub-modules for calculating needed components…©Princeton University

SEBS Model Description
Forcing data from validation tower sites supplemented with MODIS data to produce estimates of surface fluxes.
CEOP observations are then used to assess ET predictions
©Princeton University

Previous Investigations – SMACEX 02
Examining the spatial equivalence for corn and soybean
5 tower sites 3 tower sites
High resolution/quality data produces good quality estimates – examine model accuracy ©Princeton University

Comparison of instantaneous SEBS retrieved heat fluxes using MODIS data products (x-axis) and CEOP measured heat fluxes (y-axis) for 3 CEOP EOP-1 sites. Different number of days is due to MODIS LST availability
Comparisons to GEWEX/CEOP sites
©Princeton University

Summary from small scale analysis
1. With accurate tower forcing data, SEBS (energy balance approaches) will provide good estimates of surface heat fluxes.
2. Testing over experimental tower data (SMACEX’02), CEOP reference tower data (of lesser quality), and (hopefully) FluxNet sites.
©Princeton University

Observation-retrieval strategy for terrestrial evaporation Earth System Data Records (ESDR).
Modeling/Observatio
ns
Scale
(sq. km)
Research Focus
Data set/Experimen
ts
References
Small Tower Scale
0.1 - 1.0
Algorithm development
and validation
SMACEX02CEOP,
Fluxnet sites
Su et al. (2005)
Su et al. (2006)Medium
Scale1.0 - 102
Algorithm testing with
MODIS-based inputs, Error
analysis
SMACEX02NAME
Wood et al. (2003)
McCabe and Wood (2006)
Large Scale
102 - 106
Scaling/interpolationTesting with MODIS, AIRS and CERES
inputs.
OK mesonet Wood et al. (2006)
Global Scale
All land areas
Earth System Data Record
MODIS, AIRS, CERES
ISCCP (20-yrs)
©Princeton University

Data Type Variables Unit Source Platform Resolution
Surface Meteorological
Data
Air temperature °C AIRS2 Aqua 45km
Pressure Kpa AIRS2 Aqua 45km
Wind m/s 4-DDA GEOS-3
Vapor Pressure Kpa AIRS2 Aqua 45km
Radiative Energy Flux
Incident Shortwave Radiation
W/m2MODIS1
CERESAqua Terra
5km20 km
Incident Longwave Radiation
W/m2 CERES 20 km
Net Longwave Radiation W/m2 CERES Aqua Terra
20 km
Net Radiation W/m2 CERES Aqua Terra
20 km
Surface Temperature
Radiometric Temperature (Soil+Vegetation)
°KMODISAIRS2
Aqua Terra
1 - 5 km45km
Emissivity (MOD11)
m MODISCERES
Aqua Terra
1 - 5 km20 km
Albedo (MOD43)Broadband Albedo
- MODISCERES
Aqua Terra
1 - 5 km20 km
Leaf Area Index & fPAR (MOD15)
- MODIS Aqua Terra
1 - 5 km
Vegetation Parameters
Vegetation Type (MOD12)
- MODIS Aqua Terra
1 - 5 km
Aqua Terra
©Princeton University
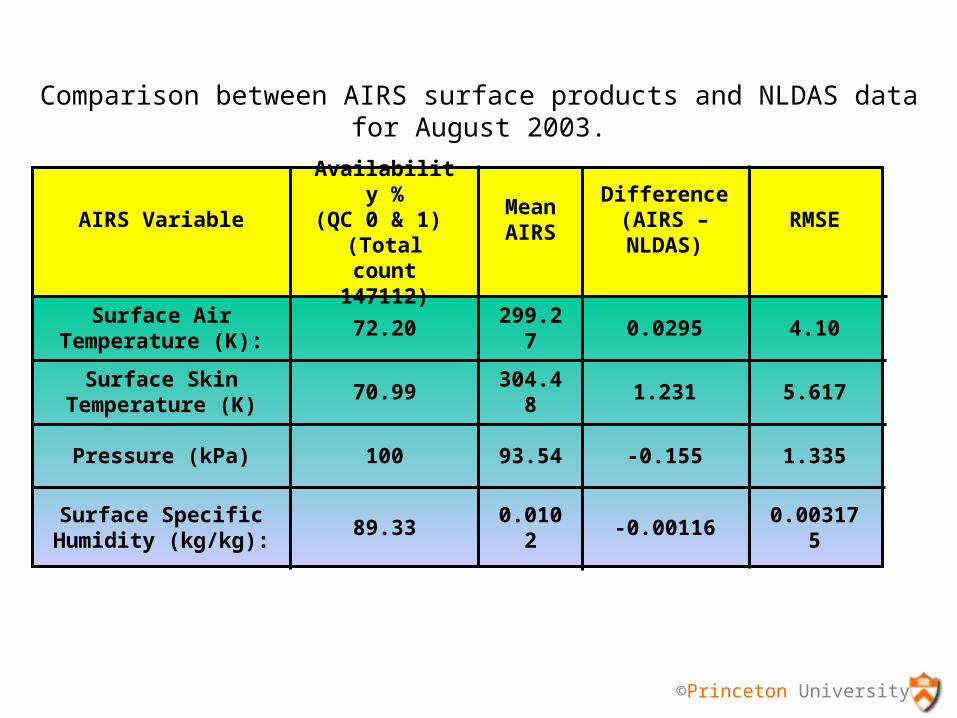
Comparison between AIRS surface products and NLDAS data for August 2003.
AIRS VariableAvailability %
(QC 0 & 1) (Total count
147112)
Mean AIRS
Difference(AIRS – NLDAS)
RMSE
Surface Air Temperature (K):
72.20 299.27 0.0295 4.10
Surface Skin Temperature (K)
70.99 304.48 1.231 5.617
Pressure (kPa) 100 93.54 -0.155 1.335
Surface Specific Humidity (kg/kg):
89.33 0.0102 -0.00116 0.003175
©Princeton University

Retrieved surface insolation for a MODIS swath, using the GEWEX-Surface Radiation Budget (SRB) model of Pinker.
©Princeton University

CERES, 20 km net LW surface flux.©Princeton University

MODIS-based, 10-day (August 11-20, 2003) average ET retrieved over Oklahoma. (MODIS swath radiation is used.)
©Princeton University

Net radiation, latent and sensible heat fluxes from Aqua for Aug 15, 2003.
Net radiation
Latent Heat Sensible Heat
Notice the data gaps from the MODIS LST product, and those
in AIRS air temperature.

Net radiation, latent and sensible heat fluxes from Aqua for the month of August 2003.
Net radiation
Latent Heat ©Princeton University

Summary from medium to large scale analysis
1. Energy balance approaches requires swath-based radiation, with a MODIS-based product the most useful for retrieving ET from MODIS.
2. Testing with CERES-swath based radiation is being carried out.
3. The (low) availability of MODIS surface temperature is a concern for obtaining accurate monthly estimates at large scales.
4. Surface meteorology from AIRS (on AQUA) provides the needed inputs for ET estimation – but only once-per-day. Surface station data can be used, but there are difficulties with data availability outside the U.S.
5. Retrievals look good – how to validate them?
6. Alternative algorithms – perhaps surface radiation/resistance types??
©Princeton University
Observation-retrieval strategy for terrestrial evaporation Earth System Data Records (ESDR).
Modeling/Observatio
ns
Scale
(sq. km)
Research Focus
Data set/Experimen
ts
References
Small Tower Scale
0.1 - 1.0
Algorithm development
and validation
SMACEX02CEOP,
Fluxnet sites
Su et al. (2005)
Su et al. (2006)Medium
Scale1.0 - 102
Algorithm testing with
MODIS-based inputs, Error
analysis
SMACEX02NAME
Wood et al. (2003)
McCabe and Wood (2006)
Large Scale
102 - 106
Scaling/interpolationTesting with MODIS, AIRS and CERES
inputs.
OK mesonet Wood et al. (2006)
Global Scale
All land areas
Earth System Data Record
MODIS, AIRS, CERES
ISCCP (20-yrs)
©Princeton University
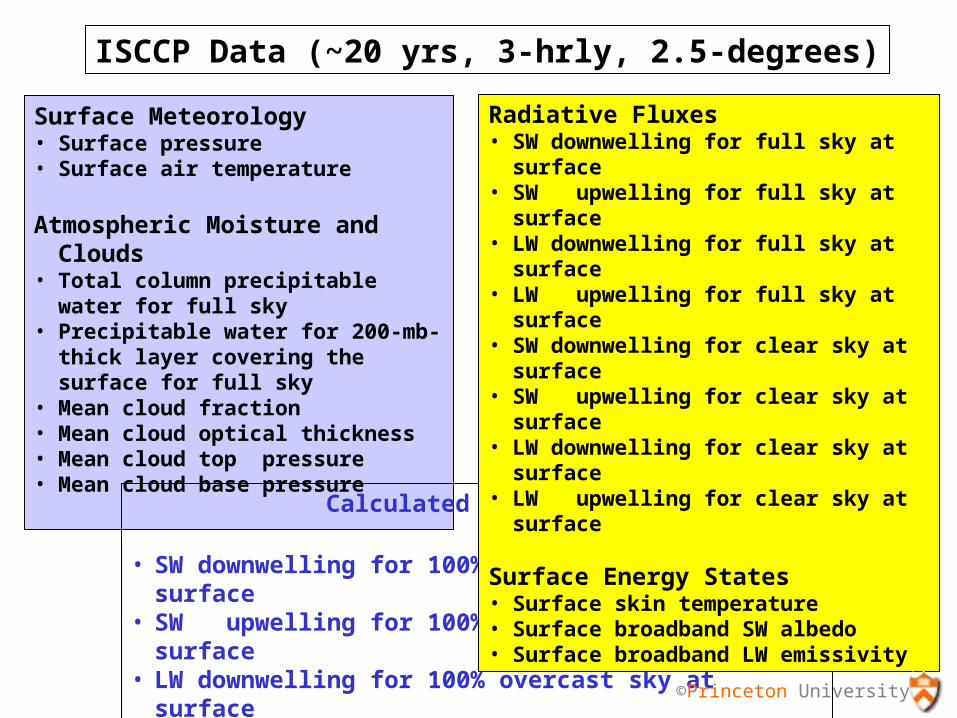
Surface Meteorology• Surface pressure• Surface air temperature
Atmospheric Moisture and Clouds• Total column precipitable water for
full sky • Precipitable water for 200-mb-thick
layer covering the surface for full sky• Mean cloud fraction• Mean cloud optical thickness• Mean cloud top pressure • Mean cloud base pressure
Calculated from above
• SW downwelling for 100% overcast sky at surface • SW upwelling for 100% overcast sky at surface• LW downwelling for 100% overcast sky at surface• LW upwelling for 100% overcast sky at surface
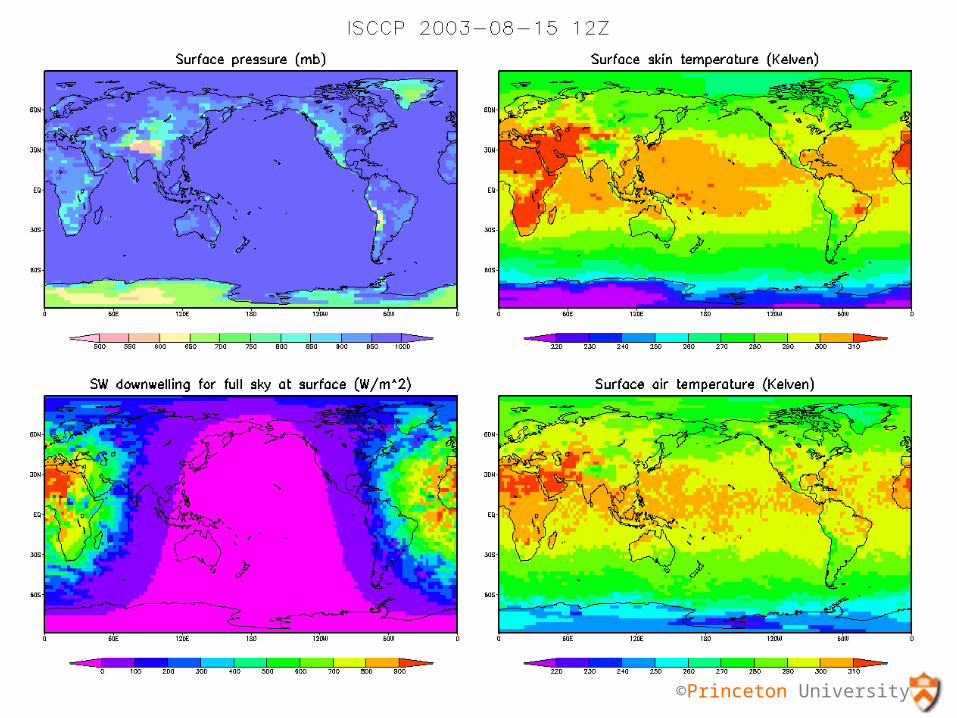
ISCCP Data (~20 yrs, 3-hrly, 2.5-degrees)
Radiative Fluxes• SW downwelling for full sky at surface • SW upwelling for full sky at surface • LW downwelling for full sky at surface • LW upwelling for full sky at surface • SW downwelling for clear sky at surface • SW upwelling for clear sky at surface • LW downwelling for clear sky at surface • LW upwelling for clear sky at surface
Surface Energy States• Surface skin temperature • Surface broadband SW albedo • Surface broadband LW emissivity
©Princeton University

©Princeton University

©Princeton University

©Princeton University

©Princeton University
©Princeton University

©Princeton University

©Princeton University

©Princeton University

Surface Meteorology• Surface pressure• Surface air temperature
Atmospheric Moisture and Clouds• Total column precipitable water for
full sky • Precipitable water for 200-mb-thick
layer covering the surface for full sky• Mean cloud fraction• Mean cloud optical thickness• Mean cloud top pressure • Mean cloud base pressure
Calculated from above
• SW downwelling for 100% overcast sky at surface • SW upwelling for 100% overcast sky at surface• LW downwelling for 100% overcast sky at surface• LW upwelling for 100% overcast sky at surface
ISCCP Data (~20 yrs, 3-hrly, 2.5-degrees)
Radiative Fluxes• SW downwelling for full sky at surface • SW upwelling for full sky at surface • LW downwelling for full sky at surface • LW upwelling for full sky at surface • SW downwelling for clear sky at surface • SW upwelling for clear sky at surface • LW downwelling for clear sky at surface • LW upwelling for clear sky at surface
Surface Energy States• Surface skin temperature • Surface broadband SW albedo • Surface broadband LW emissivity
©Princeton University
Summary from global scale analysis
1. A MODIS (or MODIS/AIRS) only evaporation product at global scales can be developed, but will contain many missing data due to cloud cover (no MODIS Ts). A monthly product can be developed but may be biased high, since it uses only clear days.
2. A global product based on GMAO meteorology and Ts is unacceptable due to biases in GMOA analysis fields.
3. ISCCP data offers the potential of diurnal estimates at coarse (2.5-degree) resolutions. It will form the basis for the GEWEX Radiation Panel’s “LandFlux” product for understanding the mean and variability in surface land fluxes. (Current ISCCP data can be processed at a higher resolution – 0.5 degree.)
4. MODIS-based LandFlux can offer a high resolution estimate that will allow a better understanding of the coarse-scale ISCCP data product.
©Princeton University