Embed Size (px)
Citation preview
2001H I G H E R S C H O O L C E R T I F I C AT E
E X A M I N AT I O N
General Instructions
• Reading time – 5 minutes
• Working time – 3 hours
• Write using black or blue pen
• Draw diagrams using pencil
• Board-approved calculators maybe used
• A Geological Time Scaleis provided at the back of thispaper
• Write your Centre Number andStudent Number at the top ofpages 13, 17, 19 and 23
Total marks – 100
Pages 2–24
75 marks
This section has two parts, Part A and Part B
Part A – 15 marks
• Attempt Questions 1–15
• Allow about 30 minutes for this part
Part B – 60 marks
• Attempt Questions 16–26
• Allow about 1 hour and 45 minutes for this part
Pages 25–34
25 marks
• Attempt ONE question from Questions 27–30
• Allow about 45 minutes for this section
Section II
Section I
Earth and Environmental Science
139

– 2 –
Section I75 marks
Part A – 15 marksAttempt Questions 1–15Allow about 30 minutes for this part
Use the multiple-choice answer sheet.
Select the alternative A, B, C or D that best answers the question. Fill in the response ovalcompletely.
Sample: 2 + 4 = (A) 2 (B) 6 (C) 8 (D) 9
A B C D
If you think you have made a mistake, put a cross through the incorrect answer and fill in thenew answer.
A B C D
If you change your mind and have crossed out what you consider to be the correct answer, thenindicate the correct answer by writing the word correct and drawing an arrow as follows.
correct
A B C D

At which of the locations A, B, C or D are mountains presently forming as a result offolding and faulting at a convergent plate boundary?
(A) A
(B) B
(C) C
(D) D
C
B
D
A
1
– 3 –

2 In the year 2525, an Earth-like planet is identified in a nearby solar system. Planetaryscientists have identified a linear mountain chain that is 33 000 km long.
Which of the following would be likely to be present if the mountain chain is forming ata divergent margin?
(A) Andesite and granite
(B) Explosive volcanoes and basalt
(C) Thickened crust and normal faults
(D) High heat flow and volcanic activity
3 In which of the following general locations would the inhabitants be most likely toexperience tsunamis, destructive earthquakes and volcanic poisonous gas emissions?
(A) An island chain in the middle of an ocean plate
(B) The edge of a continent located in the middle of a plate
(C) A coastal location adjacent to a large transform fault
(D) The trench side of an island arc
– 4 –

4 The map shows the epicentres (•) of earthquakes of magnitude 7.0 and above on theRichter scale that occurred from 1991 to 1997.
The table shows the frequency of earthquakes for each of the years.
What does this information indicate?
(A) Plate movement has continued throughout this period.
(B) The damage caused as a result of earthquakes has decreased.
(C) The rate of plate movement has decreased during the time period recorded.
(D) Earthquakes are unrelated to plate boundaries.
Frequency
14
13
13
13
13
17
10
Year
1991
1992
1993
1994
1995
1996
1997
– 5 –

5 Graph 1 shows the percentage of eruptions at different time intervals for volcanoes witha volcanic explosivity index (VEI) between 0 and 3.
Graph 2 shows the relationship between VEI and the percentage of eruptions that hadknown fatalities.
Using the graphs, determine which of these statements is correct.
(A) Volcanoes with a VEI of 3 erupt only every 100 –10 000 years but are most likelyto lead to fatalities.
(B) 50% of eruptions with a VEI of 0 occur every 10–100 years and lead to fatalitiesin 1% of cases.
(C) As the VEI increases, the interval between eruptions decreases.
(D) 32% of the population living near a volcano with a VEI of 3 will die in an eruptionevery 100–10 000 years.
0
5
10
15
20
25
30
35
3210VEI
Perc
enta
ge o
f er
uptio
nsw
ith f
atal
ities
Graph 2
50
0
VEI 250
0
VEI 150
0
50
00–1 1–10 10–100 100–1000 1000–10 000
Interval between eruptions (years)
Perc
enta
ge o
f er
uptio
nsGraph 1
VEI 3 (highly explosive)
VEI 0 (non-explosive)
– 6 –

6 Relative dating is based on which of the following?
(A) Measuring radioactive isotopes
(B) Using carbon-14
(C) Establishing the complexity of fossils
(D) Determining stratigraphic sequence
7 A comparison of the Cambrian fossil record with that of the Late Proterozoic has resultedin the use of the term explosion when referring to the Cambrian Event.
Why is this expression used?
(A) Most genera were destroyed by a bolide impact in the Cambrian.
(B) There was an apparent increase in the diversity of animal life forms.
(C) The first land-based vertebrate species appeared in the Cambrian.
(D) An increase in volcanic activity led to rapid evolution.
8 In which part of the Phanerozoic fossil record do mammals first appear?
(A) The Proterozoic
(B) The Palaeozoic
(C) The Mesozoic
(D) The Cenozoic
– 7 –

9 The graph shows the abundance of the element iridium in clay residues from pelagic(oceanic) limestones.
What is the most likely reason for the sudden increase in iridium at 65 million yearsbefore present (Ma BP)?
(A) There was an increase in marine organisms producing iridium as a waste product.
(B) An extra-terrestrial object that was rich in iridium collided with Earth.
(C) Most of the iridium older than 65 Ma BP has radioactively decayed into a stableproduct.
(D) A massive flood caused iridium to be washed from the land into the oceans, anddeposited in the limestone.
10 How can mass extinction events be distinguished from smaller extinction events?
(A) Mass extinction events involve a wide range of organisms and habitats, whereassmaller extinction events do not.
(B) Mass extinction events are caused by bolide impacts, whereas smaller extinctionevents are caused by volcanic activity.
(C) Mass extinction events are caused by episodes of marked global cooling, whereassmaller extinction events are caused by global warming.
(D) Mass extinction events affect both marine and terrestrial organisms, whereassmaller extinction events affect only marine organisms.
0 1 2 3 4 5 6 7 8
60.0
65.0
70.0
Tim
e sc
ale
(Ma
BP)
Iridium in clay residues(parts per billion)
Iridium abundances
– 8 –

11 The diagram shows the stratigraphic range of fossils (A to J) in the Simpson Basinsequence.
A sedimentary rock sample contains fossils B, D and H.
From which zone and Simpson Basin sequence was the sample taken?
(A) 11 and Crusty Formation
(B) 11 and Duff Formation
(C) 10 and Duff Formation
(D) 10 and Homer Formation
A
BC
DE
F
GH
IJ
Stratigraphic range of fossils Zone
13
12
11
1098
7
6
5
4
3
2
1
Simpson Basinsequence
Moe Formation
Marge FormationBart Shale
Lisa Beds
Skinner ShaleCrusty FormationDuff Formation
Homer Formation
Springfield Beds
– 9 –

12 Which of the following has resulted in the majority of Australian soils being relativelylow in fertility?
(A) The excessive use of fertilisers and pesticides over the last two hundred years inAustralia.
(B) The lower rainfall experienced in Australia since it started moving towards theequator after the break-up of Gondwana.
(C) The depletion of the majority of nutrients by dense forest that covered the wholeAustralian continent during the Carboniferous Period.
(D) The great age, low topographic relief and geological stability of Australia.
13 The excessive use of pesticides can result in accumulation and magnification in livingorganisms.
Which of the following statements is true?
(A) Accumulation only occurs at the lowest level of a food chain.
(B) Accumulation only occurs in animals.
(C) Magnification only occurs at higher levels of a food chain.
(D) Magnification only occurs in plants.
14 How do chlorofluorocarbons (CFCs) reduce the concentration of ozone in theatmosphere?
(A) The CFCs combine with ozone to produce oxidised molecules.
(B) In dark and cold conditions, CFCs combine with carbon dioxide to decrease ozoneproduction.
(C) CFCs split in the troposphere and oxidise, preventing the creation of ozone.
(D) Radiation causes CFCs to release atoms that convert ozone to oxygen.
– 10 –
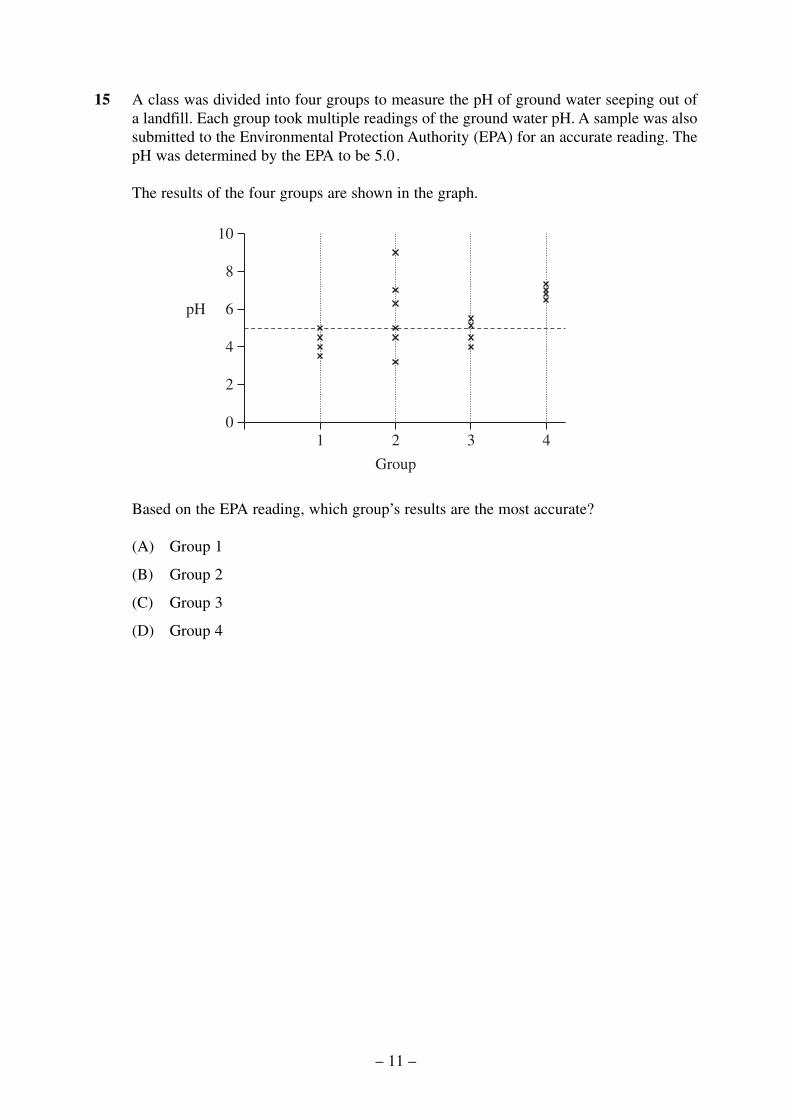
15 A class was divided into four groups to measure the pH of ground water seeping out ofa landfill. Each group took multiple readings of the ground water pH. A sample was alsosubmitted to the Environmental Protection Authority (EPA) for an accurate reading. ThepH was determined by the EPA to be 5.0.
The results of the four groups are shown in the graph.
Based on the EPA reading, which group’s results are the most accurate?
(A) Group 1
(B) Group 2
(C) Group 3
(D) Group 4
01 2
Group
3 4
2
4
6pH
8
10
– 11 –

BLANK PAGE
© Board of Studies NSW 2001
– 12 –

Section I (continued)
Part B – 60 marksAttempt Questions 16–26Allow about 1 hour and 45 minutes for this part
Answer the questions in the spaces provided.
MarksQuestion 16 (6 marks)
(a) Name the most common igneous rock formed at ocean–ocean convergent platemargins.
.....................................................................................
(b) Define the term lithospheric plate.
...............................................................................................................................
...............................................................................................................................
(c) Draw and label a diagram of an ocean–ocean convergent boundary to show theplate motion and a resulting landform feature or environment.
3
2
1
2001 HIGHER SCHOOL CERTIFICATE EXAMINATION
Earth and Environmental Science
– 13 –140
Centre Number
Student Number

Question 17 (6 marks)
The diagram shows the location of the Tambora volcano in Indonesia, and the depth of ash fallfollowing the 1816 eruption.
The year 1816 was globally known as the year without summer. The graph shows temperaturesin North America and Europe from 1720 to 1980.
Question 17 continues on page 15
13
12
11
10
9
8
7
6
51750 1800 1850 1900 1950
Year
Tem
pera
ture
(°C
)
5025
Kalimantan
0 500 km
100
20
5
1
Java
Sulawesi
Thickness of ash in cmTambora volcano
– 14 –

Question 17 (continued)
(a) Describe the impact of the Tambora eruption on global temperature.
...............................................................................................................................
...............................................................................................................................
...............................................................................................................................
...............................................................................................................................
(b) Explain the likely impact of the Tambora eruption on local and globalagriculture.
...............................................................................................................................
...............................................................................................................................
...............................................................................................................................
...............................................................................................................................
...............................................................................................................................
...............................................................................................................................
...............................................................................................................................
...............................................................................................................................
End of Question 17
Please turn over
4
2
– 15 –
Marks

Question 18 (8 marks)
The shaded area of Australia indicates the location of the oldest rocks of the continent.
Outline how the Australian continent has grown over geological time as a result ofplate tectonic processes.
.........................................................................................................................................
.........................................................................................................................................
.........................................................................................................................................
.........................................................................................................................................
.........................................................................................................................................
.........................................................................................................................................
.........................................................................................................................................
.........................................................................................................................................
.........................................................................................................................................
.........................................................................................................................................
.........................................................................................................................................
.........................................................................................................................................
.........................................................................................................................................
.........................................................................................................................................
.........................................................................................................................................
.........................................................................................................................................
8
– 16 –
Marks
© Board of Studies NSW 2001

Section I – Part B (continued)
MarksQuestion 19 (4 marks)
(a) Identify ONE effect that cyanobacteria had on Earth’s primitive atmosphere.
...............................................................................................................................
...............................................................................................................................
(b) State the environment in which stromatolites typically form.
...............................................................................................................................
...............................................................................................................................
(c) Explain why stromatolites were more widely distributed in the Proterozoic Eonthan they are in the modern environment.
...............................................................................................................................
...............................................................................................................................
...............................................................................................................................
...............................................................................................................................
2
1
1
2001 HIGHER SCHOOL CERTIFICATE EXAMINATION
Earth and Environmental Science
– 17 –141
Centre Number
Student Number

Question 20 (4 marks)
Summarise the major adaptations that allowed the exploitation of terrestrialenvironments by animals.
.........................................................................................................................................
.........................................................................................................................................
.........................................................................................................................................
.........................................................................................................................................
.........................................................................................................................................
.........................................................................................................................................
.........................................................................................................................................
.........................................................................................................................................
Question 21 (5 marks)
Compare TWO hypotheses proposed to explain the extinction of the megafauna inAustralia.
.........................................................................................................................................
.........................................................................................................................................
.........................................................................................................................................
.........................................................................................................................................
.........................................................................................................................................
.........................................................................................................................................
.........................................................................................................................................
.........................................................................................................................................
.........................................................................................................................................
.........................................................................................................................................
5
4
– 18 –
Marks
© Board of Studies NSW 2001

Section I – Part B (continued)
MarksQuestion 22 (3 marks)
(a) Identify the source of ONE named greenhouse gas whose atmosphericconcentration has increased since the Industrial Revolution.
...............................................................................................................................
...............................................................................................................................
(b) Explain why a proposed or actual strategy would result in decreasing emissionsof this gas.
...............................................................................................................................
...............................................................................................................................
...............................................................................................................................
...............................................................................................................................
Please turn over
2
1
2001 HIGHER SCHOOL CERTIFICATE EXAMINATION
Earth and Environmental Science
– 19 –142
Centre Number
Student Number
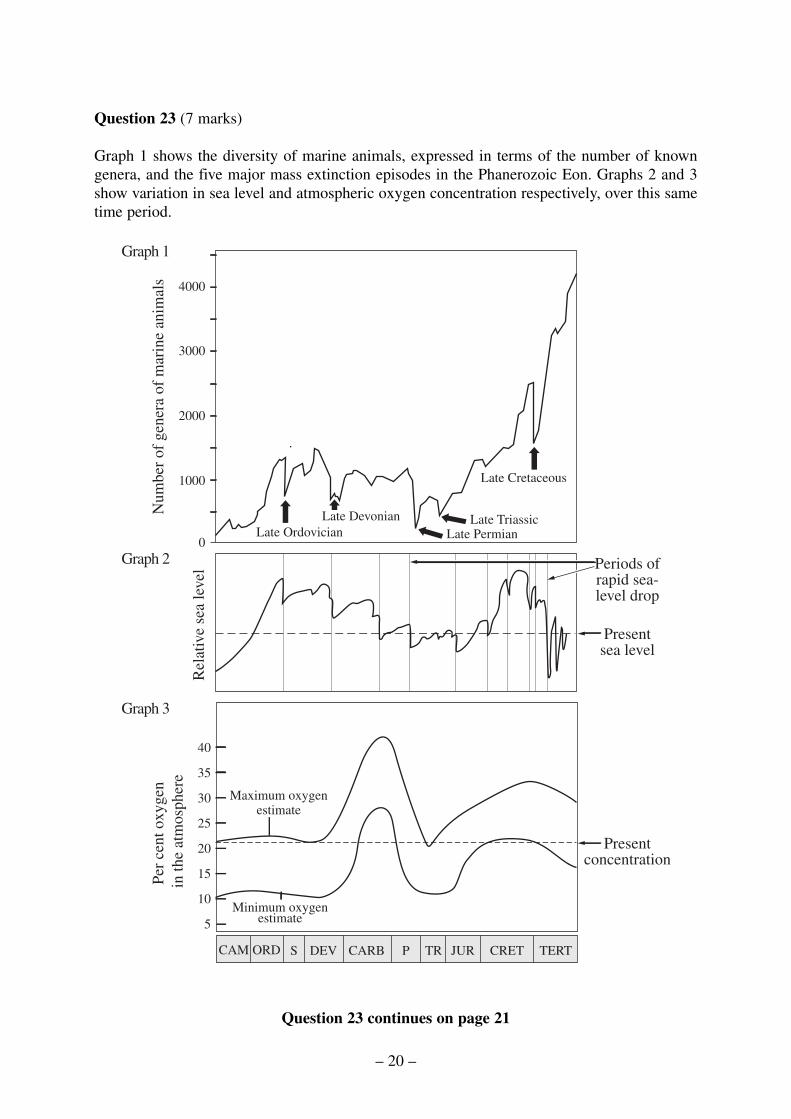
Question 23 (7 marks)
Graph 1 shows the diversity of marine animals, expressed in terms of the number of knowngenera, and the five major mass extinction episodes in the Phanerozoic Eon. Graphs 2 and 3show variation in sea level and atmospheric oxygen concentration respectively, over this sametime period.
Question 23 continues on page 21
Late OrdovicianLate Devonian
Late Cretaceous
Late TriassicLate Permian
4000
3000
2000
1000
0
Num
ber
of g
ener
a of
mar
ine
anim
als
Per
cent
oxy
gen
in th
e at
mos
pher
e
Maximum oxygenestimate
Minimum oxygenestimate
Presentconcentration
Presentsea level
Periods ofrapid sea-level drop
40
35
30
25
20
15
10
5
CAM ORD S DEV CARB P TR JUR CRET TERT
Rel
ativ
e se
a le
vel
Graph 1
Graph 2
Graph 3
– 20 –

Question 23 (continued)
Analyse the relationships between marine animal diversity in the Phanerozoic Eon andatmospheric oxygen content, sea-level variation and related climate variation.
.........................................................................................................................................
.........................................................................................................................................
.........................................................................................................................................
.........................................................................................................................................
.........................................................................................................................................
.........................................................................................................................................
.........................................................................................................................................
.........................................................................................................................................
.........................................................................................................................................
.........................................................................................................................................
.........................................................................................................................................
.........................................................................................................................................
.........................................................................................................................................
.........................................................................................................................................
End of Question 23
Please turn over
7
– 21 –
Marks

Question 24 (5 marks)
In your Earth and Environmental Science course you have undertaken first-handinvestigations to determine the effect of compaction or tracking on a soil. Assess howthe results of your investigations have contributed to your understanding of soilmanagement.
.........................................................................................................................................
.........................................................................................................................................
.........................................................................................................................................
.........................................................................................................................................
.........................................................................................................................................
.........................................................................................................................................
.........................................................................................................................................
.........................................................................................................................................
.........................................................................................................................................
.........................................................................................................................................
5
– 22 –
Marks
© Board of Studies NSW 2001
Section I – Part B (continued)
MarksQuestion 25 (8 marks)
During the Earth and Environmental Science course, you have carried out a case studyof a rehabilitation program in an area affected by salinity.
(a) Name the area you studied, and identify ONE cause of the salinity problem.
...............................................................................................................................
...............................................................................................................................
(b) Describe the impact of this salinity problem.
...............................................................................................................................
...............................................................................................................................
...............................................................................................................................
...............................................................................................................................
...............................................................................................................................
...............................................................................................................................
(c) Evaluate the effectiveness of the rehabilitation strategy used at this site.
...............................................................................................................................
...............................................................................................................................
...............................................................................................................................
...............................................................................................................................
...............................................................................................................................
...............................................................................................................................
...............................................................................................................................
...............................................................................................................................
4
3
1
2001 HIGHER SCHOOL CERTIFICATE EXAMINATION
Earth and Environmental Science
– 23 –143
Centre Number
Student Number

Question 26 (4 marks)
The table shows the duration of rainfall (R) and the rate of soil loss due to erosion (L)at a test site in an agricultural area.
(a) Using the grid provided, draw a graph of L versus R, with a line through the datapoints.
(b) Describe the relationship between L and R.
...............................................................................................................................
...............................................................................................................................
...............................................................................................................................
...............................................................................................................................
2
R (minutes)
L (
g pe
r m
in p
er 1
0 m
2 of
land
)
2
Rate of soil loss (L)(g per min per 10 m2 of land)
0.00.00.10.61.62.12.5
Duration of rainfall (R)(minutes)
0256
101525
– 24 –
Marks
© Board of Studies NSW 2001

Section II
25 marksAttempt ONE question from Questions 27–30Allow about 45 minutes for this section
Answer the question in a writing booklet. Extra writing booklets are available.
Pages
Question 27 Introduced Species and the Australian Environment ........ 26–27
Question 28 Organic Geology – A Non-renewable Resource ............... 28–29
Question 29 Mining and the Australian Environment ........................... 30–32
Question 30 Oceanography .................................................................... 33–34
2001 HIGHER SCHOOL CERTIFICATE EXAMINATION
Earth and Environmental Science
– 25 –144

Question 27 — Introduced Species and the Australian Environment (25 marks)
(a) (i) Identify ONE criterion that has been used to recognise an organism asbeing an introduced species.
(ii) Describe the mode and reason for the introduction of a named species toAustralia.
(b) In your study of Introduced Species and the Australian Environment, youperformed a first-hand investigation of an environment that has been affected byan introduced species.
(i) Name the introduced species and the environment, and explain howONE aspect of this environment made it vulnerable to the introducedspecies.
(ii) Explain ONE effect of the introduced species on this environment.
(c) Analyse the effectiveness of TWO quarantine methods or procedures used inAustralia to prevent the introduction of new species.
Question 27 continues on page 27
4
2
2
2
1
– 26 –
Marks

Question 27 (continued)
(d) The graph shows the relative abundance of one native and two introducedmammals on the New England tablelands from 1880 to 1920.
(i) Describe the general trends for Introduced species A and the Rat kangarooshown in the graph.
(ii) Explain how characteristics of Introduced species B may have contributedto its success in Australia.
(e) Critically evaluate ONE strategy that has been used to rehabilitate an ecosystemthat has been impacted upon by introduced species.
End of Question 27
8
4
2
1880 1890 1900 1910 1920
Rel
ativ
e ab
unda
nce
Year
Introduced species ARat kangaroo
Introduced species B
– 27 –
Marks
Question 28 — Organic Geology – A Non-renewable Resource (25 marks)
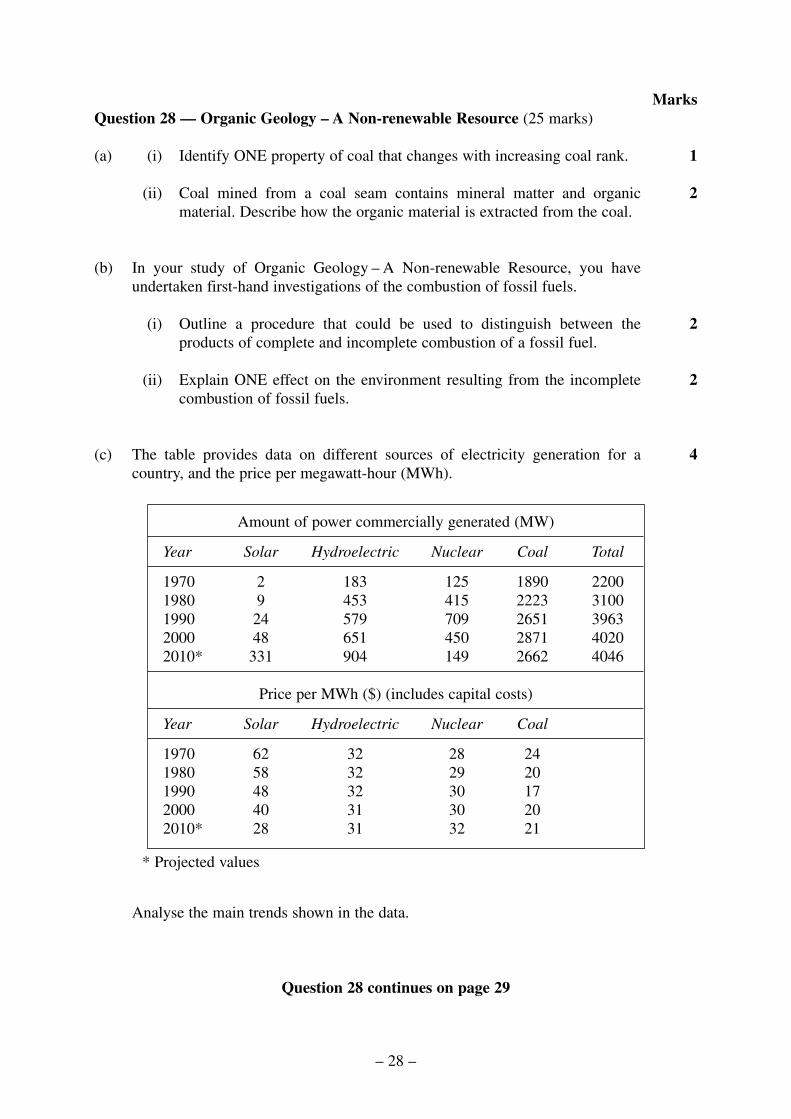
(a) (i) Identify ONE property of coal that changes with increasing coal rank.
(ii) Coal mined from a coal seam contains mineral matter and organicmaterial. Describe how the organic material is extracted from the coal.
(b) In your study of Organic Geology – A Non-renewable Resource, you haveundertaken first-hand investigations of the combustion of fossil fuels.
(i) Outline a procedure that could be used to distinguish between theproducts of complete and incomplete combustion of a fossil fuel.
(ii) Explain ONE effect on the environment resulting from the incompletecombustion of fossil fuels.
(c) The table provides data on different sources of electricity generation for acountry, and the price per megawatt-hour (MWh).
* Projected values
Analyse the main trends shown in the data.
Question 28 continues on page 29
Amount of power commercially generated (MW)
Year Solar Hydroelectric Nuclear Coal Total
1970 2 183 125 1890 22001980 9 453 415 2223 31001990 24 579 709 2651 39632000 48 651 450 2871 40202010* 331 904 149 2662 4046
Price per MWh ($) (includes capital costs)
Year Solar Hydroelectric Nuclear Coal
1970 62 32 28 241980 58 32 29 201990 48 32 30 172000 40 31 30 202010* 28 31 32 21
4
2
2
2
1
– 28 –
Marks
Question 28 (continued)
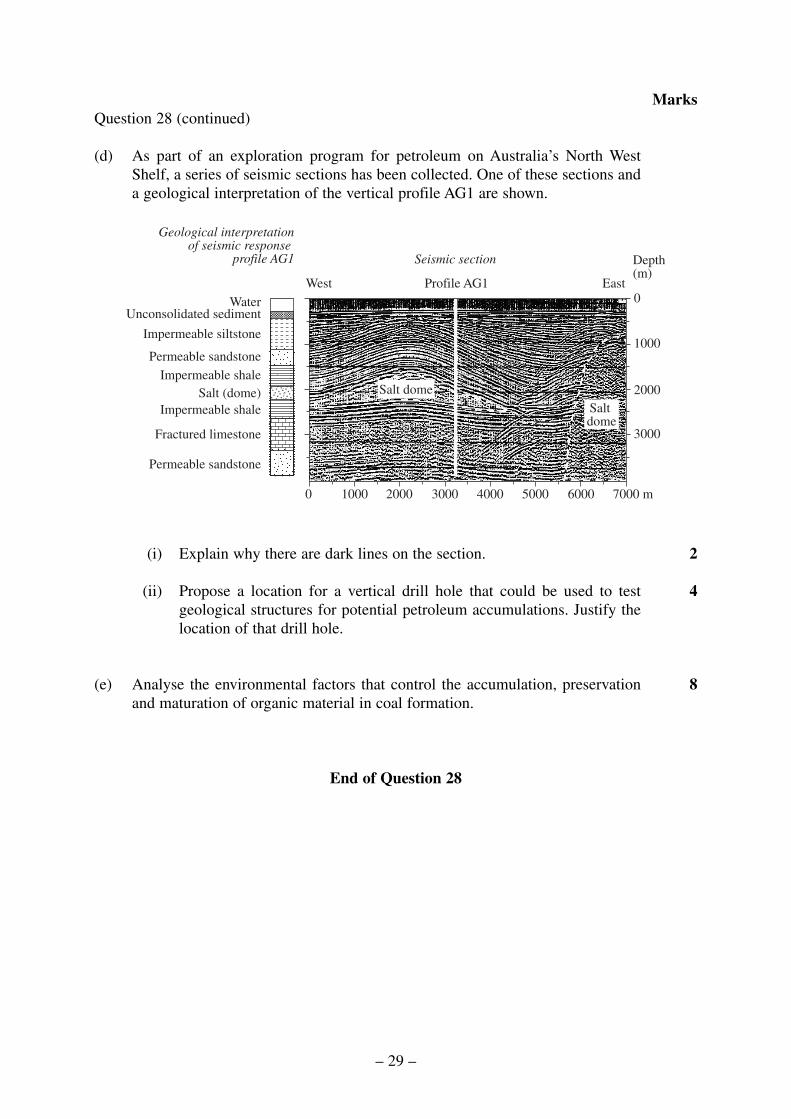
(d) As part of an exploration program for petroleum on Australia’s North WestShelf, a series of seismic sections has been collected. One of these sections anda geological interpretation of the vertical profile AG1 are shown.
(i) Explain why there are dark lines on the section.
(ii) Propose a location for a vertical drill hole that could be used to testgeological structures for potential petroleum accumulations. Justify thelocation of that drill hole.
(e) Analyse the environmental factors that control the accumulation, preservationand maturation of organic material in coal formation.
End of Question 28
8
4
2
Salt domeSalt dome
0 1000 2000 3000 4000 5000 6000
0
1000
2000
3000
7000 m
WaterUnconsolidated sediment
Impermeable siltstone
Permeable sandstone
Impermeable shaleSalt (dome)
Impermeable shale
Fractured limestone
Permeable sandstone
Geological interpretationof seismic response
profile AG1
West EastProfile AG1
Seismic section Depth(m)
– 29 –
Marks

Question 29 — Mining and the Australian Environment (25 marks)
(a) (i) Identify ONE landmark decision that has affected mining operations inAustralia.
(ii) Explain the possible effect of this landmark decision on the exploitationof an ore deposit.
(b) In your study of Mining and the Australian Environment, you have studied aspecific mineral deposit.
(i) Name the mineral deposit, and state TWO factors considered indetermining the feasibility of mining that deposit.
(ii) Explain how ONE government policy may have affected the decision tomine the deposit.
Question 29 continues on page 31
2
2
2
1
– 30 –
Marks

Question 29 (continued)
(c) Production at the Millennium Zinc Mine commenced in 1985. The graphs showdata relating to mine production, costs and income.
The cost relating to mine development prior to 1985 has been included in the1985 costs. Costs relating to mine closure and environmental monitoring havebeen included in the 1995 costs.
Analyse the data to determine the effect of the main economic components ofthe mining operation on the profit.
Question 29 continues on page 32
0
1
2
3
Price of zinc ($ per kg)
Tonnage mined (million tonnes)
9594939291908988878685Year
–50
0
50
100
150
Total costs
9594939291908988878685
$ M
illio
n
Open-cut operation Underground operation
Profit
–100
Income
Year
4
– 31 –
Marks

Question 29 (continued)
(d) The diagram shows the processes leading to the production of a base metalmineral deposit in an island arc setting.
(i) Describe how the processes shown in the diagram can produce a basemetal mineral deposit.
(ii) For ONE exploration method that you have studied, discuss whether themethod could be used to locate this type of mineral deposit in an ancientisland arc setting.
(e) Evaluate the likely impacts on the environment of exploration, mining andprocessing methods at ONE deposit that you have studied.
End of Question 29
8
4
2
Base metalmineral deposit
Black smoker
Magma
Sea water
Plume
– 32 –
Marks

Question 30 — Oceanography (25 marks)
(a) (i) Identify the end of the visible light spectrum that can penetrate furthestinto seawater.
(ii) Describe ONE effect of differential light penetration on the distributionof marine plants.
(b) In your study of Oceanography, you have undertaken first-hand investigations ofthe effect of temperature on the precipitation of common salts.
(i) Describe the procedure that you performed to test this effect.
(ii) Explain ONE implication of these investigations for your understandingof naturally-occurring bodies of water.
(c) Describe the characteristics and processes at hydrothermal vents.
Your answer should consider both mineral deposits and biotic communities.
Question 30 continues on page 34
4
2
2
2
1
– 33 –
Marks

Question 30 (continued)
(d) The diagram shows an area north-east of Australia. The mid-ocean ridge andrates of spreading (in millimetres per year) are indicated for the Woodlark Basin.
(i) Describe ONE method that could be used to date the ocean floor in theWoodlark Basin.
(ii) Explain the likely outcomes of the tectonic processes operating withinthe Solomon Sea and Woodlark Basin regions.
(e) Analyse how the use of echo sounders and magnetometers has improved ourunderstanding of the oceans.
End of paper
8
4
2
SOLOMON SEA
CORAL SEA
BASIN
3653
67WOODLARK
SOLOMON ISLANDS
NEW GUINEA
AUSTRALIA
NEW BRITAIN
Subduction zone
Mid-ocean ridge
Sea floor < 1 Ma BP
Continent/ocean boundary in Woodlark Basin
– 34 –
Marks

BLANK PAGE
– 35 –

Geological Time Scale
0
2
5
10
20
30
40
50
60
70
100
200
300
400
500
600
1000
2000
3000
4000 Hadean
Archaean
EON ERA
Oligocene
Eocene
Pliocene
Pleistocene
EPOCH
Quaternary
PERIOD
Tertiary
Cretaceous
Permian
Jurassic
Triassic
DevonianSilurian
Ordovician
Cambrian
Carboniferous
Miocene
Palaeocene
Prot
eroz
oic
Phan
eroz
oic
Cen
ozoi
cPa
laeo
zoic
Mes
ozoi
c
Ma
BP
Holocene
– 36 –
© Board of Studies NSW 2001