Embed Size (px)
Citation preview

2010 H I G H E R S C H O O L C E R T I F I C AT E
E X A M I N AT I O N
Earth and Environmental Science
General Instructions
• Reading time – 5 minutes
• Working time – 3 hours
• Write using black or blue pen
• Draw diagrams using pencil
• Board-approved calculators may be used
• A Geological Time Scale is provided at the back of this paper
• Write your Centre Number and Student Number at the top of pages 13, 17 and 21
Total marks – 100
Section I Pages 2–23
75 marks
This section has two parts, Part A and Part B
Part A – 20 marks
• Attempt Questions 1–20
• Allow about 35 minutes for this part
Part B – 55 marks
• Attempt Questions 21–30
• Allow about 1 hour and 40 minutes for this part
Section II Pages 25–33
25 marks
• Attempt ONE question from Questions 31–34
• Allow about 45 minutes for this section
1110

Section I 75 marks
Part A – 20 marks Attempt Questions 1–20 Allow about 35 minutes for this part
Use the multiple-choice answer sheet for Questions 1–20.
1 What is the most common rock type found in oceanic crust?
(A) Basalt
(B) Granite
(C) Mudstone
(D) Limestone
2 What is the major cause of earthquak es that occur on the Australian continent?
(A) Stress at convergent plate boundaries
(B) Continental volcanic activity
(C) Thermal uplift and rifting
(D) Intra-plate stress
3 Which of the follo wing best describes the direction of the gro wth of the Australian continent over geological time?
(A) North to south
(B) South to north
(C) West to east
(D) East to west
4 Which of the follo wing is true according to the con vection current hypothesis of plate motion?
(A) Hot spots in the mantle cause lithospheric thick ening.
(B) Down-welling in the mantle causes transform f aults.
(C) Upwelling in the mantle pushes plates apart.
(D) Colder regions in the mantle attract plates.
– 2 –

5 The diagram shows the first stage of the plate tectonic supercycle.
What is the correct order for the remaining stages?
(A) 2, 3, 1, 4
(B) 2, 3, 4, 1
(C) 2, 1, 3, 4
(D) 2, 1, 4, 3
– 3 –
Awaiting copyright

– 4 – 3 – 2 – 1 0 + 1 + 2 + 3
+0.3
+0.2
+0.1
0
–0.1
–0.2
–0.3 – 4 – 3 – 2 – 1
Years before eruption Years after eruption
Using the information in the graph, which of the follo wing hypotheses is correct?
Tem
pera
ture
var
iatio
n (°
C)
0 + 1 + 2 + 3 + 4 + 5
6 Scientists used temperature records to e xamine the ef fect of eight lar ge v olcanic eruptions during the past tw o centuries. The graph sho ws the a verage v ariation in temperature in the Northern Hemisphere before and after these eruptions.
7 Which of the following is used to divide the major divisions of the Geological Time Scale after the Archaean?
(A) Volcanic eruptions influence global temperatures before and after an eruption.
(B) Volcanic eruptions cause a decrease in temperatures in the Northern Hemisphere after an eruption.
(C) Volcanic eruptions have no influence on temperatures in the Northern Hemisphere before or after an eruption.
(D) Volcanic eruptions cause an increase in global temperatures before an eruption and a decrease in temperatures after an eruption.
(A) Major ice ages
(B) Megafauna extinctions
(C) Stratigraphic correlation
(D) Appearance and disappearance of significant fossils
– 4 –

8 Why was atmospheric ozone important for the e volution of early life?
(A) It led to a decrease in the oxygen concentration of the atmosphere.
(B) It led to an increase in the oxygen concentration of the atmosphere.
(C) It reduced the intensity of infrared radiation reaching Earth’ s surface.
(D) It reduced the intensity of ultraviolet radiation reaching Earth’s surface.
9 Which of the following is the oldest life form?
(A) Algae
(B) Cyanobacteria
(C) Ediacaran metazoans
(D) Single-celled animals
10 Which of the following ratios is used to determine the e xistence of early life on Earth?
(A) Carbon-14 to carbon-12
(B) Carbon-13 to carbon-12
(C) Oxygen-18 to oxygen-16
(D) Carbon-14 to nitrogen-14
11 Which of the follo wing was the critical e volutionary development that allowed animals to survive in terrestrial environments?
(A) An internal skeleton for support
(B) An efficient circulatory system
(C) An ability to minimise water loss
(D) An ability to regulate body temperature
12 Which of the following potential causes best e xplain the extinction of the megafauna in Australia?
(A)
(B)
(C)
(D)
Volcanic eruptions European settlement
European settlement Climate change
Hunting by humans Volcanic eruptions
Climate change Hunting by humans
– 5 –

Late
Precambrian Cambrian
Ordovician Silurian
Late
Key Soft-bodied organisms Animals with hard parts Vertebrates
(A) (B)
Num
ber
of s
peci
es
Precambrian Cambrian
Num
ber
of s
peci
esOrdovician
Silurian
(C) (D)
Late
Precambrian Cambrian
Ordovician Silurian
Num
ber
of s
peci
es
Late
Precambrian Cambrian
Ordovician Silurian
Num
ber
of s
peci
es
13 Which graph best sho ws the changes in the number of species before and after the Cambrian event?
– 6 –

14 Four processes used in the treatment of se wage are:
I Removal of harmful micro-organisms II Filtration/Screening III Sedimentation IV Bacterial digestion of organic matter
What is the correct sequence of these processes in the treatment of se wage?
(A) II, I, III, IV
(B) II, III, IV, I
(C) III, IV, II, I
(D) III, II, IV, I
15 The diagram sho ws one step in an e xperiment to simulate the ef fectiveness of a w ater treatment process.
Which stage in a water treatment process was being simulated with this apparatus?
(A) Filtration
(B) Leaching
(C) Precipitation
(D) Sedimentation
– 7 –
16 In the last decade the water quality of the Murray River has been deteriorating.
What would be the most effective way of reversing this situation?
(A) Plant more trees
(B) Grant more irrigation licences
(C) Increase environmental flows in the Murray River
(D) Increase the number of artesian bores near the Murray Ri ver
17 Clearing vegetation for urbanisation can lead to increased e xposure and compaction of soils, reduced infiltration of waters, and changed water flows.
What is the main consequence of these three changes?
(A) Decreased salinity
(B) Increased soil erosion
(C) Lowering of the water table
(D) Decreased sedimentation in rivers
18 Which of the following is likely to have caused an increase in stratospheric ozone?
(A) Using more nuclear power
(B) Developing more efficient engines
(C) Implementing the Kyoto Protocol
(D) Implementing the Montreal Protocol
– 8 –

19 The sequence summarises the first stages in the depletion of ozone in the stratosphere.
What is substance X?
(A) CFCs
(B) Ozone
(C) Oxygen
(D) Carbon dioxide
Awaiting copyright
– 9 –

20 The graph displays results for management strate gies used in wheat paddocks in western NSW.
50
40
30
20
10
0
Bare fallow
Stubble mulch
Stubble incorporated
Zero tillage
Soil loss (t/ha/yr)
0 20 40 60 80 100
Vegetation cover (%)
Management strategy Treatment
Bare fallow Burn wheat after harvesting
Stubble incorporated Plough paddock after harvesting
Stubble mulch Cut stubble to ground but leave it on the ground
Zero tillage Leave stubble standing
Using the data given, which of the follo wing treatments would lead to least soil erosion in a wheat paddock?
(A) Leave stubble standing
(B) Burn wheat after harvesting
(C) Plough paddock after harvesting
(D) Cut stubble to ground but leave it on the ground
– 10 –

BLANK PAGE
– 11 –

BLANK PAGE
– 12 –
© Board of Studies NSW 2010

2010 HIGHER SCHOOL CERTIFICATE EXAMINATION
Earth and Environmental Science Centre Number
Section I (continued)
Part B – 55 marks Attempt Questions 21–30 Allow about 1 hour and 40 minutes for this part
Student Number
Answer the questions in the spaces pro vided. These spaces provide guidance for the e xpected length of response.
Question 21 (6 marks)
Mount Merapi is a large composite volcano in central Java, Indonesia. More than half a million people li ve in to wns and villages close to the v olcano. Agriculture is the main land use in the area.
(a) Name and describe TW O physical hazards that e xist for organisms living near 2 volcanoes such as Mount Merapi.
...............................................................................................................................
...............................................................................................................................
...............................................................................................................................
...............................................................................................................................
(b) Name and explain how TWO features of volcanic regions such as Mount Merapi 4 benefit agriculture.
...............................................................................................................................
...............................................................................................................................
...............................................................................................................................
...............................................................................................................................
...............................................................................................................................
...............................................................................................................................
...............................................................................................................................
...............................................................................................................................
1111 – 13 –
Question 22 (8 marks)
The diagram shows the location of major earthquakes and active volcanoes in the northern Pacific Ocean over the last 20 years.
(a) Identify the type of plate boundary at Y and describe the relative motion of the 2 plates on each side of the boundary.
...............................................................................................................................
...............................................................................................................................
Question 22 continues on page 15
Awaiting copyright
– 14 –

3
Question 22 (continued)
(b) Draw a labelled cross-section across the plate boundary from A to B.
(c) Account for the lower number of volcanoes on the west coast of North America near Y compared to the western Pacific region.
...............................................................................................................................
...............................................................................................................................
...............................................................................................................................
...............................................................................................................................
...............................................................................................................................
...............................................................................................................................
End of Question 22
– 15 –
3

Question 23 (5 marks)
Examples of a trilobite species are found in rocks from the be ginning of the Ordovician Period to the end of the De vonian Period.
(a) Using the Geological T ime Scale on page 36, calculate ho w long this trilobite 1 species lived on Earth.
...............................................................................................................................
(b) Contrast the use of relati ve and absolute dating techniques for determining the 4 age of this trilobite species.
...............................................................................................................................
...............................................................................................................................
...............................................................................................................................
...............................................................................................................................
...............................................................................................................................
...............................................................................................................................
...............................................................................................................................
...............................................................................................................................
– 16 –
© Board of Studies NSW 2010

2010 HIGHER SCHOOL CERTIFICATE EXAMINATION
Earth and Environmental Science Centre Number
Section I – Part B (continued)
Student Number
Question 24 (4 marks)
The picture shows a fossil human footprint at Lake Mungo, dated at 20 000 years old (20ka).
Showing at least THREE stages, dra w a flo wchart to describe ho w this fossil w as 4 formed.
1112 – 17 –

1
Question 25 (6 marks)
(a) Identify ONE impact of saline soils on the biotic en vironment.
...............................................................................................................................
...............................................................................................................................
(b) (i) Outline ONE rehabilitation strate gy that could be used to o vercome a 2 salinity problem in a salt-affected area.
...................................................................................................................
...................................................................................................................
...................................................................................................................
...................................................................................................................
(ii) Explain the scientif ic basis for the use of the strate gy proposed in 3 part (b) (i).
...................................................................................................................
...................................................................................................................
...................................................................................................................
...................................................................................................................
...................................................................................................................
...................................................................................................................
– 18 –

2
Question 26 (9 marks)
Mass extinctions occurred at the end of the Cretaceous and Permian periods.
(a) Identify TWO valid hypotheses for the causes of each mass e xtinction.
Hypothesis 1 Hypothesis 2
Cretaceous mass extinction
Permian mass extinction
(b) Assess the evidence for ONE of these four hypotheses.
Extinction event:............................................................................
Hypothesis: ....................................................................................
...............................................................................................................................
...............................................................................................................................
...............................................................................................................................
...............................................................................................................................
...............................................................................................................................
...............................................................................................................................
...............................................................................................................................
...............................................................................................................................
(c) How does the theory of evolution explain the development of new species after a mass extinction?
...............................................................................................................................
...............................................................................................................................
...............................................................................................................................
...............................................................................................................................
...............................................................................................................................
...............................................................................................................................
– 19 –
4
3

BLANK PAGE
– 20 –
© Board of Studies NSW 2010
2010 HIGHER SCHOOL CERTIFICATE EXAMINATION
Earth and Environmental Science Centre Number
Student Number
Section I – Part B (continued)
Question 27 (4 marks)
Design an investigation to determine the ef fect of either compaction or tracking on a soil.
.........................................................................................................................................
.........................................................................................................................................
.........................................................................................................................................
.........................................................................................................................................
.........................................................................................................................................
.........................................................................................................................................
.........................................................................................................................................
.........................................................................................................................................
1113 – 21 –
4

Question 28 (3 marks)
Account for the low fertility of most Australian soils.
.........................................................................................................................................
.........................................................................................................................................
.........................................................................................................................................
.........................................................................................................................................
.........................................................................................................................................
.........................................................................................................................................
.........................................................................................................................................
.........................................................................................................................................
3
Question 29 (2 marks)
The diagram shows a food chain for a ri ver estuary.
Small phytoplankton
Small zooplankton Crustaceans
Shark Fish
Describe the impact that pesticides may ha ve on the river estuary food chain shown.
.........................................................................................................................................
.........................................................................................................................................
.........................................................................................................................................
........................................................................................................................................
2
– 22 –

8
Question 30 (8 marks)
Earth’s climate has varied since the Earth formed.
Analyse the influence of geological processes over time, and human activity since the Industrial Revolution, on climate.
.........................................................................................................................................
.........................................................................................................................................
.........................................................................................................................................
.........................................................................................................................................
.........................................................................................................................................
.........................................................................................................................................
.........................................................................................................................................
.........................................................................................................................................
.........................................................................................................................................
.........................................................................................................................................
.........................................................................................................................................
.........................................................................................................................................
.........................................................................................................................................
.........................................................................................................................................
.........................................................................................................................................
.........................................................................................................................................
.........................................................................................................................................
.........................................................................................................................................
.........................................................................................................................................
.........................................................................................................................................
.........................................................................................................................................
.........................................................................................................................................
.........................................................................................................................................
.........................................................................................................................................
.........................................................................................................................................
.........................................................................................................................................
– 23 –

BLANK PAGE
– 24 –
© Board of Studies NSW 2010
2010 HIGHER SCHOOL CERTIFICATE EXAMINATION
Earth and Environmental Science
Section II
25 marks Attempt ONE question from Questions 31–34 Allow about 45 minutes for this section
Answer parts (a)–(c) of the question in a writing booklet. Answer the rest of the question in a SEPARATE writing booklet. Extra writing booklets are a vailable.
Pages
Question 31 Introduced Species and the Australian Environment ................. 26
Question 32 Organic Geology – a Non-renewable Resource ........................ 28
Question 33 Mining and the Australian Environment ................................... 30
Question 34 Oceanography ............................................................................ 32
1114 – 25 –

1986
–87
1990
–91
1994
–95
1998
–99
2002
–03
2006
–07
2007
–08
Cou
nts
per
10 k
m tr
anse
ct
120
100
80
60
40
20
Key Tasmanian devil Introduced pest species
0
Courtesy of Gregory J. Hocking, Department of Primary Industries, Parks, Water and Environment
Question 31 — Introduced Species and the Australian Environment (25 marks)
Answer parts (a)–(c) in a writing booklet.
(a) Describe TWO methods used by Australian quarantine agencies to pre vent the 4 introduction of a new species into Australia.
(b) The graph sho ws the numbers of T asmanian devils and an introduced animal pest in Tasmania.
(i) Describe the trends in the graph for the T asmanian de vil from 1 1999 to 2006.
(ii) Why has the population of the introduced pest species increased in 3 Tasmania?
(c) A sensitive area of b ush has been in vaded by lantana and bitou b ush. Only a 4 small number of the native plants still survive. The area is to be rehabilitated.
Compare the Bradley method of re generation with ONE other method of b ush regeneration suitable for this area.
Question 31 continues on page 27
– 26 –
Question 31 (continued)
Answer parts (d)–(f) in a SEPARATE writing booklet.
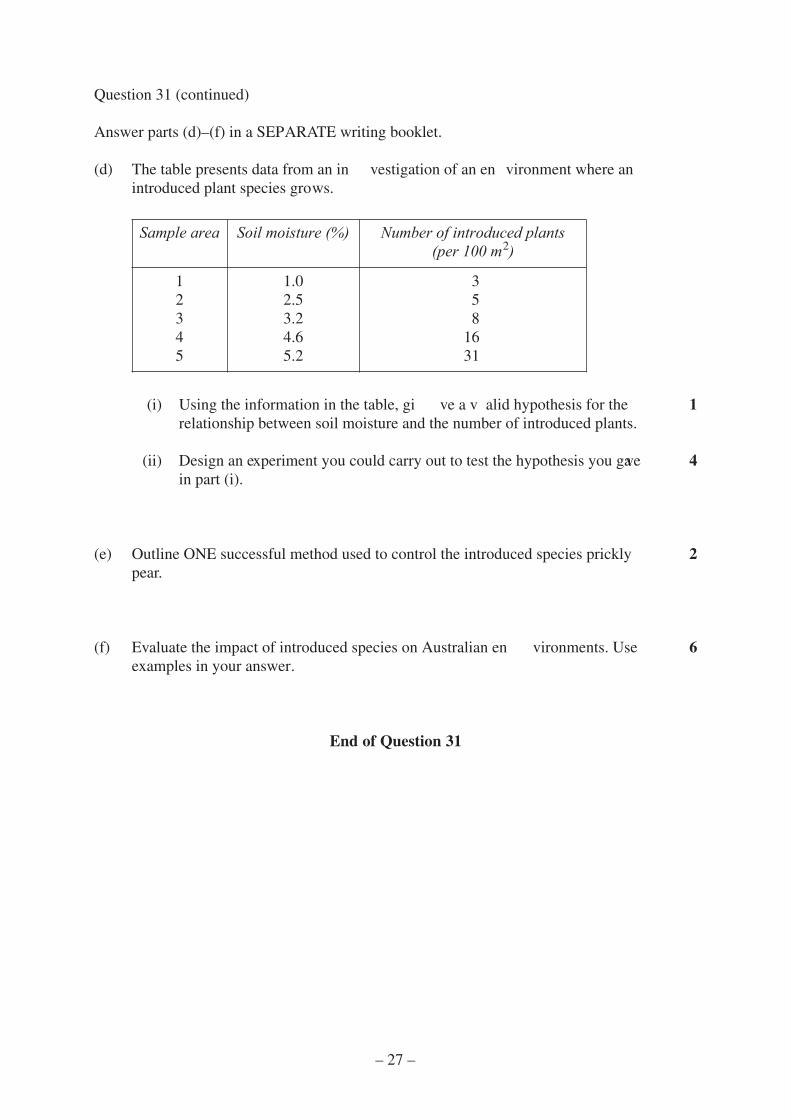
(d) The table presents data from an in vestigation of an en vironment where an introduced plant species grows.
Sample area Soil moisture (%) Number of introduced plants (per 100 m2)
1 2 3 4 5
1.0 2.5 3.2 4.6 5.2
3 5 8
16 31
(i) Using the information in the table, gi ve a v alid hypothesis for the 1 relationship between soil moisture and the number of introduced plants.
(ii) Design an experiment you could carry out to test the hypothesis you gave 4 in part (i).
(e) Outline ONE successful method used to control the introduced species prickly 2 pear.
(f) Evaluate the impact of introduced species on Australian en vironments. Use 6 examples in your answer.
End of Question 31
– 27 –

4
Question 32 — Organic Geology – a Non-renewable Resource (25 marks)
Answer parts (a)–(c) in a writing booklet.
(a) Name ONE renewable and ONE non-renewable resource. Describe how each is used as an energy source.
(b) The graph sho ws the relationships between vitrinite reflectance and carbon content of a coal.
Vitr
inite
ref
lect
ance
(%
)
0
2
4
6
8
10
50 55 60 65 70 75 80 85 90 95
Carbon content (%)
(i) Describe the trend in the graph for vitrinite reflectance. 1
(ii) What c hanges, a part from vitrinite reflectance, occur during 3 coalification?
(c) (i) Identify ONE geophysical method used to locate potential hydrocarbon 1 deposits.
(ii) How does petroleum accumulate? 3
Question 32 continues on page 29
– 28 –

Question 32 (continued)
Answer parts (d)–(e) in a SEPARATE writing booklet.
(d) The table presents data for an investigation carried out to test the energy yield of various fuel types.
Fuel type Carbon content (%) Energy output (MJ/kg)
Wood Black coal LPG Petroleum Alcohol
45 68 82 85 88
16 26 48 49 50
(i) Using the information in the table, gi ve a v alid hypothesis for the 1 relationship between carbon content and energy output.
(ii) Design an experiment you could carry out to test the hypothesis you gave 4 in part (i).
(iii) Outline TWO ways of limiting emissions from the comb ustion of fossil 2 fuels.
(e) Evaluate the potential of other energy sources as alternatives to fossil fuels. Use 6 examples in your answer.
End of Question 32
– 29 –
4
Question 33 — Mining and the Australian Environment (25 marks)
Answer parts (a)–(c) in a writing booklet.
(a) Name and describe TWO geophysical methods for locating ore deposits.
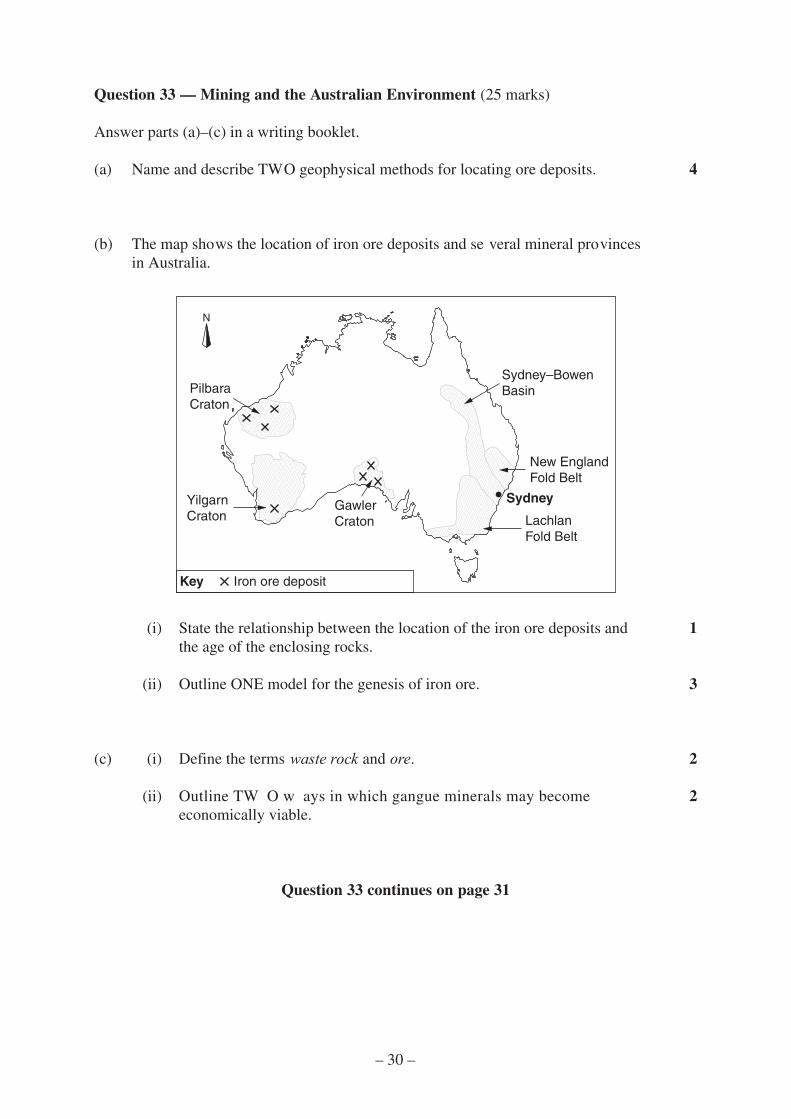
(b) The map shows the location of iron ore deposits and se veral mineral provinces in Australia.
Key Iron ore deposit
N
Pilbara Craton
Yilgarn Craton
Gawler Craton Lachlan
Fold Belt
New England Fold Belt
Sydney–Bowen Basin
Sydney
(i) State the relationship between the location of the iron ore deposits and 1 the age of the enclosing rocks.
(ii) Outline ONE model for the genesis of iron ore. 3
(c) (i) Define the terms waste rock and ore. 2
(ii) Outline TW O w ays in which gangue minerals may become 2 economically viable.
Question 33 continues on page 31
– 30 –

Question 33 (continued)
Answer parts (d)–(f) in a SEPARATE writing booklet.
(d) Samples of ore from a mine containing an iron mineral and silicates were tested with a magnetometer. Results of the tests are gi ven in the table.
Ore sample Iron content (%) Magnetic intensity (SI units)
1 2 3 4 5
0.01 0.5 1 6
13
1 6
12 71
150
(i) Using the information in the table gi ve a v alid hypothesis for the 1 relationship between iron content and magnetic intensity.
(ii) Design an experiment you could carry out to test the hypothesis you gave 4 in part (i).
(e) Why is an Environmental Impact Statement carried out before mining a mineral 2 deposit?
(f) Evaluate the role of non-geological f actors in determining the future e xpansion 6 of the mining industry in Australia. Use e xamples in your answer.
End of Question 33
– 31 –

(i) Describe the main circulation pattern of water in the Pacific Ocean. 1
(ii) Outline how the oxygen supply on the ocean floor is rene wed. 3
(c) (i) Explain why the margins of ocean basins are older than their centres. 2
(ii) Outline ho w ONE technological de velopment has impro ved our 2 understanding of the age of the sea floor .
Question 34 continues on page 33
Awaiting copyright
Question 34 — Oceanography (25 marks)
Answer parts (a)–(c) in a writing booklet.
(a) Describe deep-sea and continental margin sediments in the Pacific Ocean. 4
(b) The diagram shows major currents in the Pacific, Indian and Atlantic Oceans.
– 32 –

Question 34 (continued)
Answer parts (d)–(e) in a SEPARATE writing booklet.
(d) The table presents data for a re gion in the Southern Ocean.
Sample Water temperature (°C)
Potassium chloride solubility (g/L)
1 2 3 4 5
1.0 2.5 3.2 4.6 5.2
5 10 16 20 39
(i) Using the information in the table, gi ve a v alid hypothesis for the 1 relationship between w ater temperature and potassium chloride solubility.
(ii) Design an in vestigation you could carry out to test the hypothesis you 4 gave in part (i).
(iii) Apart from temperature, outline how TWO other factors affect salinity in 2 oceans.
(e) Evaluate the impact of la ws to re gulate society’ s use of the oceans. Use 6 examples in your answer.
End of paper
– 33 –

BLANK PAGE
– 34 –

BLANK PAGE
– 35 –

Geological Time Scale
EON ERA PERIOD EPOCH
0
2
5
10
20
30
40
50
60
Ma
BP
70
100
200
300
400
500
600
1000
2000
3000
4000 Hadean
Archaean
Oligocene
Eocene
Pliocene
PleistoceneQuaternary
Tertiary
Cretaceous
Permian
Jurassic
Triassic
Devonian Silurian
Ordovician
Cambrian
Ediacaran
Carboniferous
Miocene
Palaeocene
Prot
eroz
oic
Phan
eroz
oic
Cen
ozoi
cPa
laeo
zoic
M
esoz
oic
Holocene
– 36 –
© Board of Studies NSW 2010