Embed Size (px)
Citation preview

1
October 29, 2008SOFTBANK CORP.
Earnings Results for the Second Quarter Ended
September 30, 2008(H1/FY2008)
February 25, 2010 VersionDue to protection of rights, some of the photos and images included at the time of publication have been modified or revised.

2
<Highlights>
1. Operating income: JPY180.0bn (7.3%YoY)Highest ever since inception
2. FCF improved by ¥238.9bn (YoY)
3. Mobile business: No. 1 net adds for 17 consecutive months

3
Earnings Results

4
H1/FY08 Summary of Consolidated Earnings
(35.7)1,364.71,328.9Net Sales21.2314.2335.5EBITDA12.2167.7180.0Operating income
(5.3)46.441.1Net income
(7.7)122.9115.2Income before
income taxes and minority interests
6.1111.1117.3Ordinary income
H1/FY07(Apr – Sep 2007)
H1/FY08(Apr – Sep 2008)
YoY
<bn JPY>

5
324.2Operating income
(164.2)Free Cash Flow
(322.4)Investing Cash Flow(mainly CAPEX)
158.2Operating Cash Flow
Performance Forecast<bn JPY>
FY2007

6
340.0324.2Operating income
140.0(164.2)Free Cash Flow
(280.0)(322.4)Investing Cash Flow(mainly CAPEX)
158.2 420.0Operating Cash Flow
Performance Forecast<bn JPY>
FY2007 FY2008(forecast)
Improved JPY300.0bn

7
420.0340.0324.2Operating income
250.0140.0(164.2)Free Cash Flow
(250.0)(280.0)(322.4)Investing Cash Flow(mainly CAPEX)
158.2 500.0420.0Operating Cash Flow
Performance Forecast<bn JPY>
Improved JPY110.0bn
FY2007 FY2008(forecast)
FY2009(forecast)

8
250.0
140.0
-164.2-200
-150
-100
-50
0
50
100
150
200
250
300 Forecast
*Free Cash Flow (FCF) = Cash flows from operating activities + cash flows from investing activities
FY07 FY09(Forecast)
FY08(Forecast)
Significant improvement
projected
Forecast of Free Cash Flow<bn JPY>

9
Balance of Borrowings Associated with Acquisition of Mobile Business
Forecast
Minimum
<bn JPY>
Steadilyrepaying
* Initial borrowing: Nov 2006* WBS Balance borrowed by SBM
0
200
400
600
800
1,000
1,200
1,400
Initia
l bal
ance
FY20
09
FY20
10
FY20
11
FY20
12
FY20
13
FY20
14
FY20
15
FY20
16
FY20
17
FY20
18

10
Consolidated Net Sales (Apr - Sep)
1,328.91,364.7
1,120.1
0
200
400
600
800
1,000
1,200
1,400
1,600
<bn JPY>
Mobile Communications
Others
e-Commerce
Internet Culture
Fixed-line Telecommunications
Broadband Infrastructure
H1FY2006
H1FY2007
H1FY2008
*Operating results of SOFTBANK MOBILE Corp., were consolidated from May 1, 2006
581.8
127.4
166.2
89.6117.0
808.9
126.7
157.8108.8
118.5
770.1
116.9
156.6
124.1122.2

11
Consolidated EBITDA (Apr - Sep)
228.4
314.2335.5
-50
0
50
100
150
200
250
300
350
400 <bn JPY>
*Operating results of SOFTBANK MOBILE Corp., were consolidated from May 1, 2006
Highest ever
Mobile Communications
Otherse-CommerceInternet CultureFixed-line Telecommunications
Broadband Infrastructure
Increase in all segments
129.4
24.422.8
49.1
196.5
33.422.4
60.1
200.5
33.8
28.6
66.7
H1FY2006
H1FY2007
H1FY2008

12
Consolidated Operating Income (Apr - Sep)
180.0167.7
112.5
-50
0
50
100
150
200
<bn JPY>
*Operating results of SOFTBANK MOBILE Corp., were consolidated from May 1, 2006
Mobile Communications
Otherse-CommerceInternet CultureFixed-line TelecommunicationsBroadband Infrastructure
Highest ever
56.6
11.6
44.3
94.2
18.9
54.9
88.1
22.2
61.1
5.5
H1FY2006
H1FY2007
H1FY2008

13
Consolidated Ordinary Income (Apr - Sep)
62.6
111.1117.3
0
20
40
60
80
100
120
140
H1/FY2008JPY 117.3bn
<bn JPY>
*Operating results of SOFTBANK MOBILE Corp., were consolidated from May 1, 2006
H1FY2006
H1FY2007
H1FY2008

14
Consolidated Net Income (Apr - Sep)
14.4
33.437.3
12.9 3.7
14.4
41.1
46.4
0
10
20
30
40
50 <bn JPY>
*Operating results of SOFTBANK MOBILE Corp., were consolidated from May 1, 2006
Temporal factors due to special income/loss (net) and release of income tax payable at a subsidiary in U.S.
H1/FY08JPY 41.1bn
H1FY2006
H1FY2007
H1FY2008

15
Consolidated Net Income (Apr - Sep)
BB Mobile, SOFTBANK MOBILE, etc.39.017.4Income tax: Deferred
16.834.4Income tax: Current
46.4
20.5
122.9
11.7
111.1
H1/FY07(Apr – Sep 2007)
Valuation loss on investment securities (3.1)(2.1)Special income/
loss (net)
115.2Income before income taxesand minority interests
117.3Ordinary income
Mainly Yahoo Japan Corporation22.2Minority interests
41.1Net income
NotesH1/FY08(Apr – Sep 2008)
<bn JPY>
16
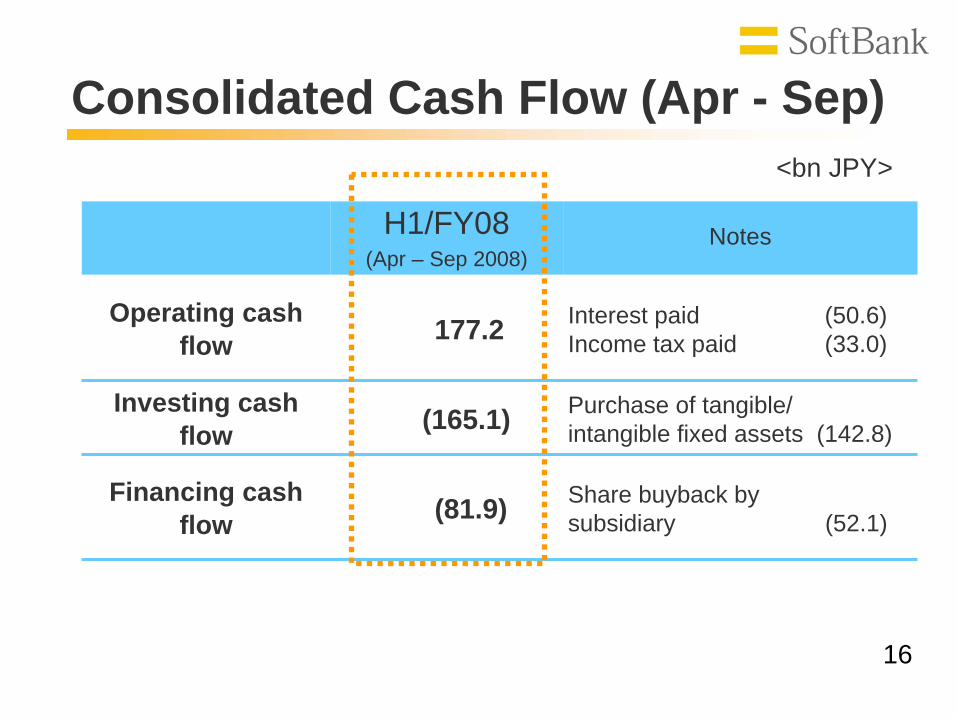
Consolidated Cash Flow (Apr - Sep)
Share buyback by subsidiary (52.1)
Purchase of tangible/intangible fixed assets (142.8)
Interest paid (50.6)Income tax paid (33.0)
NotesH1/FY08(Apr – Sep 2008)
(165.1)Investing cash flow
(81.9)Financing cash flow
177.2Operating cash flow
<bn JPY>

17
0.4
177.2
0
50
100
150
200 <bn JPY>
H1FY2007
H1FY2008
Operating Cash Flow (Apr - Sep)
Improved by JPY 176.7bn
YoY

18
82.637.6
21.8 13.2
47.6
22.121.2
308.4
235.3
76.2
7.7
276.5
220.0
293.7
389.8
148.9105.6
0
50
100
150
200
250
300
350
400
450
Capital Expenditure (acquisition base/annual)<bn JPY>
Mobile Communications
Others
Fixed-line Telecommunications
Broadband Infrastructure
*Amounts above include on- and off-balance lease transactions.
FY2006 FY2007 FY2008
(annual plan)
FY2005
(annual forecast)
FY2009
H1

19
EBITDA – Capital Expenditure (Apr - Sep)
-176.8 -150.6-105.6
228.4
314.2335.5
51.5
163.6
229.9
-200
-100
0
100
200
300
400
Ability to generate CF steadily improving
EBITDACAPEX
*Amounts above include on- and off-balance lease transactions.Acquisition base
<bn JPY>
H1FY2006
H1FY2007
H1FY2008

20
Accelerated FCF Increase

21
Free Cash Flow (Apr - Sep)<bn JPY>
12.1
-226.8-300
-100
100
H1FY2008
H1FY2007
ImprovedJPY 238.9bn YoY
*Free Cash Flow (FCF) = Cash flows from operating activities + cash flows from investing activities

22
Affluent Cash Position

23
Cash Position
JPY 100.0bn
JPY 201.0bn(Last year: JPY 200.0bn)
Balance as of the end of Sep
Total credit line
Sufficient short-term funds available
Credit line facilityRenewed in Sep 2008
424.0
101.0
0
100
200
300
400
500
600
Cash position
Unused portion of credit line facility
End of SepFY2008
<bn JPY>
JPY 525.0bn
Mizuho Corporate Bank, Ltd. Sumitomo Mitsui Banking CorporationThe Bank of Tokyo-Mitsubishi UFJ, Ltd. Aozora Bank, Ltd.
Mitsubishi UFJ Trust and Banking Corporation The Sumitomo Trust and Banking Co., Ltd.
Mizuho Trust & Banking Co., Ltd. Citibank Japan Ltd.Royal Bank of Scotland plc 28 other banks
Participating Financial Institutions (total of 37 banks)

24
50.050.0
50.020.0
69.045.0
0
100
200
300
400
500
600
424.0
101.0
0
100
200
300
400
500
600
Corporate Bonds Redemption Schedule<bn JPY>
SBTM straight bondsSB straight bonds
SB convertible bonds
FY2008 FY2009
Abundant options for repayment available
* The convertible bonds with subscription warrants issued in Dec 2003 are included in the chart above assuming that bond holders exercise their put options.
* Market cap of listed shares held in the SOFTBANK Group is calculated based on the share price of investment securities (listed & public companies only). Shares held as collateral and others are excluded.
End of SepFY2008
Q1Q4Q3 Q2 Q4Q3
Unused portion of credit line facility
JPY 525.0bn
Cash position

25
Status of Interest-bearing Debt

26
Consolidated Interest-bearing Debt
2,606.32,494.9
0
500
1,000
1,500
2,000
2,500
3,000 <bn JPY>
Securitization of installment receivables (SOFTBANK MOBILE)
SBM loan(WBS)
Vodafone subordinated loan
Loans from other finacial institutions
Corporate bonds and CPEnd of Sep
FY2007End of Sep
FY2008* Loans from other financial institutions at the end of Sep 2007 are calculated using retroactive adjustments to add the cash received from marketable security lending of collateral. * Lease obligations are not included in the interest-bearing debt.
142.1
84.5
1,311.4
534.9
533.2
230.9
84.5
1,239.2
475.8
464.3

27
Financial Indexes

28
+10% 23.0%25.2%EBITDA margin(EBITDA/net sales)
+17%6.0 times5.0 timesNet D/E ratio(Net interest-bearing debt/total
shareholders’ equity)
+18%7.4 times6.0 timesD/E ratio(Interest-bearing debt/total
shareholders’ equity)
9.4%
H1/FY08(Apr 08 – Sep 08)
+18%7.9%Equity ratio(Total shareholders’ equity/total assets)
Improvement Rate
H1/FY07(Apr 07 – Sep 07)
* Interest-bearing debt for H1/FY07 is calculated using retroactive adjustments to add the cash received from marketable security lending of collateral.
Improvement in Major Financial Indexes

29
10%
15%
20%
25%
30%
EBITDA Margin by Segment
SOFTBANK Consolidation
Broadband InfrastructureMobile Communications
Fixed-line Telecommunications
*EBITDA margin = EBITDA/net sales
End SepFY06
End SepFY07
End SepFY08

30
SBM Debt Reduction Plan

31
Forecast
<bn JPY>
Steadily repaying
* Loan started: Nov. 2006* WBS balance mainly borrowed by SBM
Debt Balance After Mobile Business Acquisition
Minimum
0
200
400
600
800
1,000
1,200
1,400
Begi
nnin
g ba
lanc
e
FY20
09
FY20
10
FY20
11
FY20
12
FY20
13
FY20
14
FY20
15
FY20
16
FY20
17
FY20
18

32
Impact From Financial Market Deterioration

33
Former Vodafone K.K.corporate bonds
JPY 75.0bn
Requirement for the acquisition of Vodafone K.K.:Redemption before maturity of outstanding bonds
Collateralized Debt Obligation (CDO)
JPY 75.0bn
CashJPY 75.0bn
Rating: AA
160 Entities
In-Substance Redemption Before Maturity of Former Vodafone K.K. Corporate Bonds (in-substance defeasance)

34Funds for redemption have been secured by credit enhancement through Mizuho Corporate Bank, Ltd.
Approx. JPY 27.1bnImpact on net income after tax effect
Approx. JPY 45.6bnSpecial loss
<Impact on redemption of former Vodafone K.K. corporate bonds >Redemption of former Vodafone K.K. corporate bonds due 2 years from now (Aug/Sep 2010)
<In case of 7th default>
Approx. JPY 44.4bnImpact on net income after tax effect
Approx. JPY 75.0bnSpecial loss<In case of default of 8 or more entities>
<Current: 6 defaults>
Impact on Consolidated Results
No loss to be realized

35
1. No extraordinary loss to be incurred up to the 6th default
2. There are no other similar types of transactions
3. This loss is a one-time loss if at all
In-Substance Redemption Before Maturity of Former Vodafone K.K. Corporate Bonds (in-substance defeasance)

36
Business

37
Display prevented due to protection of rights.
Net Adds Share (interim period)
SOFTBANK
NTT DoCoMo
KDDI -10%
0%
10%
20%
30%
40%
50%
60%
70%
80% 3 Major Mobile Operators (interim period)
(%)
FY06 FY07 FY08
H1 H2
Source: Calculated by SOFTBANK based on the data of Telecommunications Carriers Association
SOFTBANK is No.1 in H1/FY08 too
H1 H2 H1

38
Display prevented due to protection of rights.
Net Additions (cumulative)
10
12
14
16
18
20
22
Mar Sep Mar Sep Mar Sep Mar Sep
Cumulative Net Adds
19.63
(m)
Former Vodafone
FY05 FY06 FY07 FY08
Cumulative net additions 19.63m

39
Display prevented due to protection of rights.
Average Payment Per Subscriber
0
1,000
2,000
3,000
4,000
5,000
6,000
Q1 Q2 Q3 Q4 Q1 Q2 Q3 Q4 Q1 Q2
(JPY)
5,580 5,430 5,480 5,530 5,520 5,5405,590 5,700 5,570
Voice ARPU Installment
4,230 4,320 4,230 3,830 3,590 3,340 3,040 2,710
1,350 1,380 1,330 1,380 1,410 1,470 1,490 1,600
2,530
1,650
FY06 FY07 FY08
20 220 480 730 1,000 1,230 1,390
Data ARPU
2,460
1,710
1,540
5,720

40
Display prevented due to protection of rights.
Display prevented due to protection of rights.
Shift From Voice to Data
2G2G 3G3G
Voice
Data
ARPU
Data Data
Beyond 3G
VoiceVoice
Game
NewsMusicFinance
Auction
SNS
VideoShopping

41
SNS C2C
On-line Settlement
Search
B2B
On-line Advertisement
Strong Foothold in Asia

42
Economic Enterprise Value

43
250.0
140.0
-164.2-200
-150
-100
-50
0
50
100
150
200
250
300 Forecast
FY07 FY09(Forecast)
FY08(Forecast)
Forecast of Free Cash Flow<bn JPY>
*Free Cash Flow (FCF) = Cash flows from operating activities + cash flows from investing activities
Significant improvement
projected

44
SOFTBANK FY2009 (forecast) JPY140.0bn
Ranked within top 20
FY2008Free Cash Flow Top 20
Source: Weekly magazine ‘DIAMOND’ issued on 2008/6/7Companies which announced earnings results for fiscal years ending between April 2007 – February 2008, and companies whose fiscal year ended in March 2007 and announced their earnings results before May 22nd 2008, and companies whose net sales exceed JPY 50.0bn over a period of 12 months.
Free Cash Flow: Top 20
Rank Name FCF(bn JPY)
1 NIPPON TELEGRAPH AND TELEPHONECORPORATION
1,100.2
2 NTT DOCOMO, INC. 801.3
3 Nintendo Co.,Ltd. 565.6
4 Nissan Motor Co., Ltd. 474.7
5 Canon Inc. 406.8
6 Panasonic Corporation 404.7
7 Takeda Pharmaceutical Company Limited 394.2
8 MITSUI & CO., LTD. 311.0
9 Central Japan Railway Company 234.3
10 Seven & i Holdings Co., Ltd. 228.2
11 KYOCERA Corporation 211.8
12 DENSO CORPORATION 208.9
13 Chubu Electric Power Co., Inc. 199.2
14 Astellas Pharma Inc. 178.5
15 Hitachi, Ltd. 154.2
16 JFE Holdings, Inc. 141.0
17 Mitsubishi Motors Corporation 139.4
18 Japan Airlines Corporation 131.1
19 Kao Corporation 127.9
20 Mitsubishi Electric Corporation 126.5

45
SOFTBANK FY2009 (forecast) JPY140.0bn
Ranked within top 10
FY2008Free Cash Flow Top 20
Source: Weekly magazine ‘DIAMOND’ issued on 2008/6/7Companies which announced earnings results for fiscal years ending between April 2007 – February 2008, and companies whose fiscal year ended in March 2007 and announced their earnings results before May 22nd 2008, and companies whose net sales exceed JPY 50.0bn over a period of 12 months.
Free Cash Flow: Top 20
Rank Name FCF(bn JPY)
1 NIPPON TELEGRAPH AND TELEPHONECORPORATION
1,100.2
2 NTT DOCOMO, INC. 801.3
3 Nintendo Co.,Ltd. 565.6
4 Nissan Motor Co., Ltd. 474.7
5 Canon Inc. 406.8
6 Panasonic Corporation 404.7
7 Takeda Pharmaceutical Company Limited 394.2
8 MITSUI & CO., LTD. 311.0
9 Central Japan Railway Company 234.3
10 Seven & i Holdings Co., Ltd. 228.2
11 KYOCERA Corporation 211.8
12 DENSO CORPORATION 208.9
13 Chubu Electric Power Co., Inc. 199.2
14 Astellas Pharma Inc. 178.5
15 Hitachi, Ltd. 154.2
16 JFE Holdings, Inc. 141.0
17 Mitsubishi Motors Corporation 139.4
18 Japan Airlines Corporation 131.1
19 Kao Corporation 127.9
20 Mitsubishi Electric Corporation 126.5
SOFTBANK FY2010 (forecast) JPY250.0bn

46
Highly stable infrastructure business
High growth Internet business
High growth in Asia
Future Cash Flow Drivers

47
420.0 340.0324.2Operating income
250.0140.0(164.2)Free Cash Flow
(250.0)(280.0)(322.4)Investing Cash Flow(mainly CAPEX)
158.2 500.0420.0Operating Cash Flow
<bn JPY>Business Forecast
FY2007 FY2008(forecast)
FY2009(forecast)

48
Lifestyle Company in the 21st Century
Broadband available to all living people everywhere

49
Endeavoring to benefit society and the economy Endeavoring to benefit society and the economy and maximize enterprise value by fostering the and maximize enterprise value by fostering the sharing of wisdom and knowledge gained through sharing of wisdom and knowledge gained through the IT revolutionthe IT revolution
SOFTBANK’s Fundamental Management Policy

50
•This presentation contains forward-looking statements including statements regarding future events, future strategies or future performance of SOFTBANK CORP. that involves risks or uncertainties. In evaluating these statements, a recipient thereof should specifically consider various factors that could cause actual events or results to differ materially from those indicated, including without limitation; continuing decline in the general economic conditions, general market conditions, customer demand for products and services, increased competition, inherent risk in the international operations and other important factors.
•The names of the products and services used in this presentation are trademarks or registered trademarks of the respective companies.
www.softbank.co.jp

Q1 Q2 Q3 Q4 Q1 Q2 Q3 Q4 Q1 Q2bn JPY 231.5 350.3 426.6 422.2 389.0 419.8 403.1 406.8 370.6 399.4
bn JPY 27.2 29.3 56.9 42.2 43.5 50.6 53.7 26.5 44.2 43.8
bn JPY 55.8 73.6 104.0 87.9 92.4 104.0 108.3 80.6 99.5 101.0
% 11.7% 8.3% 13.2% 9.9% 11.1% 12.0% 13.2% 6.5% 11.9% 10.9%
% 24.0% 20.9% 24.2% 20.6% 23.6% 24.6% 26.7% 19.7% 26.7% 25.2%
thousand 15,240 15,307 15,497 15,909 16,441 17,053 17,614 18,586 19,112 19,633
bn JPY 62.7 64.6 65.3 65.9 64.3 62.4 62.8 61.7 58.7 58.1 (*2)
bn JPY 5.4 6.1 7.7 7.3 8.6 10.3 11.3 9.4 10.4 11.7 (*2)
Impact of the sale of the ADSL modem rental business bn JPY (0.8) (0.1) (0.4) +0.3 (0.9) (0.3) +0.1 +0.1 (0.7) (0.8)
Operating income excluding the impact of the sale of the ADSLmodem rental business
bn JPY 6.3 6.3 8.1 7.0 9.5 10.7 11.1 9.2 11.1 12.6
bn JPY 11.8 12.6 15.4 15.7 15.9 17.5 18.5 18.2 16.3 17.4
% 8.7% 9.4% 11.5% 10.9% 13.2% 16.1% 17.6% 14.7% 17.4% 19.7%
Operating margin excluding the impact of the sale of theADSL modem rental business
% 9.4% 9.2% 11.5% 10.0% 13.8% 15.9% 16.8% 14.0% 17.9% 20.3% (*2)
% 18.7% 19.2% 22.9% 23.2% 24.3% 27.3% 28.9% 28.6% 27.3% 29.1%
thousand 5,089 5,146 5,161 5,164 5,134 5,042 4,943 4,809 4,653 4,551
bn JPY 81.8 84.3 81.4 84.4 77.8 80.0 78.4 88.4 78.1 78.5
bn JPY 1.2 (0.9) (2.6) (0.6) (0.1) 0.4 1.3 1.6 0.7 4.7
bn JPY 12.6 10.2 8.9 10.7 11.1 11.3 12.4 13.0 12.2 16.4
% 1.4% - - - - 0.5% 1.5% 1.6% 0.9% 5.3%
% 14.3% 11.0% 9.5% 10.9% 12.3% 12.5% 13.8% 13.2% 13.8% 18.3%
thousand 1,020 1,077 1,136 1,221 1,257 1,315 1,351 1,401 1,443 1,498
bn JPY 44.4 45.2 49.4 52.3 51.8 56.9 65.1 69.8 61.5 62.5
bn JPY 21.6 22.7 25.0 27.1 27.1 27.7 28.8 31.4 30.5 30.6
bn JPY 23.9 25.2 27.6 29.4 29.6 30.5 31.7 34.5 33.0 33.6
% 48.5% 48.7% 50.0% 51.5% 51.4% 48.2% 43.4% 44.5% 49.0% 48.4%
% 53.6% 54.1% 55.2% 55.7% 56.1% 53.1% 47.7% 48.9% 53.1% 53.3%
bn JPY 55.8 61.1 61.2 78.5 58.2 60.2 65.5 71.6 59.6 62.6 (*4)
bn JPY 1.4 1.3 2.0 1.8 1.1 0.9 0.8 0.2 1.0 1.7
bn JPY 17.6 20.1 18.0 18.1 21.7 22.1 18.8 18.9 18.4 20.3
bn JPY (0.7) 0.5 (4.0) (0.5) (0.6) 0.0 (2.6) (1.8) (0.7) 3.3
Elimination or corporate bn JPY (2.0) (1.0) (0.3) (3.5) (0.9) (1.2) (1.0) (3.3) (1.2) (1.2)
bn JPY 494.2 625.9 702.1 721.8 663.0 701.6 694.0 717.4 647.2 681.7
bn JPY 54.3 58.1 84.7 73.7 78.7 89.0 92.4 64.0 85.0 94.9
bn JPY 104.3 124.0 154.0 143.0 149.7 164.4 169.4 142.9 161.4 174.0
% 11.0% 9.3% 12.1% 10.2% 11.9% 12.7% 13.3% 8.9% 13.1% 13.9%
% 21.1% 19.8% 21.9% 19.8% 22.6% 23.4% 24.4% 19.9% 24.9% 25.5%
*2 : SOFTBANK sold the ADSL modem rental business in December 2005, therefore the modem rental fee revenue has decreased. However, through the subcontract with BB Modem Rental Inc., commission fee revenue occurs.
The "Impact of the sale of the ADSL modem rental business" is based on management accounting, not on financial accounting.
*3 : SOFTBANK TELECOM started the "Otoku-line " direct fixed-line voice service. In June 2006, SOFTBANK TELECOM acquired the direct connection voice services of HEISEI DENDEN CO., LTD.
*4: SOFTBANK applied the “Practical solution on accounting for revenue recognition of software” from FY2006/Q1.
FY2008(Amounts less than one billion yen are omitted. / Net Sales to external customers)
Others
Net sales
EBITDA
Operating margin
e-Commerce
Net sales
Operating (loss) income
Total
Net sales
EBITDA
Operating margin
EBITDA margin
Operating (loss) income
FY2008/Q2 Appendix to the Earnings Results
Mobile Communications(*1)
(Core company : SOFTBANK MOBILE Corp.)
Broadband Infrastructure(Core company : SOFTBANK BB Corp.)
Fixed-line Telecommunications(*3)
(Core company : SOFTBANK TELECOM Corp.)
Net sales
Operating income
Business segment unit
Operating (loss) income
Operating margin
Operating margin
EBITDA margin
number of lines installed for direct connection voice services(*3)
EBITDA
Number of Yahoo! BB ADSL lines installed
Operating margin
EBITDA margin
EBITDA
Internet Culture(Core company : Yahoo Japan Corporation)
EBITDA margin
*1 : SOFTBANK CORP. ("SOFTBANK") acquired SOFTBANK MOBILE Corp. (former Vodafone K.K., "SOFTBANK MOBILE") in April 2006, and the Mobile Communications business segment was established at this time. The financial results of SOFTBANK MOBILE were consolidated from May 2006 on.
Net sales
Operating (loss) income
Net sales
Operating income
EBITDA
Net sales
Operating income
EBITDA margin
Total number of subscribers
FY2006 FY2007