Embed Size (px)
Citation preview

Earnings Release
3Q21
1
October 26, 2021
Earnings Release
3Q21
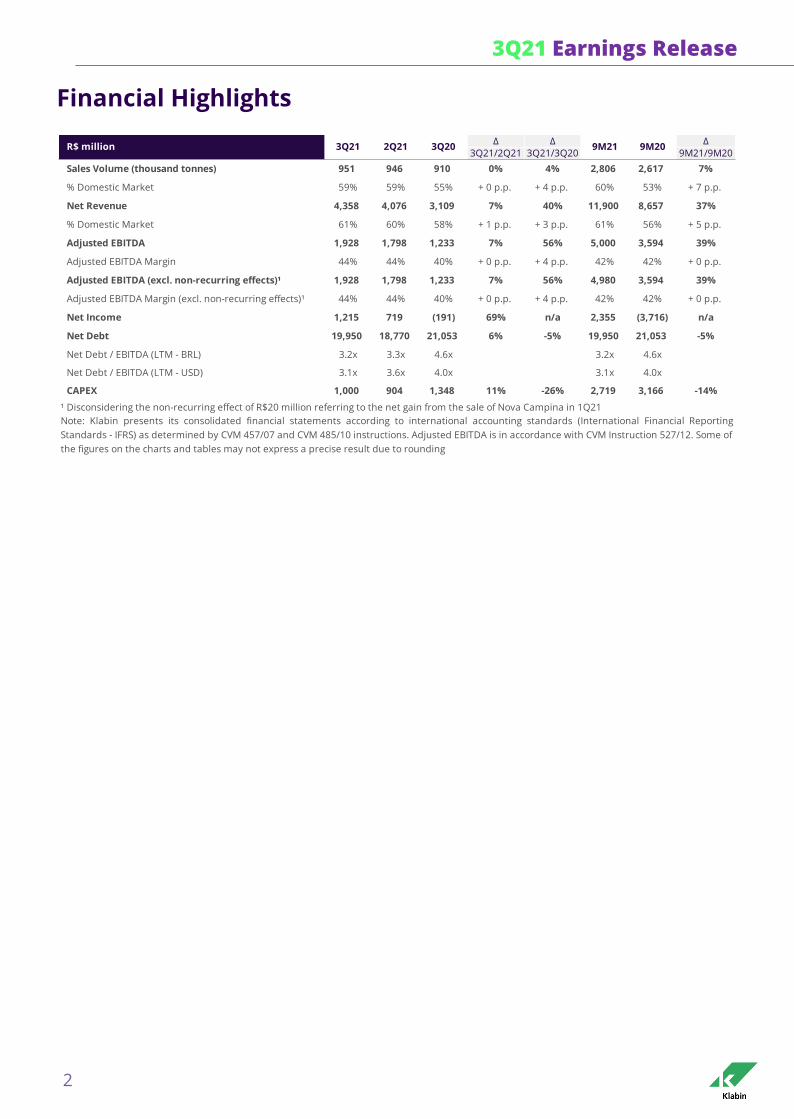
Net Revenue R$ 4.358 bn ROIC 19.8%
Net Revenue increased 40% on an annual
comparison basis with consistent growth
reported for all lines of business, and 29%
excluding additional revenue from the units
acquired from International Paper (IP).
ROIC (Return on Invested Capital) reached 19.8% in
the last twelve months, demonstrating consistent
value generation for the shareholders.
Adjusted EBITDA R$ 2,028/t Indebtedness Deleveraging
Price readjustments along all segments
increased Adjusted EBITDA/t to R$ 2,028/t,
50% more than 3Q20, while Cash
Generation/t¹ increased 55% on the same
comparative basis.
Solid EBITDA and cash generation contribute to the
Company’s deleveraging, despite the ongoing Puma
II investment cycle, with a reduction in the net
debt/EBITDA ratio in US$ to 3.1x in the quarter (vs.
3.6x in 2Q21).
Adjusted FCF yield 15.0% Puma II Startup of the 1st Machine
The Adjusted Free Cash Flow (FCF) amounted
to R$ 4.4 billion in the last twelve months,
corresponding to an Adjusted FCF yield of
15.0%.
In accordance with the Material Fact published on
August 30, 2021, the startup of the first phase of the
Puma II Project took place, beginning the production
of Eukaliner®, the first kraftliner in the world to be
made exclusively from eucalyptus fiber.
¹ Adjusted EBITDA – Maintenance Capex divided by sales volume (ex-wood)
Klabin
Market Cap
R$ 26.6 billion¹
¹based on the KLBN11
price on 09/30/21
KLBN11
Closing Price
R$ 24.21/unit
3Q21 Average Daily
Trading Volume
R$ 165 million
Conference Call
10/27/21 (Wednesday)
10:00 a.m. (NYC)
USA DI +412 717-9627
Code: Klabin
Links: HD Web Phone
Webcast
IR Channels
http://ri.klabin.com.br
Tel: +55 11 3046-8401
Klabin Invest:
Videos and Podcasts
ADJUSTED EBITDA REACHES R$ 1.928 BILLION IN 3Q21,
GROWTH OF 56% IN RELATION TO 3Q20
3Q21 Earnings Release
2
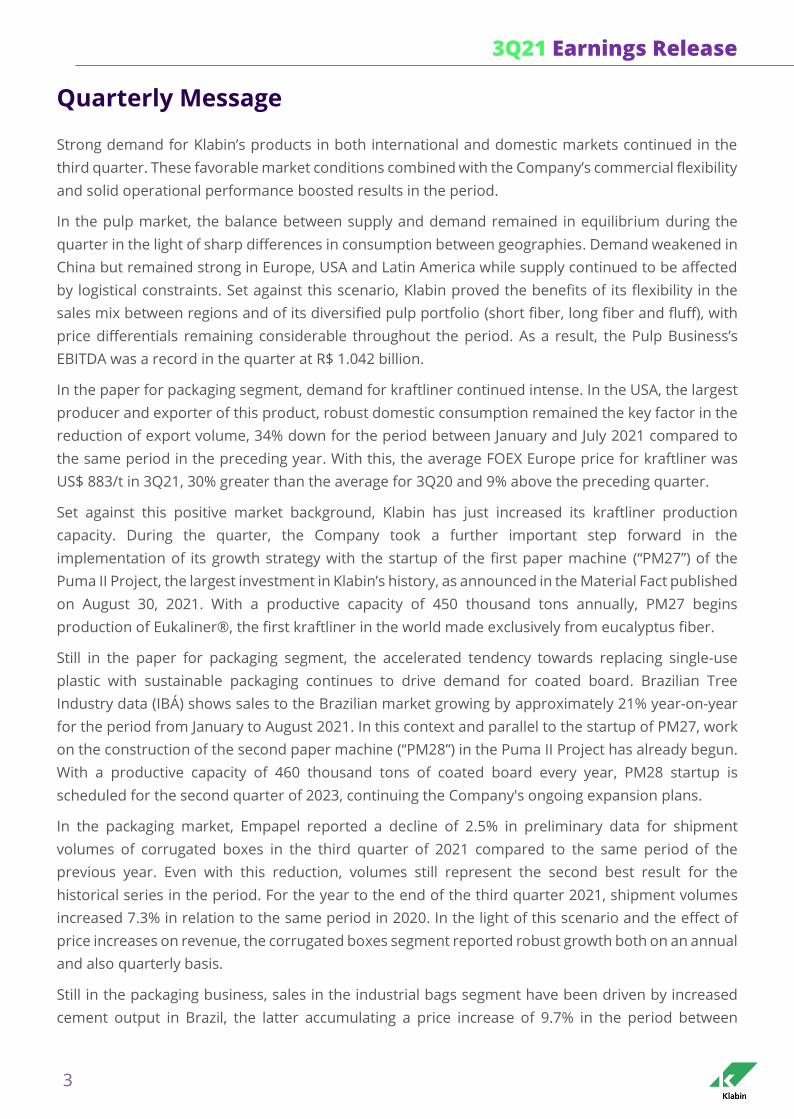
Financial Highlights
∆ ∆ ∆
3Q21/2Q21 3Q21/3Q20 9M21/9M20
Sales Volume (thousand tonnes) 951 946 910 0% 4% 2,806 2,617 7%
% Domestic Market 59% 59% 55% + 0 p.p. + 4 p.p. 60% 53% + 7 p.p.
Net Revenue 4,358 4,076 3,109 7% 40% 11,900 8,657 37%
% Domestic Market 61% 60% 58% + 1 p.p. + 3 p.p. 61% 56% + 5 p.p.
Adjusted EBITDA 1,928 1,798 1,233 7% 56% 5,000 3,594 39%
Adjusted EBITDA Margin 44% 44% 40% + 0 p.p. + 4 p.p. 42% 42% + 0 p.p.
Adjusted EBITDA (excl. non-recurring effects)¹ 1,928 1,798 1,233 7% 56% 4,980 3,594 39%
Adjusted EBITDA Margin (excl. non-recurring effects)¹ 44% 44% 40% + 0 p.p. + 4 p.p. 42% 42% + 0 p.p.
Net Income 1,215 719 (191) 69% n/a 2,355 (3,716) n/a
Net Debt 19,950 18,770 21,053 6% -5% 19,950 21,053 -5%
Net Debt / EBITDA (LTM - BRL) 3.2x 3.3x 4.6x 3.2x 4.6x
Net Debt / EBITDA (LTM - USD) 3.1x 3.6x 4.0x 3.1x 4.0x
CAPEX 1,000 904 1,348 11% -26% 2,719 3,166 -14%
Note: Klabin presents its consolidated financial statements according to international accounting standards (International Financial Reporting
Standards - IFRS) as determined by CVM 457/07 and CVM 485/10 instructions. Adjusted EBITDA is in accordance with CVM Instruction 527/12. Some of
the figures on the charts and tables may not express a precise result due to rounding
9M21 9M20R$ million 3Q21 2Q21 3Q20
¹ Disconsidering the non-recurring effect of R$20 million referring to the net gain from the sale of Nova Campina in 1Q21
3Q21 Earnings Release
3
Quarterly Message
Strong demand for Klabin’s products in both international and domestic markets continued in the
third quarter. These favorable market conditions combined with the Company’s commercial flexibility
and solid operational performance boosted results in the period.
In the pulp market, the balance between supply and demand remained in equilibrium during the
quarter in the light of sharp differences in consumption between geographies. Demand weakened in
China but remained strong in Europe, USA and Latin America while supply continued to be affected
by logistical constraints. Set against this scenario, Klabin proved the benefits of its flexibility in the
sales mix between regions and of its diversified pulp portfolio (short fiber, long fiber and fluff), with
price differentials remaining considerable throughout the period. As a result, the Pulp Business’s
EBITDA was a record in the quarter at R$ 1.042 billion.
In the paper for packaging segment, demand for kraftliner continued intense. In the USA, the largest
producer and exporter of this product, robust domestic consumption remained the key factor in the
reduction of export volume, 34% down for the period between January and July 2021 compared to
the same period in the preceding year. With this, the average FOEX Europe price for kraftliner was
US$ 883/t in 3Q21, 30% greater than the average for 3Q20 and 9% above the preceding quarter.
Set against this positive market background, Klabin has just increased its kraftliner production
capacity. During the quarter, the Company took a further important step forward in the
implementation of its growth strategy with the startup of the first paper machine (“PM27”) of the
Puma II Project, the largest investment in Klabin’s history, as announced in the Material Fact published
on August 30, 2021. With a productive capacity of 450 thousand tons annually, PM27 begins
production of Eukaliner®, the first kraftliner in the world made exclusively from eucalyptus fiber.
Still in the paper for packaging segment, the accelerated tendency towards replacing single-use
plastic with sustainable packaging continues to drive demand for coated board. Brazilian Tree
Industry data (IBÁ) shows sales to the Brazilian market growing by approximately 21% year-on-year
for the period from January to August 2021. In this context and parallel to the startup of PM27, work
on the construction of the second paper machine (“PM28”) in the Puma II Project has already begun.
With a productive capacity of 460 thousand tons of coated board every year, PM28 startup is
scheduled for the second quarter of 2023, continuing the Company's ongoing expansion plans.
In the packaging market, Empapel reported a decline of 2.5% in preliminary data for shipment
volumes of corrugated boxes in the third quarter of 2021 compared to the same period of the
previous year. Even with this reduction, volumes still represent the second best result for the
historical series in the period. For the year to the end of the third quarter 2021, shipment volumes
increased 7.3% in relation to the same period in 2020. In the light of this scenario and the effect of
price increases on revenue, the corrugated boxes segment reported robust growth both on an annual
and also quarterly basis.
Still in the packaging business, sales in the industrial bags segment have been driven by increased
cement output in Brazil, the latter accumulating a price increase of 9.7% in the period between
3Q21 Earnings Release
4
January and September 2021 compared to the same period in 2020 and based on preliminary
National Cement Industry Union (SNIC) data. In addition, consumption of industrial bags for new uses
with greater value added continues at a fast pace.
Increased sales volume together with price readjustments across all the businesses produced strong
revenue growth in the third quarter, amounting to R$ 4.358 billion, 40% more than the same period
in the preceding year or 29% when excluding revenue from
assets acquired from IP. This result combined with the
Company’s cost discipline lifted the Adjusted EBITDA for the
quarter to R$ 1.928 billion, 56% up on 3Q20. The higher Adjusted
EBITDA and efficient capital allocation helped drive cash
generation in the period and consequently, creation of
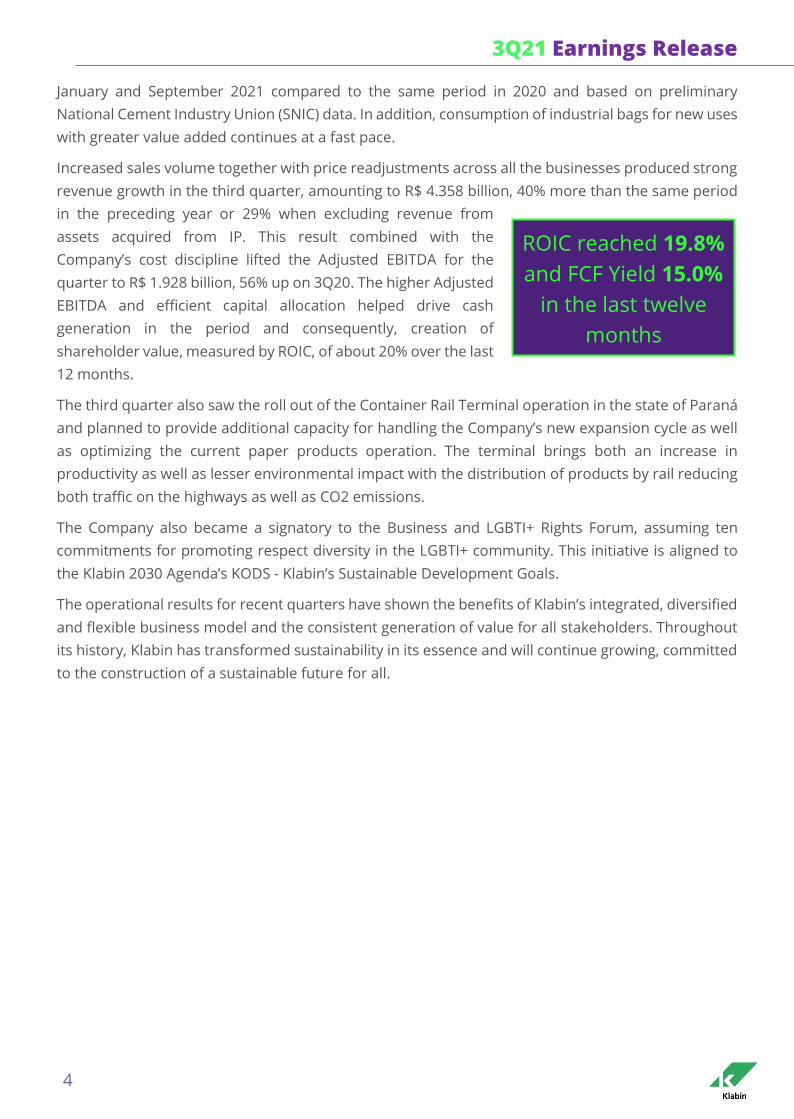
shareholder value, measured by ROIC, of about 20% over the last
12 months.
The third quarter also saw the roll out of the Container Rail Terminal operation in the state of Paraná
and planned to provide additional capacity for handling the Company’s new expansion cycle as well
as optimizing the current paper products operation. The terminal brings both an increase in
productivity as well as lesser environmental impact with the distribution of products by rail reducing
both traffic on the highways as well as CO2 emissions.
The Company also became a signatory to the Business and LGBTI+ Rights Forum, assuming ten
commitments for promoting respect diversity in the LGBTI+ community. This initiative is aligned to
the Klabin 2030 Agenda’s KODS - Klabin’s Sustainable Development Goals.
The operational results for recent quarters have shown the benefits of Klabin’s integrated, diversified
and flexible business model and the consistent generation of value for all stakeholders. Throughout
its history, Klabin has transformed sustainability in its essence and will continue growing, committed
to the construction of a sustainable future for all.
ROIC reached 19.8%
and FCF Yield 15.0%
in the last twelve
months
3Q21 Earnings Release
5
Operating and Economic-Financial Performance
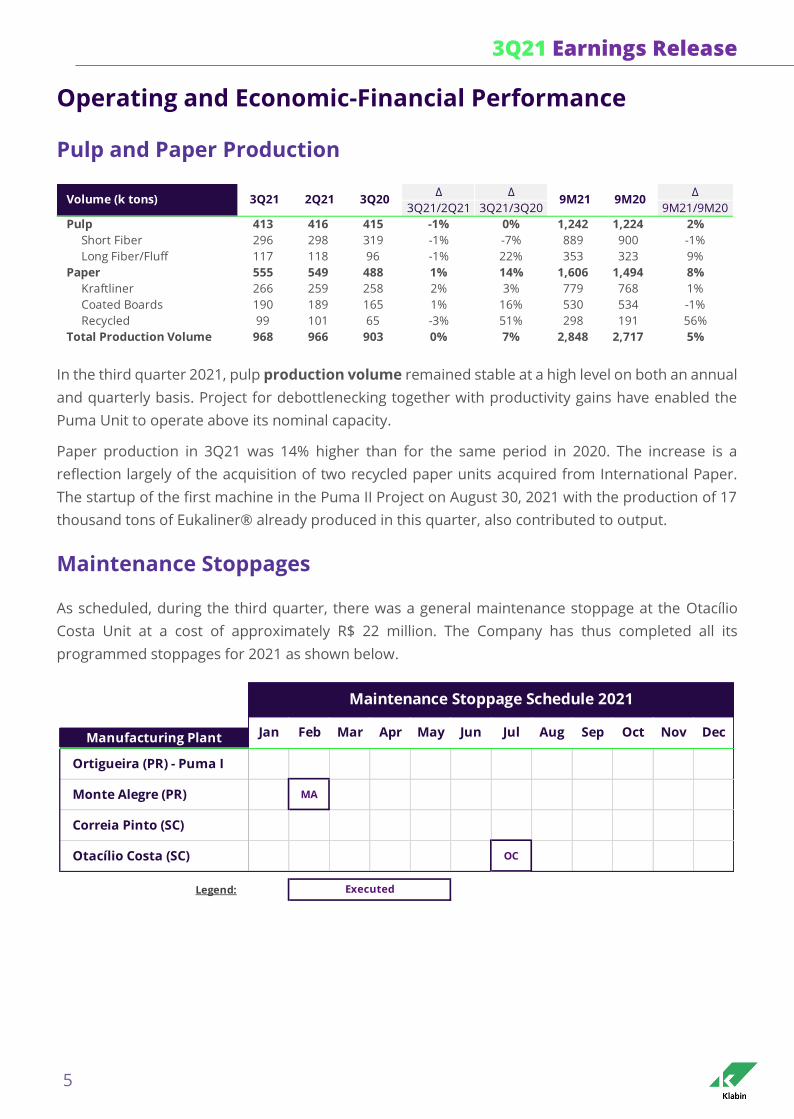
Pulp and Paper Production
In the third quarter 2021, pulp production volume remained stable at a high level on both an annual
and quarterly basis. Project for debottlenecking together with productivity gains have enabled the
Puma Unit to operate above its nominal capacity.
Paper production in 3Q21 was 14% higher than for the same period in 2020. The increase is a
reflection largely of the acquisition of two recycled paper units acquired from International Paper.
The startup of the first machine in the Puma II Project on August 30, 2021 with the production of 17
thousand tons of Eukaliner® already produced in this quarter, also contributed to output.
Maintenance Stoppages
As scheduled, during the third quarter, there was a general maintenance stoppage at the Otacílio
Costa Unit at a cost of approximately R$ 22 million. The Company has thus completed all its
programmed stoppages for 2021 as shown below.
∆ ∆ ∆
3Q21/2Q21 3Q21/3Q20 9M21/9M20
Pulp 413 416 415 -1% 0% 1,242 1,224 2%
Short Fiber 296 298 319 -1% -7% 889 900 -1%
Long Fiber/Fluff 117 118 96 -1% 22% 353 323 9%
Paper 555 549 488 1% 14% 1,606 1,494 8%
Kraftliner 266 259 258 2% 3% 779 768 1%
Coated Boards 190 189 165 1% 16% 530 534 -1%
Recycled 99 101 65 -3% 51% 298 191 56%
Total Production Volume 968 966 903 0% 7% 2,848 2,717 5%
9M203Q21 2Q21 3Q20Volume (k tons) 9M21
Manufacturing Plant
Ortigueira (PR) - Puma I
Monte Alegre (PR) MA
Correia Pinto (SC)
Otacílio Costa (SC) OC
Legend:
Nov Dec
Executed
Maintenance Stoppage Schedule 2021
Jan Feb Mar Apr May Jun Jul Aug Sep Oct
3Q21 Earnings Release
6
Sales Volume
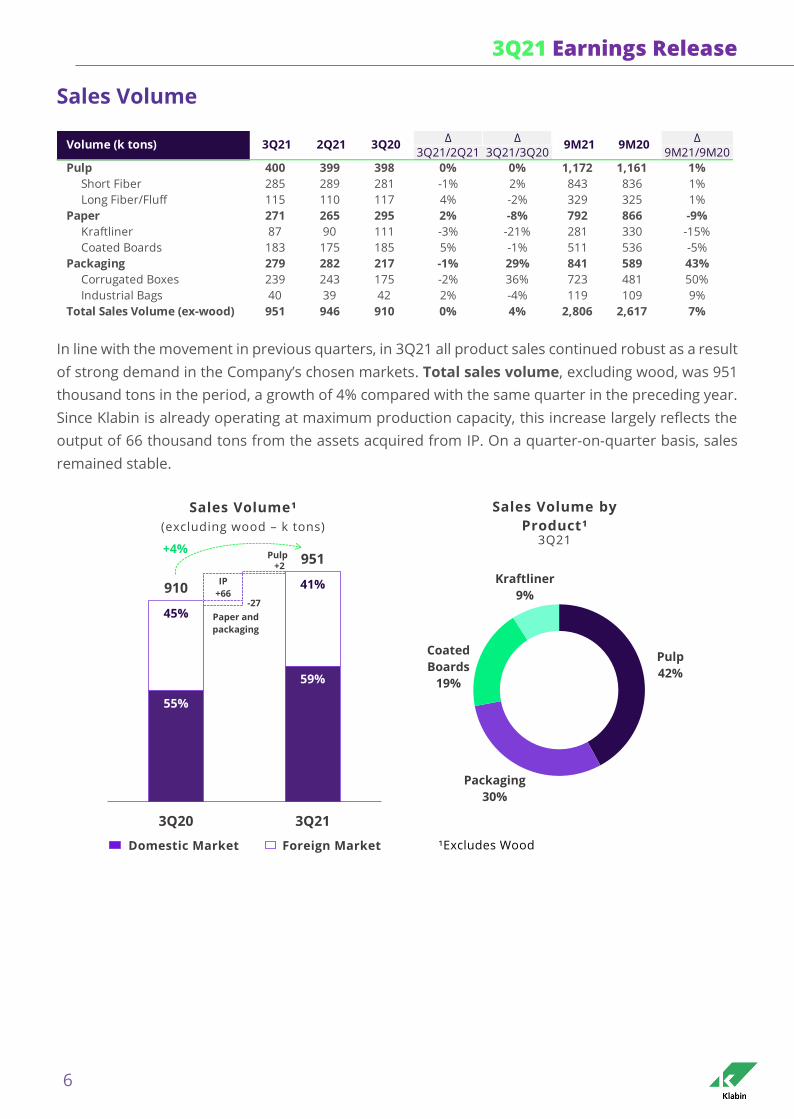
In line with the movement in previous quarters, in 3Q21 all product sales continued robust as a result
of strong demand in the Company’s chosen markets. Total sales volume, excluding wood, was 951
thousand tons in the period, a growth of 4% compared with the same quarter in the preceding year.
Since Klabin is already operating at maximum production capacity, this increase largely reflects the
output of 66 thousand tons from the assets acquired from IP. On a quarter-on-quarter basis, sales
remained stable.
∆ ∆ ∆
3Q21/2Q21 3Q21/3Q20 9M21/9M20
Pulp 400 399 398 0% 0% 1,172 1,161 1%
Short Fiber 285 289 281 -1% 2% 843 836 1%
Long Fiber/Fluff 115 110 117 4% -2% 329 325 1%
Paper 271 265 295 2% -8% 792 866 -9%
Kraftliner 87 90 111 -3% -21% 281 330 -15%
Coated Boards 183 175 185 5% -1% 511 536 -5%
Packaging 279 282 217 -1% 29% 841 589 43%
Corrugated Boxes 239 243 175 -2% 36% 723 481 50%
Industrial Bags 40 39 42 2% -4% 119 109 9%
Total Sales Volume (ex-wood) 951 946 910 0% 4% 2,806 2,617 7%
9M21 9M20Volume (k tons) 3Q21 2Q21 3Q20
Pulp
42%
Packaging
30%
Coated
Boards
19%
Kraftliner
9%
¹Excludes Wood
Sales Volume by
Product¹3Q21
55%
59%
45%
41%910
951
3Q20 3Q21
Sales Volume¹
(excluding wood – k tons)
Domestic Market Foreign Market
+4%Pulp
Paper and
packaging
-27
IP
+66
+2
3Q21 Earnings Release
7
Foreign Exchange
Net Revenue
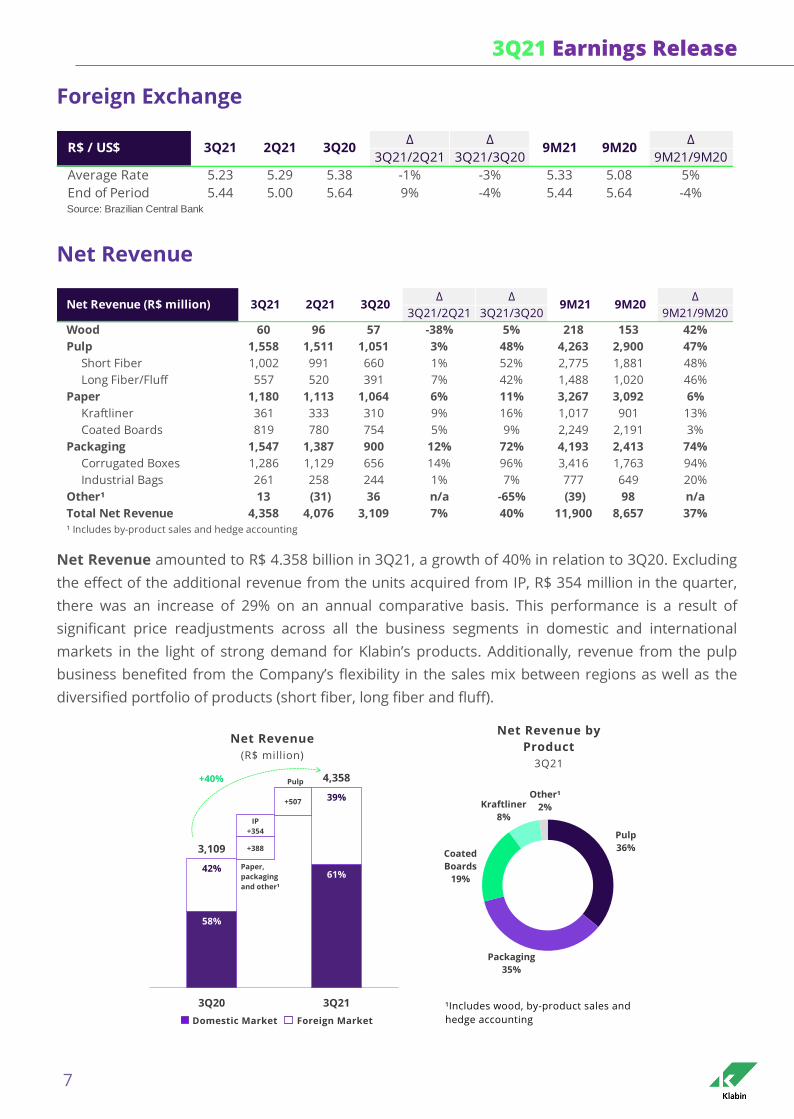
Net Revenue amounted to R$ 4.358 billion in 3Q21, a growth of 40% in relation to 3Q20. Excluding
the effect of the additional revenue from the units acquired from IP, R$ 354 million in the quarter,
there was an increase of 29% on an annual comparative basis. This performance is a result of
significant price readjustments across all the business segments in domestic and international
markets in the light of strong demand for Klabin’s products. Additionally, revenue from the pulp
business benefited from the Company’s flexibility in the sales mix between regions as well as the
diversified portfolio of products (short fiber, long fiber and fluff).
∆ ∆ ∆
3Q21/2Q21 3Q21/3Q20 9M21/9M20
Average Rate 5.23 5.29 5.38 -1% -3% 5.33 5.08 5%
End of Period 5.44 5.00 5.64 9% -4% 5.44 5.64 -4%Source: Brazilian Central Bank
9M21 9M20R$ / US$ 3Q21 2Q21 3Q20
∆ ∆ ∆
3Q21/2Q21 3Q21/3Q20 9M21/9M20
Wood 60 96 57 -38% 5% 218 153 42%
Pulp 1,558 1,511 1,051 3% 48% 4,263 2,900 47%
Short Fiber 1,002 991 660 1% 52% 2,775 1,881 48%
Long Fiber/Fluff 557 520 391 7% 42% 1,488 1,020 46%
Paper 1,180 1,113 1,064 6% 11% 3,267 3,092 6%
Kraftliner 361 333 310 9% 16% 1,017 901 13%
Coated Boards 819 780 754 5% 9% 2,249 2,191 3%
Packaging 1,547 1,387 900 12% 72% 4,193 2,413 74%
Corrugated Boxes 1,286 1,129 656 14% 96% 3,416 1,763 94%
Industrial Bags 261 258 244 1% 7% 777 649 20%
Other¹ 13 (31) 36 n/a -65% (39) 98 n/a
Total Net Revenue 4,358 4,076 3,109 7% 40% 11,900 8,657 37%
¹ Includes by-product sales and hedge accounting
Net Revenue (R$ million) 3Q21 2Q21 3Q20 9M21 9M20
Net Revenue by
Product
3Q21
58%
61%42%
39%
3,109
4,358
3Q20 3Q21
Pulp
36%
Packaging
35%
Coated
Boards
19%
Kraftliner
8%
Other¹
2%
Net Revenue
(R$ million)
Domestic Market Foreign Market
¹Includes wood, by-product sales and
hedge accounting
Paper,
packaging
and other¹
IP
+354
+507
Pulp
+388
+40%
3Q21 Earnings Release
8
Operational Costs and Expenses
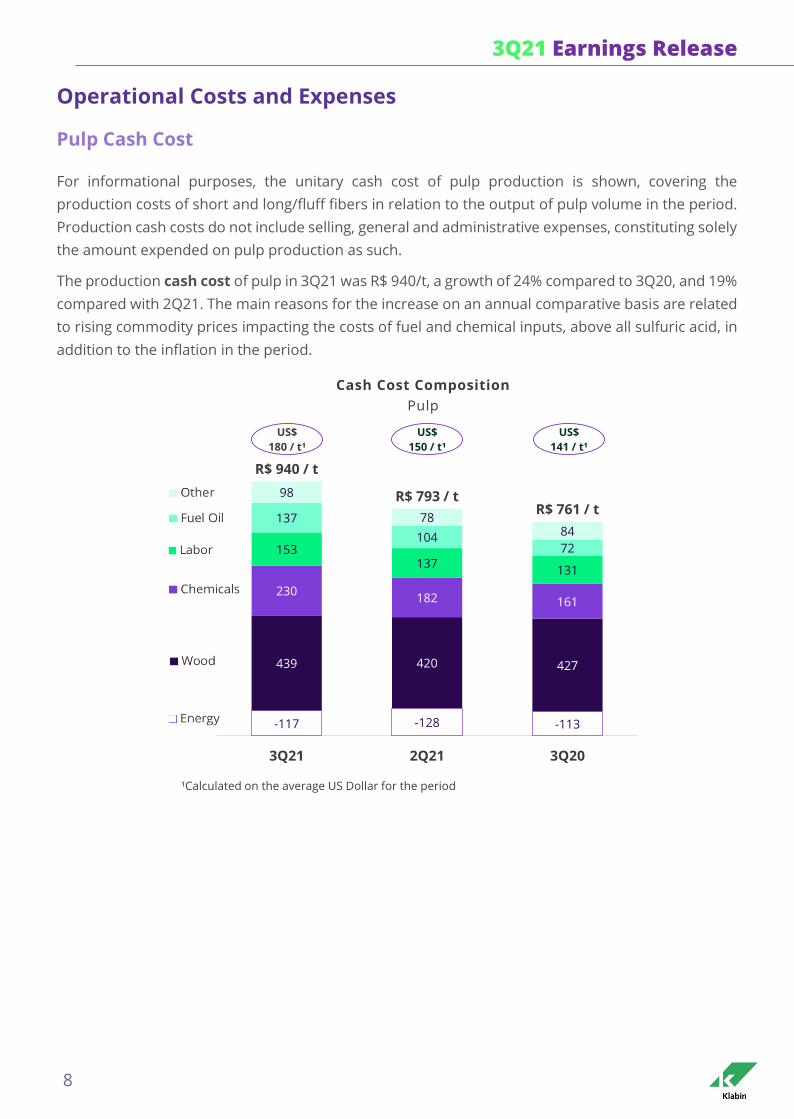
Pulp Cash Cost
For informational purposes, the unitary cash cost of pulp production is shown, covering the
production costs of short and long/fluff fibers in relation to the output of pulp volume in the period.
Production cash costs do not include selling, general and administrative expenses, constituting solely
the amount expended on pulp production as such.
The production cash cost of pulp in 3Q21 was R$ 940/t, a growth of 24% compared to 3Q20, and 19%
compared with 2Q21. The main reasons for the increase on an annual comparative basis are related
to rising commodity prices impacting the costs of fuel and chemical inputs, above all sulfuric acid, in
addition to the inflation in the period.
¹Calculated on the average US Dollar for the period
-117 -128 -113
439 420 427
230182 161
153137
131
137
10472
98
7884
R$ 940 / t
R$ 793 / tR$ 761 / t
3Q21 2Q21 3Q20
Cash Cost Composition
Pulp
US$
180 / t¹
US$
150 / t¹
US$
141 / t¹
3Q21 Earnings Release
9
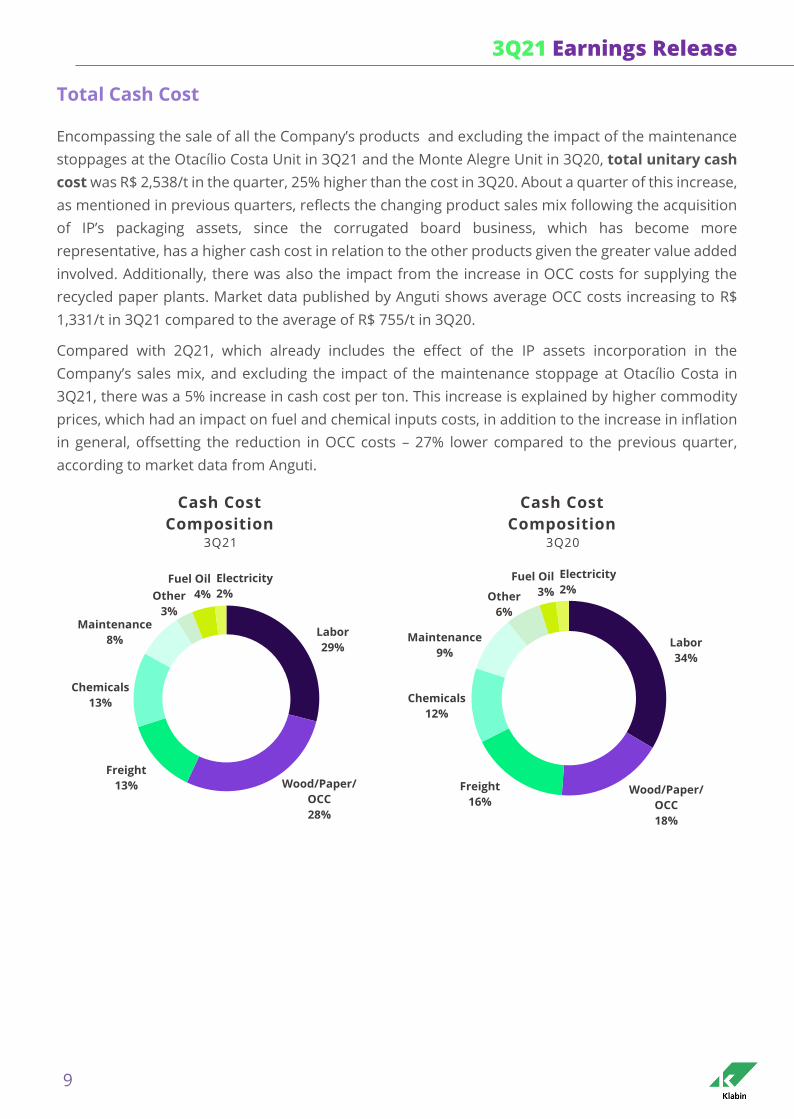
Total Cash Cost
Encompassing the sale of all the Company’s products and excluding the impact of the maintenance
stoppages at the Otacílio Costa Unit in 3Q21 and the Monte Alegre Unit in 3Q20, total unitary cash
cost was R$ 2,538/t in the quarter, 25% higher than the cost in 3Q20. About a quarter of this increase,
as mentioned in previous quarters, reflects the changing product sales mix following the acquisition
of IP’s packaging assets, since the corrugated board business, which has become more
representative, has a higher cash cost in relation to the other products given the greater value added
involved. Additionally, there was also the impact from the increase in OCC costs for supplying the
recycled paper plants. Market data published by Anguti shows average OCC costs increasing to R$
1,331/t in 3Q21 compared to the average of R$ 755/t in 3Q20.
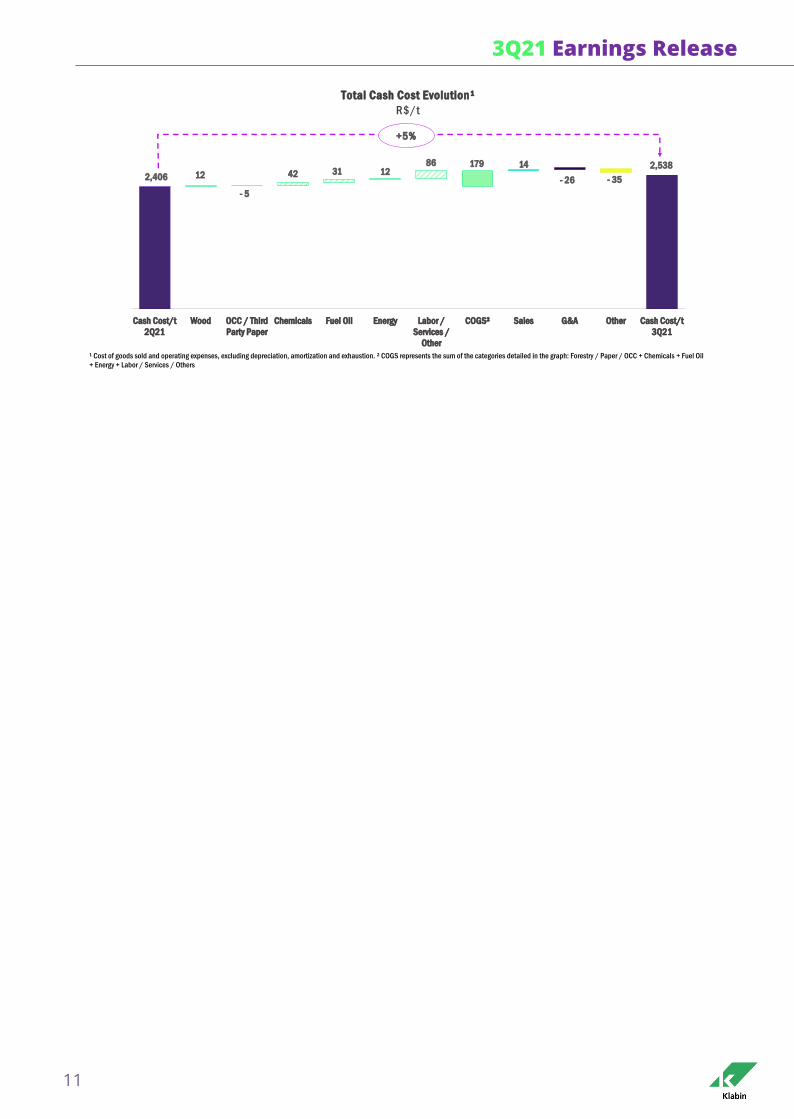
Compared with 2Q21, which already includes the effect of the IP assets incorporation in the
Company’s sales mix, and excluding the impact of the maintenance stoppage at Otacílio Costa in
3Q21, there was a 5% increase in cash cost per ton. This increase is explained by higher commodity
prices, which had an impact on fuel and chemical inputs costs, in addition to the increase in inflation
in general, offsetting the reduction in OCC costs – 27% lower compared to the previous quarter,
according to market data from Anguti.
Labor
29%
Wood/Paper/
OCC
28%
Freight
13%
Chemicals
13%
Maintenance
8%
Other
3%
Fuel Oil
4%
Electricity
2%
Labor
34%
Wood/Paper/
OCC
18%
Freight
16%
Chemicals
12%
Maintenance
9%
Other
6%
Fuel Oil
3%
Electricity
2%
Cash Cost
Composition3Q21
Cash Cost
Composition3Q20
3Q21 Earnings Release
10
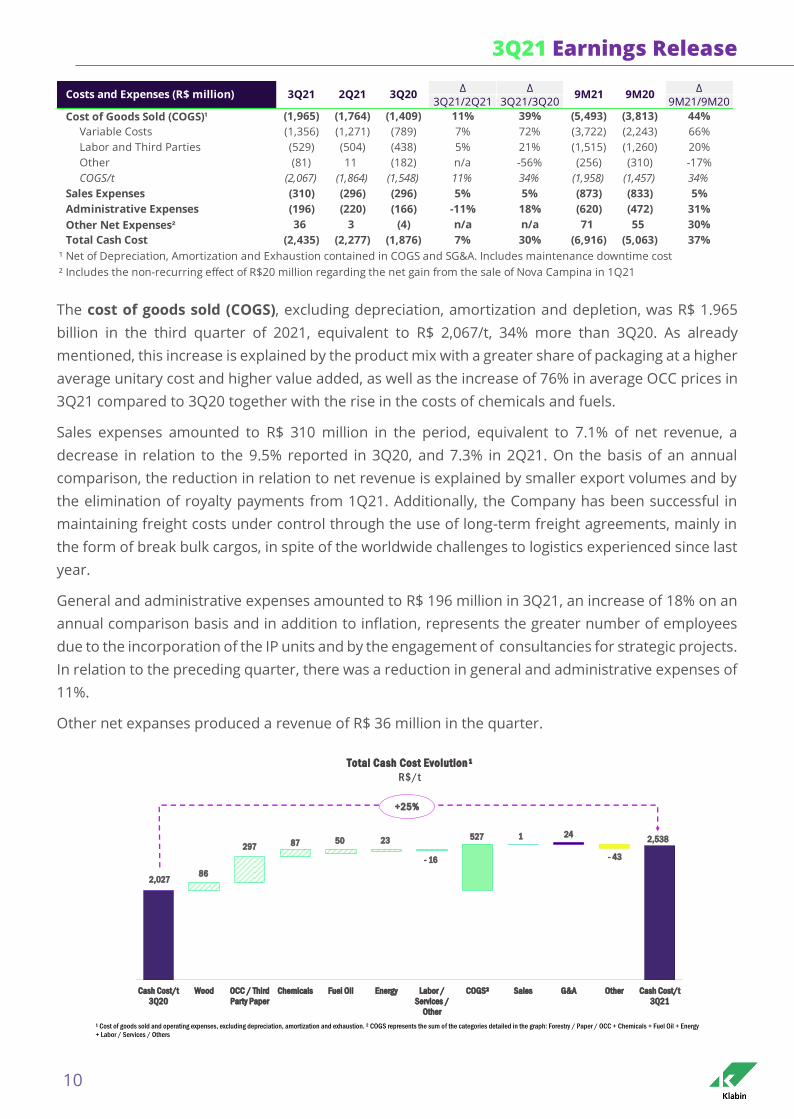
The cost of goods sold (COGS), excluding depreciation, amortization and depletion, was R$ 1.965
billion in the third quarter of 2021, equivalent to R$ 2,067/t, 34% more than 3Q20. As already
mentioned, this increase is explained by the product mix with a greater share of packaging at a higher
average unitary cost and higher value added, as well as the increase of 76% in average OCC prices in
3Q21 compared to 3Q20 together with the rise in the costs of chemicals and fuels.
Sales expenses amounted to R$ 310 million in the period, equivalent to 7.1% of net revenue, a
decrease in relation to the 9.5% reported in 3Q20, and 7.3% in 2Q21. On the basis of an annual
comparison, the reduction in relation to net revenue is explained by smaller export volumes and by
the elimination of royalty payments from 1Q21. Additionally, the Company has been successful in
maintaining freight costs under control through the use of long-term freight agreements, mainly in
the form of break bulk cargos, in spite of the worldwide challenges to logistics experienced since last
year.
General and administrative expenses amounted to R$ 196 million in 3Q21, an increase of 18% on an
annual comparison basis and in addition to inflation, represents the greater number of employees
due to the incorporation of the IP units and by the engagement of consultancies for strategic projects.
In relation to the preceding quarter, there was a reduction in general and administrative expenses of
11%.
Other net expanses produced a revenue of R$ 36 million in the quarter.
∆ ∆ ∆
3Q21/2Q21 3Q21/3Q20 9M21/9M20
Cost of Goods Sold (COGS)¹ (1,965) (1,764) (1,409) 11% 39% (5,493) (3,813) 44%
Variable Costs (1,356) (1,271) (789) 7% 72% (3,722) (2,243) 66%
Labor and Third Parties (529) (504) (438) 5% 21% (1,515) (1,260) 20%
Other (81) 11 (182) n/a -56% (256) (310) -17%
COGS/t (2,067) (1,864) (1,548) 11% 34% (1,958) (1,457) 34%
Sales Expenses (310) (296) (296) 5% 5% (873) (833) 5%
Administrative Expenses (196) (220) (166) -11% 18% (620) (472) 31%
Other Net Expenses² 36 3 (4) n/a n/a 71 55 30%
Total Cash Cost (2,435) (2,277) (1,876) 7% 30% (6,916) (5,063) 37%
¹ Net of Depreciation, Amortization and Exhaustion contained in COGS and SG&A. Includes maintenance downtime cost
² Includes the non-recurring effect of R$20 million regarding the net gain from the sale of Nova Campina in 1Q21
Costs and Expenses (R$ million) 3Q21 2Q21 3Q20 9M21 9M20
2,02786
297 87 50 23
- 16
527 1 24
- 43
2,538
1000
1200
1400
1600
1800
2000
2200
2400
2600
2800
Cash Cost/t
3Q20
Wood OCC / Third
Party Paper
Chemicals Fuel Oil Energy Labor /
Services /
Other
COGS² Sales G&A Other Cash Cost/t
3Q21
Total Cash Cost Evolution¹
R$/t
¹ Cost of goods sold and operating expenses, excluding depreciation, amortization and exhaustion. ² COGS represents the sum of the categories detailed in the graph: Forestry / Paper / OCC + Chemicals + Fuel Oil + Energy
+ Labor / Services / Others
+25%
3Q21 Earnings Release
11
2,406 12
- 5
42 31 1286 179 14
- 26 - 35
2,538
1000
1200
1400
1600
1800
2000
2200
2400
2600
2800
Cash Cost/t
2Q21
Wood OCC / Third
Party Paper
Chemicals Fuel Oil Energy Labor /
Services /
Other
COGS² Sales G&A Other Cash Cost/t
3Q21
Total Cash Cost Evolution¹
R$/t
¹ Cost of goods sold and operating expenses, excluding depreciation, amortization and exhaustion. ² COGS represents the sum of the categories detailed in the graph: Forestry / Paper / OCC + Chemicals + Fuel Oil
+ Energy + Labor / Services / Others
+5%
3Q21 Earnings Release
12
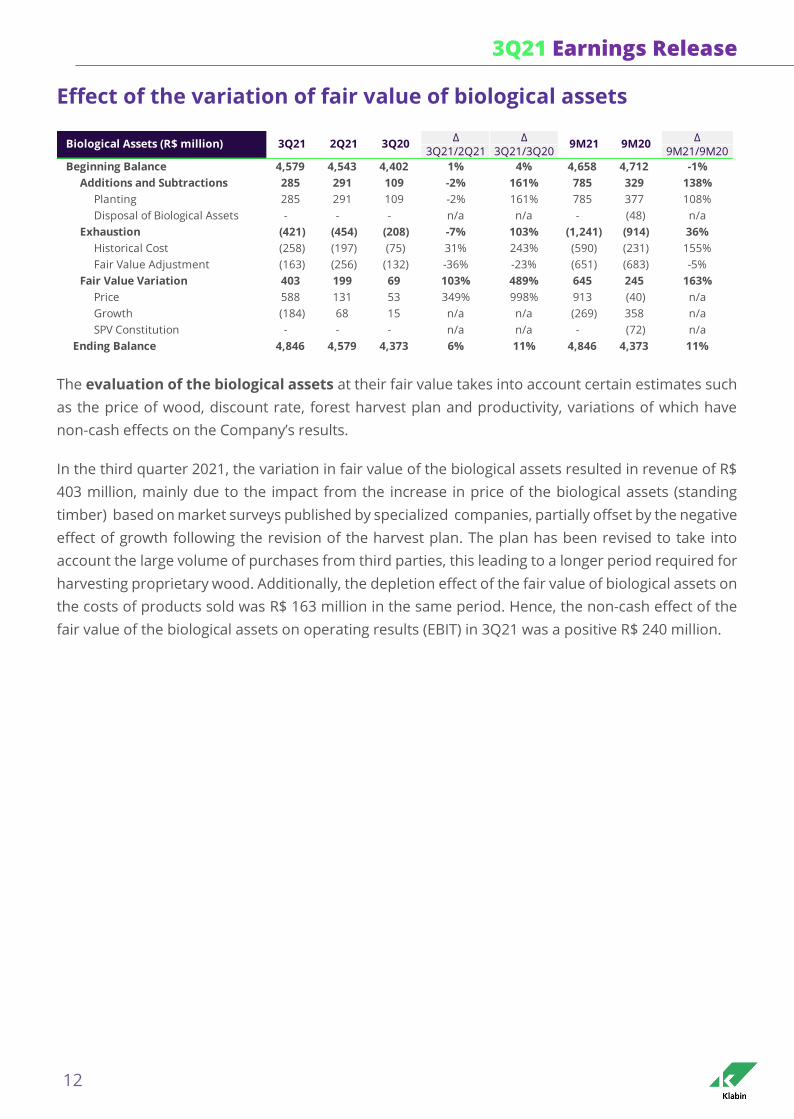
Effect of the variation of fair value of biological assets
The evaluation of the biological assets at their fair value takes into account certain estimates such
as the price of wood, discount rate, forest harvest plan and productivity, variations of which have
non-cash effects on the Company’s results.
In the third quarter 2021, the variation in fair value of the biological assets resulted in revenue of R$
403 million, mainly due to the impact from the increase in price of the biological assets (standing
timber) based on market surveys published by specialized companies, partially offset by the negative
effect of growth following the revision of the harvest plan. The plan has been revised to take into
account the large volume of purchases from third parties, this leading to a longer period required for
harvesting proprietary wood. Additionally, the depletion effect of the fair value of biological assets on
the costs of products sold was R$ 163 million in the same period. Hence, the non-cash effect of the
fair value of the biological assets on operating results (EBIT) in 3Q21 was a positive R$ 240 million.
∆ ∆ ∆
3Q21/2Q21 3Q21/3Q20 9M21/9M20
Beginning Balance 4,579 4,543 4,402 1% 4% 4,658 4,712 -1%
Additions and Subtractions 285 291 109 -2% 161% 785 329 138%
Planting 285 291 109 -2% 161% 785 377 108%
Disposal of Biological Assets - - - n/a n/a - (48) n/a
Exhaustion (421) (454) (208) -7% 103% (1,241) (914) 36%
Historical Cost (258) (197) (75) 31% 243% (590) (231) 155%
Fair Value Adjustment (163) (256) (132) -36% -23% (651) (683) -5%
Fair Value Variation 403 199 69 103% 489% 645 245 163%
Price 588 131 53 349% 998% 913 (40) n/a
Growth (184) 68 15 n/a n/a (269) 358 n/a
SPV Constitution - - - n/a n/a - (72) n/a
Ending Balance 4,846 4,579 4,373 6% 11% 4,846 4,373 11%
9M20Biological Assets (R$ million) 3Q21 2Q21 3Q20 9M21
3Q21 Earnings Release
13
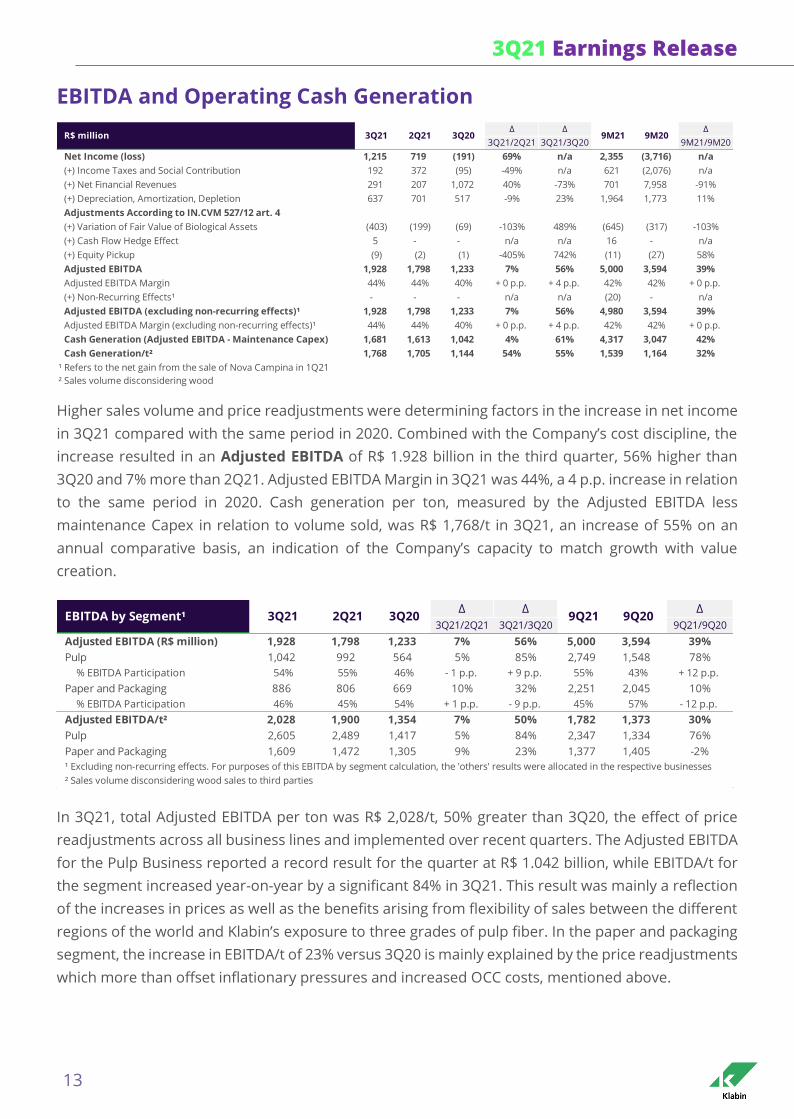
EBITDA and Operating Cash Generation
Higher sales volume and price readjustments were determining factors in the increase in net income
in 3Q21 compared with the same period in 2020. Combined with the Company’s cost discipline, the
increase resulted in an Adjusted EBITDA of R$ 1.928 billion in the third quarter, 56% higher than
3Q20 and 7% more than 2Q21. Adjusted EBITDA Margin in 3Q21 was 44%, a 4 p.p. increase in relation
to the same period in 2020. Cash generation per ton, measured by the Adjusted EBITDA less
maintenance Capex in relation to volume sold, was R$ 1,768/t in 3Q21, an increase of 55% on an
annual comparative basis, an indication of the Company’s capacity to match growth with value
creation.
In 3Q21, total Adjusted EBITDA per ton was R$ 2,028/t, 50% greater than 3Q20, the effect of price
readjustments across all business lines and implemented over recent quarters. The Adjusted EBITDA
for the Pulp Business reported a record result for the quarter at R$ 1.042 billion, while EBITDA/t for
the segment increased year-on-year by a significant 84% in 3Q21. This result was mainly a reflection
of the increases in prices as well as the benefits arising from flexibility of sales between the different
regions of the world and Klabin’s exposure to three grades of pulp fiber. In the paper and packaging
segment, the increase in EBITDA/t of 23% versus 3Q20 is mainly explained by the price readjustments
which more than offset inflationary pressures and increased OCC costs, mentioned above.
∆ ∆ ∆
3Q21/2Q21 3Q21/3Q20 9M21/9M20
Net Income (loss) 1,215 719 (191) 69% n/a 2,355 (3,716) n/a
(+) Income Taxes and Social Contribution 192 372 (95) -49% n/a 621 (2,076) n/a
(+) Net Financial Revenues 291 207 1,072 40% -73% 701 7,958 -91%
(+) Depreciation, Amortization, Depletion 637 701 517 -9% 23% 1,964 1,773 11%
Adjustments According to IN.CVM 527/12 art. 4
(+) Variation of Fair Value of Biological Assets (403) (199) (69) -103% 489% (645) (317) -103%
(+) Cash Flow Hedge Effect 5 - - n/a n/a 16 - n/a
(+) Equity Pickup (9) (2) (1) -405% 742% (11) (27) 58%
Adjusted EBITDA 1,928 1,798 1,233 7% 56% 5,000 3,594 39%
Adjusted EBITDA Margin 44% 44% 40% + 0 p.p. + 4 p.p. 42% 42% + 0 p.p.
(+) Non-Recurring Effects¹ - - - n/a n/a (20) - n/a
Adjusted EBITDA (excluding non-recurring effects)¹ 1,928 1,798 1,233 7% 56% 4,980 3,594 39%
Adjusted EBITDA Margin (excluding non-recurring effects)¹ 44% 44% 40% + 0 p.p. + 4 p.p. 42% 42% + 0 p.p.
Cash Generation (Adjusted EBITDA - Maintenance Capex) 1,681 1,613 1,042 4% 61% 4,317 3,047 42%
Cash Generation/t² 1,768 1,705 1,144 54% 55% 1,539 1,164 32%
² Sales volume disconsidering wood
¹ Refers to the net gain from the sale of Nova Campina in 1Q21
9M21 9M20R$ million 3Q21 2Q21 3Q20
∆ ∆ ∆
3Q21/2Q21 3Q21/3Q20 9Q21/9Q20
Adjusted EBITDA (R$ million) 1,928 1,798 1,233 7% 56% 5,000 3,594 39%
Pulp 1,042 992 564 5% 85% 2,749 1,548 78%
% EBITDA Participation 54% 55% 46% - 1 p.p. + 9 p.p. 55% 43% + 12 p.p.
Paper and Packaging 886 806 669 10% 32% 2,251 2,045 10%
% EBITDA Participation 46% 45% 54% + 1 p.p. - 9 p.p. 45% 57% - 12 p.p.
Adjusted EBITDA/t² 2,028 1,900 1,354 7% 50% 1,782 1,373 30%
Pulp 2,605 2,489 1,417 5% 84% 2,347 1,334 76%
Paper and Packaging 1,609 1,472 1,305 9% 23% 1,377 1,405 -2%
¹ Excluding non-recurring effects. For purposes of this EBITDA by segment calculation, the 'others' results were allocated in the respective businesses
² Sales volume disconsidering wood sales to third parties
9Q20EBITDA by Segment¹ 3Q21 2Q21 3Q20 9Q21
3Q21 Earnings Release
14
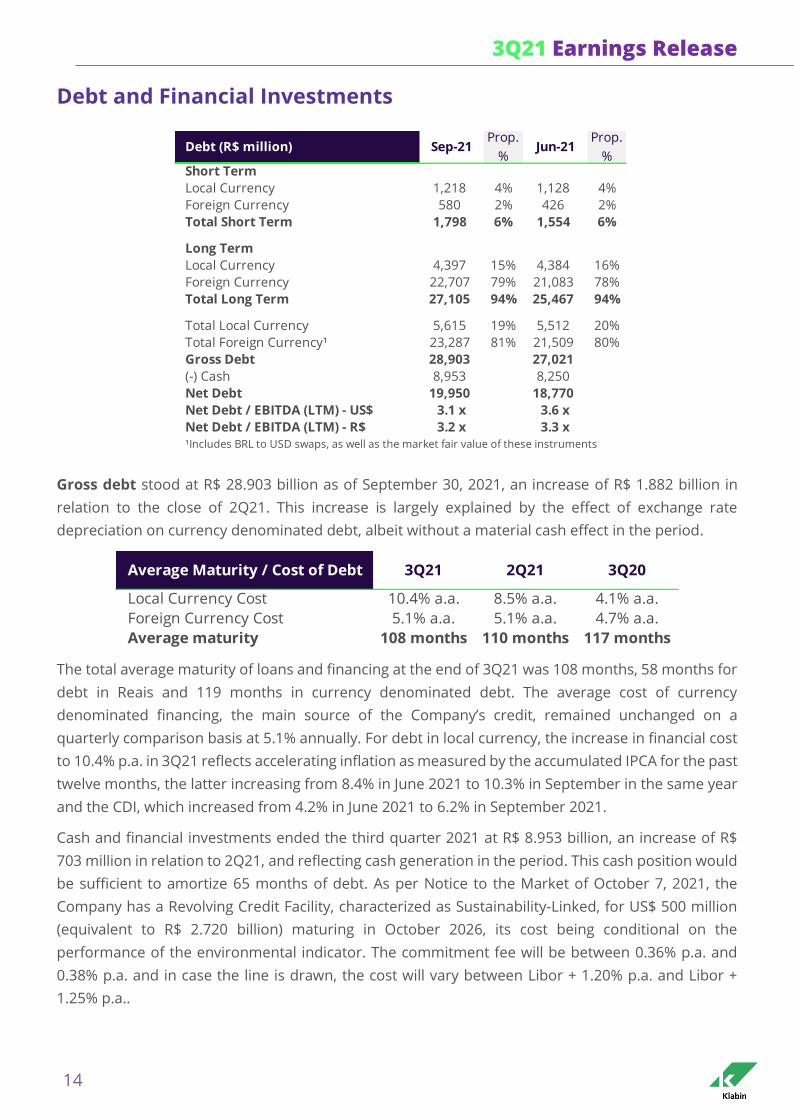
Debt and Financial Investments
Gross debt stood at R$ 28.903 billion as of September 30, 2021, an increase of R$ 1.882 billion in
relation to the close of 2Q21. This increase is largely explained by the effect of exchange rate
depreciation on currency denominated debt, albeit without a material cash effect in the period.
The total average maturity of loans and financing at the end of 3Q21 was 108 months, 58 months for
debt in Reais and 119 months in currency denominated debt. The average cost of currency
denominated financing, the main source of the Company’s credit, remained unchanged on a
quarterly comparison basis at 5.1% annually. For debt in local currency, the increase in financial cost
to 10.4% p.a. in 3Q21 reflects accelerating inflation as measured by the accumulated IPCA for the past
twelve months, the latter increasing from 8.4% in June 2021 to 10.3% in September in the same year
and the CDI, which increased from 4.2% in June 2021 to 6.2% in September 2021.
Cash and financial investments ended the third quarter 2021 at R$ 8.953 billion, an increase of R$
703 million in relation to 2Q21, and reflecting cash generation in the period. This cash position would
be sufficient to amortize 65 months of debt. As per Notice to the Market of October 7, 2021, the
Company has a Revolving Credit Facility, characterized as Sustainability-Linked, for US$ 500 million
(equivalent to R$ 2.720 billion) maturing in October 2026, its cost being conditional on the
performance of the environmental indicator. The commitment fee will be between 0.36% p.a. and
0.38% p.a. and in case the line is drawn, the cost will vary between Libor + 1.20% p.a. and Libor +
1.25% p.a..
Debt (R$ million) Sep-21Prop.
%Jun-21
Prop.
%Short Term
Local Currency 1,218 4% 1,128 4%
Foreign Currency 580 2% 426 2%
Total Short Term 1,798 6% 1,554 6%
Long Term
Local Currency 4,397 15% 4,384 16%
Foreign Currency 22,707 79% 21,083 78%
Total Long Term 27,105 94% 25,467 94%
Total Local Currency 5,615 19% 5,512 20%
Total Foreign Currency¹ 23,287 81% 21,509 80%
Gross Debt 28,903 27,021
(-) Cash 8,953 8,250
Net Debt 19,950 18,770
Net Debt / EBITDA (LTM) - US$ 3.1 x 3.6 x
Net Debt / EBITDA (LTM) - R$ 3.2 x 3.3 x
¹Includes BRL to USD swaps, as well as the market fair value of these instruments
Average Maturity / Cost of Debt 3Q21 2Q21 3Q20
Local Currency Cost 10.4% a.a. 8.5% a.a. 4.1% a.a.
Foreign Currency Cost 5.1% a.a. 5.1% a.a. 4.7% a.a.
Average maturity 108 months 110 months 117 months
3Q21 Earnings Release
15
Klabin also has financing earmarked to the execution of the Puma II Project, contracted, and partially
drawn for the following amounts: (i) BID Invest, IFC and JICA, US$ 700 million; (ii) Finnvera, US$ 178
million; (iii) BNDES, R$ 2 billion. These credit lines may be drawn either in full or partially, according
to the progress of the construction schedule of the Puma II Project and/or Company's cash
requirements.
Consolidated net debt as of September 30, 2021 amounted to R$ 19.950 billion, an increase of R$
1,179 billion compared to the net amount at the close of 2Q20 and largely due to the negative impact
of exchange variation on US$ denominated debt – with no material cash effect during the period -
although partially offset by cash generation.
Financial leverage measured by the Net Debt/Adjusted EBITDA ratio in US$ - which best reflects
Klabin’s financial leverage - continued a deleveraging trajectory, begun in the previous quarter and
terminating in 3Q21 at 3.1 times compared with 3.6 times in 2Q21, this being implemented in parallel
with the ongoing Puma II investment cycle. The positive performance is related to increased cash
generation and to the accumulated Adjusted EBITDA over the past twelve months, maintaining
leverage within the parameters established in the Company’s Financial Debt Policy.
Hedge Accounting
From January 2021, Klabin implemented the cash flow hedge accounting method. This practice, in
line with the Company’s risk management and strategy, seeks to demonstrate the equalization of the
effects of foreign exchange variation in the income statement as they are effectively realized with
their cash effect.
Debts in US$ are designated as instruments of protection of the highly probable future revenues in
US$ and the effects of the currency variation on these debts are recorded under shareholders’ equity
in the “Valuation adjustments to shareholders’ equity” line. With the realization of revenues in US$
linked to the designated debts for hedge accounting purposes, so the respective accumulated
amounts of currency variation are recorded in the income statements under “Net Revenue”.
At the end of 3Q21, the currency variation of debt designated for hedge accounting totaled a net
negative effect of R$ 560 million in the “Valuation adjustments to shareholders’ equity” in the
shareholders’ equity. This amount related to the positive balance of R$ 865 million in the financial
result less the R$ 16 million realization of the hedge reserve plus R$ 288 million in Income Tax and
Social Contribution.
In 3Q21, revenue was realized in the amount of US$ 18 million linked to the settlement of loans and
financing, designated as a hedge instrument. This revenue generated an accumulated foreign
exchange expense of R$ 5 million, excluded from the Adjusted EBITDA to better show the Company’s
cash generation.
The implementation of hedge accounting is exclusively of an accounting nature and does not
impact the Company’s cash generation and Adjusted EBITDA.
For more information, please see the financial statements for the period.
3Q21 Earnings Release
16
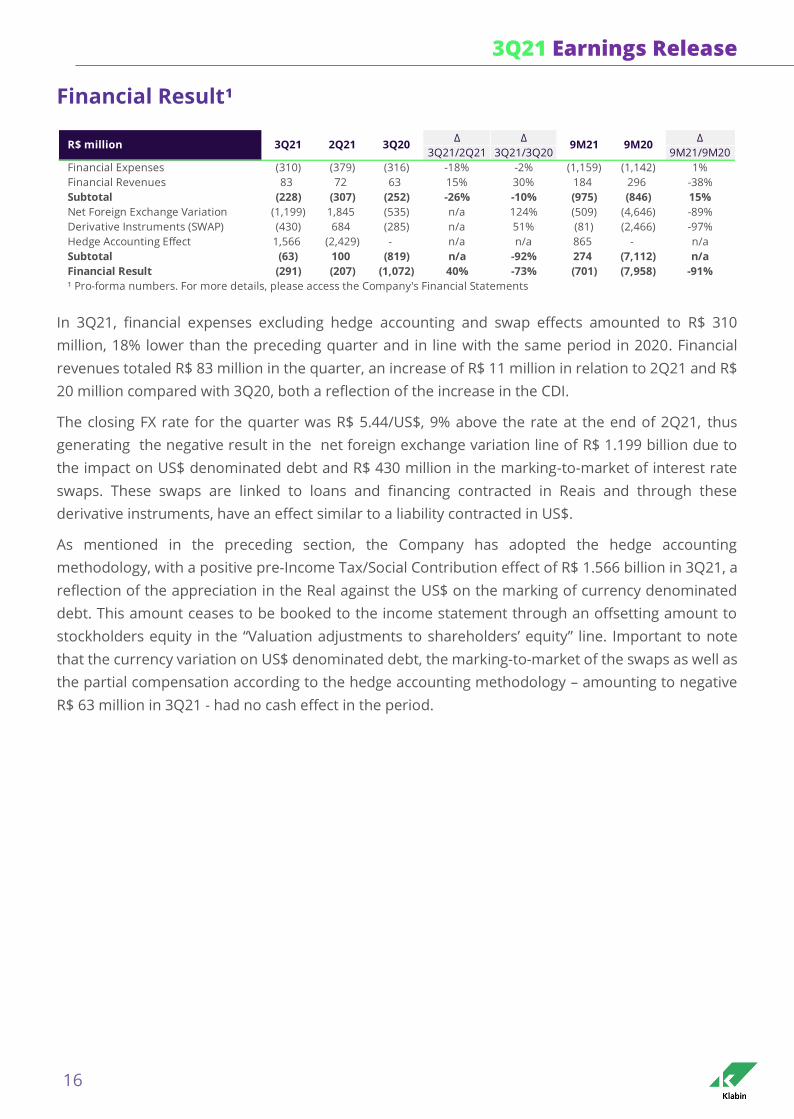
Financial Result¹
In 3Q21, financial expenses excluding hedge accounting and swap effects amounted to R$ 310
million, 18% lower than the preceding quarter and in line with the same period in 2020. Financial
revenues totaled R$ 83 million in the quarter, an increase of R$ 11 million in relation to 2Q21 and R$
20 million compared with 3Q20, both a reflection of the increase in the CDI.
The closing FX rate for the quarter was R$ 5.44/US$, 9% above the rate at the end of 2Q21, thus
generating the negative result in the net foreign exchange variation line of R$ 1.199 billion due to
the impact on US$ denominated debt and R$ 430 million in the marking-to-market of interest rate
swaps. These swaps are linked to loans and financing contracted in Reais and through these
derivative instruments, have an effect similar to a liability contracted in US$.
As mentioned in the preceding section, the Company has adopted the hedge accounting
methodology, with a positive pre-Income Tax/Social Contribution effect of R$ 1.566 billion in 3Q21, a
reflection of the appreciation in the Real against the US$ on the marking of currency denominated
debt. This amount ceases to be booked to the income statement through an offsetting amount to
stockholders equity in the “Valuation adjustments to shareholders’ equity” line. Important to note
that the currency variation on US$ denominated debt, the marking-to-market of the swaps as well as
the partial compensation according to the hedge accounting methodology – amounting to negative
R$ 63 million in 3Q21 - had no cash effect in the period.
∆ ∆ ∆
3Q21/2Q21 3Q21/3Q20 9M21/9M20
Financial Expenses (310) (379) (316) -18% -2% (1,159) (1,142) 1%
Financial Revenues 83 72 63 15% 30% 184 296 -38%
Subtotal (228) (307) (252) -26% -10% (975) (846) 15%
Net Foreign Exchange Variation (1,199) 1,845 (535) n/a 124% (509) (4,646) -89%
Derivative Instruments (SWAP) (430) 684 (285) n/a 51% (81) (2,466) -97%
Hedge Accounting Effect 1,566 (2,429) - n/a n/a 865 - n/a
Subtotal (63) 100 (819) n/a -92% 274 (7,112) n/a
Financial Result (291) (207) (1,072) 40% -73% (701) (7,958) -91%
¹ Pro-forma numbers. For more details, please access the Company's Financial Statements
9M21 9M20R$ million 3Q21 2Q21 3Q20
3Q21 Earnings Release
17
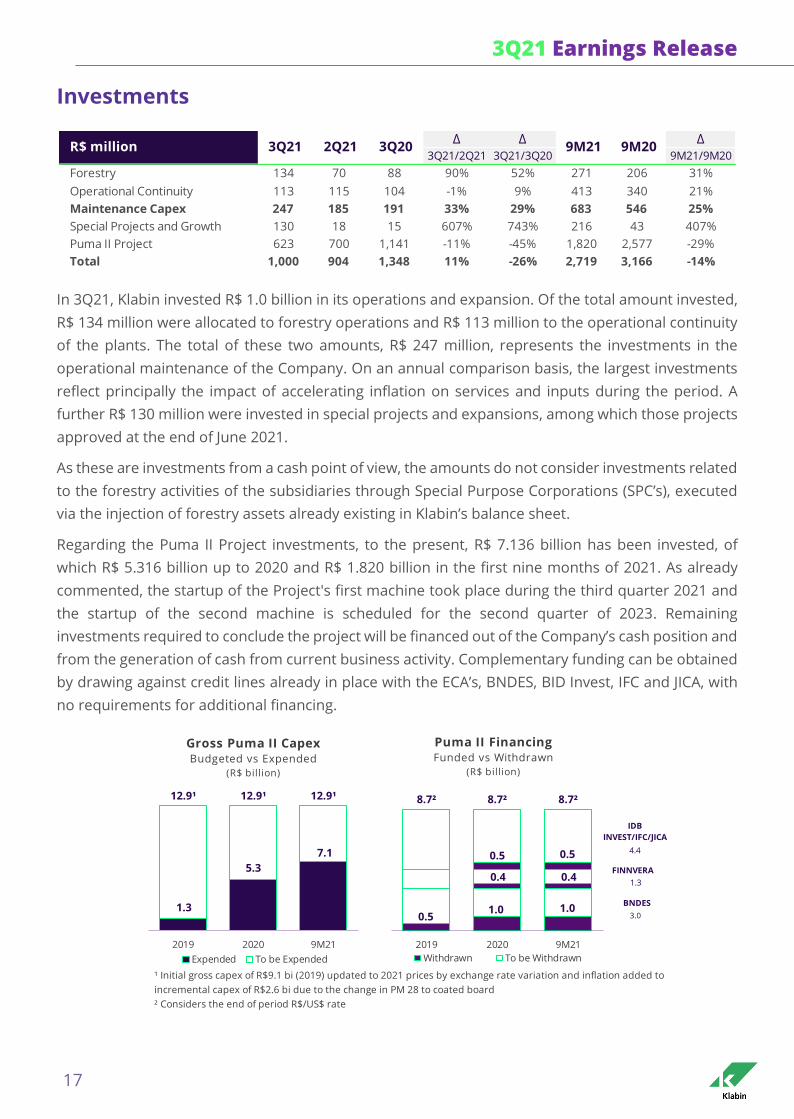
Investments
In 3Q21, Klabin invested R$ 1.0 billion in its operations and expansion. Of the total amount invested,
R$ 134 million were allocated to forestry operations and R$ 113 million to the operational continuity
of the plants. The total of these two amounts, R$ 247 million, represents the investments in the
operational maintenance of the Company. On an annual comparison basis, the largest investments
reflect principally the impact of accelerating inflation on services and inputs during the period. A
further R$ 130 million were invested in special projects and expansions, among which those projects
approved at the end of June 2021.
As these are investments from a cash point of view, the amounts do not consider investments related
to the forestry activities of the subsidiaries through Special Purpose Corporations (SPC’s), executed
via the injection of forestry assets already existing in Klabin’s balance sheet.
Regarding the Puma II Project investments, to the present, R$ 7.136 billion has been invested, of
which R$ 5.316 billion up to 2020 and R$ 1.820 billion in the first nine months of 2021. As already
commented, the startup of the Project's first machine took place during the third quarter 2021 and
the startup of the second machine is scheduled for the second quarter of 2023. Remaining
investments required to conclude the project will be financed out of the Company’s cash position and
from the generation of cash from current business activity. Complementary funding can be obtained
by drawing against credit lines already in place with the ECA’s, BNDES, BID Invest, IFC and JICA, with
no requirements for additional financing.
∆ ∆ ∆3Q21/2Q21 3Q21/3Q20 9M21/9M20
Forestry 134 70 88 90% 52% 271 206 31%
Operational Continuity 113 115 104 -1% 9% 413 340 21%
Maintenance Capex 247 185 191 33% 29% 683 546 25%
Special Projects and Growth 130 18 15 607% 743% 216 43 407%
Puma II Project 623 700 1,141 -11% -45% 1,820 2,577 -29%
Total 1,000 904 1,348 11% -26% 2,719 3,166 -14%
9M21 9M20R$ million 3Q21 2Q21 3Q20
¹ Initial gross capex of R$9.1 bi (2019) updated to 2021 prices by exchange rate variation and inflation added to
incremental capex of R$2.6 bi due to the change in PM 28 to coated board
² Considers the end of period R$/US$ rate
1.3
5.3
7.1
12.9¹ 12.9¹ 12.9¹
2019 2020 9M21
Expended To be Expended
Gross Puma II CapexBudgeted vs Expended
(R$ billion)
0.51.0 1.0
3.0
0.4 0.41.3
FINNVERA
0.5 0.5 4.4
IDB
INVEST/IFC/JICA
8.7² 8.7² 8.7²
2019 2020 9M21
Withdrawn To be Withdrawn
Puma II FinancingFunded vs Withdrawn
(R$ billion)
BNDES
3Q21 Earnings Release
18
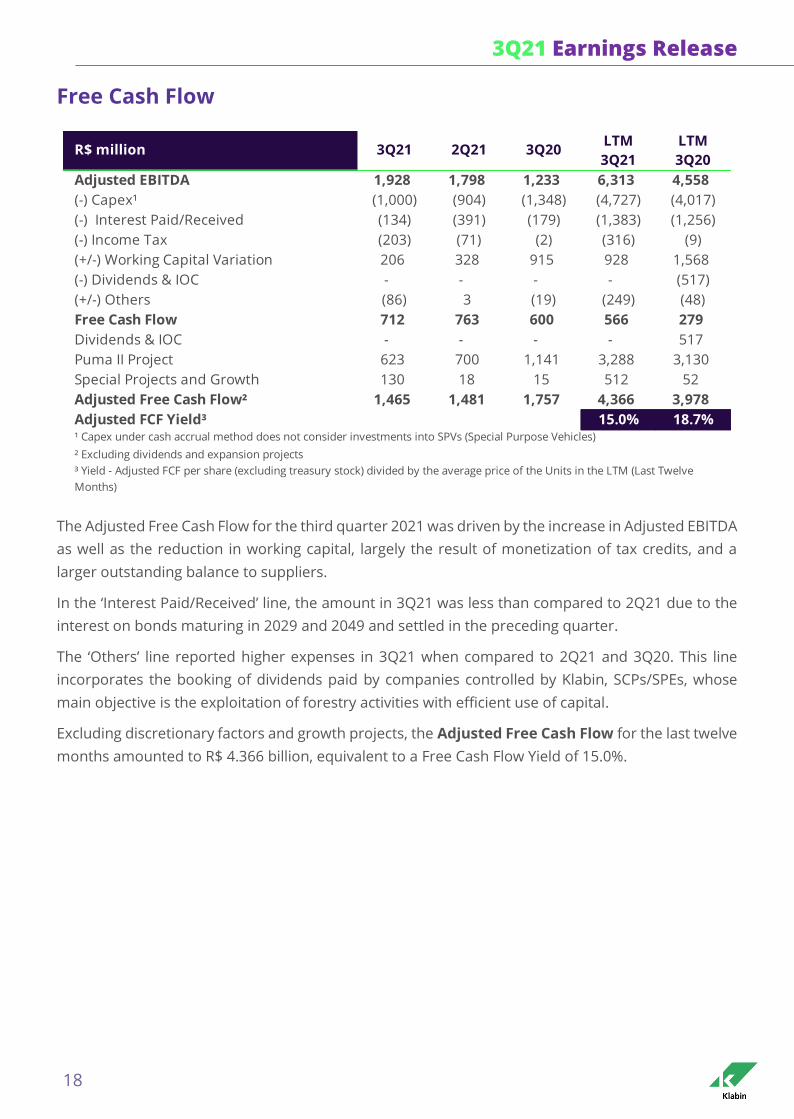
Free Cash Flow
The Adjusted Free Cash Flow for the third quarter 2021 was driven by the increase in Adjusted EBITDA
as well as the reduction in working capital, largely the result of monetization of tax credits, and a
larger outstanding balance to suppliers.
In the ‘Interest Paid/Received’ line, the amount in 3Q21 was less than compared to 2Q21 due to the
interest on bonds maturing in 2029 and 2049 and settled in the preceding quarter.
The ‘Others’ line reported higher expenses in 3Q21 when compared to 2Q21 and 3Q20. This line
incorporates the booking of dividends paid by companies controlled by Klabin, SCPs/SPEs, whose
main objective is the exploitation of forestry activities with efficient use of capital.
Excluding discretionary factors and growth projects, the Adjusted Free Cash Flow for the last twelve
months amounted to R$ 4.366 billion, equivalent to a Free Cash Flow Yield of 15.0%.
LTM LTM
3Q21 3Q20
Adjusted EBITDA 1,928 1,798 1,233 6,313 4,558
(-) Capex¹ (1,000) (904) (1,348) (4,727) (4,017)
(-) Interest Paid/Received (134) (391) (179) (1,383) (1,256)
(-) Income Tax (203) (71) (2) (316) (9)
(+/-) Working Capital Variation 206 328 915 928 1,568
(-) Dividends & IOC - - - - (517)
(+/-) Others (86) 3 (19) (249) (48)
Free Cash Flow 712 763 600 566 279
Dividends & IOC - - - - 517
Puma II Project 623 700 1,141 3,288 3,130
Special Projects and Growth 130 18 15 512 52
Adjusted Free Cash Flow² 1,465 1,481 1,757 4,366 3,978
Adjusted FCF Yield³ 15.0% 18.7%
² Excluding dividends and expansion projects
¹ Capex under cash accrual method does not consider investments into SPVs (Special Purpose Vehicles)
³ Yield - Adjusted FCF per share (excluding treasury stock) divided by the average price of the Units in the LTM (Last Twelve
Months)
R$ million 3Q21 2Q21 3Q20
3Q21 Earnings Release
19
ROIC - Return on Invested Capital
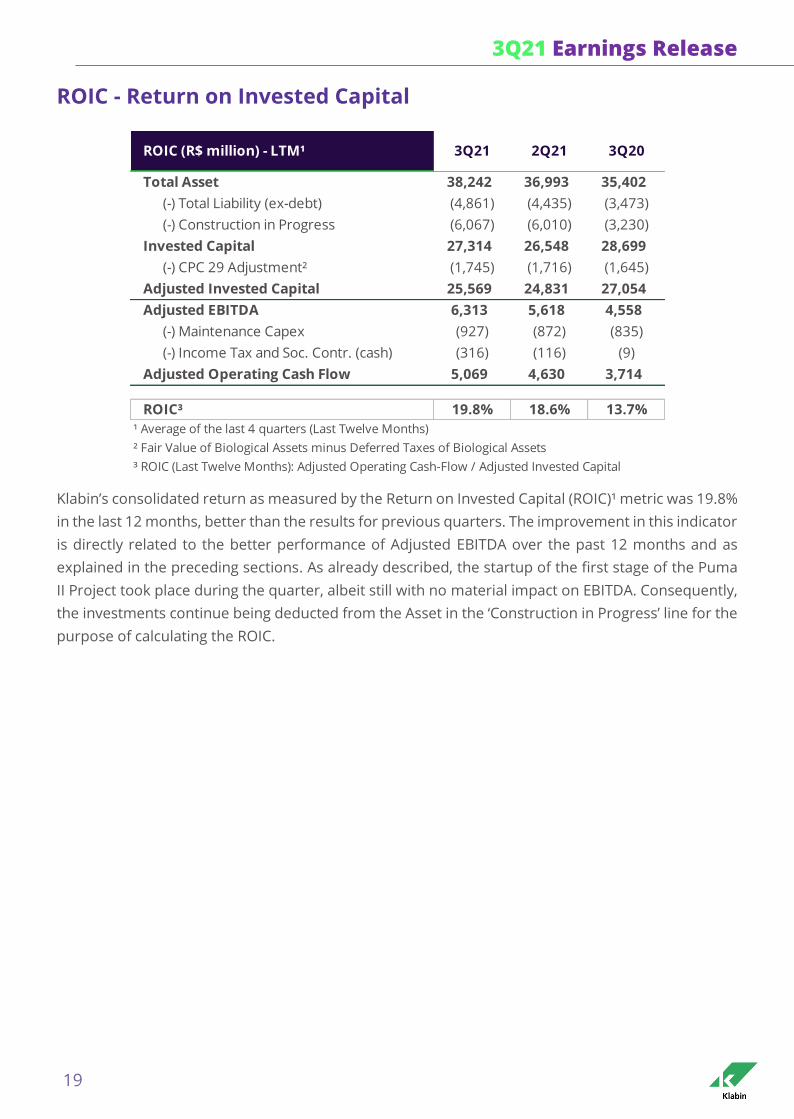
Klabin’s consolidated return as measured by the Return on Invested Capital (ROIC)¹ metric was 19.8%
in the last 12 months, better than the results for previous quarters. The improvement in this indicator
is directly related to the better performance of Adjusted EBITDA over the past 12 months and as
explained in the preceding sections. As already described, the startup of the first stage of the Puma
II Project took place during the quarter, albeit still with no material impact on EBITDA. Consequently,
the investments continue being deducted from the Asset in the ‘Construction in Progress’ line for the
purpose of calculating the ROIC.
Total Asset 38,242 36,993 35,402
(-) Total Liability (ex-debt) (4,861) (4,435) (3,473)
(-) Construction in Progress (6,067) (6,010) (3,230)
Invested Capital 27,314 26,548 28,699
(-) CPC 29 Adjustment² (1,745) (1,716) (1,645)
Adjusted Invested Capital 25,569 24,831 27,054
Adjusted EBITDA 6,313 5,618 4,558
(-) Maintenance Capex (927) (872) (835)
(-) Income Tax and Soc. Contr. (cash) (316) (116) (9)
Adjusted Operating Cash Flow 5,069 4,630 3,714
ROIC³ 19.8% 18.6% 13.7%
¹ Average of the last 4 quarters (Last Twelve Months)
² Fair Value of Biological Assets minus Deferred Taxes of Biological Assets
³ ROIC (Last Twelve Months): Adjusted Operating Cash-Flow / Adjusted Invested Capital
ROIC (R$ million) - LTM¹ 3Q21 2Q21 3Q20
3Q21 Earnings Release
20
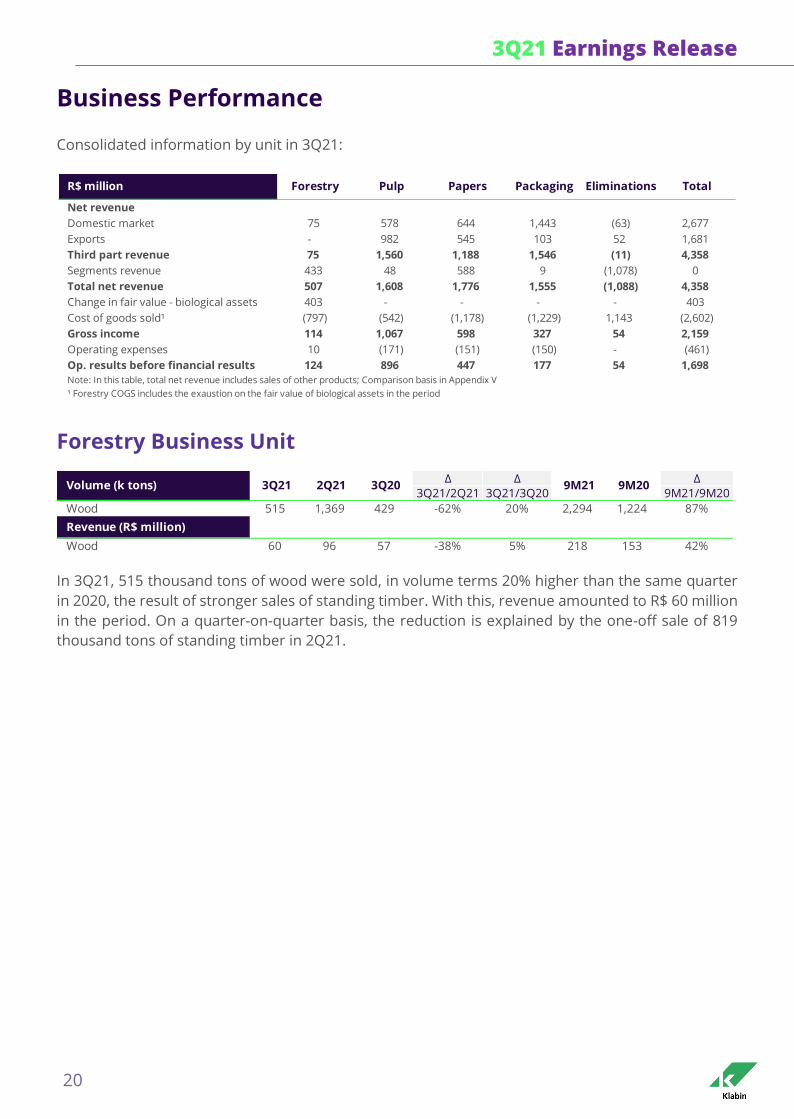
Business Performance
Consolidated information by unit in 3Q21:
Forestry Business Unit
In 3Q21, 515 thousand tons of wood were sold, in volume terms 20% higher than the same quarter
in 2020, the result of stronger sales of standing timber. With this, revenue amounted to R$ 60 million
in the period. On a quarter-on-quarter basis, the reduction is explained by the one-off sale of 819
thousand tons of standing timber in 2Q21.
Net revenue
Domestic market 75 578 644 1,443 (63) 2,677
Exports - 982 545 103 52 1,681
Third part revenue 75 1,560 1,188 1,546 (11) 4,358
Segments revenue 433 48 588 9 (1,078) 0
Total net revenue 507 1,608 1,776 1,555 (1,088) 4,358
Change in fair value - biological assets 403 - - - - 403
Cost of goods sold¹ (797) (542) (1,178) (1,229) 1,143 (2,602)
Gross income 114 1,067 598 327 54 2,159
Operating expenses 10 (171) (151) (150) - (461)
Op. results before financial results 124 896 447 177 54 1,698
Note: In this table, total net revenue includes sales of other products; Comparison basis in Appendix V
¹ Forestry COGS includes the exaustion on the fair value of biological assets in the period
R$ million Forestry Papers PackagingPulp TotalEliminations
∆ ∆ ∆
3Q21/2Q21 3Q21/3Q20 9M21/9M20
Wood 515 1,369 429 -62% 20% 2,294 1,224 87%
Revenue (R$ million)
Wood 60 96 57 -38% 5% 218 153 42%
3Q202Q21 9M21 9M203Q21Volume (k tons)
3Q21 Earnings Release
21
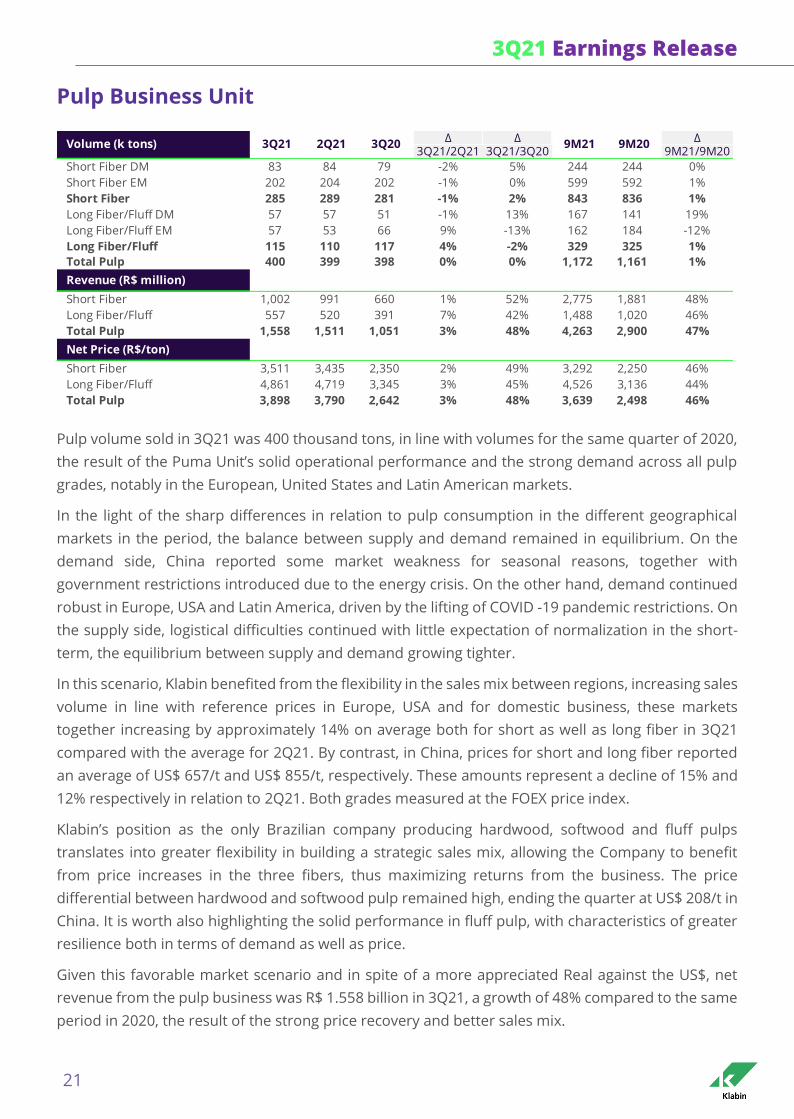
Pulp Business Unit
Pulp volume sold in 3Q21 was 400 thousand tons, in line with volumes for the same quarter of 2020,
the result of the Puma Unit’s solid operational performance and the strong demand across all pulp
grades, notably in the European, United States and Latin American markets.
In the light of the sharp differences in relation to pulp consumption in the different geographical
markets in the period, the balance between supply and demand remained in equilibrium. On the
demand side, China reported some market weakness for seasonal reasons, together with
government restrictions introduced due to the energy crisis. On the other hand, demand continued
robust in Europe, USA and Latin America, driven by the lifting of COVID -19 pandemic restrictions. On
the supply side, logistical difficulties continued with little expectation of normalization in the short-
term, the equilibrium between supply and demand growing tighter.
In this scenario, Klabin benefited from the flexibility in the sales mix between regions, increasing sales
volume in line with reference prices in Europe, USA and for domestic business, these markets
together increasing by approximately 14% on average both for short as well as long fiber in 3Q21
compared with the average for 2Q21. By contrast, in China, prices for short and long fiber reported
an average of US$ 657/t and US$ 855/t, respectively. These amounts represent a decline of 15% and
12% respectively in relation to 2Q21. Both grades measured at the FOEX price index.
Klabin’s position as the only Brazilian company producing hardwood, softwood and fluff pulps
translates into greater flexibility in building a strategic sales mix, allowing the Company to benefit
from price increases in the three fibers, thus maximizing returns from the business. The price
differential between hardwood and softwood pulp remained high, ending the quarter at US$ 208/t in
China. It is worth also highlighting the solid performance in fluff pulp, with characteristics of greater
resilience both in terms of demand as well as price.
Given this favorable market scenario and in spite of a more appreciated Real against the US$, net
revenue from the pulp business was R$ 1.558 billion in 3Q21, a growth of 48% compared to the same
period in 2020, the result of the strong price recovery and better sales mix.
∆ ∆ ∆3Q21/2Q21 3Q21/3Q20 9M21/9M20
Short Fiber DM 83 84 79 -2% 5% 244 244 0%
Short Fiber EM 202 204 202 -1% 0% 599 592 1%
Short Fiber 285 289 281 -1% 2% 843 836 1%
Long Fiber/Fluff DM 57 57 51 -1% 13% 167 141 19%
Long Fiber/Fluff EM 57 53 66 9% -13% 162 184 -12%
Long Fiber/Fluff 115 110 117 4% -2% 329 325 1%
Total Pulp 400 399 398 0% 0% 1,172 1,161 1%
Revenue (R$ million)
Short Fiber 1,002 991 660 1% 52% 2,775 1,881 48%
Long Fiber/Fluff 557 520 391 7% 42% 1,488 1,020 46%
Total Pulp 1,558 1,511 1,051 3% 48% 4,263 2,900 47%
Net Price (R$/ton)
Short Fiber 3,511 3,435 2,350 2% 49% 3,292 2,250 46%
Long Fiber/Fluff 4,861 4,719 3,345 3% 45% 4,526 3,136 44%
Total Pulp 3,898 3,790 2,642 3% 48% 3,639 2,498 46%
Volume (k tons) 3Q21 2Q21 3Q20 9M21 9M20
3Q21 Earnings Release
22
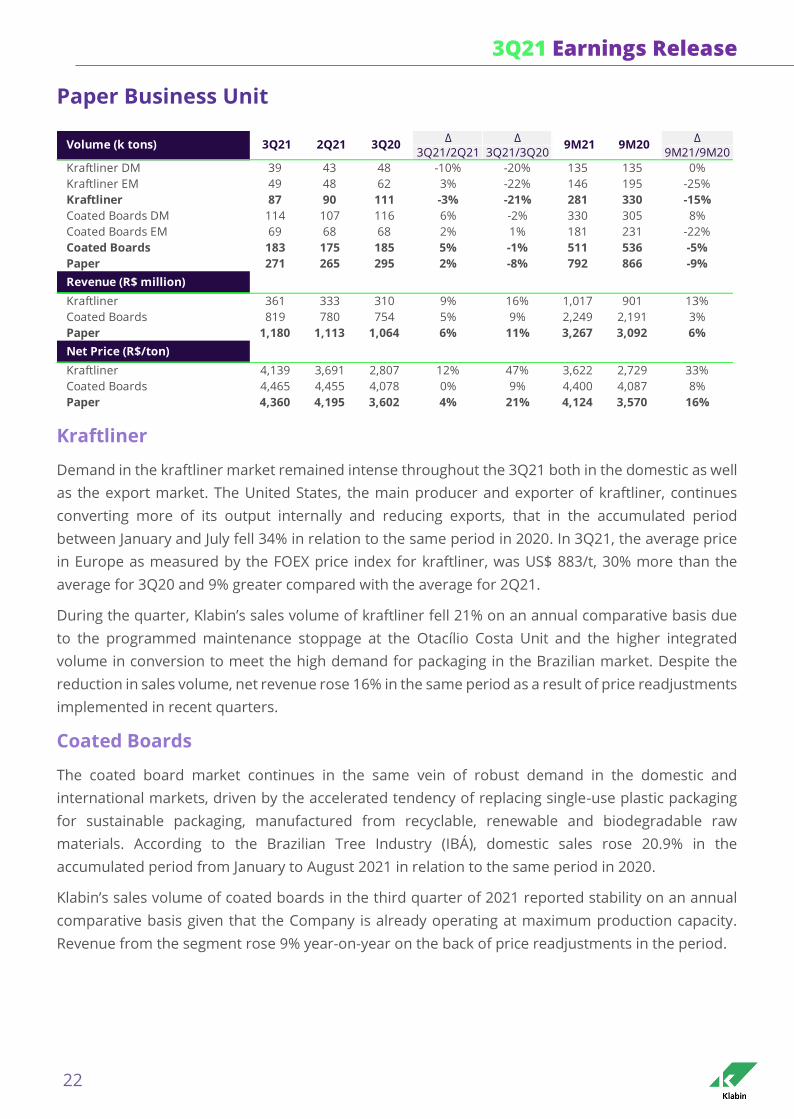
Paper Business Unit
Kraftliner
Demand in the kraftliner market remained intense throughout the 3Q21 both in the domestic as well
as the export market. The United States, the main producer and exporter of kraftliner, continues
converting more of its output internally and reducing exports, that in the accumulated period
between January and July fell 34% in relation to the same period in 2020. In 3Q21, the average price
in Europe as measured by the FOEX price index for kraftliner, was US$ 883/t, 30% more than the
average for 3Q20 and 9% greater compared with the average for 2Q21.
During the quarter, Klabin’s sales volume of kraftliner fell 21% on an annual comparative basis due
to the programmed maintenance stoppage at the Otacílio Costa Unit and the higher integrated
volume in conversion to meet the high demand for packaging in the Brazilian market. Despite the
reduction in sales volume, net revenue rose 16% in the same period as a result of price readjustments
implemented in recent quarters.
Coated Boards
The coated board market continues in the same vein of robust demand in the domestic and
international markets, driven by the accelerated tendency of replacing single-use plastic packaging
for sustainable packaging, manufactured from recyclable, renewable and biodegradable raw
materials. According to the Brazilian Tree Industry (IBÁ), domestic sales rose 20.9% in the
accumulated period from January to August 2021 in relation to the same period in 2020.
Klabin’s sales volume of coated boards in the third quarter of 2021 reported stability on an annual
comparative basis given that the Company is already operating at maximum production capacity.
Revenue from the segment rose 9% year-on-year on the back of price readjustments in the period.
∆ ∆ ∆
3Q21/2Q21 3Q21/3Q20 9M21/9M20
Kraftliner DM 39 43 48 -10% -20% 135 135 0%
Kraftliner EM 49 48 62 3% -22% 146 195 -25%
Kraftliner 87 90 111 -3% -21% 281 330 -15%
Coated Boards DM 114 107 116 6% -2% 330 305 8%
Coated Boards EM 69 68 68 2% 1% 181 231 -22%
Coated Boards 183 175 185 5% -1% 511 536 -5%
Paper 271 265 295 2% -8% 792 866 -9%
Revenue (R$ million)
Kraftliner 361 333 310 9% 16% 1,017 901 13%
Coated Boards 819 780 754 5% 9% 2,249 2,191 3%
Paper 1,180 1,113 1,064 6% 11% 3,267 3,092 6%
Net Price (R$/ton)
Kraftliner 4,139 3,691 2,807 12% 47% 3,622 2,729 33%
Coated Boards 4,465 4,455 4,078 0% 9% 4,400 4,087 8%
Paper 4,360 4,195 3,602 4% 21% 4,124 3,570 16%
2Q21 3Q20Volume (k tons) 3Q21 9M21 9M20
3Q21 Earnings Release
23
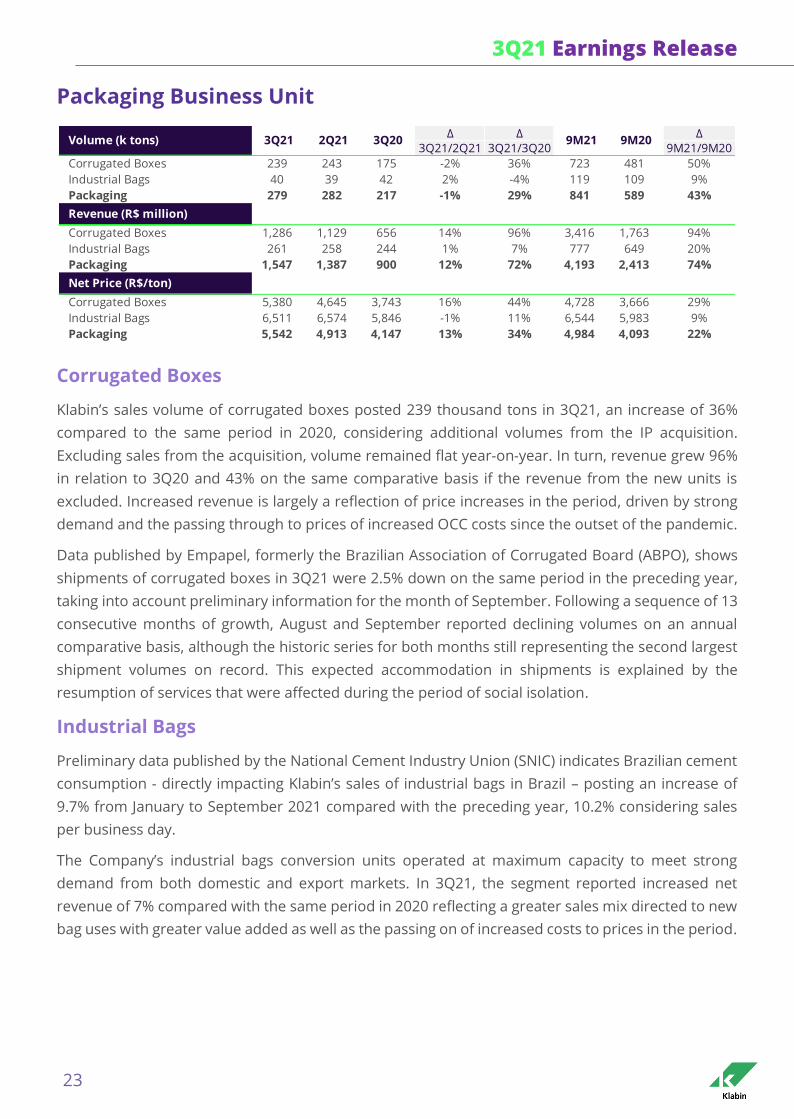
Packaging Business Unit
Corrugated Boxes
Klabin’s sales volume of corrugated boxes posted 239 thousand tons in 3Q21, an increase of 36%
compared to the same period in 2020, considering additional volumes from the IP acquisition.
Excluding sales from the acquisition, volume remained flat year-on-year. In turn, revenue grew 96%
in relation to 3Q20 and 43% on the same comparative basis if the revenue from the new units is
excluded. Increased revenue is largely a reflection of price increases in the period, driven by strong
demand and the passing through to prices of increased OCC costs since the outset of the pandemic.
Data published by Empapel, formerly the Brazilian Association of Corrugated Board (ABPO), shows
shipments of corrugated boxes in 3Q21 were 2.5% down on the same period in the preceding year,
taking into account preliminary information for the month of September. Following a sequence of 13
consecutive months of growth, August and September reported declining volumes on an annual
comparative basis, although the historic series for both months still representing the second largest
shipment volumes on record. This expected accommodation in shipments is explained by the
resumption of services that were affected during the period of social isolation.
Industrial Bags
Preliminary data published by the National Cement Industry Union (SNIC) indicates Brazilian cement
consumption - directly impacting Klabin’s sales of industrial bags in Brazil – posting an increase of
9.7% from January to September 2021 compared with the preceding year, 10.2% considering sales
per business day.
The Company’s industrial bags conversion units operated at maximum capacity to meet strong
demand from both domestic and export markets. In 3Q21, the segment reported increased net
revenue of 7% compared with the same period in 2020 reflecting a greater sales mix directed to new
bag uses with greater value added as well as the passing on of increased costs to prices in the period.
∆ ∆ ∆
3Q21/2Q21 3Q21/3Q20 9M21/9M20
Corrugated Boxes 239 243 175 -2% 36% 723 481 50%
Industrial Bags 40 39 42 2% -4% 119 109 9%
Packaging 279 282 217 -1% 29% 841 589 43%
Revenue (R$ million)
Corrugated Boxes 1,286 1,129 656 14% 96% 3,416 1,763 94%
Industrial Bags 261 258 244 1% 7% 777 649 20%
Packaging 1,547 1,387 900 12% 72% 4,193 2,413 74%
Net Price (R$/ton)
Corrugated Boxes 5,380 4,645 3,743 16% 44% 4,728 3,666 29%
Industrial Bags 6,511 6,574 5,846 -1% 11% 6,544 5,983 9%
Packaging 5,542 4,913 4,147 13% 34% 4,984 4,093 22%
3Q20Volume (k tons) 3Q21 2Q21 9M21 9M20
3Q21 Earnings Release
24
Capital Markets
Equity Income
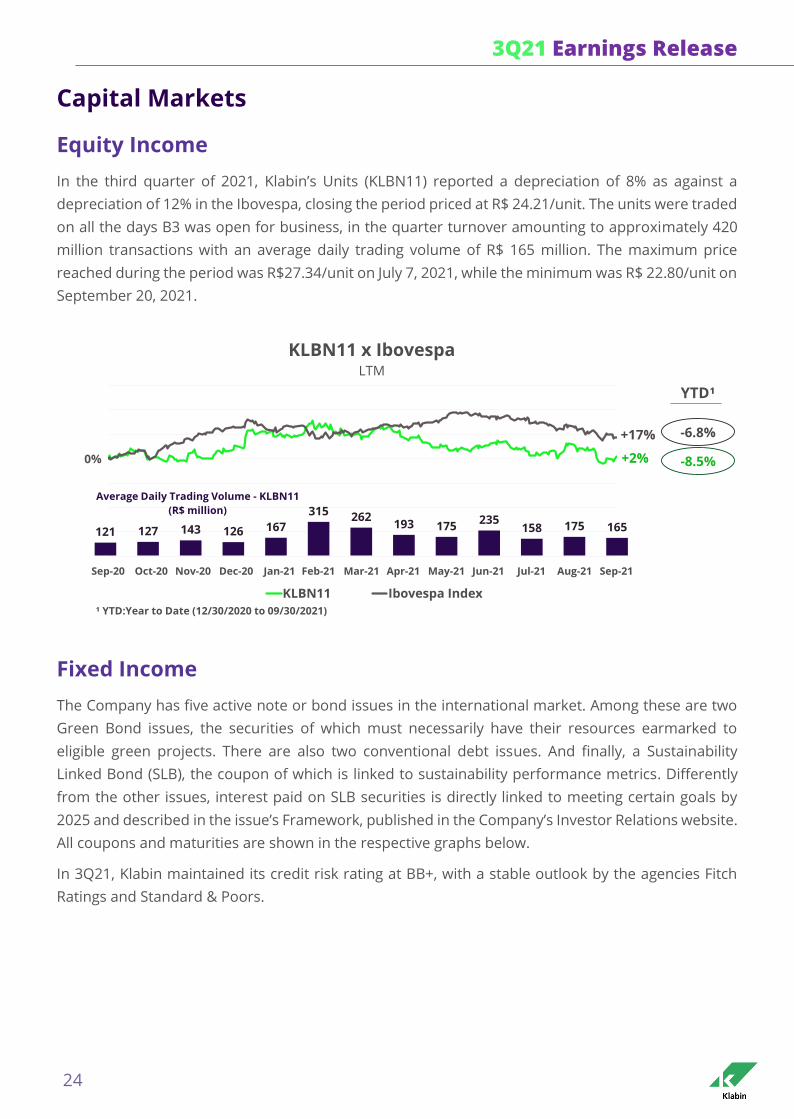
In the third quarter of 2021, Klabin’s Units (KLBN11) reported a depreciation of 8% as against a
depreciation of 12% in the Ibovespa, closing the period priced at R$ 24.21/unit. The units were traded
on all the days B3 was open for business, in the quarter turnover amounting to approximately 420
million transactions with an average daily trading volume of R$ 165 million. The maximum price
reached during the period was R$27.34/unit on July 7, 2021, while the minimum was R$ 22.80/unit on
September 20, 2021.
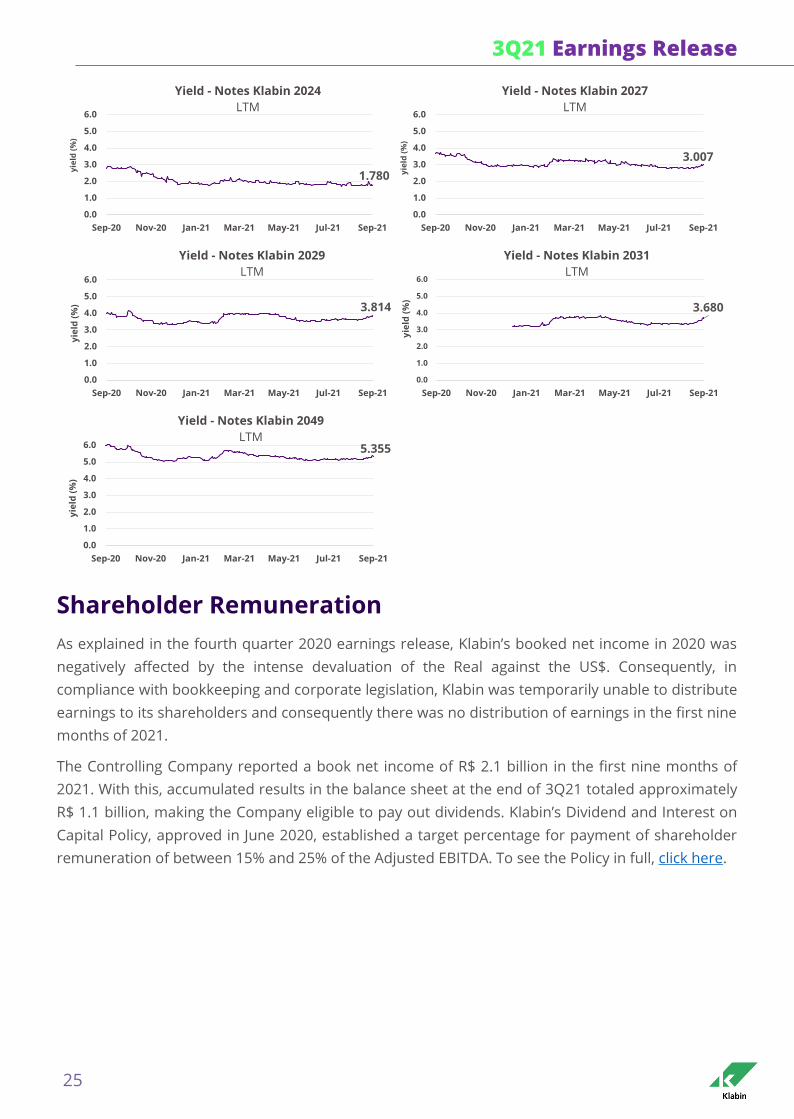
Fixed Income
The Company has five active note or bond issues in the international market. Among these are two
Green Bond issues, the securities of which must necessarily have their resources earmarked to
eligible green projects. There are also two conventional debt issues. And finally, a Sustainability
Linked Bond (SLB), the coupon of which is linked to sustainability performance metrics. Differently
from the other issues, interest paid on SLB securities is directly linked to meeting certain goals by
2025 and described in the issue’s Framework, published in the Company’s Investor Relations website.
All coupons and maturities are shown in the respective graphs below.
In 3Q21, Klabin maintained its credit risk rating at BB+, with a stable outlook by the agencies Fitch
Ratings and Standard & Poors.
Sep-20 Oct-20 Nov-20 Dec-20 Jan-21 Feb-21 Mar-21 Apr-21 May-21 Jun-21 Jul-21 Aug-21 Sep-21
KLBN11 x IbovespaLTM
KLBN11 Ibovespa Index
+17%
+2%0%
¹ YTD:Year to Date (12/30/2020 to 09/30/2021)
121 127 143 126 167
315 262193 175
235158 175 165
Average Daily Trading Volume - KLBN11
(R$ million)
-8.5%
YTD¹
-6.8%
3Q21 Earnings Release
25
Shareholder Remuneration
As explained in the fourth quarter 2020 earnings release, Klabin’s booked net income in 2020 was
negatively affected by the intense devaluation of the Real against the US$. Consequently, in
compliance with bookkeeping and corporate legislation, Klabin was temporarily unable to distribute
earnings to its shareholders and consequently there was no distribution of earnings in the first nine
months of 2021.
The Controlling Company reported a book net income of R$ 2.1 billion in the first nine months of
2021. With this, accumulated results in the balance sheet at the end of 3Q21 totaled approximately
R$ 1.1 billion, making the Company eligible to pay out dividends. Klabin’s Dividend and Interest on
Capital Policy, approved in June 2020, established a target percentage for payment of shareholder
remuneration of between 15% and 25% of the Adjusted EBITDA. To see the Policy in full, click here.
3.814
0.0
1.0
2.0
3.0
4.0
5.0
6.0
Sep-20 Nov-20 Jan-21 Mar-21 May-21 Jul-21 Sep-21
yie
ld (
%)
Yield - Notes Klabin 2029
LTM
3.007
0.0
1.0
2.0
3.0
4.0
5.0
6.0
Sep-20 Nov-20 Jan-21 Mar-21 May-21 Jul-21 Sep-21
yie
ld (
%)
Yield - Notes Klabin 2027
LTM
3.680
0.0
1.0
2.0
3.0
4.0
5.0
6.0
Sep-20 Nov-20 Jan-21 Mar-21 May-21 Jul-21 Sep-21
yie
ld (
%)
Yield - Notes Klabin 2031
LTM
1.780
0.0
1.0
2.0
3.0
4.0
5.0
6.0
Sep-20 Nov-20 Jan-21 Mar-21 May-21 Jul-21 Sep-21
yie
ld (
%)
Yield - Notes Klabin 2024
LTM
5.355
0.0
1.0
2.0
3.0
4.0
5.0
6.0
Sep-20 Nov-20 Jan-21 Mar-21 May-21 Jul-21 Sep-21
yie
ld (
%)
Yield - Notes Klabin 2049
LTM
3Q21 Earnings Release
26
Subsequent Events
Revolving Credit Facility Agreement
Pursuant to the Notice to the Market published on October 7, 2021, the Company contracted a
Revolving Credit Facility worth US$ 500 million, characterized as Sustainability-Linked. The cost of this
facility is conditional on the annual performance of the environmental indicator relative to the
increased reutilization of solid industrial waste. To access the Notice, please click here.
Green Bonds Report
On October 20, 2021, according to the Notice the Market released, Klabin published its annual Green
Bonds Report. In this report, Klabin accounts for the use of resources raised under the Green Bonds
in the period from July 2020 and June 2021. To access the Report, please click here.
3Q21 Earnings Release
27
Conference Call
English (Simultaneous Translation)
Wednesday, October 27, 2021
Time: 10:00 a.m. (NYC) / 11:00 a.m. (Brasília)
Phone: +1 412 717 9627 or +1 844 204 8942
Code: Klabin
Access via HD Web Phone: click here
Access via Webcast: click here
Replay: +55 11 3193-1012
Code: 5169469#
Portuguese
Wednesday, October 27, 2021
Time: 11:00 a.m. (Brasília) / 10:00 a.m. (NYC)
Phone: +55 11 4090-1621
Code: Klabin
Access via HD Web Phone: click here
Access via Webcast: click here
Replay: +55 11 3193-1012
Code: 8374387#
IR Channels
Investor Relations website: http://ri.klabin.com.br
Klabin Invest: video and podcast platform available on YouTube and Spotify
E-mail: [email protected]
Phone: +55 11 3046-8401
The Investor Relations team is at your disposal:
Marcos Ivo – Chief Financial and Investor Relations Officer
Marcos Maciel – IR Manager
Luiza Chaves – IR Coordinator
Anna Atui – IR Analyst
Fabiana Cruz – IR Analyst
Rafaela Silveira – IR Analyst
Marcos Ribeiro – IR Intern
Statements in this release relative to the Company’s business perspectives, estimates of operational and financial results
and the growth potential of the Company are merely forecasts and based on Management expectations in relation to
the future of the Company. These expectations are highly dependent on market changes, on the general economic
performance of Brazil, on the industry and on international markets, therefore being subject to change.
3Q21 Earnings Release
28
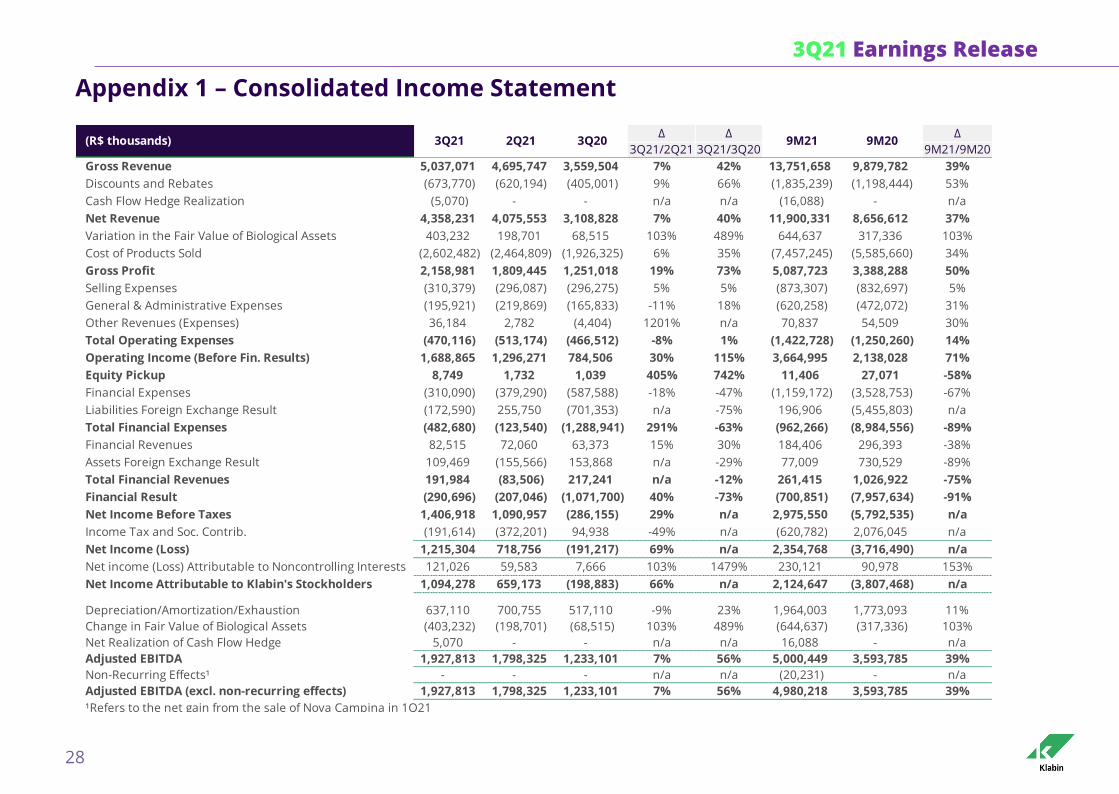
Appendix 1 – Consolidated Income Statement
∆ ∆ ∆
3Q21/2Q21 3Q21/3Q20 9M21/9M20
Gross Revenue 5,037,071 4,695,747 3,559,504 7% 42% 13,751,658 9,879,782 39%
Discounts and Rebates (673,770) (620,194) (405,001) 9% 66% (1,835,239) (1,198,444) 53%
Cash Flow Hedge Realization (5,070) - - n/a n/a (16,088) - n/a
Net Revenue 4,358,231 4,075,553 3,108,828 7% 40% 11,900,331 8,656,612 37%
Variation in the Fair Value of Biological Assets 403,232 198,701 68,515 103% 489% 644,637 317,336 103%
Cost of Products Sold (2,602,482) (2,464,809) (1,926,325) 6% 35% (7,457,245) (5,585,660) 34%
Gross Profit 2,158,981 1,809,445 1,251,018 19% 73% 5,087,723 3,388,288 50%
Selling Expenses (310,379) (296,087) (296,275) 5% 5% (873,307) (832,697) 5%
General & Administrative Expenses (195,921) (219,869) (165,833) -11% 18% (620,258) (472,072) 31%
Other Revenues (Expenses) 36,184 2,782 (4,404) 1201% n/a 70,837 54,509 30%
Total Operating Expenses (470,116) (513,174) (466,512) -8% 1% (1,422,728) (1,250,260) 14%
Operating Income (Before Fin. Results) 1,688,865 1,296,271 784,506 30% 115% 3,664,995 2,138,028 71%
Equity Pickup 8,749 1,732 1,039 405% 742% 11,406 27,071 -58%
Financial Expenses (310,090) (379,290) (587,588) -18% -47% (1,159,172) (3,528,753) -67%
Liabilities Foreign Exchange Result (172,590) 255,750 (701,353) n/a -75% 196,906 (5,455,803) n/a
Total Financial Expenses (482,680) (123,540) (1,288,941) 291% -63% (962,266) (8,984,556) -89%
Financial Revenues 82,515 72,060 63,373 15% 30% 184,406 296,393 -38%
Assets Foreign Exchange Result 109,469 (155,566) 153,868 n/a -29% 77,009 730,529 -89%
Total Financial Revenues 191,984 (83,506) 217,241 n/a -12% 261,415 1,026,922 -75%
Financial Result (290,696) (207,046) (1,071,700) 40% -73% (700,851) (7,957,634) -91%
Net Income Before Taxes 1,406,918 1,090,957 (286,155) 29% n/a 2,975,550 (5,792,535) n/a
Income Tax and Soc. Contrib. (191,614) (372,201) 94,938 -49% n/a (620,782) 2,076,045 n/a
Net Income (Loss) 1,215,304 718,756 (191,217) 69% n/a 2,354,768 (3,716,490) n/a
Net income (Loss) Attributable to Noncontrolling Interests 121,026 59,583 7,666 103% 1479% 230,121 90,978 153%
Net Income Attributable to Klabin's Stockholders 1,094,278 659,173 (198,883) 66% n/a 2,124,647 (3,807,468) n/a
Depreciation/Amortization/Exhaustion 637,110 700,755 517,110 -9% 23% 1,964,003 1,773,093 11%
Change in Fair Value of Biological Assets (403,232) (198,701) (68,515) 103% 489% (644,637) (317,336) 103%
Net Realization of Cash Flow Hedge 5,070 - - n/a n/a 16,088 - n/a
Adjusted EBITDA 1,927,813 1,798,325 1,233,101 7% 56% 5,000,449 3,593,785 39%
Non-Recurring Effects¹ - - - n/a n/a (20,231) - n/a
Adjusted EBITDA (excl. non-recurring effects) 1,927,813 1,798,325 1,233,101 7% 56% 4,980,218 3,593,785 39%
¹Refers to the net gain from the sale of Nova Campina in 1Q21
9M20(R$ thousands) 2Q21 3Q203Q21 9M21
3Q21 Earnings Release
29
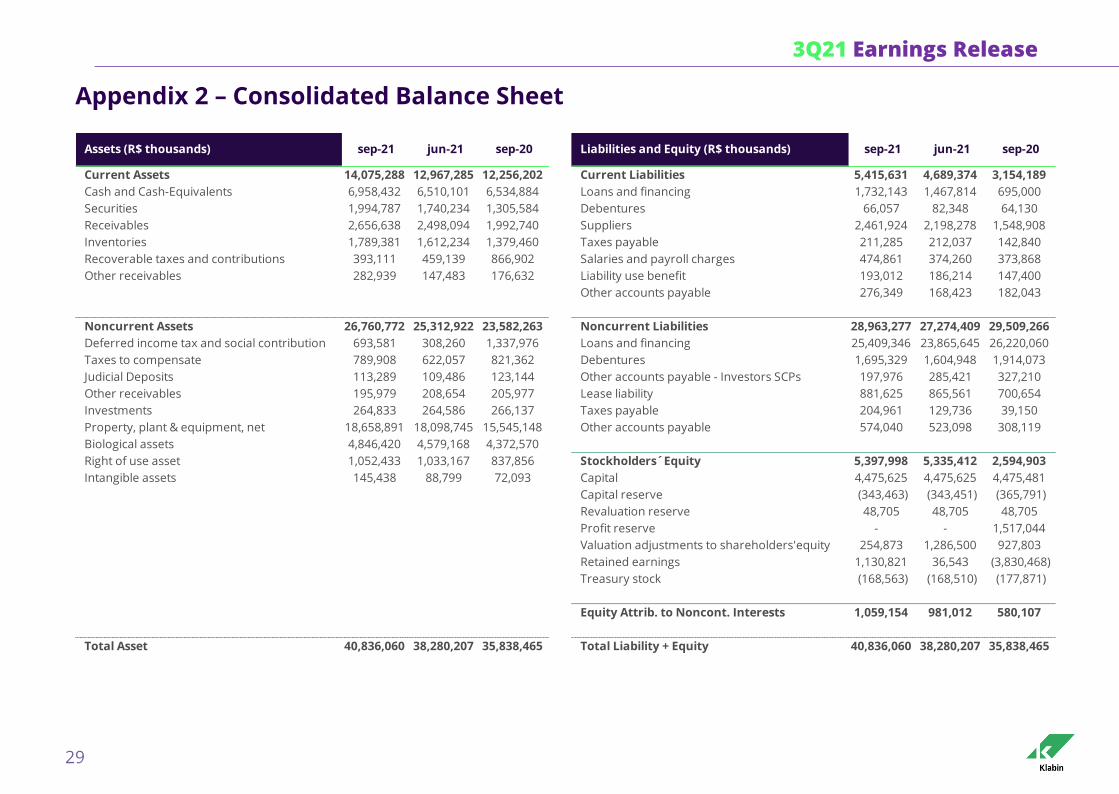
Appendix 2 – Consolidated Balance Sheet
Current Assets 14,075,288 12,967,285 12,256,202 Current Liabilities 5,415,631 4,689,374 3,154,189
Cash and Cash-Equivalents 6,958,432 6,510,101 6,534,884 Loans and financing 1,732,143 1,467,814 695,000
Securities 1,994,787 1,740,234 1,305,584 Debentures 66,057 82,348 64,130
Receivables 2,656,638 2,498,094 1,992,740 Suppliers 2,461,924 2,198,278 1,548,908
Inventories 1,789,381 1,612,234 1,379,460 Taxes payable 211,285 212,037 142,840
Recoverable taxes and contributions 393,111 459,139 866,902 Salaries and payroll charges 474,861 374,260 373,868
Other receivables 282,939 147,483 176,632 Liability use benefit 193,012 186,214 147,400
Other accounts payable 276,349 168,423 182,043
Noncurrent Assets 26,760,772 25,312,922 23,582,263 Noncurrent Liabilities 28,963,277 27,274,409 29,509,266
Deferred income tax and social contribution 693,581 308,260 1,337,976 Loans and financing 25,409,346 23,865,645 26,220,060
Taxes to compensate 789,908 622,057 821,362 Debentures 1,695,329 1,604,948 1,914,073
Judicial Deposits 113,289 109,486 123,144 Other accounts payable - Investors SCPs 197,976 285,421 327,210
Other receivables 195,979 208,654 205,977 Lease liability 881,625 865,561 700,654
Investments 264,833 264,586 266,137 Taxes payable 204,961 129,736 39,150
Property, plant & equipment, net 18,658,891 18,098,745 15,545,148 Other accounts payable 574,040 523,098 308,119
Biological assets 4,846,420 4,579,168 4,372,570
Right of use asset 1,052,433 1,033,167 837,856 Stockholders´Equity 5,397,998 5,335,412 2,594,903
Intangible assets 145,438 88,799 72,093 Capital 4,475,625 4,475,625 4,475,481
Capital reserve (343,463) (343,451) (365,791)
Revaluation reserve 48,705 48,705 48,705
Profit reserve - - 1,517,044
Valuation adjustments to shareholders'equity 254,873 1,286,500 927,803
Retained earnings 1,130,821 36,543 (3,830,468)
Treasury stock (168,563) (168,510) (177,871)
Equity Attrib. to Noncont. Interests 1,059,154 981,012 580,107
Total Asset 40,836,060 38,280,207 35,838,465 Total Liability + Equity 40,836,060 38,280,207 35,838,465
sep-20jun-21Assets (R$ thousands) sep-21 jun-21 Liabilities and Equity (R$ thousands) sep-21sep-20
3Q21 Earnings Release
30
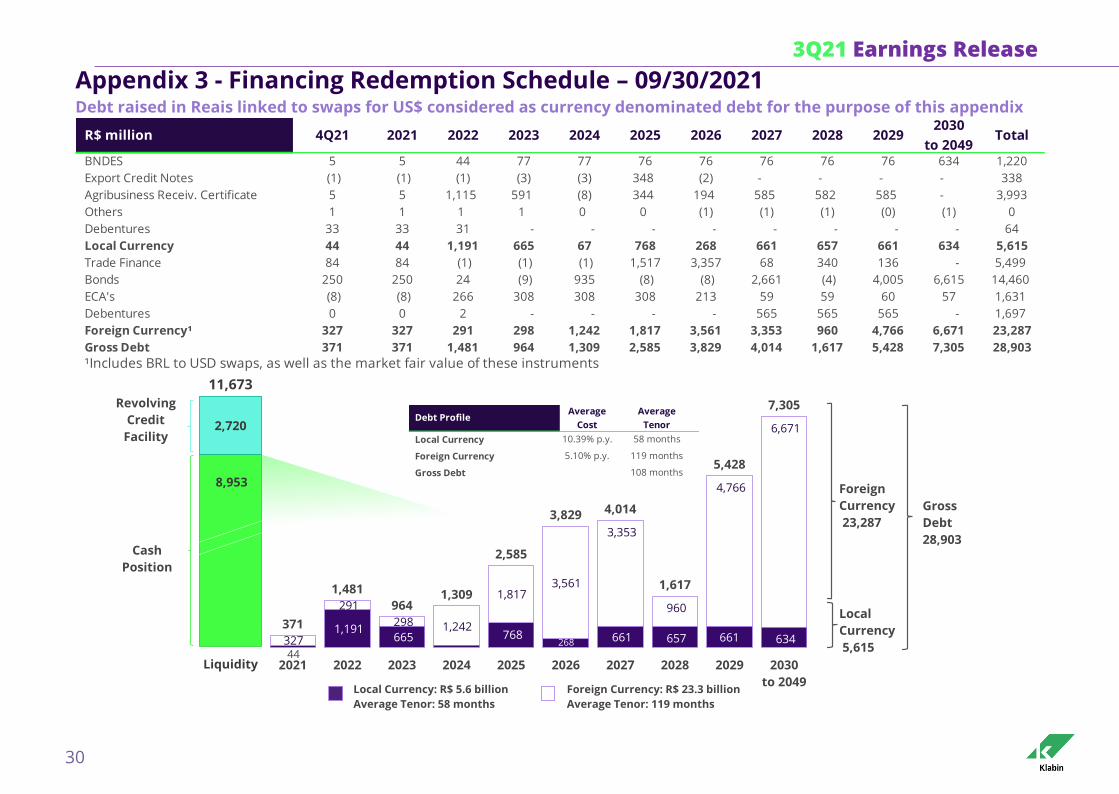
Appendix 3 - Financing Redemption Schedule – 09/30/2021 Debt raised in Reais linked to swaps for US$ considered as currency denominated debt for the purpose of this appendix
R$ million 4Q21 2021 2022 2023 2024 2025 2026 2027 2028 20292030
to 2049Total
BNDES 5 5 44 77 77 76 76 76 76 76 634 1,220
Export Credit Notes (1) (1) (1) (3) (3) 348 (2) - - - - 338
Agribusiness Receiv. Certificate 5 5 1,115 591 (8) 344 194 585 582 585 - 3,993
Others 1 1 1 1 0 0 (1) (1) (1) (0) (1) 0
Debentures 33 33 31 - - - - - - - - 64
Local Currency 44 44 1,191 665 67 768 268 661 657 661 634 5,615
Trade Finance 84 84 (1) (1) (1) 1,517 3,357 68 340 136 - 5,499
Bonds 250 250 24 (9) 935 (8) (8) 2,661 (4) 4,005 6,615 14,460
ECA's (8) (8) 266 308 308 308 213 59 59 60 57 1,631
Debentures 0 0 2 - - - - 565 565 565 - 1,697
Foreign Currency¹ 327 327 291 298 1,242 1,817 3,561 3,353 960 4,766 6,671 23,287
Gross Debt 371 371 1,481 964 1,309 2,585 3,829 4,014 1,617 5,428 7,305 28,903
¹Includes BRL to USD swaps, as well as the market fair value of these instruments
44
1,191 665 768
268 661 657 661 634 327
291
298 1,242
1,817 3,561
3,353
960
4,766
6,671
371
1,481
9641,309
2,585
3,829 4,014
1,617
5,428
7,305
2021 2022 2023 2024 2025 2026 2027 2028 2029 2030
to 2049Local Currency: R$ 5.6 billion
Average Tenor: 58 months
Foreign Currency: R$ 23.3 billion
Average Tenor: 119 months
Foreign
Currency
23,287
Local
Currency
5,615
Gross
Debt
28,903
8,953
2,720
11,673
Liquidity
Revolving
Credit
Facility
Cash
Position
Local Currency
Foreign Currency
Gross Debt
Debt ProfileAverage
Cost
Average
Tenor
10.39% p.y. 58 months
5.10% p.y. 119 months
108 months
3Q21 Earnings Release
31
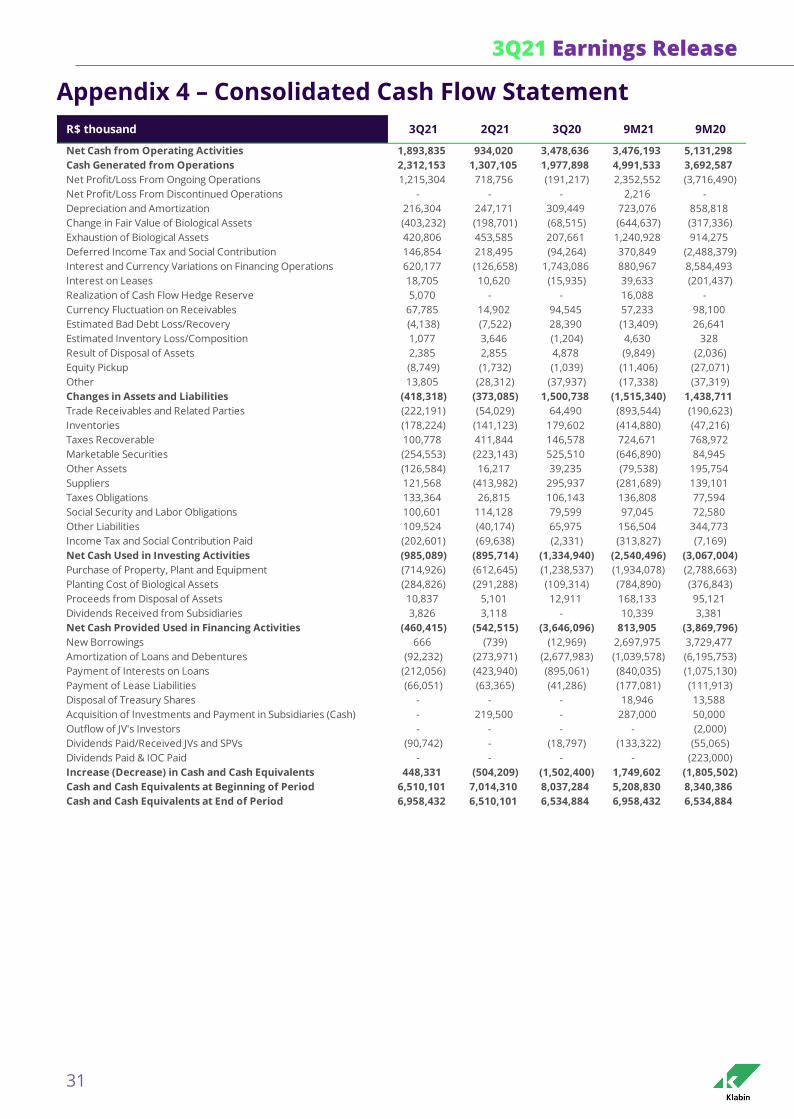
Appendix 4 – Consolidated Cash Flow Statement
Net Cash from Operating Activities 1,893,835 934,020 3,478,636 3,476,193 5,131,298
Cash Generated from Operations 2,312,153 1,307,105 1,977,898 4,991,533 3,692,587
Net Profit/Loss From Ongoing Operations 1,215,304 718,756 (191,217) 2,352,552 (3,716,490)
Net Profit/Loss From Discontinued Operations - - - 2,216 -
Depreciation and Amortization 216,304 247,171 309,449 723,076 858,818
Change in Fair Value of Biological Assets (403,232) (198,701) (68,515) (644,637) (317,336)
Exhaustion of Biological Assets 420,806 453,585 207,661 1,240,928 914,275
Deferred Income Tax and Social Contribution 146,854 218,495 (94,264) 370,849 (2,488,379)
Interest and Currency Variations on Financing Operations 620,177 (126,658) 1,743,086 880,967 8,584,493
Interest on Leases 18,705 10,620 (15,935) 39,633 (201,437)
Realization of Cash Flow Hedge Reserve 5,070 - - 16,088 -
Currency Fluctuation on Receivables 67,785 14,902 94,545 57,233 98,100
Estimated Bad Debt Loss/Recovery (4,138) (7,522) 28,390 (13,409) 26,641
Estimated Inventory Loss/Composition 1,077 3,646 (1,204) 4,630 328
Result of Disposal of Assets 2,385 2,855 4,878 (9,849) (2,036)
Equity Pickup (8,749) (1,732) (1,039) (11,406) (27,071)
Other 13,805 (28,312) (37,937) (17,338) (37,319)
Changes in Assets and Liabilities (418,318) (373,085) 1,500,738 (1,515,340) 1,438,711
Trade Receivables and Related Parties (222,191) (54,029) 64,490 (893,544) (190,623)
Inventories (178,224) (141,123) 179,602 (414,880) (47,216)
Taxes Recoverable 100,778 411,844 146,578 724,671 768,972
Marketable Securities (254,553) (223,143) 525,510 (646,890) 84,945
Other Assets (126,584) 16,217 39,235 (79,538) 195,754
Suppliers 121,568 (413,982) 295,937 (281,689) 139,101
Taxes Obligations 133,364 26,815 106,143 136,808 77,594
Social Security and Labor Obligations 100,601 114,128 79,599 97,045 72,580
Other Liabilities 109,524 (40,174) 65,975 156,504 344,773
Income Tax and Social Contribution Paid (202,601) (69,638) (2,331) (313,827) (7,169)
Net Cash Used in Investing Activities (985,089) (895,714) (1,334,940) (2,540,496) (3,067,004)
Purchase of Property, Plant and Equipment (714,926) (612,645) (1,238,537) (1,934,078) (2,788,663)
Planting Cost of Biological Assets (284,826) (291,288) (109,314) (784,890) (376,843)
Proceeds from Disposal of Assets 10,837 5,101 12,911 168,133 95,121
Dividends Received from Subsidiaries 3,826 3,118 - 10,339 3,381
Net Cash Provided Used in Financing Activities (460,415) (542,515) (3,646,096) 813,905 (3,869,796)
New Borrowings 666 (739) (12,969) 2,697,975 3,729,477
Amortization of Loans and Debentures (92,232) (273,971) (2,677,983) (1,039,578) (6,195,753)
Payment of Interests on Loans (212,056) (423,940) (895,061) (840,035) (1,075,130)
Payment of Lease Liabilities (66,051) (63,365) (41,286) (177,081) (111,913)
Disposal of Treasury Shares - - - 18,946 13,588
Acquisition of Investments and Payment in Subsidiaries (Cash) - 219,500 - 287,000 50,000
Outflow of JV's Investors - - - - (2,000)
Dividends Paid/Received JVs and SPVs (90,742) - (18,797) (133,322) (55,065)
Dividends Paid & IOC Paid - - - - (223,000)
Increase (Decrease) in Cash and Cash Equivalents 448,331 (504,209) (1,502,400) 1,749,602 (1,805,502)
Cash and Cash Equivalents at Beginning of Period 6,510,101 7,014,310 8,037,284 5,208,830 8,340,386
Cash and Cash Equivalents at End of Period 6,958,432 6,510,101 6,534,884 6,958,432 6,534,884
R$ thousand 3Q21 3Q202Q21 9M21 9M20
3Q21 Earnings Release
32
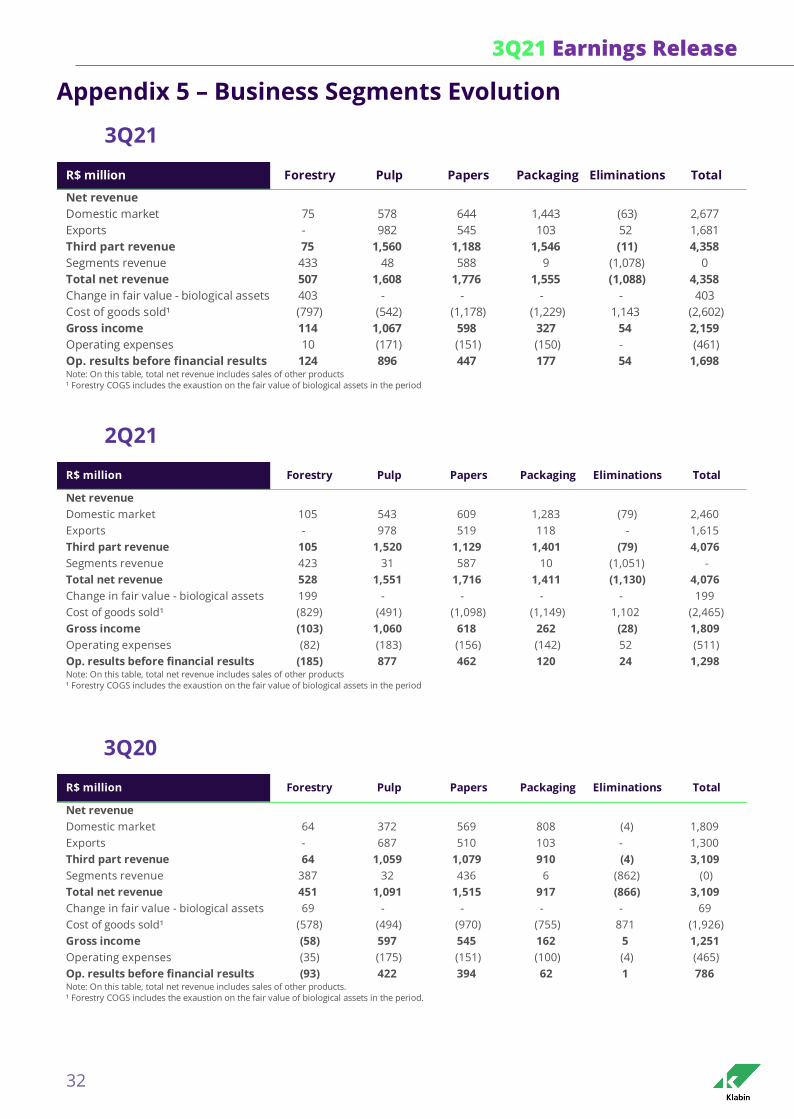
Appendix 5 – Business Segments Evolution
3Q21
2Q21
3Q20
Net revenue
Domestic market 75 578 644 1,443 (63) 2,677
Exports - 982 545 103 52 1,681
Third part revenue 75 1,560 1,188 1,546 (11) 4,358
Segments revenue 433 48 588 9 (1,078) 0
Total net revenue 507 1,608 1,776 1,555 (1,088) 4,358
Change in fair value - biological assets 403 - - - - 403
Cost of goods sold¹ (797) (542) (1,178) (1,229) 1,143 (2,602)
Gross income 114 1,067 598 327 54 2,159
Operating expenses 10 (171) (151) (150) - (461)
Op. results before financial results 124 896 447 177 54 1,698Note: On this table, total net revenue includes sales of other products
¹ Forestry COGS includes the exaustion on the fair value of biological assets in the period
R$ million Forestry Pulp Papers Packaging Eliminations Total
Net revenue
Domestic market 105 543 609 1,283 (79) 2,460
Exports - 978 519 118 - 1,615
Third part revenue 105 1,520 1,129 1,401 (79) 4,076
Segments revenue 423 31 587 10 (1,051) -
Total net revenue 528 1,551 1,716 1,411 (1,130) 4,076
Change in fair value - biological assets 199 - - - - 199
Cost of goods sold¹ (829) (491) (1,098) (1,149) 1,102 (2,465)
Gross income (103) 1,060 618 262 (28) 1,809
Operating expenses (82) (183) (156) (142) 52 (511)
Op. results before financial results (185) 877 462 120 24 1,298Note: On this table, total net revenue includes sales of other products
¹ Forestry COGS includes the exaustion on the fair value of biological assets in the period
R$ million Forestry Pulp Papers Packaging Eliminations Total
Net revenue
Domestic market 64 372 569 808 (4) 1,809
Exports - 687 510 103 - 1,300
Third part revenue 64 1,059 1,079 910 (4) 3,109
Segments revenue 387 32 436 6 (862) (0)
Total net revenue 451 1,091 1,515 917 (866) 3,109
Change in fair value - biological assets 69 - - - - 69
Cost of goods sold¹ (578) (494) (970) (755) 871 (1,926)
Gross income (58) 597 545 162 5 1,251
Operating expenses (35) (175) (151) (100) (4) (465)
Op. results before financial results (93) 422 394 62 1 786Note: On this table, total net revenue includes sales of other products.
¹ Forestry COGS includes the exaustion on the fair value of biological assets in the period.
R$ million Forestry Pulp Papers Packaging Eliminations Total