Embed Size (px)
Citation preview
1
NC06K-3SMART
Early Literacy Champions In North Carolina:
Accelerated Learning Documentation for K-3 SMART School Year 2005 - 2006
(Stimulating Maturity through Accelerated Readiness Training)
Lyelle L. Palmer, Ph.D.
Leslie Giese, B.S. Bob DeBoer, M.S.
Minnesota Learning Resource Center, Minneapolis
Abstract Early literacy Word Recognition and Auditory Discrimination summaries are reported for regular males (N=154) and females (N=133) in North Carolina K-3 classes integrating SMART brain stimulation activities into regular school curriculum. Dis-aggregation of distributions for Economic Disadvantage and Racial Minority categories show large proportions of male and female pupils scoring at or above normal levels on the Brigance K & 1 Screen 37 common words at the end of kindergarten, and the Slosson Oral Reading Test-R3 in grades 1-3 (90%-100% of students). Medians of quick word recognition were 30 words in kindergarten and percentile equivalents of 62nd to 81st percentiles in grades 1-3. Male minority students and kindergarten males with summer birthdays scored similar high levels and proportions with almost all students scoring at or above the normal range in May. Kindergarten curriculum-based measurement of printing quality indicated that 60%-73% of students scored at mid-grade 1 level. The Wepman Auditory Discrimination Test measured similar high levels of this foundational skill for phonemic awareness. Comparison of quick word recognition and auditory discrimination maturity in K-2 classes reveals 79%-92% of pupils mature in both abilities with only a pupil or two mature in only one skill but not in both at each grade level. Pre-post scores are shown for grades 1-3 and for WADT in kindergarten. These extremely high mastery levels of early literacy are consistent with previous SMART results with at-risk students.
Minnesota Learning Resource Center 1800 Second Street NE, Minneapolis, MN 55418 Phone: 612-706-5519

2
Early Literacy Champions In North Carolina:
Accelerated Learning Documentation for K-3 SMART Introduction This document reports kindergarten results of North Carolina SMART classes participating in systematic integration of neuro-stimulation with current early literacy curriculum for the 2005-2006 school year. SMART programming begins with a four-day in-service staff development program for training teams of teachers and other staff to systematically integrate daily physical and mental brain stimulation activities into existing curriculum in order to produce high levels and proportions of academic and agility performance in young children. SMART compensatory stimulation for students from economically-disadvantaged backgrounds and other “at-risk for school failure” categories boosts student academic achievement to normal levels or higher when applied over several years (and/or summers).
SMART (Stimulating Maturity through Accelerated Readiness Training) is a dramatic systematic accelerated learning advance in maturing the developmental and academic readiness abilities of young children to produce proficiency of K-3 basic skills at automatic brain levels. SMART is a human technology that applies accelerated learning and brain stimulation premises, including: Joy is the natural state of children and young children must move Neuro-developmental maturity is essential to school success Neuro-stimulation integrates well into regular curricula Mastery to automatic, quick and correct proficiency can be playful and fun Success in succeeding grades assumes K-3 maturity and mastery SMART results are observable, measurable, significant and remarkable Teachers can readily apply SMART adaptations using current curricula More than fifteen years of documentation of high performance by children in SMART classes has been funded by state, federal and foundational financial support at the non-profit Minnesota Learning Resource Center in Minneapolis. Hundreds of SMART classes are currently active, including those in Alaska, Delaware, Florida, Georgia, Iowa, Minnesota, South Dakota, Tennessee, Texas and Wisconsin and other locations. SMART training takes place at a variety of locations across the USA and can be arranged for on-site locations at schools.
3
Follow-up mentoring by staff from the MLRC assures fidelity and high probability of achieving the desired results. SMART is highly enjoyable for children since physical movement and mastery of the environment are natural desires at these ages. The consistent physiologic parasympathetic joyful accelerated learning state arises naturally from movement and exertion that pupils find exciting and satisfying. SMART stimulation takes place in three structured locations under supervision of SMART-trained staff: (1) Playgrounds and playground equipment, (2) Floor or Physical Education space, and (3) Classroom areas, including ceilings, walls, floors, hallways, desks and tables. Integrated neuro-stimulation activities repeatedly and regularly activate cellular components to produce mature and superior basic abilities in many areas of growth and development. Neuro-developmental sequences move pupils from early to advanced sequences of foundational abilities during the school year. Unusual advances of positive pupil characteristics in classrooms are often noticed by mid-year. Positive effects have been noted and/or documented for the school readiness areas of: Visual maturity: visual acuity, visual coordination, visual convergence and depth perception, visual recognition, eye-hand coordination, visualization Attention: sustained attention, reduced distractibility Relaxation, reduced stress, stillness Joyful Accelerated Learning state Facilitation Response (Thriving), metabolism (exertion), evacuation Physical Abilities: strength, coordination, balance, flexibility, agility, fire safety Listening Abilities: language, phonemic awareness, auditory, discrimination, auditory blending, auditory closure, rhythm, pitch Reflex inhibition of immature primitive and transitional reflexes (Moro Startle, Tonic Neck Reflexes, Landau and others) Tactile discrimination Kinesthetic spatial awareness, memory and discrimination. When this strong neuro-physiological readiness foundation is established, early academic skills progress at steady and high rates of accelerated acquisition,
4
retention and application. Mastery of curriculum content in literacy areas of early reading, math and printing accelerates from the laborious intentional/ deliberate conscious effort of cortical function to automatic effortless sub-cortical application with attention to content rather than process. Some observed benefits of SMART programming in physical education abilities include: Increased muscle strength, flexibility, endurance, and coordination readiness for swimming. Possible control of early weight gain Immature random reflex reduction Vestibular-cerebellar stimulation for sustained attention (vestibular-RAF-thalamus-cortex arousal and transfer to cerebellum for sub-cortical automaticity) The advanced growth and mastery levels in academic basic skills and readiness abilities are observable and elicit comment from adults and children. SMART is effective and encouraging to pupils, parents, teachers, administration and school boards. ------------------------------------------------------------------------------------------------------ “SMART is the foundation upon which all of the elementary programs and enhancements are mounted. Success begins with SMART fidelity.” (Minnesota principal of an elementary school with 100% Grade 3 reading proficiency for regular students on the stringent 2006 MCAII ) ------------------------------------------------------------------------------------------------------ Early Literacy Proficiency Reporting results of regular students using Standardized Measures The normal curve represented by scores on nationally-standardized tests represents the distribution that combines data from many different types of students. The distributions that emerge on such tests are composite distributions that provide no indication of how students within a particular subgroup scored compared to other students in that subgroup. Results of subgroups are therefore compared to other groups and the composite using the scale and distribution of the composite norm distribution. When results from a particular subgroup are reported, as in the current best practices set forth in the What Works Clearinghouse monograph “Reporting the Results of Your Study” (www.whatworkshelpdesk.ed.gov/) the resulting
5
distributions present a distorted view of comparisons to the normal curve. For example, if the results for all regular males are compared to the normal curve, the results will appear to be somewhat inflated because students with special needs (ELL, special education, etc) are by definition excluded from the “regular” category. That is, “regular males” are thus compared to a distribution containing students with special needs. When results from comparison/control groups in the same exclusive category are available, score distributions of the groups can be compared, but the norm distribution used will be slightly inflated in terms of quartile, quintile, stanine and percentile distributions. When an expected 12-15% of special needs students are excluded from the analysis, the norm curve is distorted and the expectation for regular students in the lowest quartile should be about 12% rather than 25% and 6% more students will be expected to score above the national composite norm mean. What is “normal” for the composite will change when analyzing the subgroup that excludes students with special needs at the bottom of the distribution. Reports of results almost never acknowledge this distortion of the normal curve distribution when analyzing results of subgroups. The purpose in mentioning this situation in this report is to give notice that the data summaries for SMART do not redistribute the normal curve in the comparisons to the normal curve for the various subgroups. All subgroups are compared to the composite norm metrics, including medians and proportions. SMART in North Carolina The second author conducted high fidelity SMART programming at the K-2 Drexel Primary School in Burke County during the years 1997-2002 with pupils who were tested in grade 3 at Hallyburton Elementary School. Prior to 1999, stimulation sessions were small pull-out groups in the 5 kindergarten, 6 first grade and 7 second-grade classes. Only 81% of all 84 fourth graders were proficient readers in the baseline year of 2000, but that proportion bumped up to 87% and 85% in the following two years following SMART programming. For the school years ending in 2001 and 2002, daily high-fidelity SMART sessions were conducted with all kindergarteners, producing reading proficiency proportions of 88% and 86%, respectively, for all third graders from Drexel Primary taking the statewide ABC tests at Halliburton in 2004 and 2005. Building on the high proficiency levels of students entering grade 3, proportions of proficient students by grade 5 at Halliburton Elementary increased to 91% and 92% in 2005 and 2006, respectively.
6
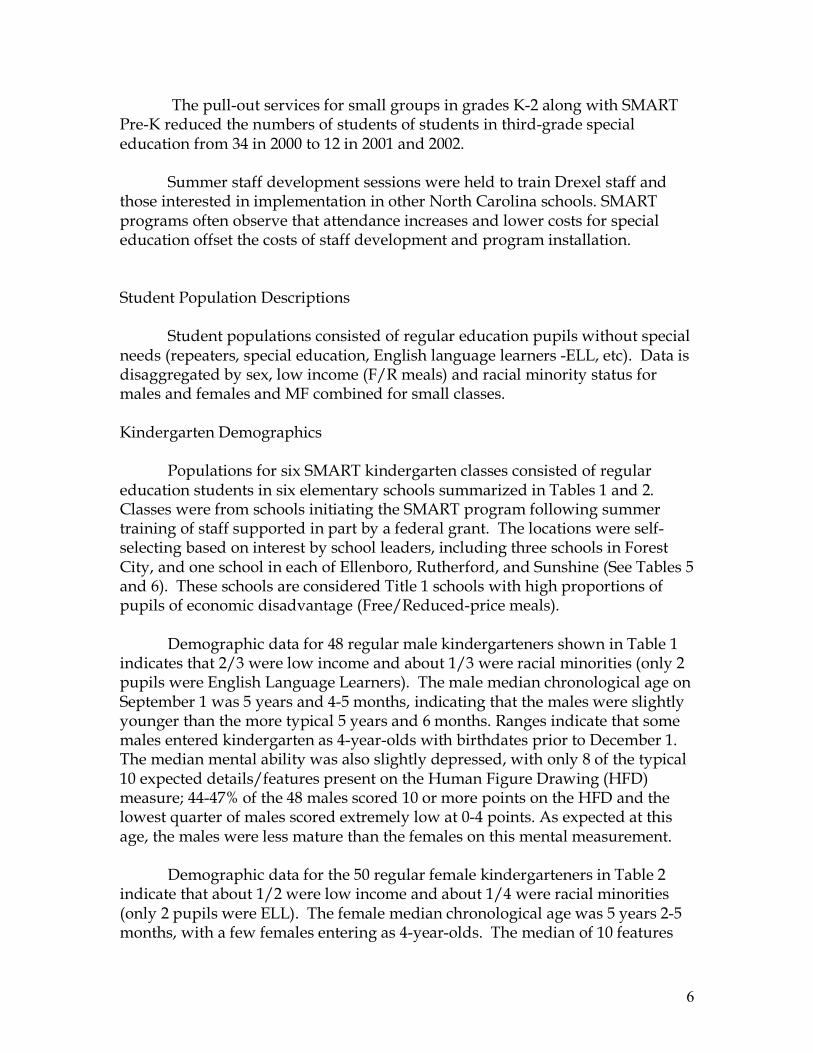
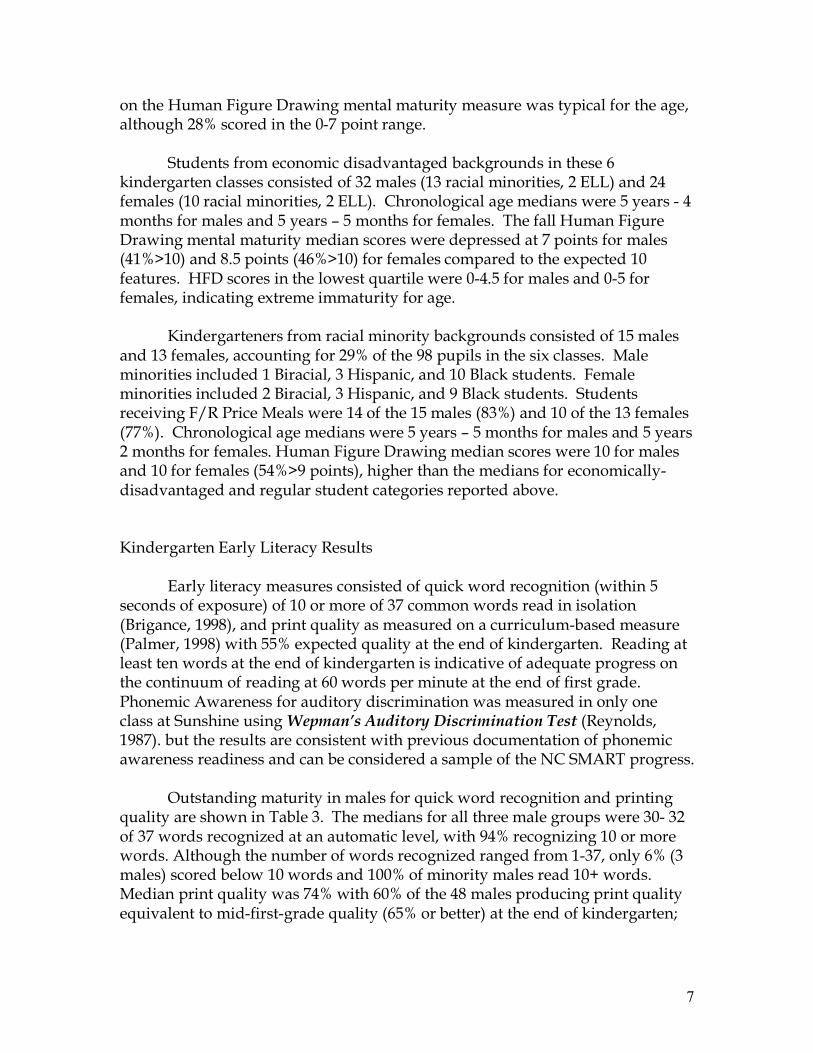
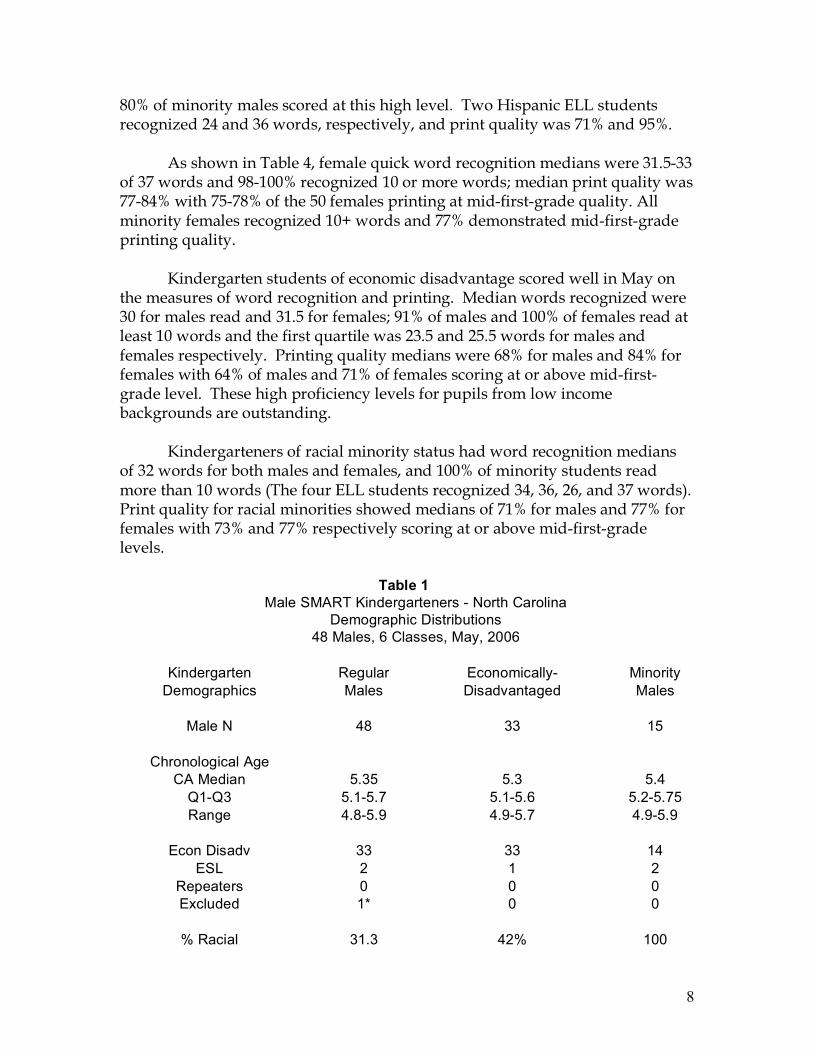
The pull-out services for small groups in grades K-2 along with SMART Pre-K reduced the numbers of students of students in third-grade special education from 34 in 2000 to 12 in 2001 and 2002. Summer staff development sessions were held to train Drexel staff and those interested in implementation in other North Carolina schools. SMART programs often observe that attendance increases and lower costs for special education offset the costs of staff development and program installation. Student Population Descriptions Student populations consisted of regular education pupils without special needs (repeaters, special education, English language learners -ELL, etc). Data is disaggregated by sex, low income (F/R meals) and racial minority status for males and females and MF combined for small classes. Kindergarten Demographics Populations for six SMART kindergarten classes consisted of regular education students in six elementary schools summarized in Tables 1 and 2. Classes were from schools initiating the SMART program following summer training of staff supported in part by a federal grant. The locations were self-selecting based on interest by school leaders, including three schools in Forest City, and one school in each of Ellenboro, Rutherford, and Sunshine (See Tables 5 and 6). These schools are considered Title 1 schools with high proportions of pupils of economic disadvantage (Free/Reduced-price meals). Demographic data for 48 regular male kindergarteners shown in Table 1 indicates that 2/3 were low income and about 1/3 were racial minorities (only 2 pupils were English Language Learners). The male median chronological age on September 1 was 5 years and 4-5 months, indicating that the males were slightly younger than the more typical 5 years and 6 months. Ranges indicate that some males entered kindergarten as 4-year-olds with birthdates prior to December 1. The median mental ability was also slightly depressed, with only 8 of the typical 10 expected details/features present on the Human Figure Drawing (HFD) measure; 44-47% of the 48 males scored 10 or more points on the HFD and the lowest quarter of males scored extremely low at 0-4 points. As expected at this age, the males were less mature than the females on this mental measurement. Demographic data for the 50 regular female kindergarteners in Table 2 indicate that about 1/2 were low income and about 1/4 were racial minorities (only 2 pupils were ELL). The female median chronological age was 5 years 2-5 months, with a few females entering as 4-year-olds. The median of 10 features
7
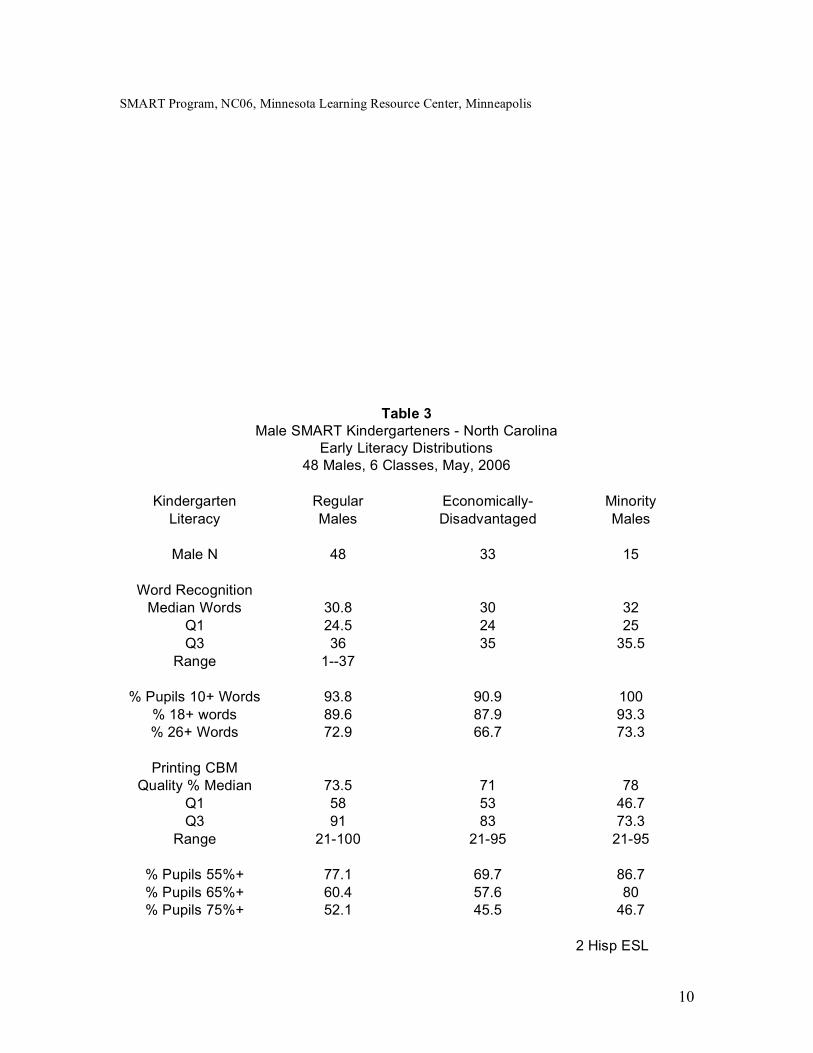
on the Human Figure Drawing mental maturity measure was typical for the age, although 28% scored in the 0-7 point range. Students from economic disadvantaged backgrounds in these 6 kindergarten classes consisted of 32 males (13 racial minorities, 2 ELL) and 24 females (10 racial minorities, 2 ELL). Chronological age medians were 5 years - 4 months for males and 5 years – 5 months for females. The fall Human Figure Drawing mental maturity median scores were depressed at 7 points for males (41%>10) and 8.5 points (46%>10) for females compared to the expected 10 features. HFD scores in the lowest quartile were 0-4.5 for males and 0-5 for females, indicating extreme immaturity for age. Kindergarteners from racial minority backgrounds consisted of 15 males and 13 females, accounting for 29% of the 98 pupils in the six classes. Male minorities included 1 Biracial, 3 Hispanic, and 10 Black students. Female minorities included 2 Biracial, 3 Hispanic, and 9 Black students. Students receiving F/R Price Meals were 14 of the 15 males (83%) and 10 of the 13 females (77%). Chronological age medians were 5 years – 5 months for males and 5 years 2 months for females. Human Figure Drawing median scores were 10 for males and 10 for females (54%>9 points), higher than the medians for economically-disadvantaged and regular student categories reported above. Kindergarten Early Literacy Results Early literacy measures consisted of quick word recognition (within 5 seconds of exposure) of 10 or more of 37 common words read in isolation (Brigance, 1998), and print quality as measured on a curriculum-based measure (Palmer, 1998) with 55% expected quality at the end of kindergarten. Reading at least ten words at the end of kindergarten is indicative of adequate progress on the continuum of reading at 60 words per minute at the end of first grade. Phonemic Awareness for auditory discrimination was measured in only one class at Sunshine using Wepman’s Auditory Discrimination Test (Reynolds, 1987). but the results are consistent with previous documentation of phonemic awareness readiness and can be considered a sample of the NC SMART progress. Outstanding maturity in males for quick word recognition and printing quality are shown in Table 3. The medians for all three male groups were 30- 32 of 37 words recognized at an automatic level, with 94% recognizing 10 or more words. Although the number of words recognized ranged from 1-37, only 6% (3 males) scored below 10 words and 100% of minority males read 10+ words. Median print quality was 74% with 60% of the 48 males producing print quality equivalent to mid-first-grade quality (65% or better) at the end of kindergarten;
8
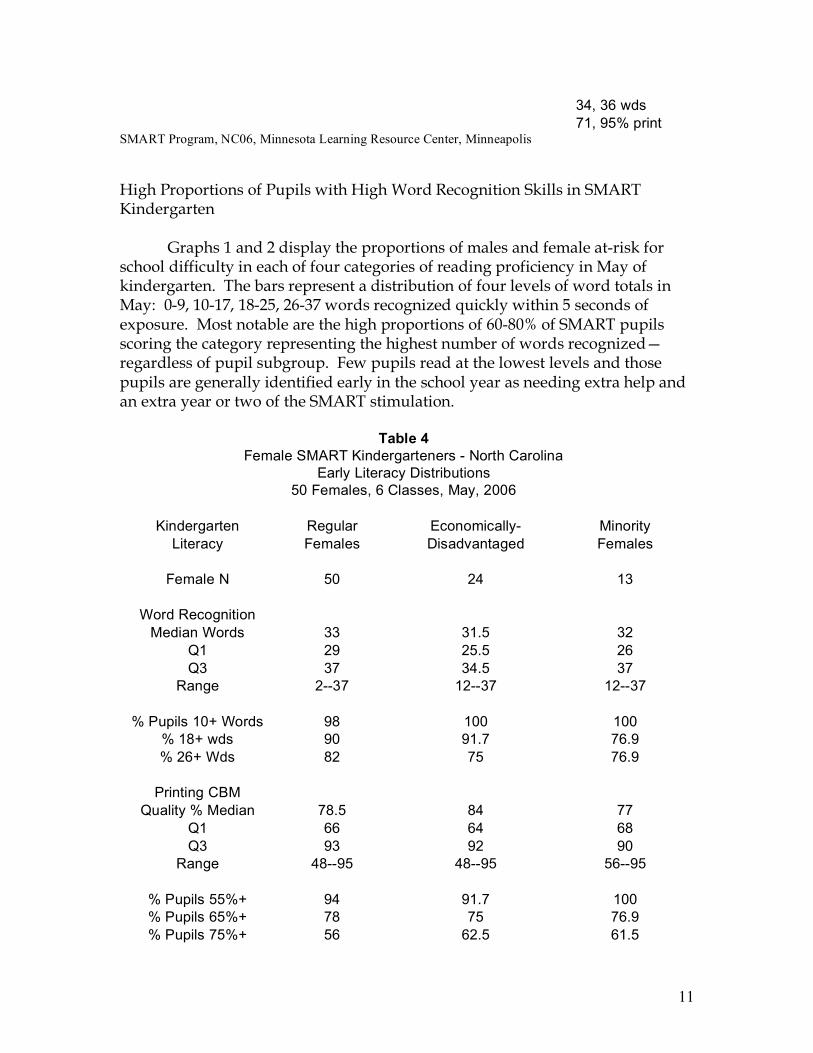
80% of minority males scored at this high level. Two Hispanic ELL students recognized 24 and 36 words, respectively, and print quality was 71% and 95%. As shown in Table 4, female quick word recognition medians were 31.5-33 of 37 words and 98-100% recognized 10 or more words; median print quality was 77-84% with 75-78% of the 50 females printing at mid-first-grade quality. All minority females recognized 10+ words and 77% demonstrated mid-first-grade printing quality. Kindergarten students of economic disadvantage scored well in May on the measures of word recognition and printing. Median words recognized were 30 for males read and 31.5 for females; 91% of males and 100% of females read at least 10 words and the first quartile was 23.5 and 25.5 words for males and females respectively. Printing quality medians were 68% for males and 84% for females with 64% of males and 71% of females scoring at or above mid-first-grade level. These high proficiency levels for pupils from low income backgrounds are outstanding. Kindergarteners of racial minority status had word recognition medians of 32 words for both males and females, and 100% of minority students read more than 10 words (The four ELL students recognized 34, 36, 26, and 37 words). Print quality for racial minorities showed medians of 71% for males and 77% for females with 73% and 77% respectively scoring at or above mid-first-grade levels. Table 1
Male SMART Kindergarteners - North Carolina Demographic Distributions
48 Males, 6 Classes, May, 2006
Kindergarten Regular Economically- Minority Demographics Males Disadvantaged Males
Male N 48 33 15
Chronological Age CA Median 5.35 5.3 5.4
Q1-Q3 5.1-5.7 5.1-5.6 5.2-5.75 Range 4.8-5.9 4.9-5.7 4.9-5.9
Econ Disadv 33 33 14
ESL 2 1 2 Repeaters 0 0 0 Excluded 1* 0 0
% Racial 31.3 42% 100
9
Minorities AfAm N 10 10 10
Hispanic N 4 3 4 Asian N 0 0 0 Mixed N 1 1 1
Human Figure Drawing Fall HFD Median Pts 8 7 9
% Pupils 10+ 44 44 46.7 Q1-Q3 4--13 5--13 5--13 Range 0-19 0-18 0-18
*1 low-functioning ADHD/ODD 2 Hisp ESL HFD 3, 11
SMART Program, NC06, Minnesota Learning Resource Center, Minneapolis
Table 2 Female SMART Kindergarteners - North Carolina
Demographic Distributions 50 Females, 6 Classes, May, 2006
Kindergarten Regular Economically- Minority
Demographics Females Disadvantaged Females
Females N 50 24 13
Chronological Age CA Median 5.35 5.45 5.2
Q1-Q3 5.2--5.7 5.3--5.8 5.1--5.4 Range 4.8--5.9 4.9--5.9 4.8--5.9
Econ Disadv 24 24 10
ESL 2 2 2 Repeaters 0 0 0 Excluded 0 0 0
% Racial Minorities 13 10 10 Black N 9 6 9
Hispanic N 2 2 2 Mixed 2 2 2
Human Figure Drawing Fall HFD Median Pts 10 8.5 10
% Pupils 10+ 54 45.8 53.8 Q1-Q3 7--12 7.5--12 7--13 Range 0--22 2--14 2--22
10
SMART Program, NC06, Minnesota Learning Resource Center, Minneapolis
Table 3 Male SMART Kindergarteners - North Carolina
Early Literacy Distributions 48 Males, 6 Classes, May, 2006
Kindergarten Regular Economically- Minority
Literacy Males Disadvantaged Males
Male N 48 33 15
Word Recognition Median Words 30.8 30 32
Q1 24.5 24 25 Q3 36 35 35.5
Range 1--37
% Pupils 10+ Words 93.8 90.9 100 % 18+ words 89.6 87.9 93.3 % 26+ Words 72.9 66.7 73.3
Printing CBM
Quality % Median 73.5 71 78 Q1 58 53 46.7 Q3 91 83 73.3
Range 21-100 21-95 21-95
% Pupils 55%+ 77.1 69.7 86.7 % Pupils 65%+ 60.4 57.6 80 % Pupils 75%+ 52.1 45.5 46.7
2 Hisp ESL
11
34, 36 wds 71, 95% print
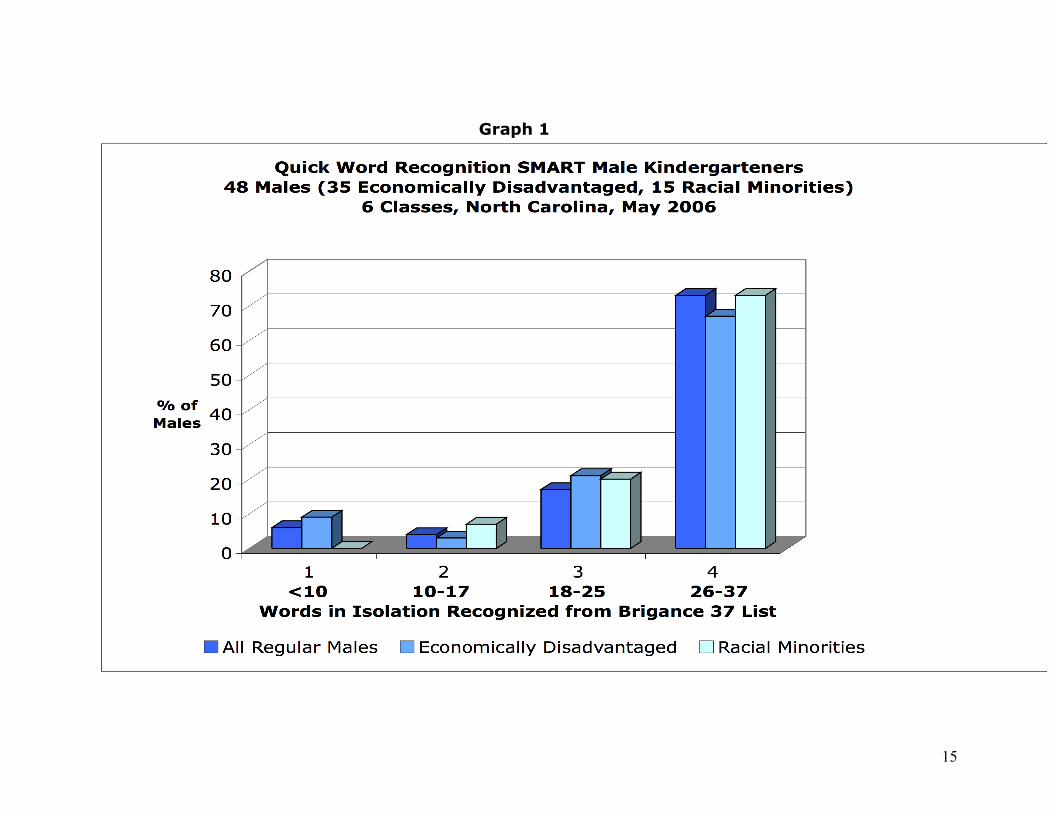
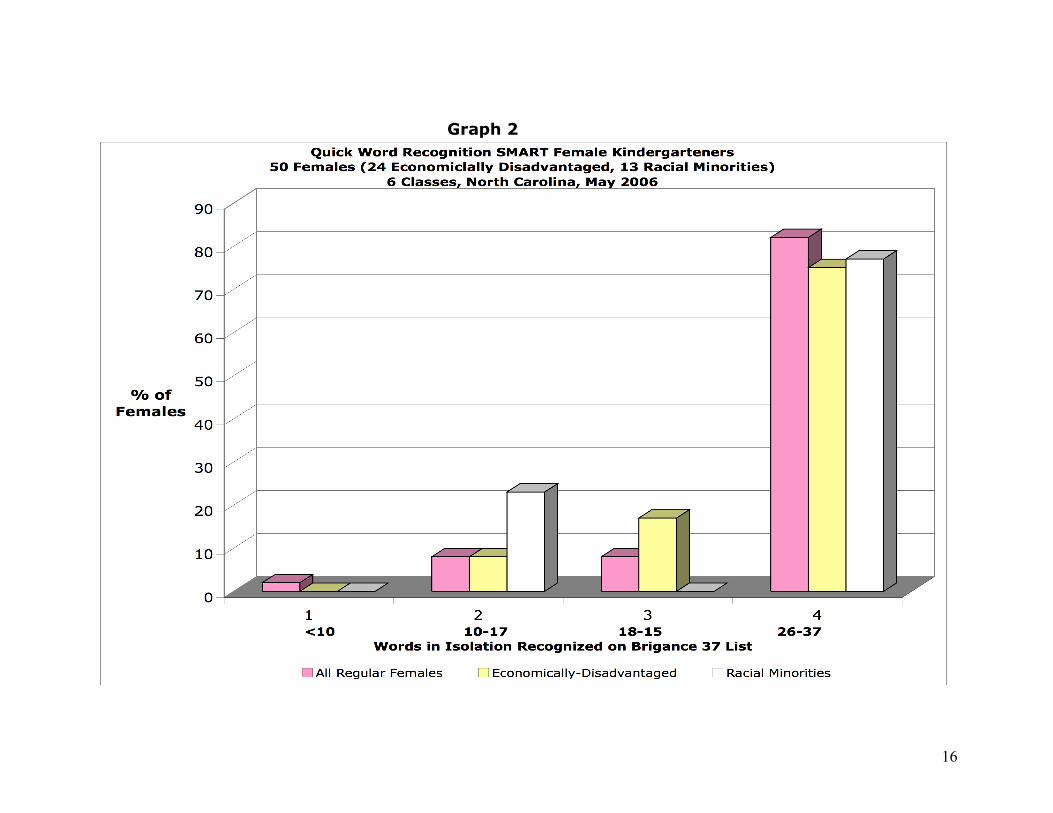
SMART Program, NC06, Minnesota Learning Resource Center, Minneapolis High Proportions of Pupils with High Word Recognition Skills in SMART Kindergarten Graphs 1 and 2 display the proportions of males and female at-risk for school difficulty in each of four categories of reading proficiency in May of kindergarten. The bars represent a distribution of four levels of word totals in May: 0-9, 10-17, 18-25, 26-37 words recognized quickly within 5 seconds of exposure. Most notable are the high proportions of 60-80% of SMART pupils scoring the category representing the highest number of words recognized—regardless of pupil subgroup. Few pupils read at the lowest levels and those pupils are generally identified early in the school year as needing extra help and an extra year or two of the SMART stimulation.
Table 4 Female SMART Kindergarteners - North Carolina
Early Literacy Distributions 50 Females, 6 Classes, May, 2006
Kindergarten Regular Economically- Minority
Literacy Females Disadvantaged Females
Female N 50 24 13
Word Recognition Median Words 33 31.5 32
Q1 29 25.5 26 Q3 37 34.5 37
Range 2--37 12--37 12--37
% Pupils 10+ Words 98 100 100 % 18+ wds 90 91.7 76.9 % 26+ Wds 82 75 76.9
Printing CBM
Quality % Median 78.5 84 77 Q1 66 64 68 Q3 93 92 90
Range 48--95 48--95 56--95
% Pupils 55%+ 94 91.7 100 % Pupils 65%+ 78 75 76.9 % Pupils 75%+ 56 62.5 61.5
12
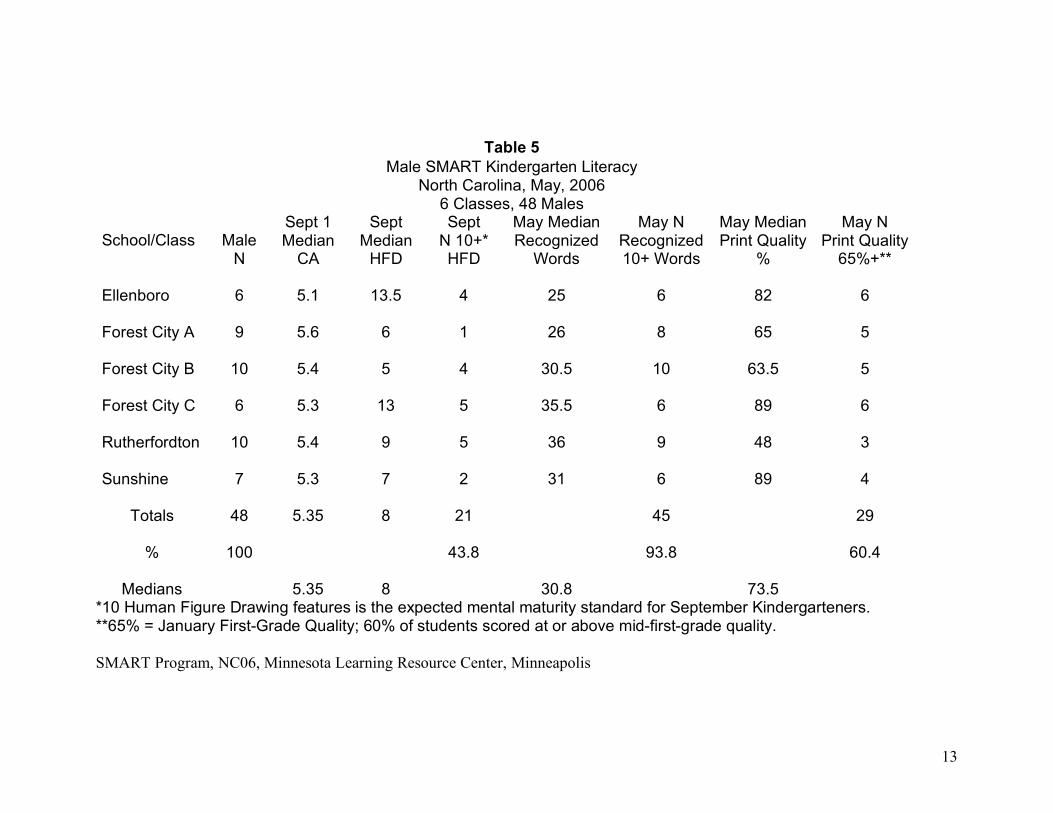
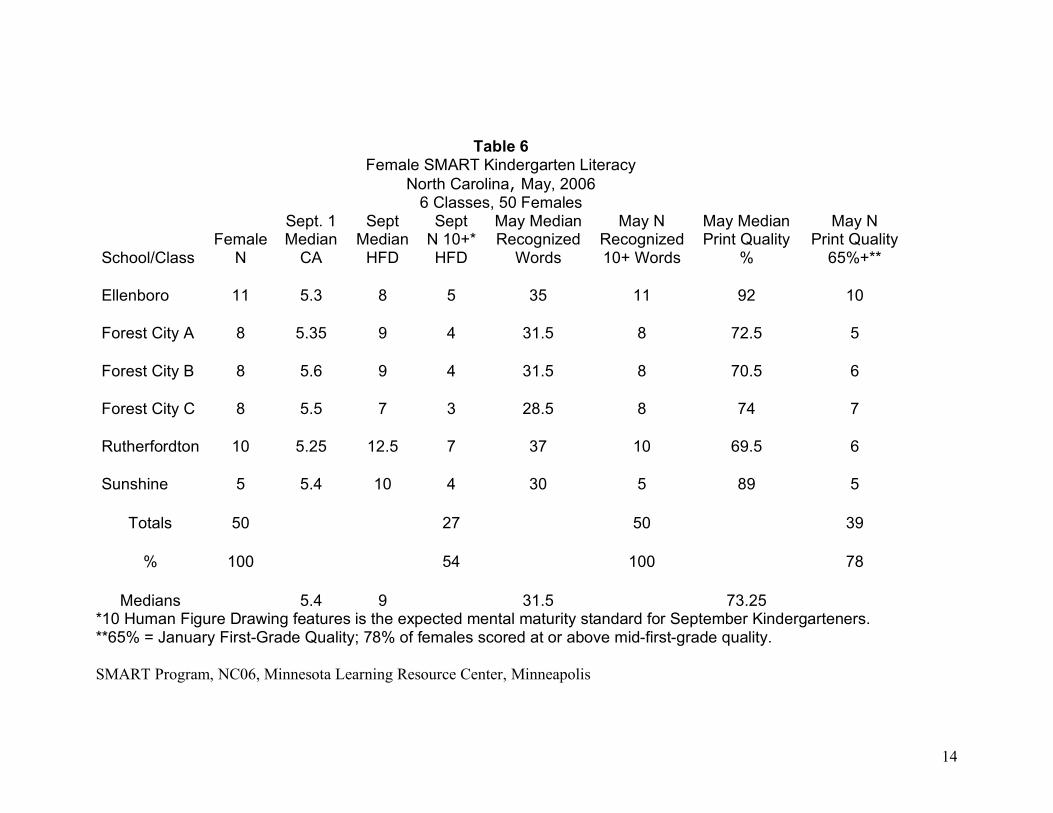
SMART Program, NC06, Minnesota Learning Resource Center, Minneapolis Kindergarten Class Variation in Results The medians and maturity proportions for demographics and early literacy for each of the six classes are shown for all regular 48 males and 50 females in Tables 5 and 6. As expected, some classes were more advanced than others in printing quality, but all classes were about equally effective in achieving high levels of word recognition. Forest City Class A contained 9 males with medians of 5 years 7 months CA and 6 HFD (only 1 scored 10+ points). Medians in word recognition (26) and print quality (63.5%) were high, however, with 89% of males reading 10+ words and 55% exhibiting mid-first-grade printing quality. All of the teachers produced results consistent with previous documentation of stimulation programming with at-risk populations in the grades K-2.
13
Table 5 Male SMART Kindergarten Literacy
North Carolina, May, 2006 6 Classes, 48 Males
School/Class Male Sept 1 Median
Sept Median
Sept N 10+*
May Median Recognized
May N Recognized
May Median Print Quality
May N Print Quality
N CA HFD HFD Words 10+ Words % 65%+** Ellenboro 6 5.1 13.5 4 25 6 82 6 Forest City A 9 5.6 6 1 26 8 65 5 Forest City B 10 5.4 5 4 30.5 10 63.5 5 Forest City C 6 5.3 13 5 35.5 6 89 6 Rutherfordton 10 5.4 9 5 36 9 48 3 Sunshine 7 5.3 7 2 31 6 89 4
Totals 48 5.35 8 21 45 29
% 100 43.8 93.8 60.4
Medians 5.35 8 30.8 73.5 *10 Human Figure Drawing features is the expected mental maturity standard for September Kindergarteners. **65% = January First-Grade Quality; 60% of students scored at or above mid-first-grade quality. SMART Program, NC06, Minnesota Learning Resource Center, Minneapolis
14
Table 6
Female SMART Kindergarten Literacy North Carolina, May, 2006
6 Classes, 50 Females
Female Sept. 1 Median
Sept Median
Sept N 10+*
May Median Recognized
May N Recognized
May Median Print Quality
May N Print Quality
School/Class N CA HFD HFD Words 10+ Words % 65%+** Ellenboro 11 5.3 8 5 35 11 92 10 Forest City A 8 5.35 9 4 31.5 8 72.5 5 Forest City B 8 5.6 9 4 31.5 8 70.5 6 Forest City C 8 5.5 7 3 28.5 8 74 7 Rutherfordton 10 5.25 12.5 7 37 10 69.5 6 Sunshine 5 5.4 10 4 30 5 89 5
Totals 50 27 50 39
% 100 54 100 78
Medians 5.4 9 31.5 73.25 *10 Human Figure Drawing features is the expected mental maturity standard for September Kindergarteners. **65% = January First-Grade Quality; 78% of females scored at or above mid-first-grade quality. SMART Program, NC06, Minnesota Learning Resource Center, Minneapolis
15
Graph 1
16
Graph 2
17
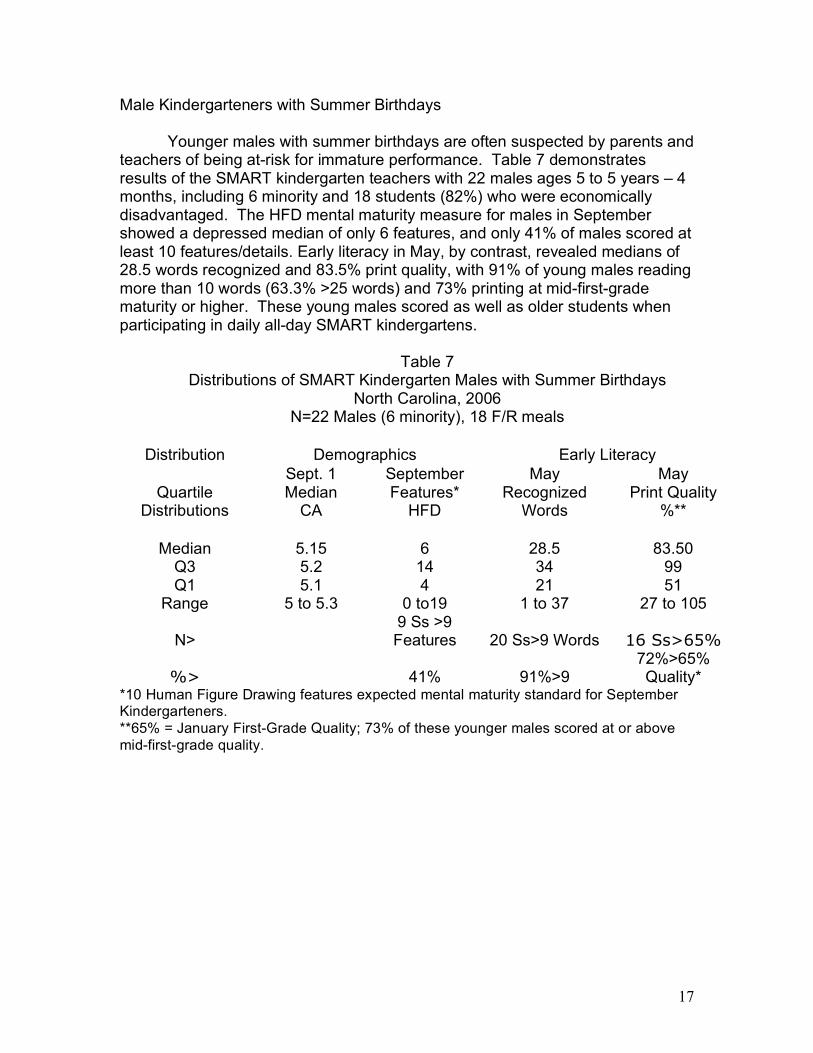
Male Kindergarteners with Summer Birthdays Younger males with summer birthdays are often suspected by parents and teachers of being at-risk for immature performance. Table 7 demonstrates results of the SMART kindergarten teachers with 22 males ages 5 to 5 years – 4 months, including 6 minority and 18 students (82%) who were economically disadvantaged. The HFD mental maturity measure for males in September showed a depressed median of only 6 features, and only 41% of males scored at least 10 features/details. Early literacy in May, by contrast, revealed medians of 28.5 words recognized and 83.5% print quality, with 91% of young males reading more than 10 words (63.3% >25 words) and 73% printing at mid-first-grade maturity or higher. These young males scored as well as older students when participating in daily all-day SMART kindergartens.
Table 7 Distributions of SMART Kindergarten Males with Summer Birthdays
North Carolina, 2006 N=22 Males (6 minority), 18 F/R meals
Distribution Demographics Early Literacy
Sept. 1 September May May Quartile Median Features* Recognized Print Quality
Distributions CA HFD Words %**
Median 5.15 6 28.5 83.50 Q3 5.2 14 34 99 Q1 5.1 4 21 51
Range 5 to 5.3 0 to19 1 to 37 27 to 105
N> 9 Ss >9 Features 20 Ss>9 Words 16 Ss>65%
%> 41% 91%>9 72%>65% Quality*
*10 Human Figure Drawing features expected mental maturity standard for September Kindergarteners. **65% = January First-Grade Quality; 73% of these younger males scored at or above mid-first-grade quality.
18
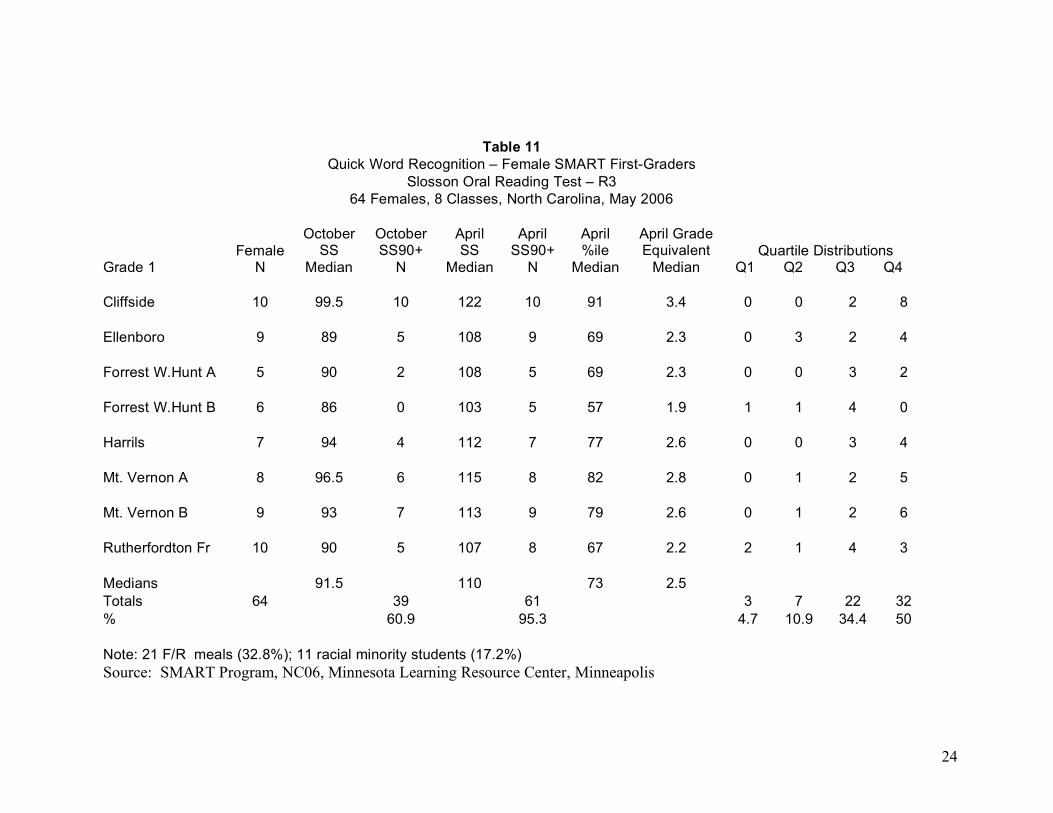
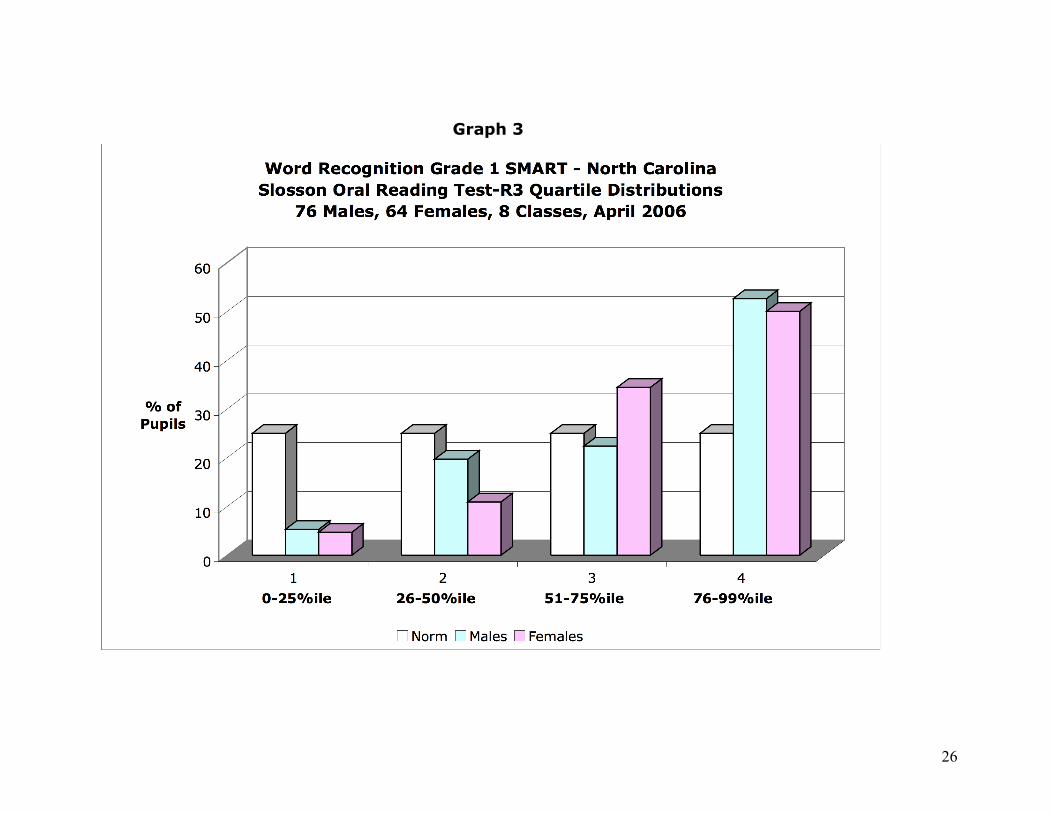
Grade 1 SMART Eight classes are summarized in this report from Cliffside, Ellenboro, Forest City (2), Harris, Mt. Vernon, Rutherford Elementary Schools reported in Tables 8-11. Demographic summaries in Tables 8-9 summarize data for 76 males (31 F/R meals, 11 minorities including 2 ELL) and 64 females (21 F/R meals, 11 minorities including 3 ELL). Median chronological ages for the 76 males ranged from 6 years 6 months to 6 years 10 months, indicating that some of these boys with summer birthdays probably entered kindergarten at age 6 rather than age 5. Excluded males included one repeater and one student with special education needs. Minorities constituted 1/6 of all males, and ¼ or economically- disadvantaged students. Median chronological ages for the 64 females ranged more typically from 6 years 4 months to 6 years 7 months. Females excluded were 1 kindergarten repeater (overage), 1 ELL and 1 student with special needs, including one African American. Minorities constituted 1/5 of all females and half of those receiving F/R meals. Quick Word Recognition in First Grade Tables 10-11 display the reading results for the disaggregated groups of males and females. The Slosson Oral Reading Test-Revision 3 (Nicholson, 1990) consists of grade-level wordlists containing 20 words for each elementary grade level. Students must orally state each word within 5 seconds of exposure in order to avoid using slow letter-by-letter decoding as the reading strategy. The October median of class medians was at the 46th percentile (SS 95.5) for males and the 27th percentile (SS 91.5) for females, equivalent to K.7 and K.4 grade levels. These scores are typical of first-grade reading following summer reading inactivity following kindergarten. A dramatic increase in May medians of class medians shows student word recognition at the 79th percentile (SS 113) for males, and the 73rd percentile (SS 110) for females. These standard scores are equivalent to grade levels of 2.6 and 2.5 for males and females respectively. The median scores are about one-half year ahead of the norm average. In looking at the proportions of students in the SMART distribution, only 5% of the students scored in the lowest quartile, while half of the students scored in the top quartile. The median standard scores and percentiles reveal that the achievement in the various classes is consistently high for all teachers. Graph 3 displays bar graphs for normal/expected proportions of 25% of pupils in each of the four quartiles compared to about half of SMART students in the highest quartile and a low percentage in the lowest quartile. Word recognition medians for 31 economically disadvantaged males (8 minority) and 21 females (7 minorities moved from the 31st (SS 92) and 29th
19
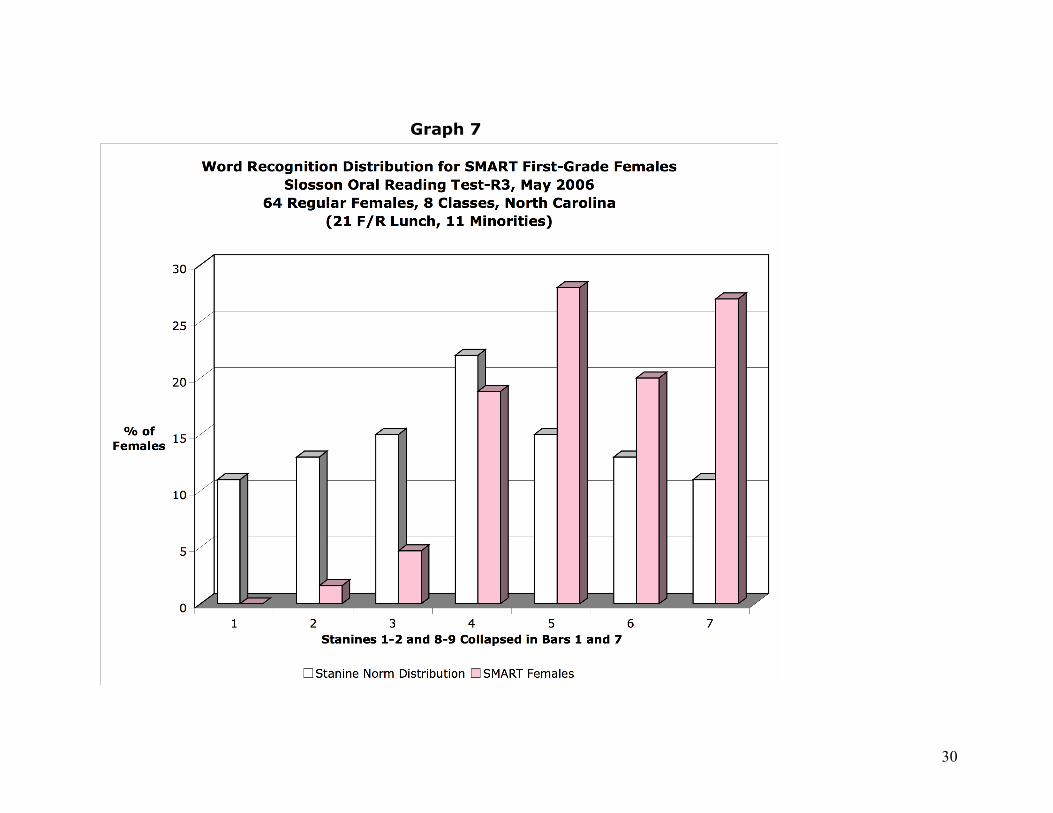
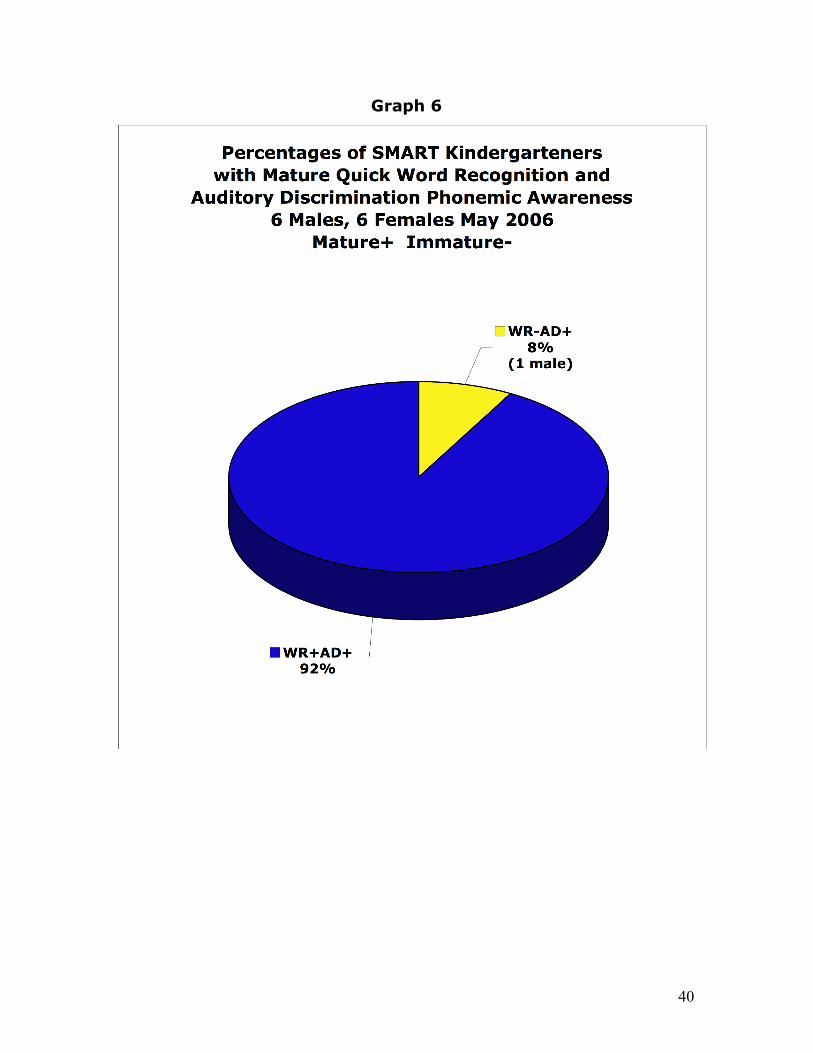
percentiles (SS 91) for males and females in October to the 72nd (SS 113) and 69th (SS 108) percentiles in May for grade equivalents of 2.6 and 2.3, respectively. Proportions of students above the lowest quartile increased from 64.5% of males and 52.4% of females in October to 97% and 95% in May. About half of these students of economic disadvantage scored in the top quartile. These results indicate consistently high word recognition levels for all but one male and one female who require more than one year of SMART stimulation. Quick word recognition for 11 minority males (7 African American, 4 Hispanic, 3 ELL) and 11 minority females (7 African American, 4 Hispanic, 2 ELL) moved from the 31st (SS 92) percentile and 33rd (SS 93) percentiles for males and females in October to the 86th (SS 117) and 67th (SS107) percentiles in May for grade equivalents of 2.9 and 2.2, respectively. May proportions of pupils above the lowest quartile were 100% for males and 91% for females, up from 82% and 55% in October. Of the 24 minority students, all but one female scored above the lowest quartile. These results reveal that minority students can consistently achieve at high levels when reading instruction is integrated with the SMART program. Minority males are most at-risk, but these students excelled. Auditory Discrimination Results for Phonemic Awareness Foundation The foundational auditory discrimination phonemic awareness abilities for students in two Mount Vernon classes tested with Wepman’s Auditory Discrimination Test increased from medians at the 43rd percentile (SS 97) for 21 males and 59th percentile (SS 104) for 17 females to the 96th percentile (SS 126) for both genders. Proportions of males scoring above the first quartile were 62% in October and 95% in May; 76.5% of females scored above Q1 in October and increased to 82.4% in May. Proportions in the top quartile in May were 67% for males and 65% for females. These medians and proportions indicate that these pupils increased their basic abilities in phonemic awareness substantially, assuring abilities for use in phonetic analysis of unfamiliar but phonetically regular words during reading. Graph 7 depicts 18% of pupils with good word recognition but low auditory discrimination ability and a need for a second years of SMART auditory/listening stimulation. Only one regular student was low in reading and high in auditory discrimination; all others (79%) were high in both word recognition and auditory discrimination. These proportions indicate that the SMART program supplies consistent instruction and progress in both phonemic awareness and sight word recognition for all but a few pupils who require special programming or a second year of SMART.
20
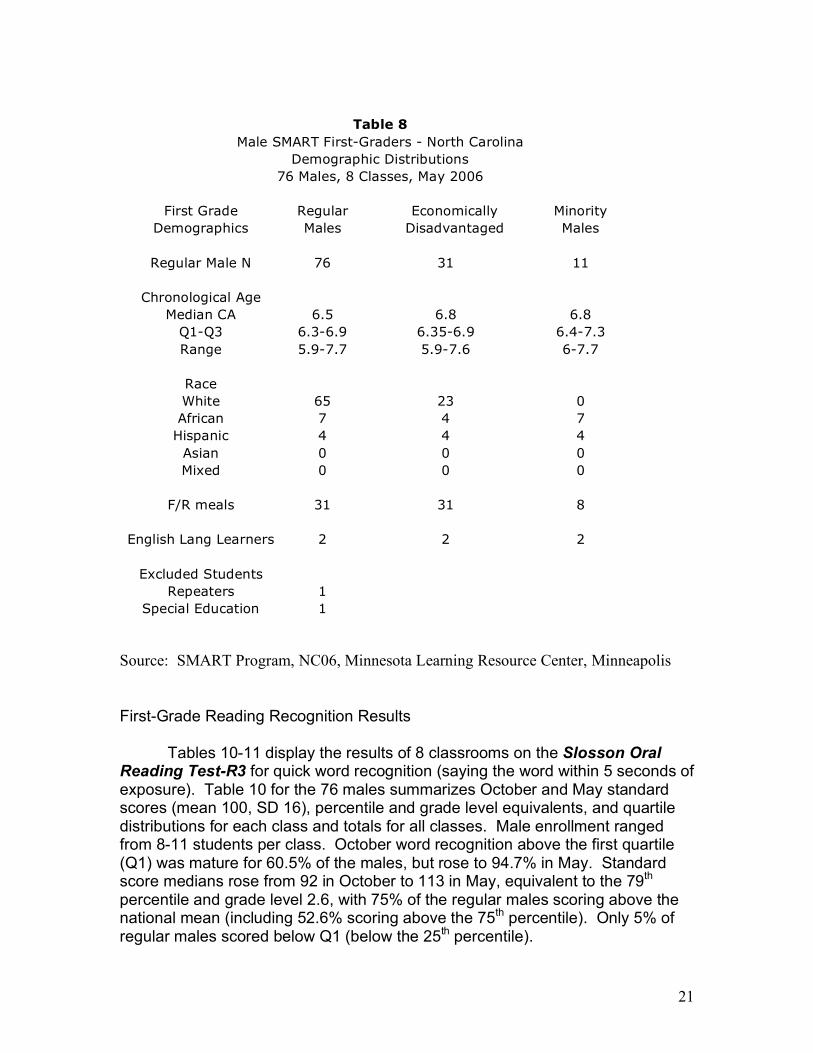
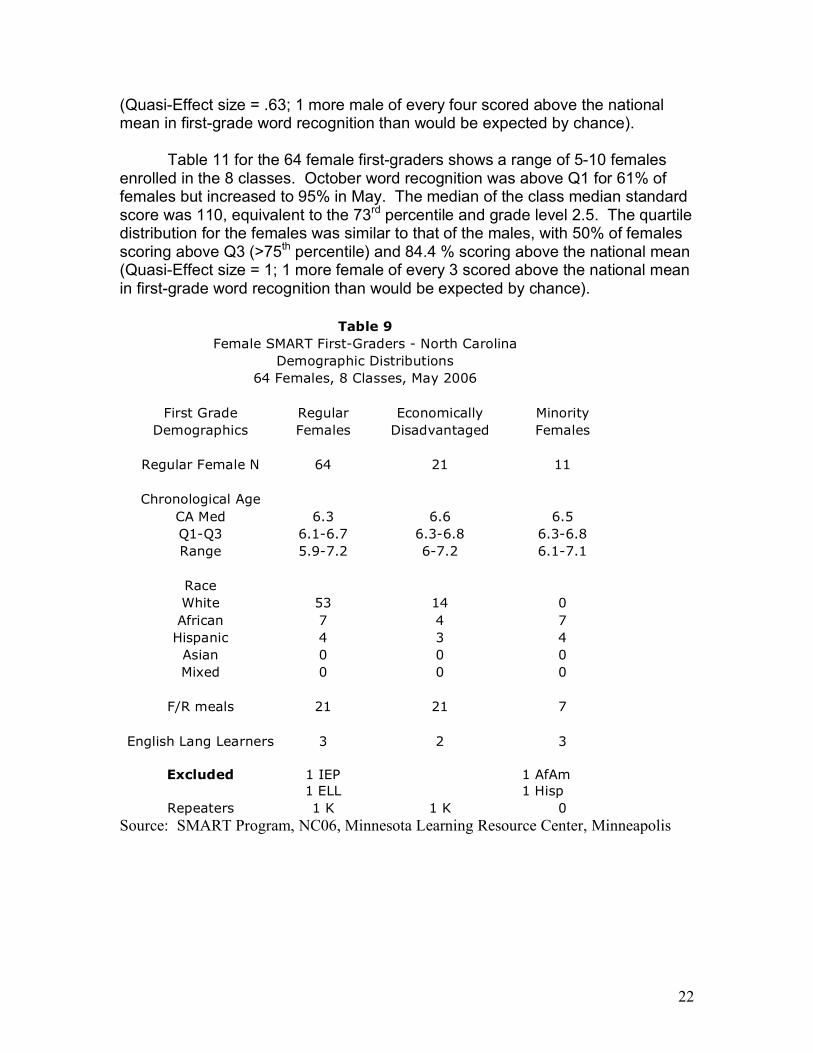
First Grade SMART First-Grade Demographic Descriptions Tables 8 and 9 display the demographic characteristics of first-grade males and females. Chronological ages for the 76 regular males were typical for first grade with a median of 6.5 years in September. Economically–disadvantaged and minority males were three months older with medians of 6.8 CA (6 years-9 months). Racially, 85.5% of the 76 males were Caucasian, 9% were African American and 5.3% were Hispanic, with 40.8% receiving subsidized meals. Of this economically-disadvantaged subgroup of 31 males, 74% were Caucasian, 13% were African American and 13% were Hispanic. Racial minority males consisted of 7 African Americans (63%) and 4 Hispanics (36%), 8 of whom (72%) received subsidized meals. Two of the four Hispanics were English-Language Learners. Excluded from the regular male analysis were one repeater and one pupil receiving special education services. The CA for all 64 regular females was several months younger than males at CA 6.3 (6 years-3-months) and median CA for the female subgroups were older by 2-3 months. Female racial proportions were 82.8% Caucasian, 10.9% AfAm and 6% Hispanic, with 32.8% receiving F/R meal subsidies. Of the 21 economically-disadvantaged females, 2/3 were Caucasian and 1/3 were racial minorities. African Americans comprised 63% of the 11 racial minority females; 3 of the 4 Hispanic females were English Language Learners whose academic skills allowed for analysis as regular students. Three females (4.5% of 67 students) were excluded from this analysis of regular students, including 1 Hispanic ELL, 1 African American special education and 1 kindergarten repeater, amounting to 15.4% of 13 female racial minority students.
21
English Lang Learners 2 2 2
Excluded Students Repeaters 1
Special Education 1
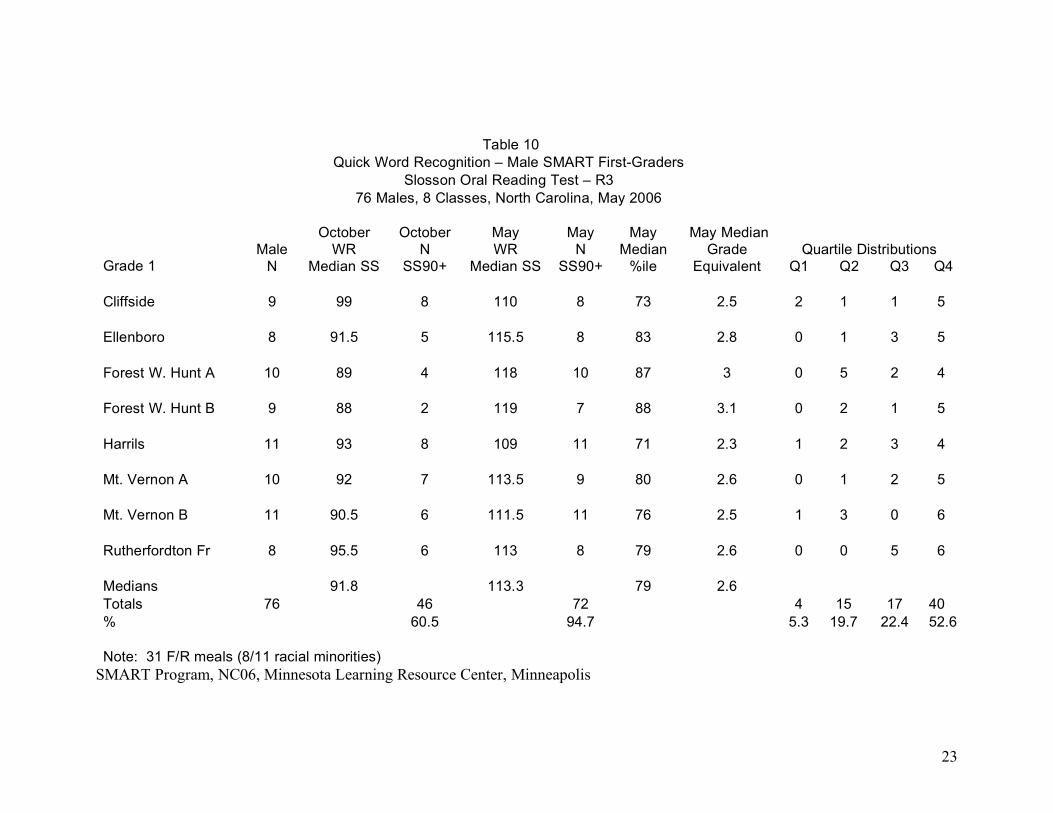
Source: SMART Program, NC06, Minnesota Learning Resource Center, Minneapolis First-Grade Reading Recognition Results Tables 10-11 display the results of 8 classrooms on the Slosson Oral Reading Test-R3 for quick word recognition (saying the word within 5 seconds of exposure). Table 10 for the 76 males summarizes October and May standard scores (mean 100, SD 16), percentile and grade level equivalents, and quartile distributions for each class and totals for all classes. Male enrollment ranged from 8-11 students per class. October word recognition above the first quartile (Q1) was mature for 60.5% of the males, but rose to 94.7% in May. Standard score medians rose from 92 in October to 113 in May, equivalent to the 79th percentile and grade level 2.6, with 75% of the regular males scoring above the national mean (including 52.6% scoring above the 75th percentile). Only 5% of regular males scored below Q1 (below the 25th percentile).
Table 8 Male SMART First-Graders - North Carolina
Demographic Distributions 76 Males, 8 Classes, May 2006
First Grade Regular Economically Minority
Demographics Males Disadvantaged Males
Regular Male N 76 31 11
Chronological Age Median CA 6.5 6.8 6.8
Q1-Q3 6.3-6.9 6.35-6.9 6.4-7.3 Range 5.9-7.7 5.9-7.6 6-7.7
Race White 65 23 0 African 7 4 7
Hispanic 4 4 4 Asian 0 0 0 Mixed 0 0 0
F/R meals 31 31 8
22
(Quasi-Effect size = .63; 1 more male of every four scored above the national mean in first-grade word recognition than would be expected by chance). Table 11 for the 64 female first-graders shows a range of 5-10 females enrolled in the 8 classes. October word recognition was above Q1 for 61% of females but increased to 95% in May. The median of the class median standard score was 110, equivalent to the 73rd percentile and grade level 2.5. The quartile distribution for the females was similar to that of the males, with 50% of females scoring above Q3 (>75th percentile) and 84.4 % scoring above the national mean (Quasi-Effect size = 1; 1 more female of every 3 scored above the national mean in first-grade word recognition than would be expected by chance).
Table 9 Female SMART First-Graders - North Carolina
Demographic Distributions 64 Females, 8 Classes, May 2006
First Grade Regular Economically Minority
Demographics Females Disadvantaged Females
Regular Female N 64 21 11
Chronological Age CA Med 6.3 6.6 6.5 Q1-Q3 6.1-6.7 6.3-6.8 6.3-6.8 Range 5.9-7.2 6-7.2 6.1-7.1
Race White 53 14 0 African 7 4 7
Hispanic 4 3 4 Asian 0 0 0 Mixed 0 0 0
F/R meals 21 21 7
English Lang Learners 3 2 3
Excluded
1 IEP 1 ELL
1 AfAm 1 Hisp
Repeaters 1 K 1 K 0 Source: SMART Program, NC06, Minnesota Learning Resource Center, Minneapolis
23
Table 10
Quick Word Recognition – Male SMART First-Graders Slosson Oral Reading Test – R3
76 Males, 8 Classes, North Carolina, May 2006
Grade 1 Male
N
October WR
Median SS
October N
SS90+
May WR
Median SS
May N
SS90+
May Median
%ile
May Median Grade
Equivalent Quartile Distributions Q1 Q2 Q3 Q4
Cliffside 9 99 8 110 8 73 2.5 2 1 1 5 Ellenboro 8 91.5 5 115.5 8 83 2.8 0 1 3 5 Forest W. Hunt A 10 89 4 118 10 87 3 0 5 2 4 Forest W. Hunt B 9 88 2 119 7 88 3.1 0 2 1 5 Harrils 11 93 8 109 11 71 2.3 1 2 3 4 Mt. Vernon A 10 92 7 113.5 9 80 2.6 0 1 2 5 Mt. Vernon B 11 90.5 6 111.5 11 76 2.5 1 3 0 6 Rutherfordton Fr 8 95.5 6 113 8 79 2.6 0 0 5 6 Medians 91.8 113.3 79 2.6 Totals 76 46 72 4 15 17 40 % 60.5 94.7 5.3 19.7 22.4 52.6 Note: 31 F/R meals (8/11 racial minorities)
SMART Program, NC06, Minnesota Learning Resource Center, Minneapolis
24
Table 11
Quick Word Recognition – Female SMART First-Graders Slosson Oral Reading Test – R3
64 Females, 8 Classes, North Carolina, May 2006
Grade 1 Female
N
October SS
Median
October SS90+
N
April SS
Median
April SS90+
N
April %ile
Median
April Grade Equivalent
Median Quartile Distributions
Q1 Q2 Q3 Q4 Cliffside 10 99.5 10 122 10 91 3.4 0 0 2 8 Ellenboro 9 89 5 108 9 69 2.3 0 3 2 4 Forrest W.Hunt A 5 90 2 108 5 69 2.3 0 0 3 2 Forrest W.Hunt B 6 86 0 103 5 57 1.9 1 1 4 0 Harrils 7 94 4 112 7 77 2.6 0 0 3 4 Mt. Vernon A 8 96.5 6 115 8 82 2.8 0 1 2 5 Mt. Vernon B 9 93 7 113 9 79 2.6 0 1 2 6 Rutherfordton Fr 10 90 5 107 8 67 2.2 2 1 4 3 Medians 91.5 110 73 2.5 Totals 64 39 61 3 7 22 32 % 60.9 95.3 4.7 10.9 34.4 50 Note: 21 F/R meals (32.8%); 11 racial minority students (17.2%) Source: SMART Program, NC06, Minnesota Learning Resource Center, Minneapolis
25
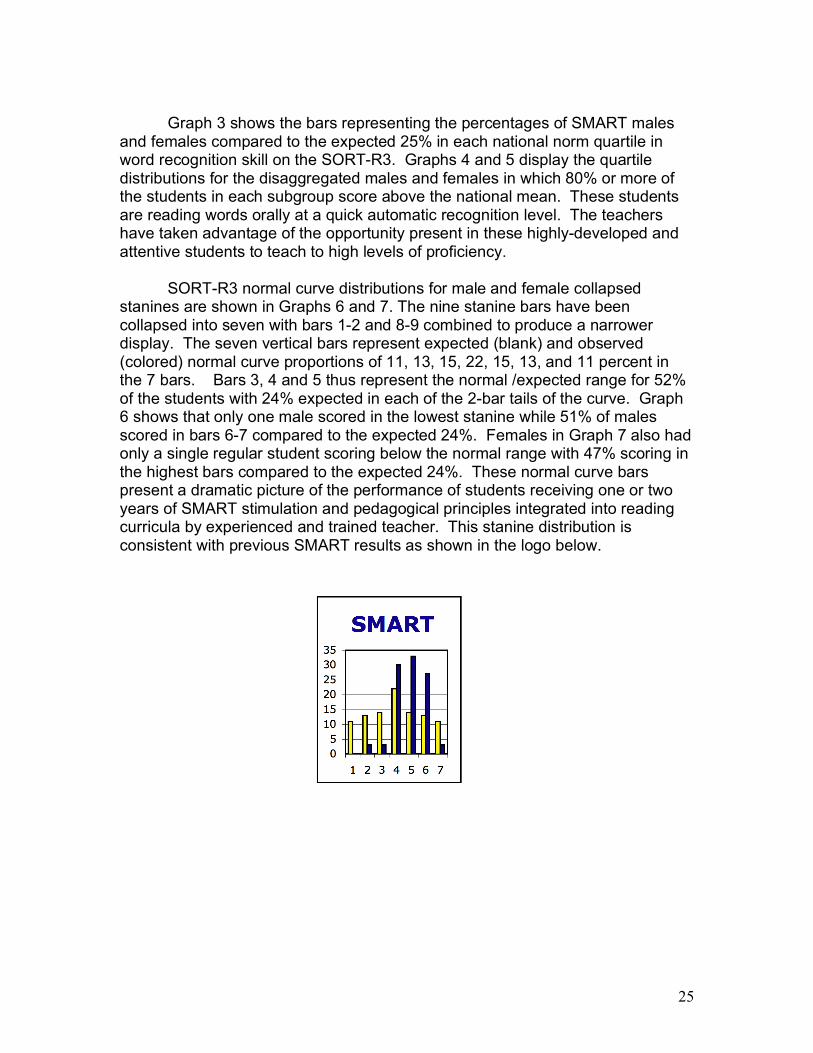
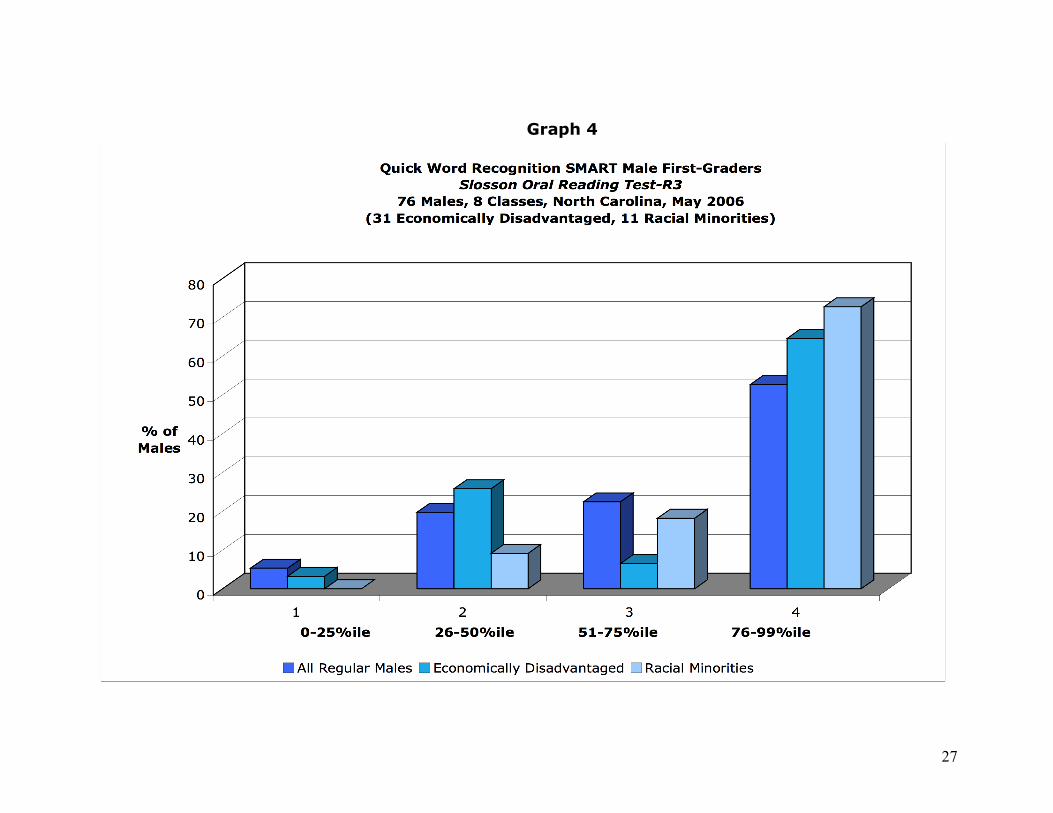
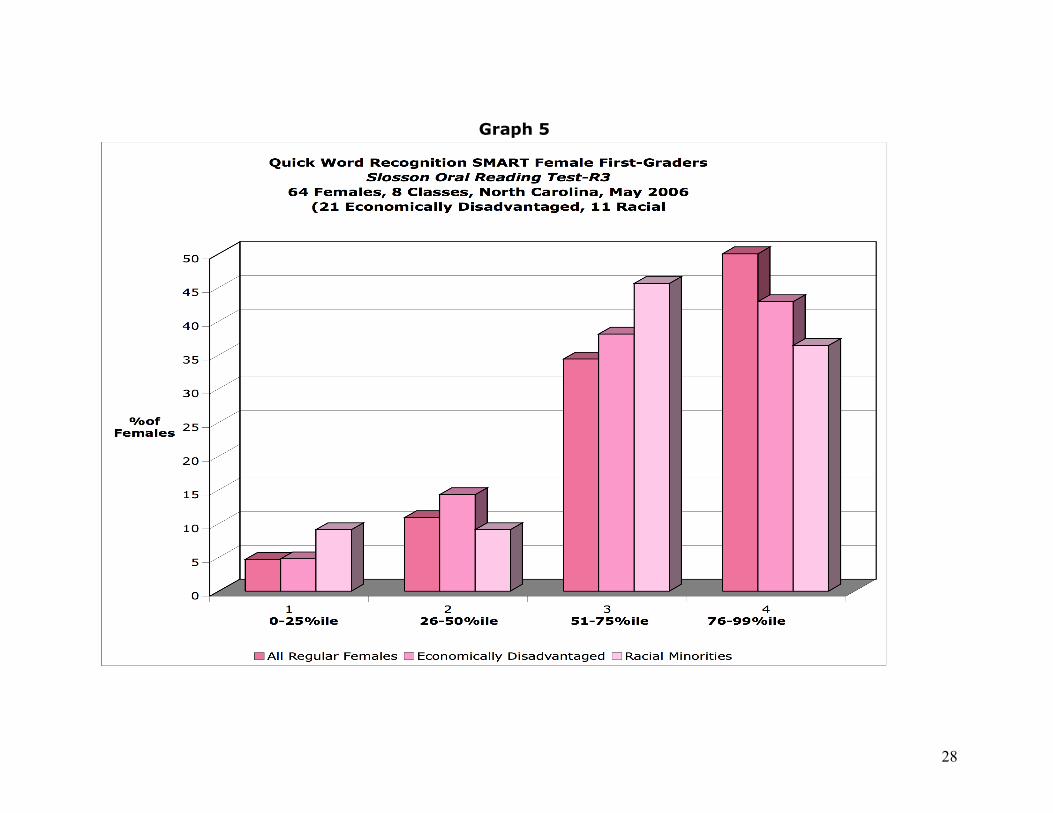
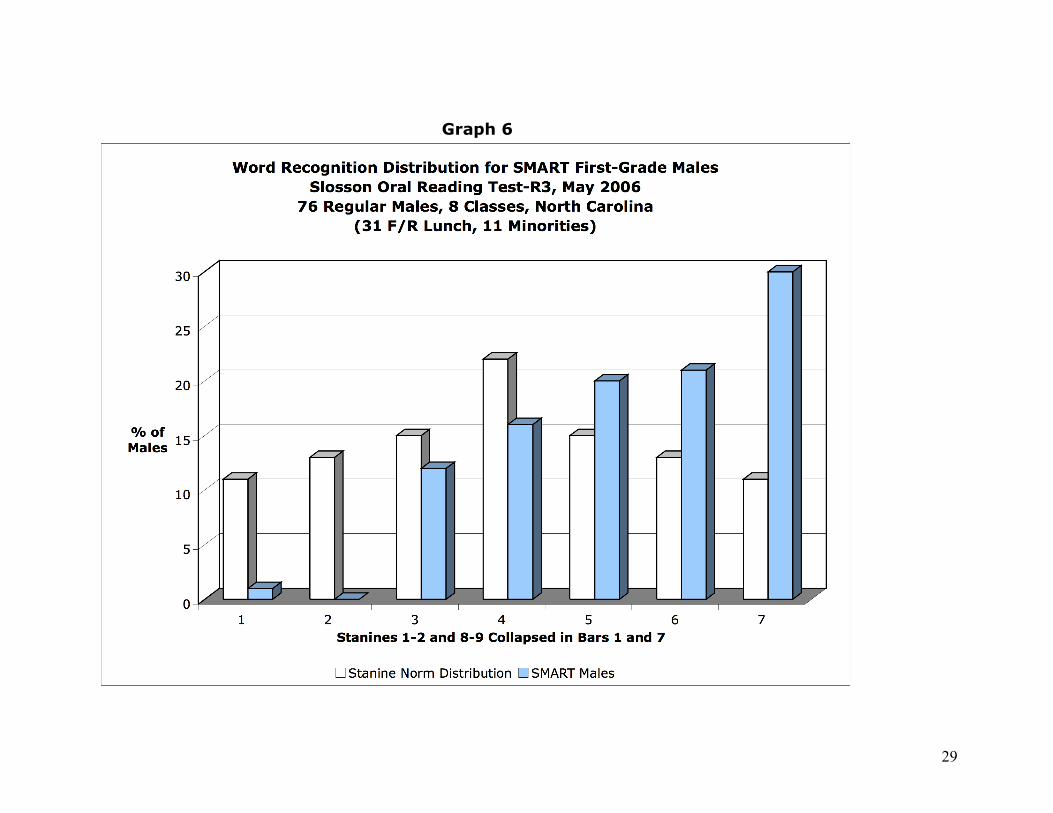
Graph 3 shows the bars representing the percentages of SMART males and females compared to the expected 25% in each national norm quartile in word recognition skill on the SORT-R3. Graphs 4 and 5 display the quartile distributions for the disaggregated males and females in which 80% or more of the students in each subgroup score above the national mean. These students are reading words orally at a quick automatic recognition level. The teachers have taken advantage of the opportunity present in these highly-developed and attentive students to teach to high levels of proficiency. SORT-R3 normal curve distributions for male and female collapsed stanines are shown in Graphs 6 and 7. The nine stanine bars have been collapsed into seven with bars 1-2 and 8-9 combined to produce a narrower display. The seven vertical bars represent expected (blank) and observed (colored) normal curve proportions of 11, 13, 15, 22, 15, 13, and 11 percent in the 7 bars. Bars 3, 4 and 5 thus represent the normal /expected range for 52% of the students with 24% expected in each of the 2-bar tails of the curve. Graph 6 shows that only one male scored in the lowest stanine while 51% of males scored in bars 6-7 compared to the expected 24%. Females in Graph 7 also had only a single regular student scoring below the normal range with 47% scoring in the highest bars compared to the expected 24%. These normal curve bars present a dramatic picture of the performance of students receiving one or two years of SMART stimulation and pedagogical principles integrated into reading curricula by experienced and trained teacher. This stanine distribution is consistent with previous SMART results as shown in the logo below.
26
Graph 3
27
Graph 4
28
Graph 5
29
Graph 6
30
Graph 7
31
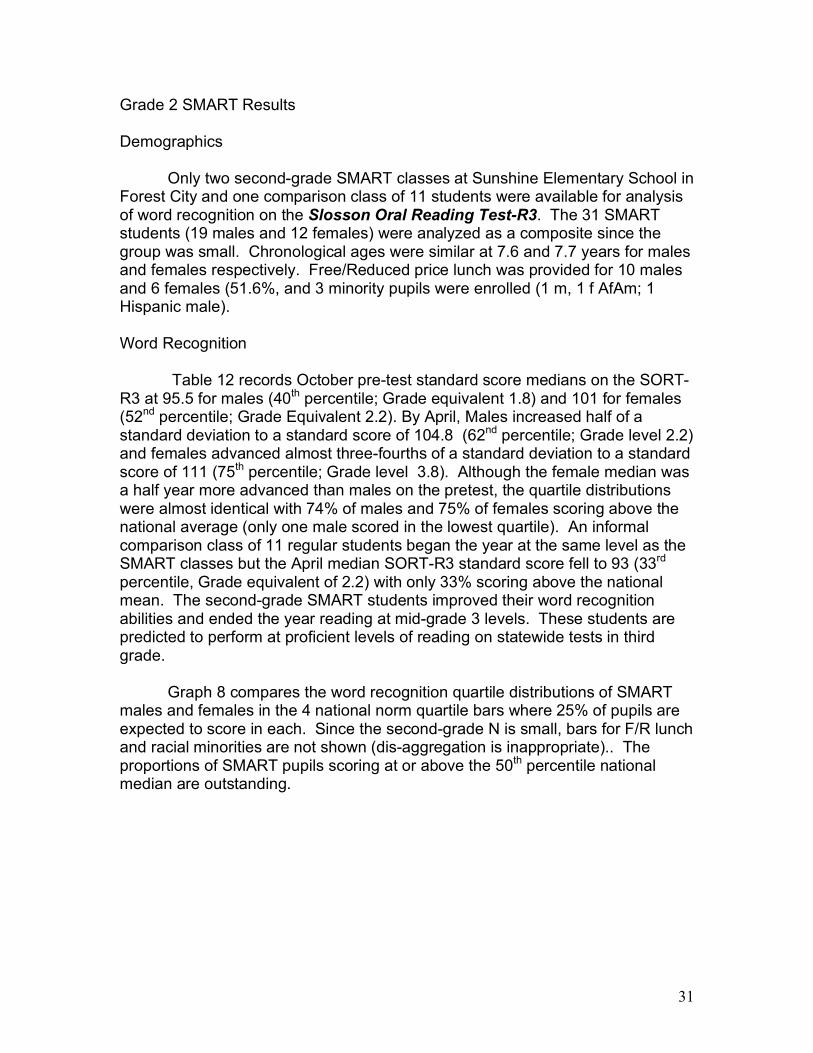
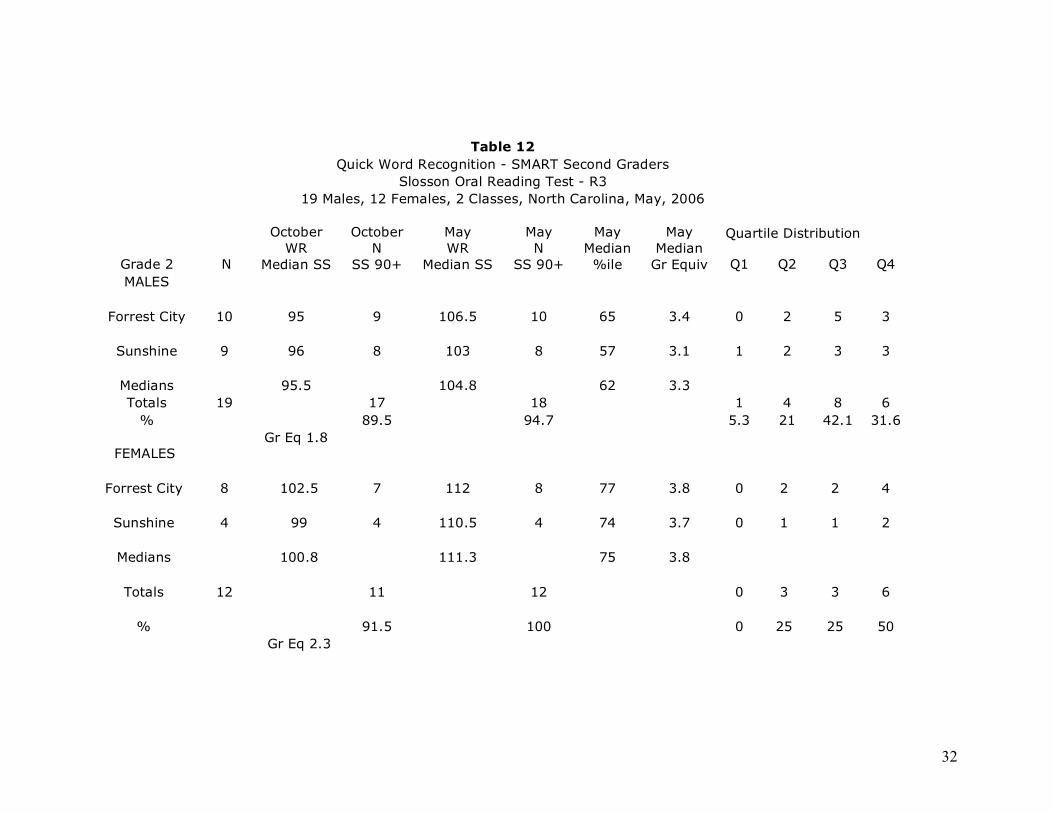
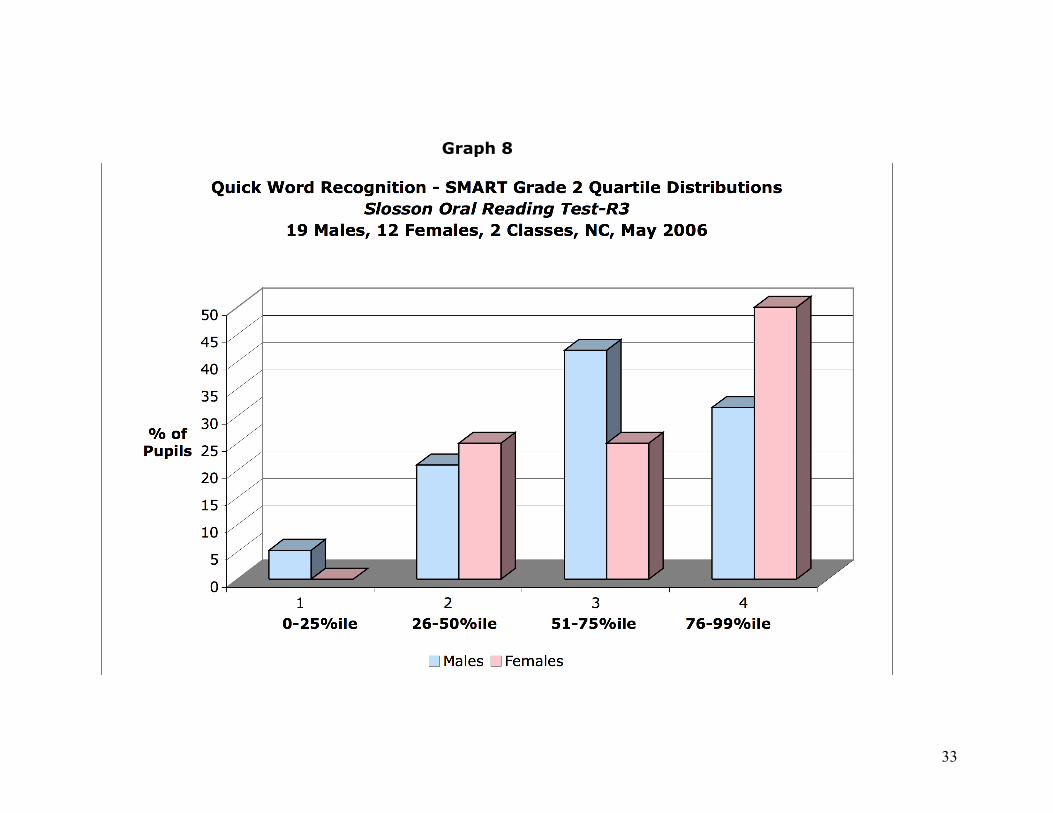
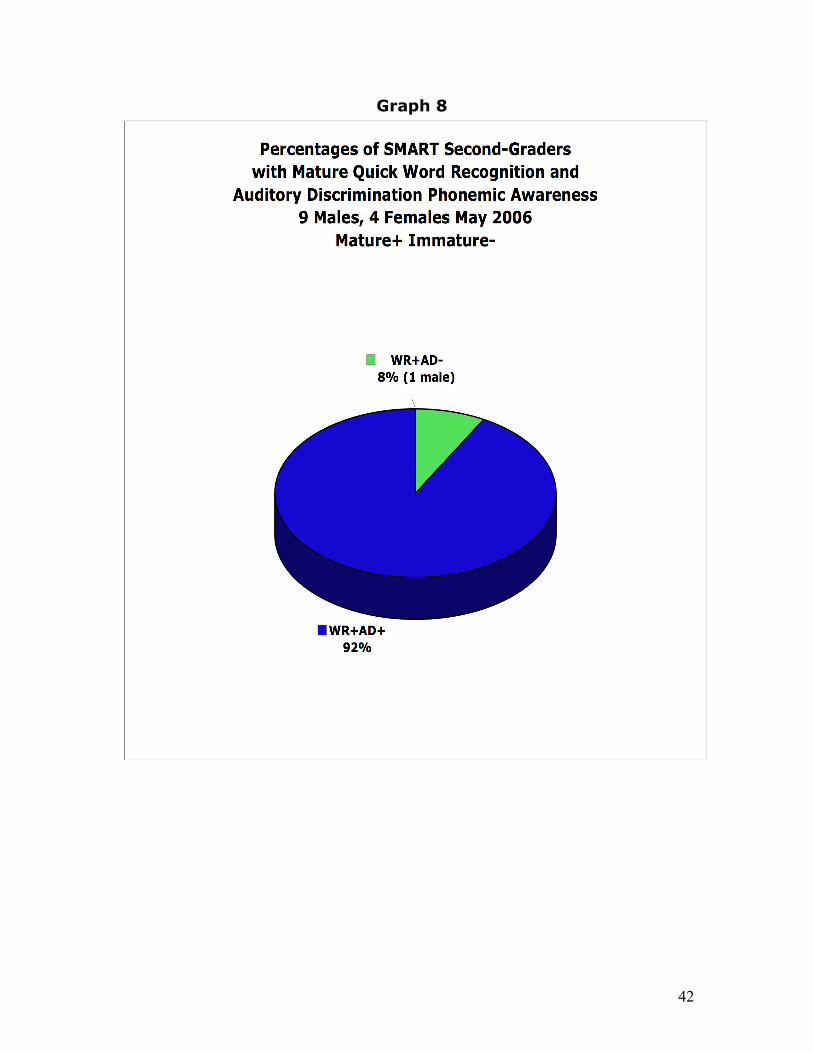
Grade 2 SMART Results Demographics Only two second-grade SMART classes at Sunshine Elementary School in Forest City and one comparison class of 11 students were available for analysis of word recognition on the Slosson Oral Reading Test-R3. The 31 SMART students (19 males and 12 females) were analyzed as a composite since the group was small. Chronological ages were similar at 7.6 and 7.7 years for males and females respectively. Free/Reduced price lunch was provided for 10 males and 6 females (51.6%, and 3 minority pupils were enrolled (1 m, 1 f AfAm; 1 Hispanic male). Word Recognition Table 12 records October pre-test standard score medians on the SORT-R3 at 95.5 for males (40th percentile; Grade equivalent 1.8) and 101 for females (52nd percentile; Grade Equivalent 2.2). By April, Males increased half of a standard deviation to a standard score of 104.8 (62nd percentile; Grade level 2.2) and females advanced almost three-fourths of a standard deviation to a standard score of 111 (75th percentile; Grade level 3.8). Although the female median was a half year more advanced than males on the pretest, the quartile distributions were almost identical with 74% of males and 75% of females scoring above the national average (only one male scored in the lowest quartile). An informal comparison class of 11 regular students began the year at the same level as the SMART classes but the April median SORT-R3 standard score fell to 93 (33rd percentile, Grade equivalent of 2.2) with only 33% scoring above the national mean. The second-grade SMART students improved their word recognition abilities and ended the year reading at mid-grade 3 levels. These students are predicted to perform at proficient levels of reading on statewide tests in third grade. Graph 8 compares the word recognition quartile distributions of SMART males and females in the 4 national norm quartile bars where 25% of pupils are expected to score in each. Since the second-grade N is small, bars for F/R lunch and racial minorities are not shown (dis-aggregation is inappropriate).. The proportions of SMART pupils scoring at or above the 50th percentile national median are outstanding.
32
Table 12
Quick Word Recognition - SMART Second Graders Slosson Oral Reading Test - R3
19 Males, 12 Females, 2 Classes, North Carolina, May, 2006 Quartile Distribution
Grade 2 N
October WR
Median SS
October N
SS 90+
May WR
Median SS
May N
SS 90+
May Median %ile
May Median
Gr Equiv Q1 Q2 Q3 Q4 MALES
Forrest City 10 95 9 106.5 10 65 3.4 0 2 5 3
Sunshine 9 96 8 103 8 57 3.1 1 2 3 3
Medians 95.5 104.8 62 3.3 Totals 19 17 18 1 4 8 6
% 89.5 94.7 5.3 21 42.1 31.6 Gr Eq 1.8
FEMALES
Forrest City 8 102.5 7 112 8 77 3.8 0 2 2 4
Sunshine 4 99 4 110.5 4 74 3.7 0 1 1 2
Medians 100.8 111.3 75 3.8
Totals 12 11 12 0 3 3 6
% 91.5 100 0 25 25 50 Gr Eq 2.3
33
Graph 8
34
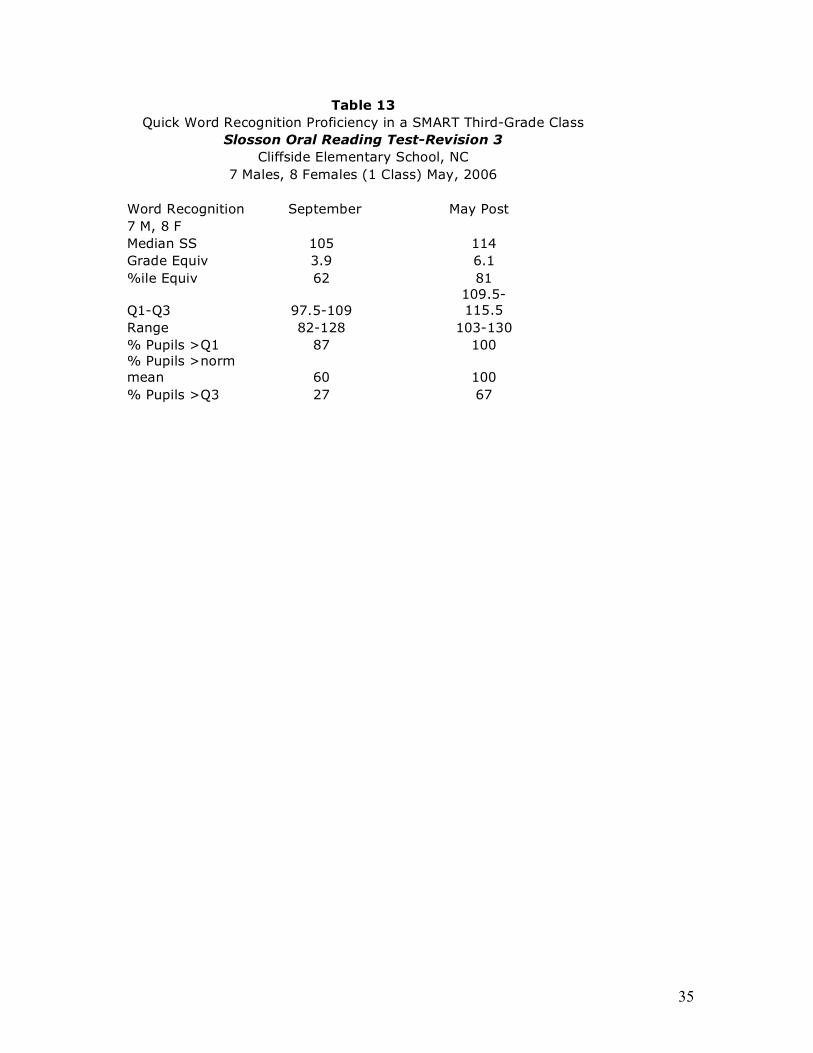
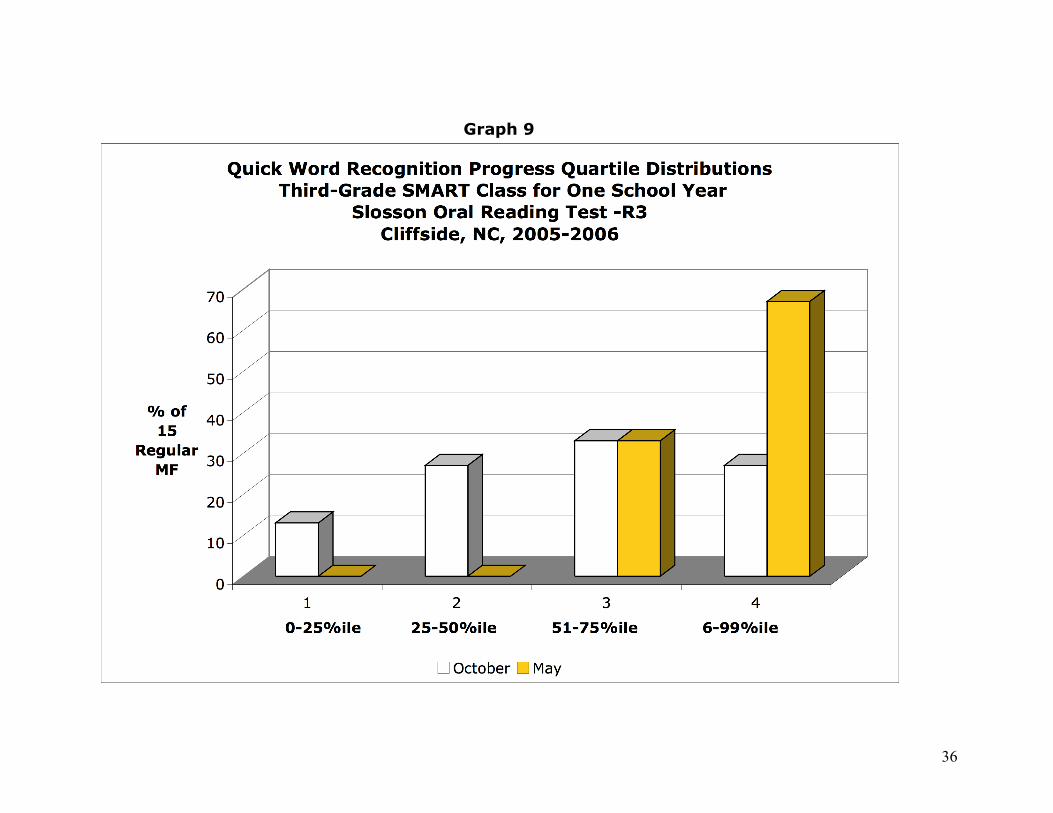
Grade 3 SMART Results Demographics Only one North Carolina SMART class of 7 males and 8 females participated in the 2005-2006 school year in (Cliffside Elementary School). Chronological ages for these regular students ranged from 8.2 to 9.7 years with a median of 8.7 years. Two males and 2 females received F/R lunches and 1 Asian minority attended. One pupil was excluded for special needs in ELL/Special Education. Word Recognition Table 13 shows October SORT-R3 standard score medians for these 15 students (62nd percentile; Grade equivalent 3.9) with 60% of students scoring above the national norm mean. By April, the median standard score increased more than half of a standard deviation to 114 (81st percentile; Grade level 6.1) and the median grade level for word recognition advanced by two grades during the school year (3.9 to 6.1). All students scored above the national mean on the post-test. The third-grade SMART students improved their word recognition abilities and at least half of the class ended the year reading at the beginning sixth-grade level. These students are predicted to perform at proficient levels of reading on statewide tests in fourth grade. Graph 9 compares pre-post word recognition quartile distributions of SMART males/females in the 4 national norm quartile bars where 25% of pupils are expected to score in each. Since the third-grade N is small, bars for F/R lunch and racial minorities are not shown (dis-aggregation is inappropriate). The 100%proportion of SMART pupils scoring at or above the 50th percentile national median is outstanding.
35
Table 13 Quick Word Recognition Proficiency in a SMART Third-Grade Class
Slosson Oral Reading Test-Revision 3 Cliffside Elementary School, NC
7 Males, 8 Females (1 Class) May, 2006 Word Recognition September May Post 7 M, 8 F Median SS 105 114 Grade Equiv 3.9 6.1 %ile Equiv 62 81
Q1-Q3 97.5-109 109.5-115.5
Range 82-128 103-130 % Pupils >Q1 87 100 % Pupils >norm mean 60 100 % Pupils >Q3 27 67
36
Graph 9
37
Maximizing Early Literacy Skills:
Auditory Discrimination Readiness for Phonetic Analysis (Plus Automatic Sight Word Recognition)
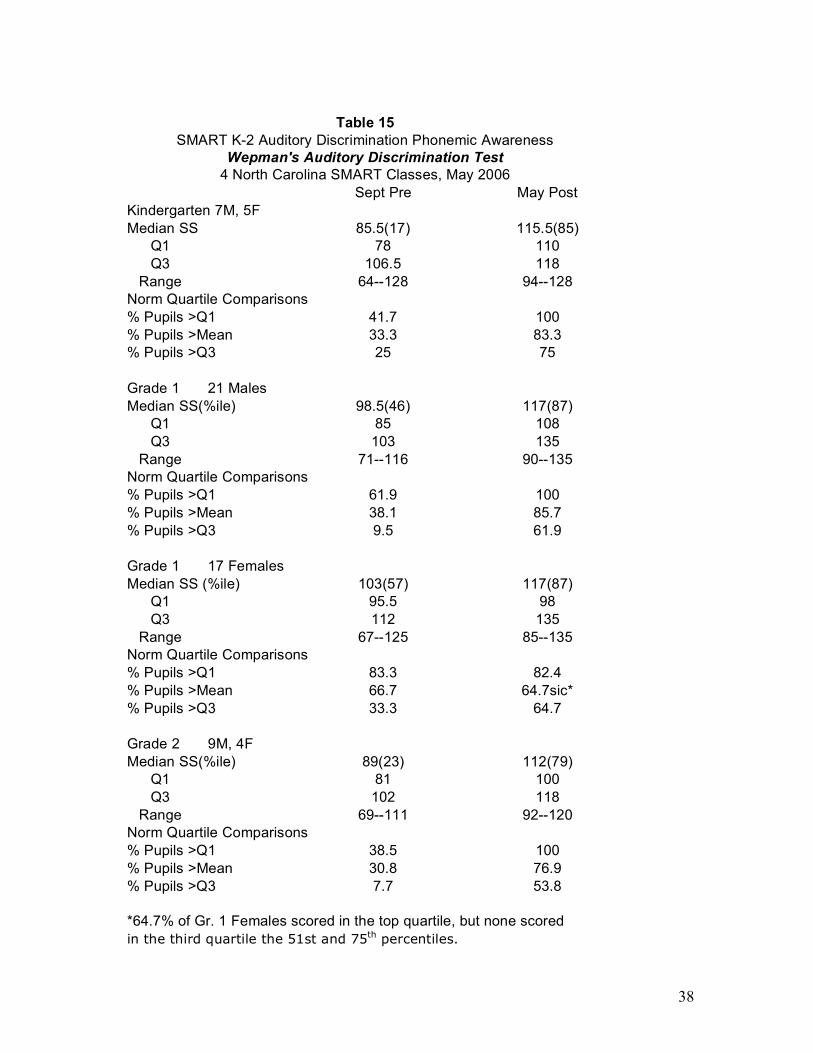
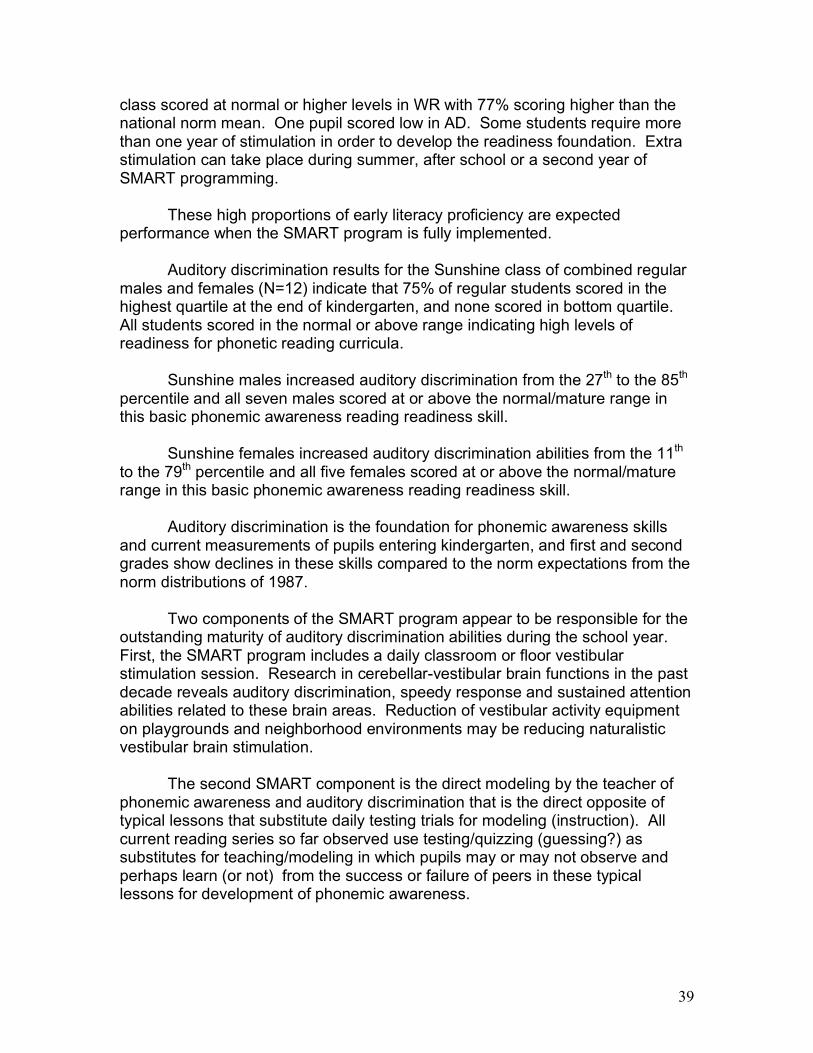
Basic reading skills include two major categories, phonetic decoding of unfamiliar words and automatic recognition of words and phrases. Phonetic decoding depends on the phonemic awareness skills based on the readiness foundation of auditory discrimination of individual phonemes (letter sounds). The nationally-standardized Wepman Auditory Discrimination Test (Reynolds, 1987) measures the ability of Pre-K-4 pupils to hear differences in 30 similar-sounding word-pairs (cat-pat, hid-head). Automatic, quick word recognition is measured in the SMART program by using the Slosson Oral Reading Test-R3 that requires saying the word within 5 seconds of exposure. The auditory discrimination ability receives special emphasis in the SMART program through daily vestibular stimulation, music and brief modeling explanations of subtle differences in similar-sounding words. Teachers also call attention to similarities when learning new words during reading and story listening by defining new words and comparing pronunciations and enunciations (Examples: shinny vs. shimmy, rink vs. rank, father vs. fodder, mint vs. meant, etc). Rather than the typical testing/trying approach found in reading curricula, SMART teachers provide neuro-developmental input by modeling auditory closure (missing sounds: ool-ell is school bell), blending (r-ai-n is rain), and segmenting (bell is b-e-ll) to produce universal maturity of readiness, Students in SMART programs are notable for their quick and automatic responses provided to examiners. Quick word recognition abilities are developed to unusually advanced levels by training SMART visual readiness foundation skills (visual fixations, accommodation, smooth pursuit, convergence, binocular fusion, acuity stimulation, depth perception and word visualization) in addition to a curricular sequence of form, letter, word and phrase recognition enhanced by vestibular stimulation. The reading curriculum adopted by the school is used as the reading sequence with emphasis on meaning and interest. Examples of the high proportions of students demonstrating early mastery of auditory discrimination and/or quick word recognition are shown in Table 15 and Graphs 5–7. Normal or higher ranges (26-99th percentiles) of scores are compared for both forms of early reading readiness in kindergarten (auditory discrimination and 37 sight wordlist). Graph 5 shows that all but one pupil of 12 kindergarteners (92%) scored in the normal range or higher in both word recognition and auditory discrimination. Graph 6 for 38 first-graders shows that 97% were mature in word recognition and 79% were mature in auditory discrimination (one pupil was mature in AD and immature in WR). Graph 7 and Table 15 show that 100% of the 13 students (6 F/R meals) in a second-grade
38
Table 15
SMART K-2 Auditory Discrimination Phonemic Awareness Wepman's Auditory Discrimination Test
4 North Carolina SMART Classes, May 2006 Sept Pre May Post Kindergarten 7M, 5F Median SS 85.5(17) 115.5(85)
Q1 78 110 Q3 106.5 118
Range 64--128 94--128 Norm Quartile Comparisons % Pupils >Q1 41.7 100 % Pupils >Mean 33.3 83.3 % Pupils >Q3 25 75 Grade 1 21 Males Median SS(%ile) 98.5(46) 117(87)
Q1 85 108 Q3 103 135
Range 71--116 90--135 Norm Quartile Comparisons % Pupils >Q1 61.9 100 % Pupils >Mean 38.1 85.7 % Pupils >Q3 9.5 61.9 Grade 1 17 Females Median SS (%ile) 103(57) 117(87)
Q1 95.5 98 Q3 112 135
Range 67--125 85--135 Norm Quartile Comparisons % Pupils >Q1 83.3 82.4 % Pupils >Mean 66.7 64.7sic* % Pupils >Q3 33.3 64.7 Grade 2 9M, 4F Median SS(%ile) 89(23) 112(79)
Q1 81 100 Q3 102 118
Range 69--111 92--120 Norm Quartile Comparisons % Pupils >Q1 38.5 100 % Pupils >Mean 30.8 76.9 % Pupils >Q3 7.7 53.8 *64.7% of Gr. 1 Females scored in the top quartile, but none scored in the third quartile the 51st and 75th percentiles.
39
class scored at normal or higher levels in WR with 77% scoring higher than the national norm mean. One pupil scored low in AD. Some students require more than one year of stimulation in order to develop the readiness foundation. Extra stimulation can take place during summer, after school or a second year of SMART programming. These high proportions of early literacy proficiency are expected performance when the SMART program is fully implemented. Auditory discrimination results for the Sunshine class of combined regular males and females (N=12) indicate that 75% of regular students scored in the highest quartile at the end of kindergarten, and none scored in bottom quartile. All students scored in the normal or above range indicating high levels of readiness for phonetic reading curricula. Sunshine males increased auditory discrimination from the 27th to the 85th percentile and all seven males scored at or above the normal/mature range in this basic phonemic awareness reading readiness skill. Sunshine females increased auditory discrimination abilities from the 11th to the 79th percentile and all five females scored at or above the normal/mature range in this basic phonemic awareness reading readiness skill. Auditory discrimination is the foundation for phonemic awareness skills and current measurements of pupils entering kindergarten, and first and second grades show declines in these skills compared to the norm expectations from the norm distributions of 1987. Two components of the SMART program appear to be responsible for the outstanding maturity of auditory discrimination abilities during the school year. First, the SMART program includes a daily classroom or floor vestibular stimulation session. Research in cerebellar-vestibular brain functions in the past decade reveals auditory discrimination, speedy response and sustained attention abilities related to these brain areas. Reduction of vestibular activity equipment on playgrounds and neighborhood environments may be reducing naturalistic vestibular brain stimulation. The second SMART component is the direct modeling by the teacher of phonemic awareness and auditory discrimination that is the direct opposite of typical lessons that substitute daily testing trials for modeling (instruction). All current reading series so far observed use testing/quizzing (guessing?) as substitutes for teaching/modeling in which pupils may or may not observe and perhaps learn (or not) from the success or failure of peers in these typical lessons for development of phonemic awareness.
40
Graph 6
41
Graph 7
42
Graph 8
43
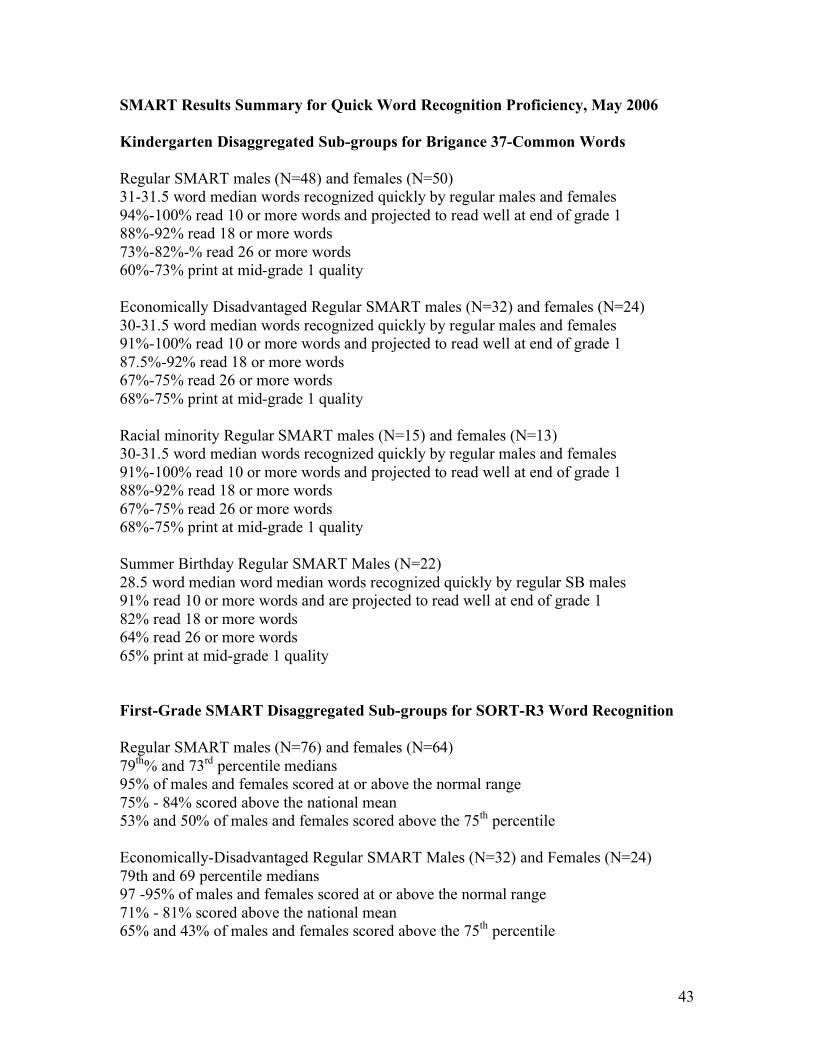
SMART Results Summary for Quick Word Recognition Proficiency, May 2006 Kindergarten Disaggregated Sub-groups for Brigance 37-Common Words Regular SMART males (N=48) and females (N=50) 31-31.5 word median words recognized quickly by regular males and females 94%-100% read 10 or more words and projected to read well at end of grade 1 88%-92% read 18 or more words 73%-82%-% read 26 or more words 60%-73% print at mid-grade 1 quality Economically Disadvantaged Regular SMART males (N=32) and females (N=24) 30-31.5 word median words recognized quickly by regular males and females 91%-100% read 10 or more words and projected to read well at end of grade 1 87.5%-92% read 18 or more words 67%-75% read 26 or more words 68%-75% print at mid-grade 1 quality Racial minority Regular SMART males (N=15) and females (N=13) 30-31.5 word median words recognized quickly by regular males and females 91%-100% read 10 or more words and projected to read well at end of grade 1 88%-92% read 18 or more words 67%-75% read 26 or more words 68%-75% print at mid-grade 1 quality Summer Birthday Regular SMART Males (N=22) 28.5 word median word median words recognized quickly by regular SB males 91% read 10 or more words and are projected to read well at end of grade 1 82% read 18 or more words 64% read 26 or more words 65% print at mid-grade 1 quality First-Grade SMART Disaggregated Sub-groups for SORT-R3 Word Recognition Regular SMART males (N=76) and females (N=64) 79th% and 73rd percentile medians 95% of males and females scored at or above the normal range 75% - 84% scored above the national mean 53% and 50% of males and females scored above the 75th percentile Economically-Disadvantaged Regular SMART Males (N=32) and Females (N=24) 79th and 69 percentile medians 97 -95% of males and females scored at or above the normal range 71% - 81% scored above the national mean 65% and 43% of males and females scored above the 75th percentile
44
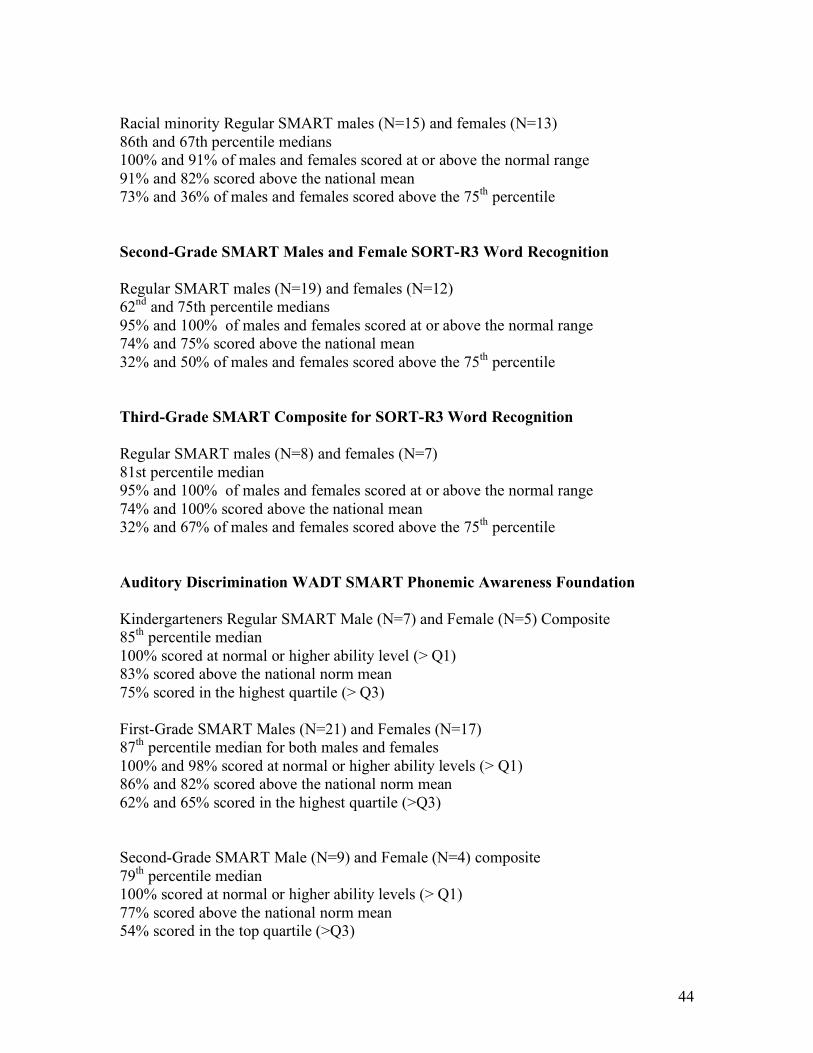
Racial minority Regular SMART males (N=15) and females (N=13) 86th and 67th percentile medians 100% and 91% of males and females scored at or above the normal range 91% and 82% scored above the national mean 73% and 36% of males and females scored above the 75th percentile Second-Grade SMART Males and Female SORT-R3 Word Recognition Regular SMART males (N=19) and females (N=12) 62nd and 75th percentile medians 95% and 100% of males and females scored at or above the normal range 74% and 75% scored above the national mean 32% and 50% of males and females scored above the 75th percentile Third-Grade SMART Composite for SORT-R3 Word Recognition Regular SMART males (N=8) and females (N=7) 81st percentile median 95% and 100% of males and females scored at or above the normal range 74% and 100% scored above the national mean 32% and 67% of males and females scored above the 75th percentile Auditory Discrimination WADT SMART Phonemic Awareness Foundation Kindergarteners Regular SMART Male (N=7) and Female (N=5) Composite 85th percentile median 100% scored at normal or higher ability level (> Q1) 83% scored above the national norm mean 75% scored in the highest quartile (> Q3) First-Grade SMART Males (N=21) and Females (N=17) 87th percentile median for both males and females 100% and 98% scored at normal or higher ability levels (> Q1) 86% and 82% scored above the national norm mean 62% and 65% scored in the highest quartile (>Q3) Second-Grade SMART Male (N=9) and Female (N=4) composite 79th percentile median 100% scored at normal or higher ability levels (> Q1) 77% scored above the national norm mean 54% scored in the top quartile (>Q3)
45
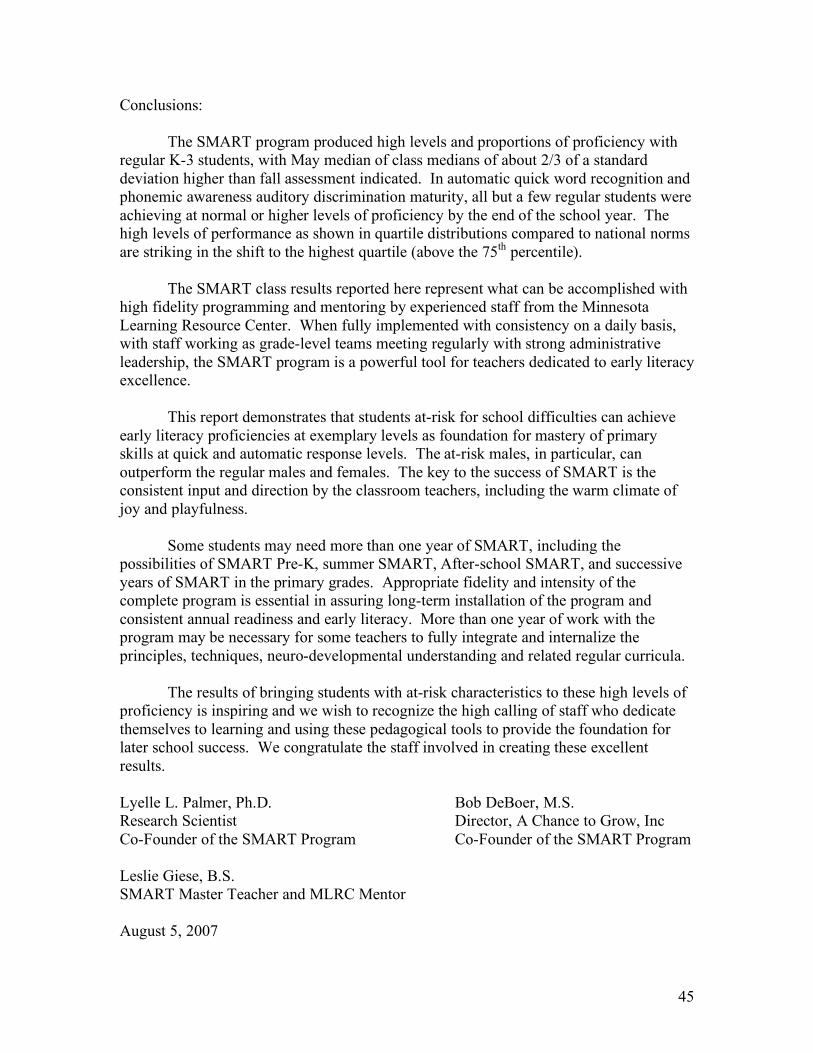
Conclusions: The SMART program produced high levels and proportions of proficiency with regular K-3 students, with May median of class medians of about 2/3 of a standard deviation higher than fall assessment indicated. In automatic quick word recognition and phonemic awareness auditory discrimination maturity, all but a few regular students were achieving at normal or higher levels of proficiency by the end of the school year. The high levels of performance as shown in quartile distributions compared to national norms are striking in the shift to the highest quartile (above the 75th percentile). The SMART class results reported here represent what can be accomplished with high fidelity programming and mentoring by experienced staff from the Minnesota Learning Resource Center. When fully implemented with consistency on a daily basis, with staff working as grade-level teams meeting regularly with strong administrative leadership, the SMART program is a powerful tool for teachers dedicated to early literacy excellence. This report demonstrates that students at-risk for school difficulties can achieve early literacy proficiencies at exemplary levels as foundation for mastery of primary skills at quick and automatic response levels. The at-risk males, in particular, can outperform the regular males and females. The key to the success of SMART is the consistent input and direction by the classroom teachers, including the warm climate of joy and playfulness. Some students may need more than one year of SMART, including the possibilities of SMART Pre-K, summer SMART, After-school SMART, and successive years of SMART in the primary grades. Appropriate fidelity and intensity of the complete program is essential in assuring long-term installation of the program and consistent annual readiness and early literacy. More than one year of work with the program may be necessary for some teachers to fully integrate and internalize the principles, techniques, neuro-developmental understanding and related regular curricula. The results of bringing students with at-risk characteristics to these high levels of proficiency is inspiring and we wish to recognize the high calling of staff who dedicate themselves to learning and using these pedagogical tools to provide the foundation for later school success. We congratulate the staff involved in creating these excellent results. Lyelle L. Palmer, Ph.D. Bob DeBoer, M.S. Research Scientist Director, A Chance to Grow, Inc Co-Founder of the SMART Program Co-Founder of the SMART Program Leslie Giese, B.S. SMART Master Teacher and MLRC Mentor August 5, 2007
46
References: Brigance, A. (1987, 1999) Brigance K & 1 Screen for Kindergarten and First Grade. Second Edition. North Billerica, MA: Curriculum Associates. MLRC Staff. (2001) MLRC 2000-2001 Summary Report, Minneapolis: Minnesota Learning Resource Center. (Results of Minnesota SMART sites and Landau Reflex) Nicholson, C.L. (1990) Slosson Oral Reading Test–Revised SORT-R3 Manual. Slosson Educational Publications: East Aurora, NY. Reynolds, W.M. (1987) Wepman’s Auditory Discrimination Test, Second Edition. Los Angeles: Western Psychological Services. Bibliography: See full SMART Bibliography, with special attention to the following: Cheatum, Byllye Ann, and Allison A. Hammond 2000 Physical Activities for Improving
Children’s Learning and Behavior. Champaign, IL: Human Kinetics. 1-800-747-4457 E-mail: [email protected]
Dekaban, A. 1970 Neurology of Early Childhood. Baltimore: Williams and Wilkins. Diamond, M. 1988 Enriching Heredity: The Impact of the Environment on the
Anatomy of the Brain. New York: Free Press. Diamond, M & J. Hopson (1997) Magic Trees of the Mind. New York: Penguin. Gesell, A. and Amatruda. (1941,1947) Developmental Diagnosis. NY: Harper & Row. Goddard, S. 2002 Reflexes, Learning and Behavior. Eugene, OR: Fern Ridge Press. Hart, B. and T. Risely. 1997 Meaningful Differences. Baltimore: Paul H. Brookes. Kosmarskaya, E.N. 1962 The Compensatory and Regenerative Properties of the Brain:
The Influence of Peripheral Stimuli on Development of the Nerve Cells, in The Development of the Brain and Its Disturbance by Harmful Factors, B. N. Klossovskii, Ed. Oxford: Pergamon Press; New York: Macmillan. Pp. 229-237.
Palmer, 1980 Auditory Discrimination Development through Cochleo-Vestibular Stimulation. Academic Therapy, 16(1): 53-68. Palmer, L.L. 1989 A Chance to Learn: Intensive Neuro-Stimulation in Transition
Kindergarten -- Pilot Project Results. Mpls, MN: A Chance to Grow, Inc. Palmer, L.L. 1991 Smooth Eye Pursuit Readiness Stimulation Report: The A Chance
to Learn Project. Winona, MN: Winona State University, Office of Accelerated Learning
Palmer, L.L. 2001 Stimulating Maturity through Accelerated Readiness Training (SMART: Implementation in Minnesota Public Schools, in MLRC 2000-2001 Summary Report, Minneapolis: Minnesota Learning Resource Center. Pp. 9-56.
Palmer, L.L. 2001 The Landau Reflex as a Maturity Indicator of Neuro-Developmental Readiness, in MLRC 2000-2001 Summary Report, Minneapolis: Minnesota Learning Resource Center. Pp. 57-62.
Palmer, L.L. and DeBoer, B. 2005 Efficacy of the Visual Skills Component of the SMART Program in Maturing Kindergarten Visual Readiness Abilities among Students At-Risk for School Failure Knox County Public Schools, 2004-2005 A Preliminary Report of Mid-Year Results Minneapolis: Minnesota Learning Resource Center.
47
Randolph, S.L. and M.C. Heiniger 1998 Kids Learn from the Inside Out: How to Enhance the Human Matrix. Boise, Idaho: Legendary Publishing Co.
Rice, R. 1975 The Effects of Tactile-Kinesthetic Stimulation on the Subsequent Development of Premature Infants. Unpublished doctoral dissertation. Ann Arbor, Michigan: University Microfilms. Order No. 75-24, 944, 186 pp.
SMART is reported as a high-results program in The Learning Revolution, by Dryden and Voss. Dr. Palmer is co-author of the “Bright Brain” early neuro-stimulation video for parents of children ages 3-8. Audiotapes and reports are available on request. Dr. Palmer is available for conference presentations, orientations, staff development and research consultation. For more information, contact Lyelle L. Palmer, Ph.D., Education Excellence, 504 Lake Street, Winona, MN 55987 Phone: 507-452-1652 E-mail: [email protected] Additional Documentation of SMART Results, including: Kindergarten Readiness: Metropolitan Readiness Test6 Level 1 Individual Test First Grade Readiness Reports: Metropolitan Readiness Test6 Level 2 Group Test Grades 1-2: Word Recognition on Slosson Oral Reading Test-R3, K-3: auditory discrimination, word blending, achievement tests, printing quality. Formal Research Reports: Palmer, L.L. and DeBoer, B. (2006) High Levels of SMART Kindergarten Early Literacy in Southern Delaware: Quick Word Recognition on the Brigance list of 37 Common Words (A preliminary report of May 2006 literacy results). . Minneapolis: Minnesota Learning Center. SMART Report No. 31-DE06 Palmer, L.L. and DeBoer, B. (2005) Maturing Kindergarten Visual Readiness Abilities Among Students At-Risk for School Failure in Knox County Public Schools, 2004-2005 A Preliminary Report of Mid-Year Results. Minneapolis: Minnesota Learning Center. (Efficacy of the Visual Skills Component of the SMART Program). SMART Report No. 30-TN05-Vision Palmer, L.L., Bauman, M. and B. DeBoer (2005) High Proficiency Levels for SMART First Grade Reading and Listening: Quick Word Recognition and Auditory Discrimination Phonemic Awareness, Blue Heron Elementary School, Centennial Schools ISD 12, Lino Lakes, MN, May 2004, May 2005. Minneapolis, Minnesota Learning Resource Center. SMART Report No. 31-MN05-G1
Palmer, L.L., Proffit, K.O. and B. DeBoer, (2005) Mastering Early Literacy Skills with Neuro-Developmental Readiness: The SMART Program in Regular Title 1 Schools: A Preliminary Report. Minneapolis, Minnesota Learning Resource Center. SMART Report No. 29-Title05-EL
48
Palmer, L.L. and B. DeBoer, (2004) Enhancing Early Reading Recognition and Phonemic Awareness with Neuro-Educational Programming: The Minnesota SMART Project: An Interim Report. Minneapolis: Minnesota Learning Resource Center. SMART Report No. 28-MN04-EL Palmer, L.L. and B. DeBoer, (2004) National SMART Project Summary for Readiness and Early Literacy 2001-2003, in MLRC 2001-2003 Summary Reports: National Projects, Minneapolis: Minnesota Learning Resource Center. Pp. 13-18. Palmer, L.L. and B. DeBoer, (2004) Wisconsin SMART Project Results, 2001-2002: First Grade Readiness in Kindergarten and Early Literacy K-2, in MLRC 2001- 2003 Summary Report: National Projects, Minneapolis: Minnesota Learning Resource Center. Pp. 19-25. Palmer, L.L., Proffit, K.O. and B. DeBoer, (2004) High Early Literacy with Neuro- Developmental Readiness: The SMART Program in Huron, SD Regular Title 1 Schools: A Preliminary Report. Minneapolis: Minnesota Learning Resource Center. SMART Report No. 27-SD04-EL Palmer, L.L., Proffit, K.O. and B. DeBoer, (2004) School Readiness Enrichment in Rural Wisconsin Title 1 Schools using K-3 SMART Neuro-Educational Programming (Stimulating Maturity through Accelerated Readiness Training): An Interim Report. Minnesota Learning Resource Center. SMART Report No. 26-WI04- MRT Palmer, L.L. and B. DeBoer, (2003) High Readiness Levels for First Grade in Huron, South Dakota: Stimulating Maturity through Accelerated Readiness Training (SMART). Minneapolis: Minnesota Learning Resource Center. SMART Report No. 25-SD03-MRT Palmer, L.L. and B. DeBoer, (2003) Huron, South Dakota SMART/Boost-Up K-2 Results 2002-2003, in MLRC 2001-2003 Summary Report: National Projects, Minneapolis: Minnesota Learning Resource Center. Pp. 48-61. Palmer, L.L. and B. DeBoer, (2003) Knoxville, Tennessee SMART Project Results, 2003, in MLRC 2001-2003 Summary Report: National Projects, Minneapolis: Minnesota Learning Resource Center. Pp. 41-47. Palmer, L.L. and B. DeBoer, (2003) Wisconsin SMART Project Results, 2002-2003: First Grade Readiness in Kindergarten and Early Literacy K-2, in MLRC 2001- 2003 Summary Report: National Projects, Minneapolis: Minnesota Learning Resource Center. Pp. 26-33. Palmer, L.L., and DeBoer, B. (2003) Stimulating Maturity through Accelerated Readiness Training (SMART) : 2002-2003 Minnesota K-2 Project Results. Minneapolis: Minnesota Learning Resource Center. SMART Report No. 24- MN03-EL
49
Palmer, L.L. Huffaker, A.D.and B. DeBoer, (2003) Ready for First-Grade Reading Success: Kindergarten Literacy Results Following Year Two of SMART in Knox County (TN) Public Schools. Minneapolis: Minnesota Learning Resource Center. SMART Report No. 23-TN03-EL Palmer, L.L., Proffit, K.O. and B. DeBoer, (2003) Boosting Early Literacy with Neuro- Developmental Readiness: The SMART* Program in Huron, SD Regular Title 1 Schools. Minneapolis: Minnesota Learning Resource Center. SMART Report No. 22-SD03-EL Palmer, L.L., Proffit, K.O. and B. DeBoer, (2003) Enhancing Early Reading Achievement in K-3 with Two Years of SMART Neuro-Educational Programming in Rural Wisconsin Title 1 Schools. Minneapolis: Minnesota Learning Resource Center, SMART Report No. 21-WI03-EL Palmer, L.L., Proffit, K.O. and B.DeBoer (2003) High Readiness Levels for First Grade and Kindergarten in Rural Wisconsin Title I Schools: Stimulating Maturity through Accelerated Readiness Training (SMART). Minneapolis: Minnesota Learning Resource Center. SMART Report No. 20-WI03-MRT Palmer, L.L. and B. DeBoer, (2002) Knoxville, Tennessee SMART Project Results, 2002, in MLRC 2001-2003 Summary Report: National Projects, Minneapolis: Minnesota Learning Resource Center. Pp. 34-40. Palmer, L.L. Huffaker, A.D. and B. DeBoer, (2002) Prepared for First-Grade Reading Success: Kindergarten Literacy Results Following One Year of SMART in Knox County Public Schools. Minneapolis: Minnesota Learning Resource Center. SMART Report No. 19-TN02-EL Palmer, L.L., Proffit, K.O. and B. DeBoer, (2002) Boosting Early Reading Achievement with SMART Neuro-Education in Rural Wisconsin Title 1 Schools Year 1: Stimulating Maturity through Accelerated Readiness Training. Minneapolis: Minnesota Learning Resource Center. SMART Report No. 18-WI02-EL Palmer, L.L., Proffit, K.O. and B. DeBoer, (2002) High Readiness Levels for First Grade in Rural Wisconsin Title I Schools: Stimulating Maturity through Accelerated Readiness Training (SMART). Minneapolis: Minnesota Learning Resource Center. MRT6 SMART Report No. 17-WI02MRT Palmer, L.L. (2004) End-of-Year Results Report for Rural Georgia Kindergarteners (N=87) Following One School Year of SMART Stimulation: June, 1999 Preliminary Findings. Imagine, Web doc: wwwlialearn.org Palmer, L.L. (1991) Smooth Eye Pursuit Stimulation Readiness in Kindergarten. Winona,, MN: Special Education, Winona State University.
50
Palmer, L.L. (2000) Stimulating Maturity through Accelerated Readiness Training (SMART) In a Rural Native American School 1999-2000. Minneapolis: Minnesota Learning Resource Center. SMART Report No. 1-MN00-EL Rollin, S. and Bowman, J.C. (2006) Scientific Evaluation of the Effects of the Kindergarten SMART/Boost-Up Intervention for First-Grade Reading Readiness 2004-2005. Cleveland, TN: EPPC Global Management, Inc. Hard Copy Published Report Collections MLRC Staff. 2003 MLRC 2001-2003 Summary Report: National Projects, Minneapolis: Minnesota Learning Resource Center. (SD/TN/WI SMART sites) MLRC Staff. 2001 MLRC 2000-2001 Summary Report, Minneapolis: Minnesota Learning Resource Center. Minnesota SMART sites and Landau Reflex