Embed Size (px)
Citation preview

1
Isotopes and mass spectrometry
- dawn of history to today
Stephen Barnes, PhDDepartment of Pharmacology & Toxicology
University of Alabama at Birmingham
934-7117; [email protected]
January 17, 2011
Early History of Mass Spec
• 1897 Rutherford discovers the electron (cathode
rays)
• 1919 Aston using a mass spectrograph shows
that Neon with a non-integer MW (20.2 Da) is
composed of two isotopes, 20Ne and 22Ne
http://www.asms.org/Publications/Historical/HistoryofMassSpectrometry/tabid/94/Default.aspx

2
Mass spectrometry and
nuclear war
• 1935 Dempster discovers 235U, the uranium isotope first used for a nuclear fission (atom) bomb
• 1941-5 Manhattan project– Mass spectrometry, one of three methods used
to isolate 235U
– What were the other methods?
– Richard Rhodes – The making of the atomic bomb
Why we are depends on
mass• Bainbridge’s careful measurement of
masses of the elements revealed that hydrogen was heavier than predicted– This led to the concept that fusion of four H
atoms to form He would result in the loss of mass in the form of energy - from Einstein, E = mc2, i.e., a whole bunch!
– Predicted mass for helium = 4.03298 vs actual of 4.02602
m = 0.00695 Da

3
Formation of helium
The first step involves the fusion of two hydrogen nuclei 1H (protons) into deuterium, releasing a positron and a
neutrino as one proton changes into a neutron.
1H + 1H → 21D + e+ + νe + 0.42 MeV
This first step is extremely slow, both because the protons
have to tunnel through the Coulomb barrier and because
it depends on weak interactions.
The positron immediately annihilates with an electron, and
their mass energy is carried off by two gamma ray
photons.
e− + e+ → 2 γ + 1.02 MeV
After this, the deuterium produced in the first stage can
fuse with another hydrogen to produce a light isotope of
helium, 3He:
21D + 1H → 32He + γ + 5.49 MeV
From here there are three possible paths to generate
helium isotope 4He. In pp I helium-4 comes from fusing
two of the helium-3 nuclei produced; the pp II and pp III
branches fuse 3He with a pre-existing 4He to make Be. In
the Sun, branch pp I takes place with a frequency of 86%,
pp II with 14% and pp III with 0.11%. There is also an
extremely rare pp IV branch.
http://en.wikipedia.org/wiki/Nuclear_fusion
Energy from hydrogen
• Fusion of 4 hydrogen atoms leads to the
loss of 6.95 mDa
• E = mc2
• E = 6.95 x 10-3 x (3 x 108m/s)2 joules
• E = 6.28 x 10¹⁴ joules
• E = 1.744 x 10¹¹ watt/hours
– Let’s suppose there are 100 million
households in the USA and they each have five
100 watt bulbs that are on for 12 hours per day
– How many days will the lights stay on?

4
1346.0 1354.4 1362.8 1371.2 1379.6 1388.0
Mass (m/z)
00
20
40
60
80
100%
Inte
ns
ity
1366.82
1367.82
1368.82
1369.831
900 1520 2140 2760 3380 4000
Mass (m/z)
0
8401.3
0
20
40
60
80
100
% In
ten
sit
y
1366.82 2452.17
Isotope profile of an individual peptide ion
1 Da apart.
Is the ratio
constant?
Elements
Carbon-126 protons
6 neutrons
6 electrons
Carbon-136 protons
7 neutrons
6 electrons
Carbon-146 protons
8 neutrons
6 electrons
Stable Stable UnstableNeutron decays to produce a
proton, a -particle and an anti-
neutrino - 14C becomes 14N
Naturally occurring isotopes

5
Stable isotopes of the most abundant elements
found in biological materials
*Varies according to its source
Element Mass AbundanceH
C
N
O
1.0078
2.0141
12.0000
13.0034
14.0031
15.0001
15.994916.999117.9992
99.985%
0.015%
98.89%*
1.11%*99.64%*
0.36%*99.76%*0.04%*0.20%*
S 31.9721 94.93%*32.9715 0.76%*33.967935.9671
4.29%*0.02%*
The 12C/13C ratio
• 12C was born in the inferno of stars from the triple fusion of 4He nuclei
• 13C is present in varying ratios to 12C among different stars and galaxies
• Carbon is present in interstellar space as CN and CO, and as methane and other hydrocarbons in planets– Thaolins are in the atmosphere
of the moon Titan - future source
of life?

6
The CNO cycle - Bethe-Weizsäcker-cycle
126C+1H → 13
7N+γ +1.95 MeV13
7N → 136C+e++νe +2.22 MeV
136C+1H → 14
7N+γ +7.54 MeV14
7N+1H → 158O+γ +7.35 MeV
158O → 15
7N+e++νe +2.75 MeV15
7N+1H → 126C+4
2He +4.96 MeV
The CNO chain starts occurring
at ~ 13×106 K, but its energy output rises much faster with
increasing temperatures. At ~
17×106 K, the CNO cycle starts becoming the dominant source of
energy. The sun has a
temperature of around ~
15.7×10⁶ K and only 1.7% of 4He nuclei being produced in the Sun
are born in the CNO cycle.
http://en.wikipedia.org/wiki/CNO_cycle
Terrestial 12C/13C ratio
• On average there is 1.11% of 13C in the total carbon on Earth
• Carbon is present in many forms accessible to synthetic and biosynthetic processes - mostly starting from CO2
• CO2 is in the atmosphere, in the sea as HCO3
-, in the soil as carbonates, and as organic intermediates
– 12C and 13C partition differently in each of these environments due to physical effects
– Compounds have different 12C/13C ratios

7
Isotope ratio mass spectrometer
http://en.wikipedia.org/wiki/Isotope_ratio_mass_spectrometry
Isotope ratio mass spectrometry
• Used for 13C/12C, 15N/14N, 18O/16O
• Carbon compounds are converted to CO2
• Low mass range 0-150 m/z
• Sector instrument
• Very sensitive
• Very accurate measurement of mass
• 13C/12C ratio can vary from 0.972% to 1.160%
• PeeDee standard (a rock) has 13C/12C ratio of
1.12372%

8
Fixation of CO2 as organic carbon
• RuBisCO - enzyme complex in plants
– Converts CO2 to sugars
– Prefers 12C to 13C
• Plants take in CO2 through stomata
– Two models
• Sponge divers (intermittent breathing)
– These would sample all the isotopic forms of CO2
• Swimmers on surface (frequent breathing)
– These would selectively take in 12CO2
12C/13C ratio in plants
• The 13C content would be higher in plants
that held their breath like the divers
– i.e., the stomata were open less frequently
• Drought-resistant wheat strains have a
higher 13C/12C ratio
– This is a marker for selection of drought-
resistant strains, important in the coming
global warming

9
Athletes who use synthetic
testosterone• Synthetic testosterone is made from phytosterol
percursors, typically derived from wild yams or
soy.
• Those are both warm-climate C3 plants, which
take up atmospheric carbon dioxide by a different
route than temperate-zone C4 plants, leading to
noticeably different isotope ratios.
• The typical Western industrial-country diet is
derived from a mixture of C3 and C4 stocks, so
the appearance of testosterone with a C3-plant
isotopic profile is usually diagnostic.

10
The ultimate mass spectrometer
Accelerator mass spectrometer
Set up of AMS at Purdue

11
10 GeV AMS at LLNL
Tandem accelerator
Stripper
12C-
Faraday cup
C-C4+
Quadrupole lens
13C4+
Faraday cup
Rigidity
filter
14C4+
64 sample
ion source
Low energy mass
spectrometer
Ionization
detector
Velocity
(Wien) filter
Ions (C-) are generated by a Cs ion beam. The 12C- ions are removed by a low energy mass
spectrometer (note 14N does not form ions). The remaining ions are accelerated and on
passage through the gold foil stripper form C4+ ions. The ions are separated based on
momentum, thereby measuring the 13C4+ ions. The ions are further selected for their m/z
values in the Rigidity filter, and velocity in the Wien filter. They are finally measured using a
multi-anode gas-ionization detector. Approximately 1% of the 14C ions generated are
detected. Sensitivity is ~10 attomoles of 14C from mg sized samples.

12
Sensitivity of 14C-AMS
• If one carbon atom is incorporated into a
compound, then the specific activity is ~50 mCi/mmol
• The human body naturally contains 50-90 nCi of
radioactivity – therefore, a 50 nCi dose is
reasonable and small compared to most clinical
studies
• 50 nCi is 1 nmol (10-9 mole)
• AMS can measure 1 14C atom in 1015 carbon atoms,
or 10 attomoles (10-17 moles) – 10-8 of the dose
• For a 70 kg human, 1 mg of tissue represents 1.4 x
10-5.
• If distributed evenly, the S/N is 700:1
14C-polyphenols by metabolic
labeling
Plant cells incubated
with 14C-labeled sucrose
in a closed system
14C-labeled polyphenols
extracted and fractionated
50 nCi of 14C-labeled
polyphenol(s) is 1.11 x 10⁵
dpm or 1 x 10⁻⁹ mol (0.3 mg)
Let’s suppose that 0.1%
of the dose is absorbed
into the brain, then that is
111 dpm, 0.3 ng or 1 x 10-12
mol
For a 3 g rat brain, then 3
mg is 0.11 dpm, 0.3 pg or 1
x 10-15 mol
The detection limit for 14C
using AMS is 1 x 10-17 mol,
i.e., S/N is 100:1

13
0.000%
0.002%
0.004%
0.006%
0.008%
0.010%
0.00%
0.01%
0.02%
0.03%
0.04%
0.05%
0.06%
0.07%
0.08%
0.09%
0.10%
0 4 8 12 16 20 24
% d
ose/m
L
Time (h)
Serum
ISF
Brain MD
Differential retention of 14C-labeled
proanthocyanidin by AMS
Elsa Janle et al.
The lens and its 14C-content
• The 14C-content of a cellular or tissue sample is a reflection of when the compounds therein were synthesized
• The half-life of 14C is 5,730 years
• The atmospheric 14C was doubled by the above ground atomic weapon testing in the 1950s and early 60s and is steadily declining
• The 14C content allows calculation of the age of the sample
• Used to determine the age of the victims of the 2004 Indonesian tsunami
• Is being used to determine the age of fat cells in the body
Science 321:1434 (2008)

14
Whale of a story!
Heather Koopman
UNC WilmingtonGeorge
Jackson
Purdue U
Whale blubber is laid
down slowly and may be
related to the marine 14C/12C composition over
time
Is the less solid fat
around the echo sensing
organ laid down early?
Does it turnover?
Applying AMS
analysis of whale
bone to calibrate the
year of deposition
and the marine 14C-
content. This will be
used to assess the
age of the whale
blubber.
Can isotope ratios be
ascertained for compounds?
• Conventional isotope ratio measurements
are based on converting the carbon-
containing compounds to CO2
• Given the improvements in mass
spectrometry, could we investigate the
isotope ratios of peptides and deduce the
underlying 13C/12C ratio?
15
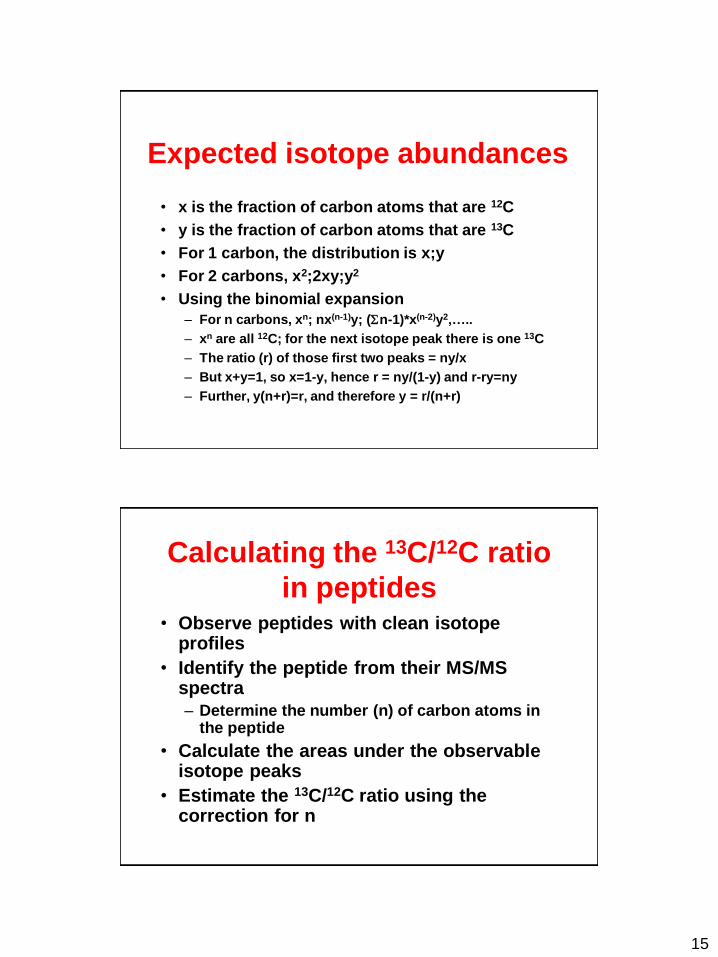
Expected isotope abundances
• x is the fraction of carbon atoms that are 12C
• y is the fraction of carbon atoms that are 13C
• For 1 carbon, the distribution is x;y
• For 2 carbons, x2;2xy;y2
• Using the binomial expansion
– For n carbons, xn; nx(n-1)y; (n-1)*x(n-2)y2,…..
– xn are all 12C; for the next isotope peak there is one 13C
– The ratio (r) of those first two peaks = ny/x
– But x+y=1, so x=1-y, hence r = ny/(1-y) and r-ry=ny
– Further, y(n+r)=r, and therefore y = r/(n+r)
Calculating the 13C/12C ratio
in peptides• Observe peptides with clean isotope
profiles
• Identify the peptide from their MS/MS spectra
– Determine the number (n) of carbon atoms in the peptide
• Calculate the areas under the observable isotope peaks
• Estimate the 13C/12C ratio using the correction for n

16
Total ion current
Selected ion chromatogram
for m/z 653.313
Isolation of a BSA tryptic peptide
Isotope peaks for LGEYGFQNALIVR
4833.71
3449.64
1418.82
429.40
C68 H107 N18 O19

17
Estimating 13C content
• The ratio of the 1-13C and 12C isotope peak
heights is 3449.64/4833.71,
– i.e., r = 0.713663
• Y, the fraction of the carbons that are 13C,
is r/(n+r)
• Y = 0.713663/(68 + 0.713663)
• Y = 0.01038, i.e. 1.038%
Isolation of a BSA tryptic
peptide
Total ion current
Selected ion
chromatogram for
m/z 461.667

18
Isotope peaks for AEFVEVTK
11505.56
5722.78
1779.43
423.38
Mass differences for H, C, N
and O isotopes• 2H - 1H = 1.0063 Da
• 13C - 12C = 1.0031 Da
• 15N - 14N = 0.9970 Da
• 17O - 16O = 1.0042 Da
• Therefore, 13C and 15N will be different by -0.0061 Da and 13C and 17O by 0.0011 Da
• The 2H and 13C difference would be 0.0032 Da, but only accounts for 1% of the apparent 13C difference

19
Stable isotopes of the most abundant elements
found in biological materials
*Varies according to its source
Element Mass AbundanceH
C
N
O
1.0078
2.0141
12.0000
13.0034
14.0031
15.0001
15.994916.999117.9992
99.985%
0.015%
98.89%*
1.11%*99.64%*
0.36%*99.76%*0.04%*0.20%*
S 31.9721 94.93%*32.9715 0.76%*33.967935.9671
4.29%*0.02%*
Can high resolution FT-ICR-MS
resolve the 13C, 15N isotope
contributions?
13C-12C = 1.0034 Da
15N-14N = 0.9970 Da
• Therefore, the difference between a 13C and 15N
contribution is 0.0064 Da
• The m/z of the doubly charged BSA peptide is 733
• Resolution needed is 2 x 653/0.0064 = 204,063
• Achievable on 7T FT-ICR instrument if the FID is
observed for several seconds

20
Mass resolution on different instruments
15N/14N ratio over the
archaea periods
• Earth did not start with an oxygen
atmosphere
– Dominated by a N2/NH3/CN- anerobic
environment for first several billion
years
– First settlers on Earth were archaea
bacteria
– A nitrogen-fixing archaeon from a deep
sea volcanic vent operates at 92oC

21
Processes leading to changing 15N/14N ratio
Examination of the 15N/14N ratio in 2.5 billion year old Mount McRae
Shale in W. Australia reveals a transient period of nitrification and
implies that nitrifying and denitrifying bacteria were already present
Garvin et al., Science 323, 1045 (2009)
18O/16O isotope ratio
• Evaporation of H218O requires more
energy than H216O
– Water vapor is enriched in 16O whereas ice is
enriched in 18O
– Measurement of 18O/16O ratio in ice cores
allows scientists to estimate the temperature
over the past millions of years
– As the temperature decreases, the 18O/16O ratio
falls
– Hurricanes cause a severe depletion of 18O –
this can be detected in trees
– Calcite (shells) takes one O from water and
parallels the ice record

22
18O/16O isotope ratio and climate
change
http://en.wikipedia.org/wiki/Oxygen_isotope_ratio_cycle
Association of d18O changes
with tropical storms
The bulk time-dependent change
in 18O is modeled and then fitted to
the isotope record as measured in
tree rings.
The known tropical cyclones are
associated with significant
deviation to lower amounts of 18O.
Miller et al., PNAS 103:14294, 2006