Embed Size (px)
Citation preview

EARLY GENERATION SEED INVESTMENT PLAN GUIDE
October 2016
This publication was produced by Feed the Future: Building Capacity for African Agricultural
Transformation Project (Africa Lead II) for the United States Agency for International Development

EARLY GENERATION SEED INVESTMENT PLAN GUIDE
Program Title: Early Generation Seed Systems Study, Feed the Future: Building
Capacity for African Agricultural Transformation (Africa Lead II)
Sponsoring USAID Office: USAID Bureau of Food Security
Award Number: DAI Prime Cooperative Agreement No. AID-OAA-A-13-00085 for the
U.S. Agency for International Development, Feed the Future:
Building Capacity for African Agricultural Transformation (Africa
LEAD II) Program
Subcontract: DAI subcontract No. ALB-2015-001 with Context Network
Date of Publication: October 2016
Author: Context Network
The authors’ views expressed in this publication do not necessarily reflect the views of the United
States Agency for International Development or the United States Government.

EARLY GENERATION SEED INVESTMENT PLAN GUIDE iii
CONTENTS CONTENTS ...............................................................................................................................III
TABLES AND FIGURES .......................................................................................................... IV
FOREWORD ............................................................................................................................ VI
ACKNOWLEDGMENTS ......................................................................................................... VIII
ACRONYMS ............................................................................................................................. IX
TERMINOLOGY ........................................................................................................................ X
INTRODUCTION ....................................................................................................................... 1
CHAPTER 1: PROVIDING SEED SECTOR CONTEXT ............................................................ 3 1.1 PROBLEM STATEMENT ....................................................................................................... 3 1.2 CROP-LEVEL ANALYSIS ..................................................................................................... 3 1.3 SEED SYSTEM ANALYSIS .................................................................................................... 6 1.4 CONTRAINTS AND BOTTLENECKS TO OVERCOME ................................................................17 1.5 STAKEHOLDER ANALYSIS ..................................................................................................18 1.6 RESOURCES FOR PROVIDING SEED SECTOR CONTEXT .......................................................21
CHAPTER 2: MAKING THE INVESTMENT CASE ..................................................................23 2.1 ANALYZING INTERVENTION IMPACT ....................................................................................23 2.2 DEVELOPING THE RESULTS FRAMEWORK ...........................................................................25 2.3 RESOURCES FOR MAKING THE INVESTMENT CASE ..............................................................31
CHAPTER 3: DESCRIBING THE INTERVENTION ..................................................................33 3.1 INTERVENTION DIAGRAM ...................................................................................................33 3.2 INTERVENTION ACTIVITIES .................................................................................................34 3.3 STAKEHOLDERS ................................................................................................................36 3.4 MONITORING & EVALUATION .............................................................................................38 3.5 RISK CONSIDERATIONS .....................................................................................................39 3.6 RESOURCES FOR DESCRIBING THE INTERVENTION ..............................................................41
CHAPTER 4: STRUCTURING THE INTERVENTION ..............................................................43 4.1 GOVERNANCE ...................................................................................................................43 4.2 PUBLIC PRIVATE PARTNERSHIPS .......................................................................................44 4.3 FUNDING ARRANGEMENTS ................................................................................................46 4.4 RESOURCES FOR STRUCTURING THE INTERVENTION ...........................................................47
CHAPTER 5: ADVOCATING FOR SEED SYSTEMS ...............................................................48 5.1 ROLE OF SEED SYSTEMS WITHIN NAIPS ............................................................................48 5.2 INCREASING THE ROLE OF SEED IN NAIPS .........................................................................48 5.3 RESOURCES FOR SEED SYSTEM ADVOCACY ......................................................................50
ANNEX 1: GUIDES AND TOOLS .............................................................................................51
ANNEX 2: USEFUL DATA SOURCES AND REPOSITORIES .................................................55
ANNEX 3: BIBLIOGRAPHY .....................................................................................................58

EARLY GENERATION SEED INVESTMENT PLAN GUIDE iv
TABLES AND FIGURES TABLES Table 1: Gender roles in crop production in Rwanda ................................................................... 8
Table 2: Gender roles in crop production in Zambia .................................................................... 8
Table 3: Gender roles in crop production in Kenya ...................................................................... 8
Table 4: Gender roles in crop production in Nigeria .................................................................... 9
Table 5: Sample varietal release table ...................................................................................... 10
Table 6: Seed sector stakeholder table ..................................................................................... 21
Table 7: Sample implementation plan table ............................................................................... 35
Table 8: Example Gantt chart .................................................................................................... 35
Table 9: Sample stakeholder benefit summary.......................................................................... 36
Table 10: Sample stakeholder roles and responsibilities table .................................................. 37
Table 11: Sample M&E summary table ..................................................................................... 38
Table 12: Sample risk profile and mitigation summary .............................................................. 40
Table 13: Sample mapping of seed system to NAIP thematic areas ......................................... 49
FIGURES Figure 1: EGS Investment Plan Guide chapters mapped to NAIP evaluation criteria .................. 2
Figure 2: Sample production and yield analysis .......................................................................... 4
Figure 3: Sample mapping of country production sources ........................................................... 5
Figure 4: Sample crop consumption trend analysis ..................................................................... 5
Figure 5: Sample demand source summary ................................................................................ 6
Figure 6: Sample dominant seed system summary ..................................................................... 7
Figure 7: Sample seed system process flow chart ...................................................................... 9
Figure 8: Sample farmer cost perception analysis ..................................................................... 11
Figure 9: Map of demand variables ........................................................................................... 12
Figure 10: Sample EGS demand forecast ................................................................................. 14
Figure 11: Sample cost of EGS production analysis .................................................................. 15
Figure 12: Potential sources of economic value of improved varieties ....................................... 16
Figure 13: Variables that inform market archetype selection ..................................................... 16
Figure 14: BMGF Partnership Seed System Market Archetype framework ............................... 17
Figure 15: Extended EGS value-chain and actors ..................................................................... 18
Figure 16: Intervention value comparison.................................................................................. 25
Figure 17: Sample seed system requirements overview ........................................................... 26
Figure 18: Impact of seed intervention on country objectives .................................................... 27
Figure 19: CAADP results framework level 2 ............................................................................ 28
Figure 20: Sample seed system requirements overview ........................................................... 29
Figure 21: World Bank agribusiness indicators for seed sector ................................................. 30
Figure 22: FTF early generation seed indicators ....................................................................... 30
Figure 23: Sample intervention diagram .................................................................................... 33
Figure 24: Localized seed production diagram .......................................................................... 34
Figure 25: Tubura intervention diagram..................................................................................... 34
Figure 26: Sample precedence diagram method ....................................................................... 35

EARLY GENERATION SEED INVESTMENT PLAN GUIDE v
Figure 27: Influence-interest matrix ........................................................................................... 37
Figure 28: Twelve components of a functional M&E system ...................................................... 39
Figure 29: Sample project organizational chart ......................................................................... 43
Figure 30: Example positioning of crops within the archetype framework .................................. 46
Figure 31: Sample NAIP architecture ........................................................................................ 48
Figure 32: Linkage between seed systems and REC agricultural priorities ................................ 50
EARLY GENERATION SEED INVESTMENT PLAN GUIDE vi
FOREWORD The United States Agency for International Development (USAID) Bureau for Food Security
(BFS) Early Generation Seeds (EGS) program, acting through Development Alternatives, Inc.’s
(DAI) Africa Lead II project, has utilized USAID Mission, BFS, and Bill & Melinda Gates
Foundation (BMGF) partnerships to make significant seed system changes to break the
bottlenecks on breeder and basic seed, primarily in Africa. Many projects fail to reach the great
majority of smallholder farmers in Sub-Saharan Africa, particularly in the delivery of EGS. Other
bottlenecks include poorly functioning national variety release systems; policies, regulations,
and misplaced subsidies that limit access to improved varieties; and counterfeit seeds in seed
markets.
The overall EGS effort, which began in 2014 and will continue through 2017, is carried out in a
complex, dynamic environment involving the USAID and BMGF partnership, several
international and bilateral donors, as many as 12 African governments, several African regional
organizations, and a plethora of public and private stakeholders. Over the past two years, the
USAID and BMGF partnership has explored, with a large number of noted U.S., African, and
international technical experts, how to address constraints in EGS systems. This exploration led
to the partnership’s development of a methodology to analyze seed value chains, and to do this
by specific market, crop, and economic dimensions. Applying this methodology leads to
identifying actors and actions along the seed value chain that are required in order to produce
an adequate supply of EGS on a sustainable basis. The methodology was vetted by technical
experts from African regional organizations, research and technical agencies, and development
partners.
USAID asked DAI through its Africa Lead Cooperative Agreement II to take this analytical
methodology to the country level in selected Feed the Future countries, particularly in ways to
change seed systems as they affect smallholders in the informal agriculture sectors. Africa Lead
II selected and contracted with Context Network to execute EGS studies in Rwanda, Zambia,
Kenya, and Nigeria, which were completed in August 2016, as well as a one-day EGS technical
training in Addis Ababa, Ethiopia, on how to implement the study methodology, with researchers
from 11 countries.
In addition to the four EGS country studies, the Context Network, with Africa Lead’s guidance,
was selected to complete three other deliverables which include (1) a synthesis of the Rwanda,
Zambia, Kenya, and Nigeria studies, (2) a technical review of 11 EGS studies performed by in-
country consultants in 2016, and (3) a generic investment plan guidance document to aid
country seed platforms, composed of inclusive sets of stakeholders, with some of the tools to
transform the findings of the EGS studies into investment plans.
This EGS Investment Plan Guide is intended to assist in-country stakeholders who are working
to include appropriate public-sector funding for EGS in their country’s National Agricultural and
Food Security Investment Plan (NAFSIP). It provides approaches, resources, tools, useful
advocacy approaches, and sample investment plan components for EGS funding under their
country’s NAFSIP. Whether that government funding is intended to support breeder seed
development by that National Agricultural Research Institute (NARI), PPPs for the production of

EARLY GENERATION SEED INVESTMENT PLAN GUIDE vii
foundation seed, or donor support for these and other functions, getting EGS investments into
the country NAFSIP is the first step toward identifying a sustainable resource stream for those
public sector functions required for a better functioning EGS system.

EARLY GENERATION SEED INVESTMENT PLAN GUIDE viii
ACKNOWLEDGMENTS This report was developed by a team at the Context Network led by Mark Nelson, a principal at
the Context Network. The team included Mark Walton who conducted the stakeholder
consultations and led the field research work for the Rwanda EGS Study and Dave Westphal
who had the same responsibilities for the Zambia EGS Study. Robert Lowenthal, with analytical
support from Jason Nickerson, was the Context Network manager for this EGS Investment Plan
Guide.
The team is grateful for the support of DAI including David Tardif-Douglin, Charles Johnson, and
Sonja Lichtenstein, as well as guidance from BFS Senior Food Policy Advisors, David Atwood
and Mark Huisenga.

EARLY GENERATION SEED INVESTMENT PLAN GUIDE ix
ACRONYMS
AU African Union
BFS Bureau for Food Security (USAID)
BMGF Bill & Melinda Gates Foundation
CAADP Comprehensive African Agricultural Development Program
CGIAR Consultative Group for International Agricultural Research
CIMMYT International Maize and Wheat Improvement Center
DAI Development Alternatives, Inc.
EGS Early Generation Seed
FAO Food and Agriculture Organization of the United Nations
FTF Feed the Future
IFAD International Fund for Agricultural Development
IFPRI International Food Policy Research Institute
ISSD Integrated Seed System Development
M&E Measurement and Evaluation
NAFSIP National Agricultural and Food Security Investment Plan
NAIP National Agriculture Investment Plan
NARI National Agricultural Research Institute
NEPAD New Partnership for Africa’s Development
NGO Non-Governmental Organization
PPP Public-Private Partnership
QDS Quality Declared Seed
SROI Social Return on Investment
SSA Seed System Analysis
WEAI Women’s Empowerment in Agriculture Index
USAID United States Agency for International Development

EARLY GENERATION SEED INVESTMENT PLAN GUIDE x
TERMINOLOGY Breeder seed: Breeder seed is produced by or under the direction of the plant breeder who
selected the variety. During breeder seed production, the breeder or an official representative of
the breeder selects individual plants to harvest, based on the phenotype of the plants. Breeder
seed is produced under the highest level of genetic control to ensure the seed is genetically
pure and accurately represents the variety characteristics identified by the breeder during
variety selection.
Pre-basic seed: Pre-basic seed is a step of seed multiplication between breeder and basic
seed that is used to produce sufficient quantities of seed for basic seed production. It is the
responsibility of the breeder to produce pre-basic seed, and production should occur under very
high levels of genetic control.
Basic seed: Basic seed, also known as foundation seed, is the descendent of breeder or pre-
basic seed and is produced under conditions that ensure maintaining genetic purity and identity.
When basic seed is produced by an individual or organization other than the plant breeder,
there must be a detailed and accurate description of the variety the basic seed producer can
use as a guide for eliminating impurities (“off types”) during production.
Certified seed: Certified seed is the descendent of breeder, pre-basic, or basic seed produced
under conditions that ensure maintaining genetic purity and identity of the variety and that meet
certain minimum standards for purity defined by law and certified by the designated seed
certification agency.
Quality Declared Seed: In 1993 the Food and Agriculture Organization of the United Nations
(FAO) produced and published specific crop guidelines as Plant Production and Protection
Paper No. 117 Quality Declared Seed – Technical guidelines on standards and procedures. The
Quality Declared Seed (QDS) system is a seed-producer implemented system for the
production of seed that meets at least a minimum standard of quality but does not entail a
formal inspection by the official seed certification system. The intent behind the QDS system is
to provide farmers with an assurance of seed quality while reducing the burden on government
agencies responsible for seed certification. The QDS system is considered by FAO to be part of
the informal seed system.
Quality seed: In this report, the phrase quality seed is at times used in place of certified seed or
QDS to describe a quality-assured seed source without specifying certified or QDS.
Commercial seed: Any class of seed acquired through purchase and used to plant farmers’
fields.
Formal seed system: The formal seed system is a deliberately constructed system that
involves a chain of activities leading to genetically improved products: certified seed of verified
varieties. The chain starts with a plant breeding or variety development program that includes a
formal release and maintenance system. Guiding principles in the formal system are to maintain
varietal identity and purity and to produce seed of optimal physical, physiological, and sanitary
quality. Certified seed marketing and distribution take place through a limited number of officially

EARLY GENERATION SEED INVESTMENT PLAN GUIDE xi
recognized seed outlets, usually for cash sale. The central premise of the formal system is that
there is a clear distinction between "seed" and "grain." This distinction is less clear in the
informal system.
Informal seed system: The informal system, also referred to as a local seed system, is based
on farmer-saved seed or QDS. Varieties in the informal system may be variants of improved
varieties originally sourced from the formal system, or they may be landrace varieties developed
over time through farmer selection. There is less emphasis on variety identity, genetic purity, or
quality seed. The same general steps or processes take place in the informal system as in the
formal system (variety choice, variety testing, introduction, seed multiplication, selection,
dissemination, and storage), but they take place as integral parts of farmers' production systems
rather than as discrete activities. While some farmers treat "seed" as special, there is not always
a distinction between "seed" and "grain." The steps do not flow in a linear sequence and are not
always monitored or controlled by government policies and regulations. Rather, they are guided
by local technical knowledge and standards and by local social structures and norms.
Improved versus landrace and local varieties: Improved varieties are the product of formal
breeding programs that have gone through testing and a formal release process. A landrace is a
local variety of a domesticated plant species which has developed over time largely through
adaptation to the natural and cultural environment in which it is found. It differs from an
improved variety which has been selectively bred to conform to a particular standard of
characteristics.

EARLY GENERATION SEED INVESTMENT PLAN GUIDE 1
INTRODUCTION PURPOSE OF THE EGS INVESTMENT PLAN GUIDE
This EGS Investment Plan Guide document was developed as a resource to provide practical
assistance to in-country stakeholders who want to present a case, and provide specific
language and budget proposals, for greater government funding of those EGS functions that are
likely to be funded only by the public sector. In Africa, the vehicle to make that case and seek
that funding at the country level is through the five-year Comprehensive African Agricultural
Development Program/African Union (CAADP/AU) sanctioned NAFSIP, as well as a new
instrument under development, the CAAPD country spending plan. The purpose of this guide is
to assist stakeholders make a case for, and provide specific documentation and elements for
inclusion in, a NAFSIP line item or component to support appropriate public-sector EGS
functions.
Each country and seed system is unique. As a result, the information and tool provided in this
guide will have to be adapted to the specific country situation.
METHODOLOGY
Investment plans must take the criteria upon which they are evaluated into consideration. Since
EGS investment proposals will nestle within sector-wide investment plans, the criteria used to
evaluate the relevance and coherence of NAFSIPs can also be used to evaluate EGS seed
interventions.
The EGS Investment Plan Guide subscribes to this methodology, and each of the five chapters
link to an evaluation criteria used by the New Partnership for Africa’s Development (NEPAD)1 to
evaluate NAFSIPs (Figure 1). The rationale for this is twofold: (1) Stakeholder overlap: The
stakeholders, actors, and beneficiaries of the EGS seed investment plan and the national
agriculture investment plan are largely the same. (2) Easier integration: The EGS investment
plan is intended to fit within the National Agriculture Investment Plan (NAIP). By designing EGS
investments that are sensitive to the same evaluation criteria as NAIPs, future integration is
made easier.
1 The technical agency of the African Union.
EARLY GENERATION SEED INVESTMENT PLAN GUIDE 2
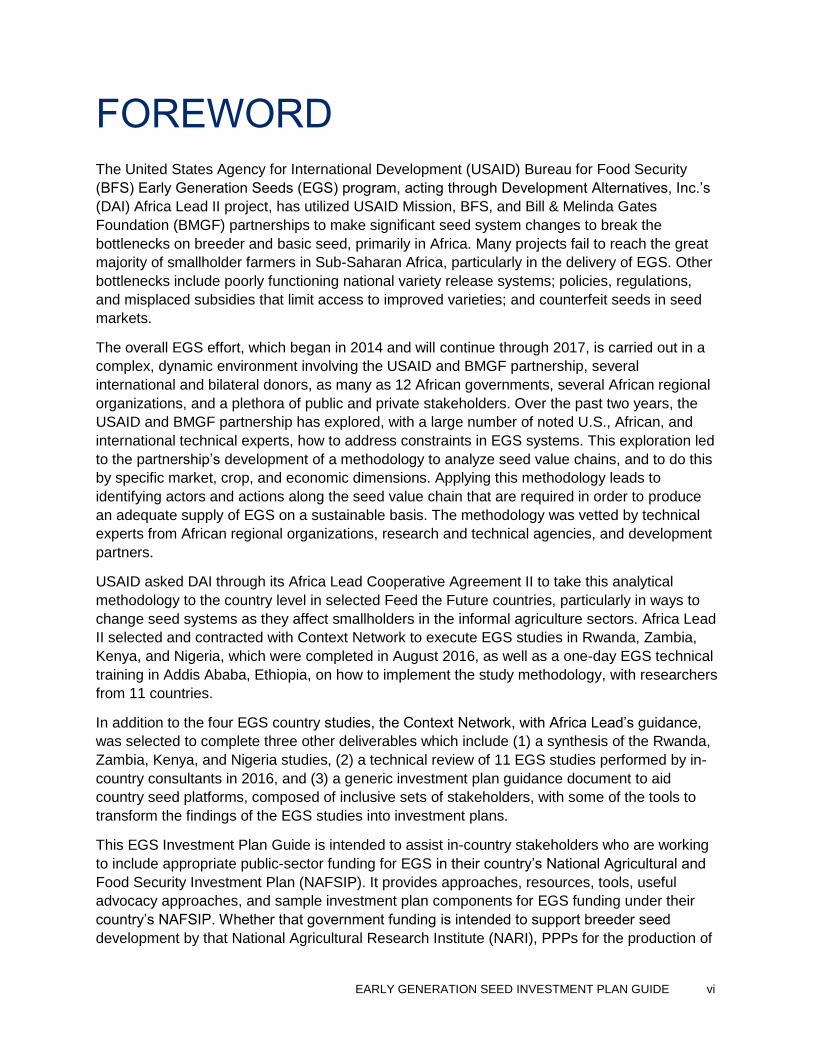
Figure 1: EGS Investment Plan Guide chapters mapped to NAIP evaluation criteria.
Source: Adapted from NEPAD technical review criteria, contained in Chapter 3 of the CAADP Post-Compact Review Guidelines (2010).
Each chapter addresses a content area for inclusion in a seed system investment plan. Within
each chapter are example analyses and links to supporting resources.
Chapter 1: Providing Seed Sector Context – offers guidance on how to describe the seed
sector, including how to communicate seed system analyses, describe obstacles, and analyze
stakeholders.
Chapter 2: Making the Investment Case – provides direction on analyzing an intervention’s
impact, and developing a results framework, including the selection of development indicators
and realistic outcomes.
Chapter 3: Describing the Intervention – provides guidance on how to summarize the elements
of the intervention, including key activities, stakeholder involvement, measurement and
evaluation (M&E), and seed system-specific risk factors.
Chapter 4: Structuring the Intervention – outlines the program architecture, including its
governance, funding sources, and relationships to both the public and private sectors.
Chapter 5: Advocating for Seed Systems – discusses the current position of seed systems
within NAIPs and approaches to increasing public-sector support and private-sector investment.
Likelihood of investment program to realize growth and poverty reduction prospectsChapter 1
Providing Seed
Sector Context
Chapter 3
Describing the
Intervention
Technical realism and adequacy of institutional arrangements of the programs
Chapter 2
Making the
Investment Case
Chapter 4
Structuring the
Intervention
Chapter 5
Advocating for
Seed Systems
Adequacy of institutional arrangements for effective and efficient delivery
Appropriateness and feasibility of the indicators for impact and system
Consistency between policies, implementation arrangements and delivery mechanisms and investments areas, priorities or program objectives
Potential to contribute and link to regional integration objectives
Consistency with budgetary and development assistance commitments and principles agreed in the compact
Integration of CAADP principles of inclusive review and dialogue
Use of best practices and other technical guidance in the pillar framework documents in designing the investment programs
Extent and quality of dialogue, (peer) review and mutual accountability system
Primary NAIP Evaluation Criteria

EARLY GENERATION SEED INVESTMENT PLAN GUIDE 3
CHAPTER 1: PROVIDING SEED SECTOR CONTEXT The first section of an investment plan provides contextual background on the seed system
intervention and lays a foundation for the investment case that will follow. This section should
clearly articulate the problem within the current seed system(s), provide crop and seed system-
level assessments, describe the obstacles impeding development, and identify key
stakeholders.
1.1 PROBLEM STATEMENT
The problem statement is a concise summation of the socio-economic issue the EGS
intervention is intended to address. It should be brief, direct, and specific, distilling where the
problem is occurring along the seed system value chain, its magnitude, and how the problem
has evolved over time. In developing a problem statement, the following questions should be
considered:
What is the problem to be addressed?
Why is it important to address the problem?
How does the crop’s seed system contribute to the problem?
1.2 CROP-LEVEL ANALYSIS
SUPPLY
Supply-side analysis should include historical data on yields, area under cultivation, and overall
production volumes. Inter-country yield comparisons provide valuable points of reference to
understand productivity. Figure 2 provides an example of how historical production trends and
multiple country yield comparisons can be visualized.

EARLY GENERATION SEED INVESTMENT PLAN GUIDE 4
Figure 2: Sample production and yield analysis.
Source: Kenya EGS Country Study (2016) sourced from Kenya Country Stat, 2013 (data extracted in March 2016).
Production analysis can be taken a step further by examining regional contributions within the
target country. Certain regions contribute more to production totals than others, and the factors
behind that variability can be explored through narrative and supporting diagrams. For example,
Figure 3 maps soybean production volumes across regions within Nigeria.
0.0
0.2
0.4
0.6
0.8
1.0
1.2
1.4
1.6
1.8
2.0
0
500
1,000
1,500
2,000
2,500
3,000
3,500
4,000
2003 2004 2005 2006 2007 2008 2009 2010 2011 2012 2013
Yie
ld (
MT
/Ha
)
Are
a H
arv
est
(‘000
Ha)
/
Pro
du
cti
on
(‘0
00
MT
Yield (MT/HA) Area Harvested (Hectares) Production Quantity (Metric Tons)
Maize Production and Yields 2003-2013, Kenya
African Maize Yields 2013
3.8 3.2
2.7 2.5 2.3 2.3 2.0 1.8 1.7 1.7
South Africa
Ethiopia Uganda Zambia Mali Rwanda Nigeria Burkina Faso
Ghana Kenya

EARLY GENERATION SEED INVESTMENT PLAN GUIDE 5
Figure 3: Sample mapping of country production sources (soybean in Nigeria).
Source: Agricultural performance survey of wet season in Nigeria, NAERLS, 2013.
DEMAND
Crop consumption trends provide an indication of the crop’s increasing or waning importance
within the country. When crop consumption growth exceeds population growth, the crop’s
importance is expanding and demand for EGS is likely to expand as well. Figure 4 highlights the
growing importance of rice in Nigerian diets and the effect on future demand.
Figure 4: Sample crop consumption trend analysis.
Source: Federal Ministry of Agriculture and Rural Development – ATA.
Enugu
FCT
Oyo
Ogun
Lagos
Osun
Kwara
Niger
Kaduna
Taraba
AdamawaPlateau
Nasarawa
Benue
192,000 MT
KogiEkiti
Ondo
Edo
Delta
Bayelsa Rivers Akwa
Ibom
Ebonyi
Enugu
ImoAbia
BornoYobe
BauchiGombe
Jigawa
Kano
Katsina
Zamfara
Sokoto
Kebbi
>100
55 - 99
30-49
10-29
<10
2013 Soybean Production ’000 MT
150
200225
300
2010 2015 2025 2035
Driver 1: Nigeria’s Population (m)
+3%
13
7
12
15
1960 1970 1980 1990 2000
Driver 2: Rice share of typical Nigerian’s diet (%)
+7%
Increase driven by
urbanization and
rising incomes
4 4 45
6
10
13
36
2003 2005 2007 2010 2015 2025 2030 2050
Nigeria’s (projected) rice demand [m MT]
+5%

EARLY GENERATION SEED INVESTMENT PLAN GUIDE 6
Identifying the sources for a crop’s demand can provide valuable insights into its role in society.
The elements of crop demand generally include categories such as on-farm consumption, rural
and urban markets, livestock feed, processing, and export. For example, the importance of a
crop like groundnut for food security within a country might be highlighted by its high rate of on-
farm consumption.
Stacked bar charts, like the one in Figure 5, can be used to show the current elements of a
crop’s demand. In many cases, a proposed seed system intervention will have an impact on the
share of demand from different sources. For instance, if an intervention focuses on increasing
processors’ involvement in varietal trait selection, it is likely that demand share will shift from on-
farm consumption to processing, and perhaps export.
Figure 5. Sample demand source summary – groundnut example.
Source: Zambia EGS Country Study (2016).
1.3 SEED SYSTEM ANALYSIS
DOMINANT SEED SYSTEMS
Farmers use a variety of seed systems to acquire their seeds, and these systems are broadly
characterized as either formal or informal. The formal seed system is distinguished by its
established, quality-assured linkages from breeder seed production to commercial seed sale.
Conversely, the informal system exists outside of regulatory purview and is usually locally
organized and farmer-led (e.g., farmer-saved and traded seed). While a crop’s seed is rarely
acquired from a single source (e.g., all from international seed companies or all farmer-saved),
there is typically a dominant source.
Local Markets
ProcessingExports
Crop Market Share(by segment)X MT Production
On-farm ~70-80%
~10%
~5%~5%
Segment Description Segment Needs
On-farm
consumption
• Estimated to be at least 80% for
on-farm consumption and farmer-
saved seed
• Confectionery, not too oily
• Less labor needs for harvesting
(digging requirements)
• Disease and drought tolerance
• Yield
Local
markets
• Local shop owners who buy
groundnut to be sold to farmers
who do not save seed, as well as
households that do not grow
groundnut
• Confectionery, not too oily
Processors • Key processors include A, B, and C
• Processors have outgrower model
that provide inputs to growers
• While no specific preferences is
communicated to growers, high O/L
ratio and oil content preferred for
peanut butter production
• Low levels of aflatoxin
Exports • Small informal exports continue as
traders buy groundnut and then
transport to Country A
• Balance of exports go to Country B
• Durable shells that don’t crack in
transport
• Low levels of aflatoxin
• Confectionery, not too oily

EARLY GENERATION SEED INVESTMENT PLAN GUIDE 7
The Seed System Analysis (SSA), which was developed by Integrated Seed System
Development (ISSD), can be used to evaluate the dominant seed systems for a crop within a
country. The SSA methodology follows a two-step process. In step one, the prevailing seed
systems are characterized based on facets such as the relevant domains of seed systems
(public, private, informal), key crops, varieties in use (landraces, local varieties, NARI-released),
and value-chain operators. In step two, stakeholders are convened for roundtable meetings to
define the country’s seed systems. Figure 6 provides an example of the form this analysis could
take.
Figure 6: Sample dominant seed system summary.
Source: USAID, Kenya EGS Country Study, prepared by The Context Network for Africa Lead (2016).
GENDER PARTICIPATION
Increasing the role of women in agriculture is important for social equity, food security, and
economic development. Further, gender-sensitive approaches to agricultural development are
emphasized by CAADP and by donors, including Feed the Future (FTF) and BMGF.
The Women’s Empowerment in Agriculture Index (WEAI) is the first-ever measure to directly
capture women’s empowerment and inclusion levels in the agricultural sector (FTF, 2015). It
tracks women’s agricultural engagement in five areas: production, resources, income,
leadership, and time use. The tool can be used to guide the development, monitoring, and
evaluation of gender-inclusive seed interventions. Links to numerous WEAI resources, including
baseline studies, manuals, and training materials are provided in section 1.6.
Farmer-SavedNGO /
CooperativesParastatal
Private
International
Companies
Private
Local
Companies
Type of
cropsLocal food and cash crops Food crops
Major food and
cash cropsPrimarily maize
Food and cash
crops
Crops
Banana
Common
bean
Cassava
Cowpea
Groundnut
Maize
Millet
Pigeon pea
Rice
Sorghum
Soybean
Sweet
Potato
Common bean
Groundnut
Pigeon pea
Maize
Banana
Cowpea
Maize
Rice
Maize
Common bean
Groundnut
Maize
Pigeon pea
Sorghum
Types of
VarietiesLocal varieties
Improved, open pollinated
varieties (OPV)
Improved maize
varieties (Hybrid
and OPV)
Improved varieties
(Hybrids for
maize)
Improved varieties
Quality
Assurance
System
Farmer-selectedCertified and farmer-
selectedCertified Certified Certified
Seed
Distribution
Farmer-saved, exchange,
barter, and local markets
Local markets, distribution
through government,
some distribution through
agro-dealers
Distribution through
government and
agro-dealers
Distribution
through agro-
dealers
Distribution
through agro-
dealers

EARLY GENERATION SEED INVESTMENT PLAN GUIDE 8
Examples of how gender production analysis can be summarized is provided in Tables 1, 2, 3,
and 4. These tables help make clear the gender gap in market-oriented crop cultivation seed
and are useful in developing seed investments that can be tailored to increase the impact on
women and children in terms of nutrition, food security, and easing their labor responsibilities.
Table 3: Gender roles in crop production in Kenya.
Source: Context expert analysis, Katungi (2010).
North South East West Kigali
Food
Sec
urity
Cro
ps
Common Bean
Sweet Potato
Maize
Cassava
Mar
ket-
Ori
ente
d C
rops
Potato
Plantain
Coffee
Rwanda gender division of crop cultivation
by province Input decision
Crop production
Processing Marketing
Maize
Cassava
Groundnut
Cotton
Common
bean
Table 1: Gender roles in crop production in
Rwanda.
Source: MINAGRI (2010) sourced from World Bank (2015), World Bank (2015).
Table 2: Gender roles in crop production in
Zambia.
Source: Expert analysis based on field interviews, FTF Impact
Evaluation of Groundnut Value Chain in Zambia (2015), Hamazakaza et al. (2014), Mofya-Mukuka et al. (2013), and Ross et al. (2012
Top crops Seed
selectionLand
preparationPlanting
Weeding/In-season
tasksHarvesting
Post-harvest
processingMarketing
Maize
Common bean
Banana
Cassava
Potato
Wheat
Tea
Kenya gender division of crop cultivation by role

EARLY GENERATION SEED INVESTMENT PLAN GUIDE 9
Table 4: Gender roles in crop production in Nigeria.
N/A=Not applicable
Source: Estimating Gender Differentials in Agricultural Production in Nigeria (2012).
STRUCTURE OF EGS VALUE CHAIN
Within any seed system, multiple steps and stakeholders are involved in getting seed into the
hands of farmers. Diagraming the production and distribution pathways of a crop’s seed with a
process flow diagram (Figure 7) helps clarify the current value chain.
Figure 7: Sample seed system process flow chart.
Source: USAID, Nigeria EGS Country Study, prepared by The Context Network for Africa Lead (2016).
Maize Rice Soybean Yam
North
Production 98% 2% 90% 10% 95% 5% N/A N/A
Processing 10% 90% 20% 80% 10% 90% N/A N/A
Marketing 85% 15% 90% 10% 90% 10% N/A N/A
South
Production 70% 30% 60% 40% 86% 14% 80% 20%
Processing 10% 90% 20% 80% N/A N/A 50% 50%
Marketing 90% 10% 60% 40% N/A N/A 80% 20%
FO
RM
AL
INFO
RM
AL
BREEDER SEED
FOUNDATION
SEED
CERTIFIED
SEED
MARKETING &
DISTRIBUTION
NARIs (IAR&T, IAR), CGIARs (IITA, ICRISAT),
Academic Institutions
Seed Units of
NARIs,
Academic
InstitutionsADPs
Academic
institutions
NGOsAgro-
dealers
Farmers
INFORMAL SYSTEM
~50% of planted area
OPV FORMAL SYSTEM
~30% of planted area
HYBRID FORMAL SYSTEM
~20% of planted area
NARIs (IAR&T, IAR,), International
Research Institutes (IITA, ICRISAT)
Local seed
companies
Farmers
Agro-dealers
Private seed companies (local and
foreign)
Rural Open
MarketsLocal Farmers
Legend of type of actor in seed system
Private Sector Public Sector NGOs/Programs
Private Seed
Companies
Foreign seed
companies

EARLY GENERATION SEED INVESTMENT PLAN GUIDE 10
ADOPTION OF IMPROVED VARIETIES
The release and adoption of improved varieties can be analyzed to provide insight into farmer
varietal preferences, breeder responsiveness to farmer preferences, seed accessibility, and
perceptions of economic utility. Varietal releases can be summarized, with points of
differentiation such as potential yield and key characteristics presented in columns. An example
of a varietal release table for common bean in Rwanda is provided in Table 5.
Table 5: Sample varietal release table.
Source: “Scaling Up Bean Seed Production in Rwanda”, Musoni, Augustine, Butare, Louis, Mukankubana, Domitille, Rwanda Agriculture Board.
Farmers’ perceived value of improved varieties is a strong indicator of increasing adoption rates.
When the increased purchase price of improved seed is not perceived as being offset by higher
yields or selling prices, demand remains stagnant. Perceived value can be assessed through
farmer interviews and surveys. Figure 8 provides an example of the perceived cost of
production analysis.
Pedigree
Code
Maturity
day
Potential
YieldMT/Ha
Size Color Key Characteristics
Clim
bin
g
RWV 3006 110 3.8 Large White Bio-fortified, export market
RWV 2872 108 4.2 Large Sugar Regional market, income
RWV 3316 115 4.0 Large Red Bio-fortified, nutrition
Gasirida 100 5.0 Large Purple Popular markets, culinary traits
CAB 2 115 5.0 Medium Navy Bio-fortified, fast cooking
RWV 2070 105 5.0 Large Khaki Marketable, taste
RWV 1129 102 4.0 Large M/moja Bio-fortified, early, marketable
Gasirida 100 5.0 Large Purple Popular markets, culinary traits
MAC 9 85 3.7 Medium Calima Marketable
MAC 44 84 3.8 Medium Calima Bio-fortified, marketable
Bu
sh RWR 2245 75 2.0 Medium Calima Bio-fortified, marketable
SER 16 75 2.5 Small Red Drought tolerant
Improved Climbing and Bush Bean VarietiesSelect Examples of Recently Released Varieties

EARLY GENERATION SEED INVESTMENT PLAN GUIDE 11
Figure 8: Sample farmer cost perception analysis.
Source: USAID, Zambia EGS Report, prepared by The Context Network for Africa Lead (2016).
EGS DEMAND VARIABLES
Demand variables differ by crop and country. However, there are several commonalities within
value chains that help explain how EGS can address both farmer and private-sector needs, as
well as country-level goals. Figure 9 maps these variables starting with the potential benefits of
quality seed of improved varieties, which can include crop yield, agronomic traits, and quality
traits.
Formal MarketCost/HaCertified Seed Production Costs
Informal MarketCost/HaInformal Seed Production Costs
Informal MarketCost/HaSaved Seed Production Costs
Seed Cost (Basic) $300 Purchase Open Market $150 Recycled Seed $0
Fertilizer $250 Fertilizer $190 Fertilizer $130
Pesticide $88 Pesticide $48 Pesticide $25
Planting & harvesting $664 Planting & harvesting $510 Planting & harvesting $210
Labor general $400 Labor general $308 Labor general $208
Transportation $20 Transportation $20 Transportation $0
Inspection/lab/
germination fees $45
Inspection/lab/
germination fee $10 No Inspection $0
Other variables $500 Other variables $415 Other variables $175
Total Variable Cost $2,267 $1,651 $748
Estimated Yield Kg/Ha
1,500 1,350 1,270
Estimated Cost USD/Kg $1.51 $1.22 $0.58
Formal vs. Informal Market on Variable Cost Basis Example: Groundnut Variety
Perceived Cost Difference = ~3x
EARLY GENERATION SEED INVESTMENT PLAN GUIDE 12
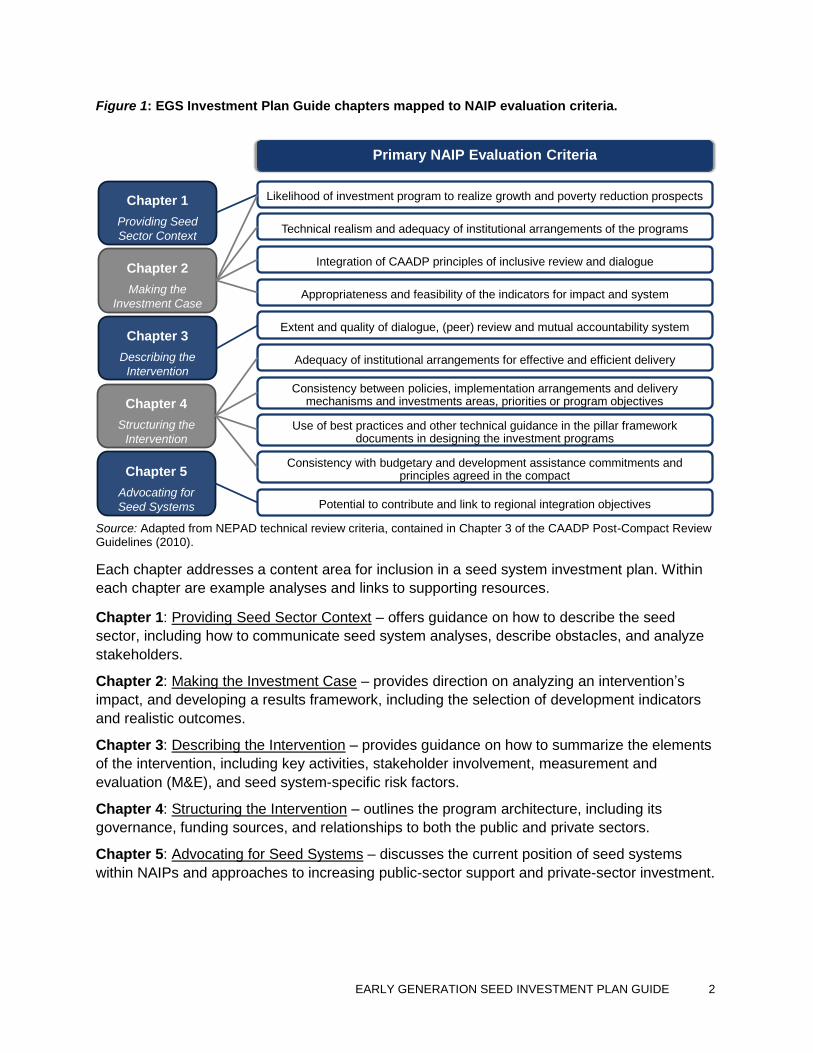
Figure 9: Map of demand variables.
Source: USAID, EGS Studies Synthesis Report, prepared by The Context Network for Africa Lead (2016).
CROP YIELD
There are many factors that influence farmer yield, including quantity, timing, and quality of
inputs, which include high-quality improved seed, fertilizer, and crop protection, as well as the
best agronomic practices associated in crop production. While these factors are interrelated and
must be combined to maximize yield, quality seed of improved varieties can increase yield in
two key ways. The first benefit stems from the greater yield potential of improved varieties, due
to advances in breeding, compared to older improved varieties or landraces.
The other yield benefit is derived from the quality of commercial seed produced within an EGS
system. A well-functioning EGS system has quality assurance protocols in place that ensure the
seed that is produced has high levels of genetic purity and germination rates that safeguard the
yield potential of improved varieties. In certain crops, saving seed leads to yield degeneration
caused by disease pressure, poor production practices, or cross pollination. While it’s difficult to
quantify exactly how significant yield degeneration is from saving seed, some crops are more
vulnerable than others. In the case of saving hybrid seed, yield decline is the most significant
due to the inherent requirement that male and female lines must be grown in isolation.
Increasing crop yields has the potential to benefit farmers in two important ways: increased
profitability and improved food security. Profitability increases could be achieved by a farmer
growing more on the same area (assuming the associated cost increases don’t offset the
increased revenue). Additionally, a farmer could grow the same volume but use less land due to
increased yield, allowing the farmer to grow a more profitable crop with the rest of his or her
land. The other possible benefit of increased yield is for farmers to become more food secure.
Quality Seed
of Improved
Varieties
Crop yield Farmer motivations
Increased on-farm
consumption
Quality traits
Biotic (e.g., disease
resistance, pest
resistance, storability)
Nutrition (e.g., bio-
fortified varieties)
Local and regional
market preferences
(e.g., bean color, taste,
tuber size)
Processors’ quality
requirements to
increase output and
lower processing costs
Yield potential of
improved varieties
Yield performance of
quality seed (high
genetic purity and
germination rates)
Abiotic (e.g., drought
tolerance, nitrogen use
efficiency)
Government
sustainability goals
Quality processing
characteristics (e.g.
starch content, oil
content)
Government food
security goals
Increased farm
profitability from
production increase
Increased farm
profitability from crop
diversification to
higher value crops
Agronomic
traits
Government nutrition
goals
Traders’ requirements
to increase market
access

EARLY GENERATION SEED INVESTMENT PLAN GUIDE 13
TRAITS
Beyond yield, demand for EGS may also be influenced by breeding for specific traits for
improved varieties. There are many types of traits specific to the agronomic challenges a farmer
faces as well as the opportunities to address specific quality traits demanded by farmers,
processors, and consumers.
Agronomic traits: They appear in the form of biotic traits such as disease and pest
resistance or suitability for longer term storage. Abiotic traits could include improved
tolerance to drought or improving nitrogen use efficiency. While these traits don’t
increase the yield potential of an improved variety, they can protect yield from agronomic
stresses and allow lower input costs (e.g., nitrogen use efficiency). Additionally, some of
these traits could be aligned with government and sustainability goals. For example, if a
government aims to reduce crop protection, a variety with disease or pest resistance
could reduce the reliance on fungicides or insecticides.
Quality traits: Improved varieties can also have quality traits for nutrition (e.g., bio-
fortified varieties) which could help realize government-quantified nutrition goals and
also improve the well-being of families. Quality traits can also serve processors’ needs
(e.g., cassava varieties with high starch content). In Nigeria, for example, starch
processors demand cassava with high starch content because it improves the efficiency
of, and lowers the cost of, their processing operations. In some cases, processors will
pay farmers higher prices for cassava that reaches their required starch levels. There
are also quality traits that meet local or regional market preferences, such as specific
colors and taste preferences of common beans or the tuber sizes of potato.
SUPPLY AND DEMAND POTENTIAL
An important step in supporting the proposed intervention is quantifying the supply-demand
imbalance. For food and cash crops in developing market seed systems, EGS demand
commonly outstrips supply. Therefore, what matters is the magnitude of the supply-demand
imbalance. For example, while two crops might both be assessed as having “high” demand, the
current EGS supply situations could be markedly different. One crop might have enough supply
to satisfy 80% of potential EGS demand, while the other’s supply may only satisfy 5% of
potential demand. In the absence of credible EGS supply and demand data, informed
assumptions (based on research and stakeholder interviews) can be used to develop demand
forecasts. Key inputs to forecast EGS demand include seed replacement rates and the
percentage of the market that adopts improved seed. An example of EGS demand forecasting
is provided in Figure 10.

EARLY GENERATION SEED INVESTMENT PLAN GUIDE 14
Figure 10: Sample EGS demand forecast.
Source: USAID, Zambia EGS Report, prepared by The Context Network for Africa Lead (2016).
Demand forecasting is subject to variability because of the assumptions made in its calculation.
Figure 10 illustrates how sensitivity analysis can be incorporated to show the impact of
independent variables (e.g., the frequency at which farmers repurchase seed, and the
percentage of farmers who adopt improved seed at all) on demand (the dependent variable).
SEED SYSTEM MARKET MATURITY
In the 1990s, both the International Food Policy Research Institute (IFPRI) and the International
Maize and Wheat Improvement Center (CIMMYT) developed similar frameworks to classify the
maturity levels of seed systems (Morris, 1998 and IFPRI, 1991). Both of these frameworks
classified seed systems into four maturity levels which include (1) Pre-industrial, (2) Emergence,
(3) Expansion, and (4) Maturity. Both of these models were based on a linear approach along a
fixed pathway of seed sector development, which is limiting as it doesn’t take into account the
diversity of crops and seed systems even within one country (Louwaars, de Boef, Edeme).
However, these approaches are useful for crops such as hybrid maize in which a formal system
is required. Recent work by ISSD has focused on a more pluralistic, crop-specific approach to
seed sector development.
A general assessment of the maturity of the seed system(s) should be made, which involves
comparing particular aspects of the current seed system with those same aspects in an ideal
future state. Points of differentiation that can be used to perform such a seed system maturity
assessment include:
Bre
ed
er
Seed
(Pre
-Basic
)
0.0
1.0
2.0
3.0
4.0
5.0
Current Supply Base Case Best Demand
0
20
40
60
80
100
Current Supply Base Case Best Demand
0
300
600
900
1,200
1,500
Current Supply Base Case Best Demand
Non-adoption %
70% 75% 80% 85% 90%
Re
pla
ce
me
nt
Ye
ars
2 8.3 6.9 5.5 4.2 2.8
4 4.2 3.5 2.8 2.1 1.4
5 3.3 2.8 2.2 1.7 1.1
7 2.4 2.0 1.6 1.2 0.8
Non-adoption %
70% 75% 80% 85% 90%
Re
pla
cem
en
t
Ye
ars
2 156 130 104 78 52
4 78 65 52 39 26
5 62 52 42 31 21
7 45 37 30 22 15
Non-adoption %
70% 75% 80% 85% 90%
Re
pla
ce
me
nt
Ye
ars
2 2,921 2,434 1,947 1,460 974
4 1,460 1,217 974 730 487
5 1,168 974 779 584 389
7 835 695 556 417 278
Sensitivity AnalysisDemand Est. (MT)F
ou
nd
ati
on
Seed
(Basic
)
Co
mm
erc
ial S
eed
(Cert
ifie
d/Q
DS
)
EARLY GENERATION SEED INVESTMENT PLAN GUIDE 15
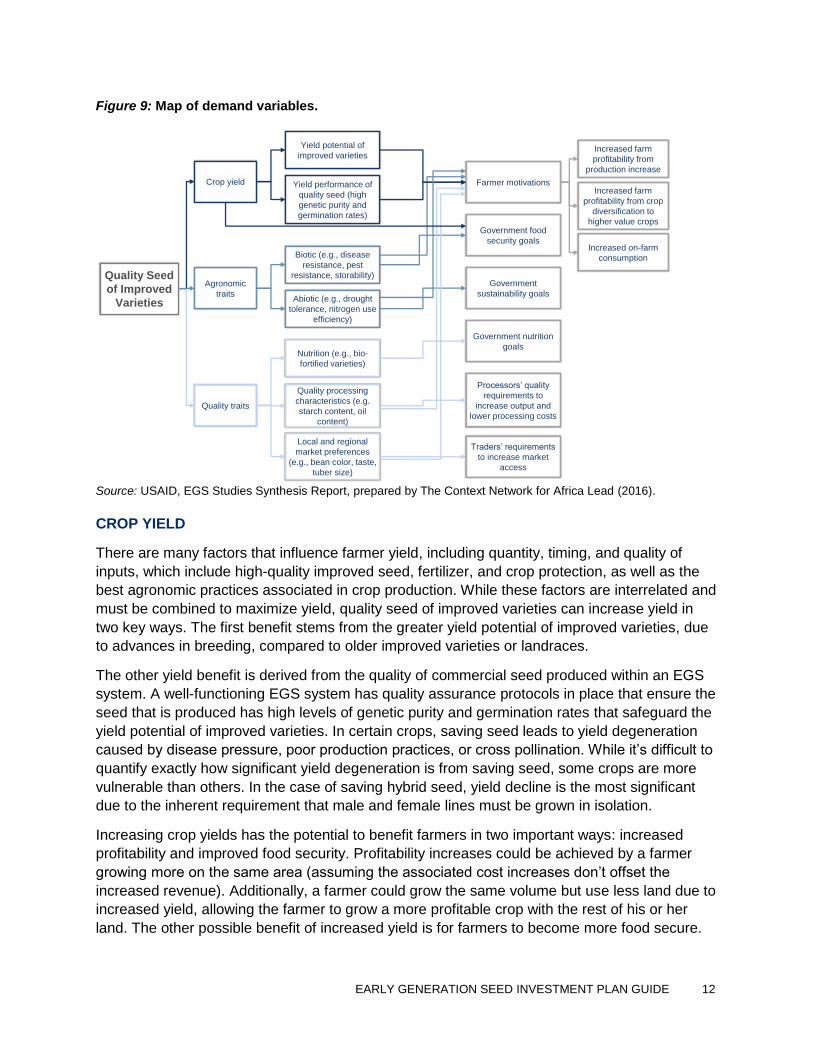
Private-sector involvement in seed production, certification, and processing
Governmental participation across the three production stages (breeder, basic, and
commercial)
Share of formal versus informal seed systems
The rate at which farmers adopt high-quality seeds
The rate of new varietal development by national research institutions
Scope and efficacy of seed quality-assurance systems
COST OF PRODUCTION
The cost of EGS production greatly impacts the system’s ability to scale up, and understanding
it is critical to developing a realistic and achievable plan for increasing EGS supply. To calculate
cost of production in the absence of reliable data, estimates from seed system experts, seed
producers, and farmers can be used. A sample table estimating the fixed costs, variable costs,
and profit margin for each stage of EGS production is provided in Figure 11.
Figure 11: Sample cost of EGS production analysis.
Source: USAID, Rwanda EGS Report, prepared by The Context Network for Africa Lead (2016).
OPPORTUNITIES TO IMPROVE MARGINAL ECONOMIC VALUE
Identifying the variables of marginal economic value is an important first step in understanding
how to improve a crop’s profitability. Figure 12 provides an example of the analysis of how
sources of marginal economic value can be evaluated across crops.
Pre-Basic/
Breeder SeedAssumptions Basic Seed Assumptions
Commercial/
Quality SeedAssumptions
Demand
MT0.4 10 249
Variable
Cost
$ per Ha
$1,310
Seed cost and
fertilizer
applications are
both approximately
17% of total
variable costs
$1,178
Breeder seed
represents
approximately 15%
of total variable
costs
$814
Planting/harvesting
and fertilizer costs
are each ~25% of
total variable costs
Fixed
Cost
$ per Ha
$8,972Breeder salaries
~$7,600$959
Breeder salaries
~$425$493
No breeder salary
allocation; labor in
variable costs
Total
Costs$10,282 $2,137 $1,384
Margin $1,02810% base
assumption$214
10% base
assumption$138
10% base
assumption
Cost +
Margin
$ per Ha
$11,310 $2,351 $1,522
Cost +
Margin
$ per Kg
$7.54 1,500 Kg/Ha yield $1.57 1,500 Kg/Ha yield $1.01 1,500 Kg/Ha yield

EARLY GENERATION SEED INVESTMENT PLAN GUIDE 16
Figure 12: Potential sources of economic value of improved varieties.
Source: USAID, EGS Studies Synthesis Report, prepared by The Context Network for Africa Lead (2016).
MARKET ARCHETYPE
The USAID-sponsored EGS country studies are underpinned by their use of the methodology
developed under the USAID-BMGF partnership. The framework evaluates several variables
(Figure 13) to categorize market archetypes based on two factors: 1) the marginal economic
value of the quality of improved varieties and 2) the level of demand for crops grown with quality
seed of improved varieties (Figure 14).
Figure 13: Variables that inform market archetype selection.
Source: Based on variables developed by the USAID–BMGF partnership (2015).
Key Variable Description Examples
MARGINAL ECONOMIC VALUE OF IMPROVED VARIETIES
Differential performance
of improved varieties
Level with which improved varieties in the market have
differential performance versus local varieties
Yield, quality, traits such as disease and
drought tolerance
Frequency of seed
replacement
Frequency with which quality seed must be bought to
maintain performance and vigor of an improved variety
Yield degeneration, disease pressure, pipeline
of new varieties being commercialized regularly
Differentiating
characteristics
Existence of differentiating characteristics that command a
price premium for improved varieties
Price premiums for processing, nutritional
characteristics
Fragility of seedAbility of seed to withstand storage and/or transport without
significant performance lossHardiness/fragility of seed
Cost of quality seed
productionCost of producing quality seed
Multiplication rates, input costs, labor
requirements, mechanization, macro and micro
propagation technology
MARKET DEMAND FOR QUALITY SEED OF IMPROVED VARIETIES
Total demand for seedHow much seed is required to meet the planting needs of a
given cropArea
Requirement for quality
assuranceRequirement for quality assurance to realize variety benefits
Certification, Quality Declared, farm-saved
seed
Farmer demand for
specific varietiesLevel of farmer demand for specific varieties Mainly driven by agronomic performance
Market demand for
specific varietiesLevel of downstream demand for specific characteristics Color, cooking quality, processing quality
TRANSPORT-
ABILITY
SEED
PRODUCTION
YIELD
DIFFERENTIAL
YIELD
PERFORMANCE
SEED
PRODUCTION
COST
LEVEL OF
ABIOTIC/BIOTIC
PRESSURE
PRICE PREMIUM
PAID FOR
QUALITY
TRAITS
HYBIRD MAIZE
QUALITY
ASSURANCE
COSTS
LowHigh
RICE
POTATO
COMMON BEAN
SOYBEAN
GROUNDNUT
YAM
FREQUENCY OF
SEED
REPLACEMENT

EARLY GENERATION SEED INVESTMENT PLAN GUIDE 17
Figure 14: USAID – BMGF Partnership Seed System Market Archetype framework.
Source: Framework developed under the USAID–BMGF partnership (2015).
1.4 CONTRAINTS AND BOTTLENECKS TO OVERCOME
The purpose of this section is to present and discuss some of the inhibitors to EGS system
development. There are many supply bottlenecks and demand constraints that prevent the
value chain from performing in a commercial and sustainable manner. In order to effectively
address these bottlenecks and constraints, the extended crop value chain should be mapped,
including EGS production, varietal development, crop production, distribution, and end use (i.e.
processing, trade, or consumption). Figure 15 below is a high-level, cross-crop summary of the
extended value chain stages and the key actors directly and indirectly involved in each link. The
exact links, roles, and responsibilities vary by crop and country, which are defined in each
country study.
Le
ve
l o
f d
em
an
d f
or
cro
ps
gro
wn
im
pro
ve
d v
ari
eti
es
High
High Low
Low
Public-Private
Collaboration Archetype
Private Sector Dominant
Archetype
Quality seed of improved varieties that is both
attractive for private sector actors to produce and
that produces crops the market demands,
resulting in robust private sector investment with
minimal public sector involvement
Public Sector Dominant
Archetype
Niche Private Sector
ArchetypeQuality seed of improved varieties for crops with
niche market demand but which are profitable to
produce in certain quantities, which are produced
by a vertically integrated private sector with
minimal public involvement
1 2
43
Marginal economic value of
improved varieties
Quality seed of improved varieties for crops with
strong market demand but for which the cost of
production or demand risk create barriers to
private-sector investment and innovation resulting
in public sector involvement
Quality seed of improved varieties for crops that
are not highly desirable or profitable to produce,
but which are promoted by the public sector to
advance a public goal such as food security or
seed security

EARLY GENERATION SEED INVESTMENT PLAN GUIDE 18
Figure 15: Extended EGS value-chain and actors.
Source: USAID, EGS Studies Synthesis Report, prepared by The Context Network for Africa Lead (2016).
It is important to note that supply bottlenecks tend to occur at EGS production stages, while the
demand constraints occur before and after EGS production stages, and often involve regulators,
service providers, and the preferences of farmers and consumers.
1.5 STAKEHOLDER ANALYSIS
IDENTIFY STAKEHOLDERS
A seed system stakeholder is defined as an individual, group, or entity that can affect or be
affected by a change in the seed system. Collectively, they are often referred to as “actors.”
Assessing the landscape of relevant stakeholders—their roles, interests, and motivations—
Germplasm /
Varieties
Foundation/
Basic Seed
Certified
Seed/QDSDistribution
Breeder
seed
Ministry of Agriculture, Legislatures, Registration Authorities, Import/Export Authorities
Quality Assurance/Certification Authorities
CGIARs
Crop Value Chain
National Research Institutes
(NARS)
Banks, MFIs
Extension Services
Private Seed Companies
Agro-Dealers
Production
Cooperatives, Farmer Groups, Out-growers
Distribution
/Consumers
Processors
Traders,
Exporters
Donors, NGOs, Trade Groups, Associations, Media
Producers
Regulators
Service
providers /
civil
society
EGS Value Chain
Rural Informal Credit Providers
Seed Production
Units of NARs
Misaligned breeder incentives and breeding targets
to ensure varietal adaption to all key markets10
Lack of infrastructure (cold storage, drying facilities)
for breeding to accelerate varietal improvement11
Quality assurance system not fit for purpose12
Seed subsidies that are unclear and erratic which
distort demand13
Lack of clear grades and standards limits price
premiums farmers can anticipate.14
Limited access to credit for smallholder farmers to
invest in improved seed and inputs15
Insufficient number of demonstration trials to show
farmers the benefits of improved varieties16
Insufficient agronomic and business training for
farmers to support investment and best agronomic
practices
17
DE
MA
ND
CO
NS
TR
AIN
TS
Defective IP laws and lack of IP enforcement1
Complex and unclear seed import policies2
Absence of EGS market forecasting system4
Lack of infrastructure & certification personnel 3
Lack of infrastructure (storage, processing)
basic and commercial seed production for
private seed companies
6
Lack of technical and business know-how for
basic and commercial seed production7
Lack of written seed out-grower contracts and
enforcement8
Limited credit access for seed producers to fund
capital investment and working capital9
Lack of rapid multiplication technology for
breeder and basic seed production5
SU
PP
LY
BO
TT
LE
NE
CK
S
1
4
9
14
12
2
11
13
10
15
16 17
5 6 87
3

EARLY GENERATION SEED INVESTMENT PLAN GUIDE 19
provides important market perspectives. Starting with a crude map of the value chain with the
main links identified, one asks the question who are the principal actors involved in production,
processing, trade, and consumption. One can also pose highly specific questions such as, “in
which crops or which links of a specific crop’s value chain are women especially involved in or
affected by the value chain?” Stakeholder specifics will vary by crop and by country, but the
general categories of stakeholders to be evaluated are described below.
Public Sector
Public-sector stakeholders include the Ministry of Agriculture, NARIs, and departments and
agencies responsible for breeder seed production, commercial seed certification, and the
provision of agriculture extension services.
CGIAR
The Consultative Group for International Agricultural Research (CGIAR) is a global research
partnership for a food-secure future. CGIAR is the only worldwide partnership addressing
agricultural research for development, whose work contributes to the global effort to tackle
poverty, hunger, and major nutrition imbalances, and environmental degradation. Research is
carried out by the 15 centers (members of the CGIAR consortium) in close collaboration with
hundreds of partners, including national and regional research institutes, civil society
organizations, academia, development organizations, and the private sector. Since 2010, the
CGIAR consortium has been financed through the CGIAR Fund, which is administered by the
World Bank but to which 39 donors contribute money, including bilateral donors such as USAID
and private entities (i.e., BMGF) and multilateral donors such as the International Fund for
Agricultural Development (IFAD) and the European Commission.
Private Sector
Private-sector stakeholders span the length of the value-chain and include private seed
companies at the basic and commercial seed level, agro-dealers, farmer groups, processors,
traders, business associations, and financial institutions.
Donors
The donor landscape encompasses multilateral donors like the Global Agriculture and Food
Security Program, bilateral donors like USAID, and private foundations like BMGF. Donor
stakeholders will vary based on the intervention type (e.g., government-facilitated or private
sector-led) and geographic scope.
Civil Society
Civil society stakeholders include non-governmental organizations (NGOs), academic
institutions, and the media. NGOs can feature prominently in a country’s agriculture
development, often filling value-chain gaps that are economically unattractive to the private
sector. Academic institutions’ roles are often centered on providing human capital development
and agricultural innovation. Media outlets (e.g. print, rural radio, television, and film) may help to
increase awareness of agricultural program activities.
ANALYZE STAKEHOLDERS

EARLY GENERATION SEED INVESTMENT PLAN GUIDE 20
Once identified, a summary of stakeholders can be provided in a narrative (Figure 18), table,
and/or a graphical form. Key questions that can be answered to prepare the analysis,
stakeholder by stakeholder, include:
What is the stakeholder’s role in the seed sector?
What motivates the stakeholder?
What is the stakeholder’s ability to influence other actors in the value chain?
What resources does the stakeholder command?
One analysis technique is to categorize stakeholders (i.e., public, private, and civil society), and
to specify the possible contribution and motivations of each (Table 6). Contributions relate to the
stakeholder’s core competencies and command of resources, while motivations correspond to
the stakeholder’s incentives. For example, international seed companies often possess the
financial depth and technical expertise to develop and advocate for market-oriented policy
reform. Their motivation for doing so is likely the return on investment by achieving higher
revenues and/or lower cost. Within stakeholder groups, it is important to identify the
representatives of each. Stakeholder representatives could include (IFC, 2007):
Elected representatives of regional, local, and village councils
Traditional representatives, such as village headmen or tribal leaders
Leaders (chairmen, directors) of cooperatives, other community-based organizations,
NGOs, and women’s groups
Politicians and local government officials and school teachers
Smallholder farmer groups and commercial farmer associations
Agro-dealers, formal and cross border traders
Micro-finance institutions, banks, informal lending groups
NARIs, agricultural extension and education services

EARLY GENERATION SEED INVESTMENT PLAN GUIDE 21
Table 6: Seed sector stakeholder table.
Seed Sector Stakeholder Summary
Actor Possible Contribution Possible Motivation
Public Sector
Ministry of Agriculture Administrative facilitation and expedition, financial support,
concept validation Economic growth
NARIs
Private Sector
International Seed Companies
Local Seed Companies
Farmer Groups
Agro-Dealers
Trade Groups
Business Groups
Civil Society
NGOs
Media
Academic Institutions
Source: Team analysis.
To supplement the summary table, the extended EGS value chain and actors diagram (Figure
18) referenced in section 1.4 can be used to illustrate the roles, location, and interaction of seed
system actors. In such a diagram, the functional areas (e.g., regulators, producers, service
providers) should be charted along the vertical axis, and the value-addition stages (e.g., seed
production, production, and distribution) along the horizontal axis.
1.6 RESOURCES FOR PROVIDING SEED SECTOR CONTEXT
The USAID-sponsored EGS country studies, which have been conducted for 11 countries within
Sub-Saharan Africa, provide a good starting point for describing the prevailing seed intervention
context. Additional resources for reference and use in developing illustrative analyses are
provided below.
RESOURCE LINK DESCRIPTION
CAADP Country Compacts
Brief, high-level political and agricultural context, outlining priority investment areas and institutional arrangements for CAADP implementation
CAADP Country Investment Plans Investment plans and sectoral plans, replete with analysis, challenges, opportunities, priorities, and defined goals and objectives

EARLY GENERATION SEED INVESTMENT PLAN GUIDE 22
The World Bank – Open Data A repository of country-level data pertaining to agriculture and rural development.
FAOSTAT (FAO)
Agriculture-specific datasets that span land use, crop production, and nutrition, among others
Famine Early Warning System
Curated food security analysis, data, and supporting maps for 29 countries in Africa
Monitoring and Analyzing Food and Agricultural Policies (FAO)
Database of select countries classifying public expenditure by commodity and repository of reports, technical notes, policy briefs, and learning material
A Handbook for Value Chain Research (International Development Research Centre)
Detailed guide on performing value chain analysis
Stakeholder Identification and Analysis (International Finance Corporation)
Guide to the process of identifying and evaluating stakeholders
Intervention Guide for the Women’s Empowerment in Agriculture Index (USAID FTF)
Guide for adapting insights gained through WEAI’s survey into agricultural interventions.

EARLY GENERATION SEED INVESTMENT PLAN GUIDE 23
CHAPTER 2: MAKING THE INVESTMENT CASE 2.1 ANALYZING INTERVENTION IMPACT
Economic analyses of agricultural projects are undertaken to compare costs with benefits and to
determine among alternative projects which has the highest return. The costs and benefits of a
proposed project therefore must be identified (Gittinger, 1984).
Individual stakeholders interpret costs and benefits differently. For instance, the major benefit of
a maize varietal improvement program for public-sector stakeholders may be increased food
security, whereas for a private-sector stakeholder or farmer, the benefit may be increased
income. The perspective from which interventions’ costs and benefits are viewed and
interpreted is important, because these perspectives will influence individual actors’ preferences
when it comes to selecting and prioritizing investments.
For public-led interventions, value creation can be calculated as the sum of tangible and
intangible benefits, less the cost of providing the benefits. Costs are typically easier to assess
than benefits, and include outlays for goods, labor, land, and debt. Benefits can be broken down
into two categories: tangible and intangible. Tangible benefits include the marginal economic
value that results from an intervention. Intangible benefits are non-monetary, and reflect the
social impact achieved through the intervention.
EVALUATING TANGIBLE BENEFITS
Tangible benefits of agricultural projects arise either from an increased value of production or
from reduced costs (Gittinger, 1984). Tangible benefits can be evaluated based on the impact of
the intervention on each of the following areas:
Increased production: Higher unit output resulting from the quantity, timing, and quality
of inputs, including high-quality improved seed, fertilizer and crop protection, used by
farmers
Quality improvement: Increased unit sales price due to so-called “price premiums”
associated with production quality
Change in time of sale: Temporal value created from selling production at a more
optimal time, when prices are higher
Change in location of sale: Locational value created from moving crops to areas with a
higher per-unit sales price
Changes in product form (grading and processing): Increased value of the
commodity through value-addition steps, like processing
Cost reduction through mechanization: Reduced labor costs through production
automation
Reduced transport costs: Improved infrastructure and/or alternative transportation
methods resulting in lower costs

EARLY GENERATION SEED INVESTMENT PLAN GUIDE 24
Losses avoided: Costs that would have otherwise been incurred if not for the
intervention
EVALUATING INTANGIBLE BENEFITS
Agriculture investments have intangible costs and benefits too. These may include improved
nutrition and health outcomes, increased food sovereignty, and political stability. Such intangible
benefits are real and have economic value. However, they are not easily valued and must be
analyzed on a case-by-case basis, because the weighting of benefits will vary depending on
their importance to stakeholders.
In the end, every project decision will have to take intangible factors into account through a
subjective evaluation because intangible costs can be significant and because intangible
benefits can make an important contribution to many of the objectives of rural development
(Gittinger, 1985).
An approach to evaluating intangible costs and benefits is Social Return on Investment (SROI).
SROI is a means of evaluating social returns across diverse impact areas (e.g., health,
education, and agriculture) by computing social benefits into equivalent units of economic value.
Represented as an equation, SROI is:
SROI’s use as an evaluation metric in development interventions is limited, but its methodology
has value for public-sector interventions where social impact is the priority. For further reading
on SROI and its incorporation as an evaluation tool, a link is included in the resources section of
this chapter.
INTERVENTION SELECTION
Once interventions are assessed based on their incremental value, they can be charted for
comparison. An example of an approach to doing this is provided in Figure 17, which evaluates
interventions based on their importance to stakeholders and their impact on achieving national
agriculture objectives.

EARLY GENERATION SEED INVESTMENT PLAN GUIDE 25
Figure 16: Intervention value comparison.
Based on the evaluation criteria used in
Figure 16, intervention “B” would be
selected because it is the most important to
stakeholders and has the greatest impact
on NAIP objectives. Investment comparison
dimensions will vary based on country
priorities and constraints (e.g., agricultural
development budget).
2.2 DEVELOPING THE RESULTS FRAMEWORK
A results framework articulates the long-
term impact of an intervention, as well as
the medium-term outcomes that precede it.
Reference guides to aid the development of
country and/or intervention-level results
frameworks exist, and this chapter is
intended to augment those resources (listed in section 2.3) with seed system-specific guidance.
Regardless of whether a seed system intervention is to be incorporated into a NAIP as a
program or component, or implemented as an independent project, a results framework helps
define, structure, and communicate the intended results. It is also an invaluable tool for post
intervention evaluation and holding the actors accountable.
IDENTIFYING OUTCOMES
Outcomes are mid- to long-term changes that are realized through the intervention (e.g.,
increased availability of improved seed, higher crop productivity, etc.) and support the long-term
sector agenda (Figure 17). They are inherently program-specific.
Donor and public-sector support for interventions is increasingly predicated on the intervention’s
alignment with national agriculture priorities. Therefore, the linkages between the selected
intervention outcomes, country impact objectives, and the CAADP Results Framework (2015-
2025) should be made clear.
Impact on NAIP Objectives
Imp
ort
an
ce
to
Sta
ke
ho
lde
rs
A
B
E
C
D

EARLY GENERATION SEED INVESTMENT PLAN GUIDE 26
Figure 17. Sample seed system requirements overview.
Source: Adapted from FAO “Strengthening Systematic Capacities for the Formulation and Management of National Agriculture Investment Plans (NAIPs)” (2014)
There are several approaches for linking seed system intervention outcomes to country-level
agricultural impact objectives. One approach, outlined in Figure 18, is to provide a qualitative
assessment of the intervention’s effect on country-level indicators. The benefit of this approach
is that it succinctly highlights key impact areas. However, the major drawback is the lack of
quantitative rigor. This shortcoming can be addressed by quantifying the intervention’s impact
on country-level indicators. For example, instead of stating that the EGS intervention has “High”
impact on realizing an 8% increase in crop production, the numeric impact could be stated
instead (i.e., 50% of the annual crop production level goal would be addressed by the EGS
intervention).
Long-term changes in the development context (e.g. economic and social conditions of people, increased food security).
Medium/long-term changes in the development context (e.g. increased agriculture production; improved access to markets).
Tasks that need to be carried out to deliver the planned outputs (e.g. training, procurement of goods and services, distribution of inputs).
IMPACTS
OUTCOMES
ACTIVITIES
DESCRIPTION OF RESULTSRESULTS CHAIN
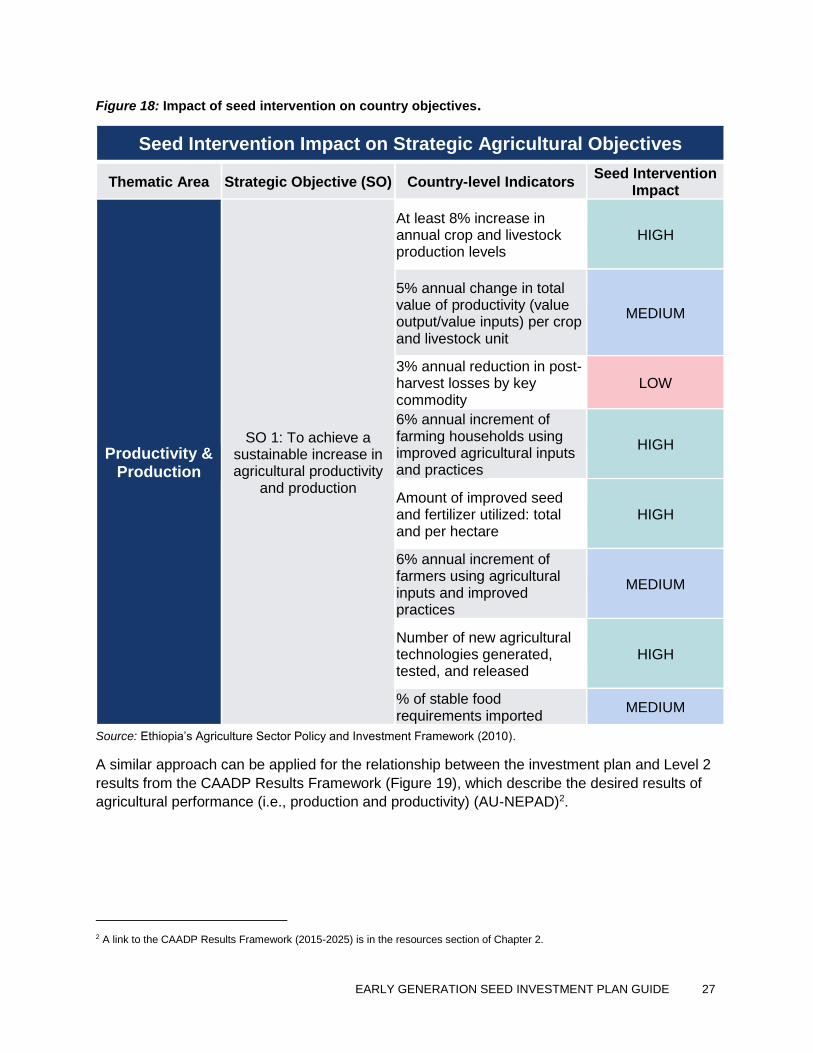
EARLY GENERATION SEED INVESTMENT PLAN GUIDE 27
Figure 18: Impact of seed intervention on country objectives.
Seed Intervention Impact on Strategic Agricultural Objectives
Thematic Area Strategic Objective (SO) Country-level Indicators Seed Intervention
Impact
Productivity & Production
SO 1: To achieve a sustainable increase in agricultural productivity
and production
At least 8% increase in annual crop and livestock production levels
HIGH
5% annual change in total value of productivity (value output/value inputs) per crop and livestock unit
MEDIUM
3% annual reduction in post-harvest losses by key commodity
LOW
6% annual increment of farming households using improved agricultural inputs and practices
HIGH
Amount of improved seed and fertilizer utilized: total and per hectare
HIGH
6% annual increment of farmers using agricultural inputs and improved practices
MEDIUM
Number of new agricultural technologies generated, tested, and released
HIGH
% of stable food requirements imported
MEDIUM
Source: Ethiopia’s Agriculture Sector Policy and Investment Framework (2010).
A similar approach can be applied for the relationship between the investment plan and Level 2
results from the CAADP Results Framework (Figure 19), which describe the desired results of
agricultural performance (i.e., production and productivity) (AU-NEPAD)2.
2 A link to the CAADP Results Framework (2015-2025) is in the resources section of Chapter 2.

EARLY GENERATION SEED INVESTMENT PLAN GUIDE 28
Figure 19: CAADP results framework level 2.
Source: Adapted from the CAADP Results Framework 2015-2025.
ASSESSING SYSTEM REQUIREMENTS
In order to evaluate the feasibility of an intervention’s outcomes, the gap between the existing
infrastructure and systems and what needs to be built or established should be assessed. EGS
systems are composed of at least three interdependent seed production stages (pre-basic,
basic, and commercial). Importantly, system requirements include not just seed volumes but
also the financial, physical, and human resources needed to produce those volumes.
For example, if the intervention outcome is defined as providing enough EGS seed for 250,000
smallholder farmers, then demand-side assumptions should determine the amount of
commercial seed needed (e.g., farmer perception of marginal value, disposable farm income,
cropping pattern and intensity, etc.). The commercial seed demand forecast will then inform
upstream seed production at the basic and pre-basic stages. A sample seed system
requirement analysis is provided in Figure 20.
CAADP Results Framework Level 2 Agricultural Transformation and Sustained Inclusive Agricultural Growth
Results Area Indicator Seed Intervention Impact
2.1. Increased agriculture
production and
productivity
2.1.1 Agriculture value added (absolute values)
Increased agriculture production and productivityHIGH
2.1.2 Agriculture production index (2004-
2006=100)
2.1.3 Agriculture value added per agricultural
worker (constant 2005 USD)
2.1.4 Agriculture value added per hectare of
arable land (constant 2005 USD)
2.1.5 Yields for the most common commodities

EARLY GENERATION SEED INVESTMENT PLAN GUIDE 29
Figure 20: Sample seed system requirements overview (yam illustrative example).
SELECTING INDICATORS
Indicators are used to evaluate progress made toward outcomes. The selection of indicators is
influenced by factors such as stakeholder priorities, the correlation of indicators with outcomes,
and the availability of reliable baseline data.
The most direct path to selecting intervention indicators is to use existing ones. Existing
indicators can be drawn from NAIPs, the CAADP Results Framework, and international
development organizations like the World Bank (Figure 21) and FTF (Figure 22). Utilizing
existing metrics has several advantages over developing a unique set, including:
Alignment of seed system interventions with country-level objectives
Ease of incorporating the intervention into broader agriculture sector development
initiatives
Effective messaging to stakeholders because the indicators have already been vetted
Availability of existing baseline data, which makes target setting less time-consuming
and more reliable
Resource Requirements
Yam Produced
300,000 ha of production
Resources to purchase
commercial seed
Commercial Seed Produced
2,600 million seed tubers produced
21,000 ha for commercial seed
production
Basic Seed Produced
1,300 million vines produced
4M mother plants1,500 screenhouses
Pre-Basic Seed Produced
3 million mother plants produced
4,000 square meters of
production space
Targets
250,000 households
10,000 seed entrepreneurs
10 private seed companies
8 research centers
Timing Requirements
Tuber available for planting in year T+1
Seed tuber production begins in
year T
Screen house vine production begins in
year T-1
Mother plant production begins
in year T-2

EARLY GENERATION SEED INVESTMENT PLAN GUIDE 30
Figure 21: World Bank agribusiness indicators for seed sector.
Source: World Bank (2010).
Figure 22: FTF early generation seed indicators.
Source: Feed the Future (2016).
IFPRI’s recently developed “NAIP Toolbox” report is an input and a contribution to the efforts by
the AU Commission and NEPAD’s Planning and Coordinating Agency to prepare a Technical
Guide and Road Map for appraisal and preparation of the next generation of NAIPs and their
alignment with the Malabo commitments. It is of high importance to ensure that existing NAIPs
can be effectively appraised and, where new ones are being developed, designed in ways that
are sufficiently rigorous and consistent with the CAADP goals and commitments in the Malabo
Declaration. The report is primarily developed for country teams who will conduct country-level
NAIP appraisals; the analytical tools can be used for diagnostic, planning, and monitoring, as
well as for evaluation purposes.
Agribusiness Indicators for Seed Sector
Indicator Measurement Source
Private sector production of foundation seed (%) Informed opinions and perceptions triangulated
with available data
Private sector production of certified seed (%) Published private and public sector data
Imported seed as total of certified seed (%) Published private and public sector data
Time (years) for seed testing and registration Published governmental and international
organization data
Existence and implementation of regional & national
seed laws & regulations (0-5)
Published governmental and international
organization data
Ease of private sector participation in the seed
market (0-5)
Perception based: interviewee (private sector
participant)
EGS-Focused Feed the Future Indicators
Indicator Measurement
Number of hectares under improved technologies or management
practices as a result of U.S. Government assistance
Number of farmers and others who have applied new technologies or
management practices as a result of U.S. Government assistance
Number of private enterprises, producers organizations, water users
associations, women’s groups, trade and business associations and
community-based organizations that applied new technologies or
management practices as a result of U.S. Government assistance
Value of agricultural and rural loans

EARLY GENERATION SEED INVESTMENT PLAN GUIDE 31
The report is organized into three parts. Part I proposes sets of metrics for key goals and targets
to be met, commitment to be achieved, milestones to be tracked, and actions to be covered by
the investment plans. Part II presents the list of analytical questions that will be addressed
during the NAIP appraisal process. These questions guide country and regional teams on what
to focus on, although the questions can be refined based on the country context. Part III
proposes and describes details of tools that can be used for the country profiling, status
assessment, and program design. It also describes when and under what conditions the tools
can be used and what types of data are required.
2.3 RESOURCES FOR MAKING THE INVESTMENT CASE
RESOURCE LINK DESCRIPTION
Country CAADP Implementation Guidelines under the Malabo Declaration (NEPAD)
Guidelines to support four-step process of CAADP implementation: 1) domesticating the Malabo Declaration commitments, 2) NAIP appraisal, 3) NAIP implementation, 4) mutual accountability
Economic analysis of agricultural projects (World Bank)
How to guide for conducting economic analysis of agricultural projects
Designing a Results Framework for Achieving Results: A How-To Guide (World Bank)
Guide for developing a program results framework
Designing a Multi-Stakeholder Results Framework (World Bank)
Toolkit for development planning, including practical tools for developing goals and a results framework
Community-Driven Development Decision Tools (IFAD)
Reference document for designing community-based rural development projects
Agribusiness Indicators (World Bank) Synthesis report comparing countries based on World Bank established agribusiness indicators
CAADP Results Framework (2015-2025) Overview of the 2015-2025 CAADP Results Framework
Social Return on Investment: A Practical Guide for the Development Cooperation Sector (Context, International Cooperation)
A guide to understanding and implementing SROI
Household seed security concepts and indicators (FAO)
Reference document and guide for evaluating household seed security
A Guide to Assessing Seed System Security (CIAT)
Guide for evaluating seed systems in a post-disaster environment

EARLY GENERATION SEED INVESTMENT PLAN GUIDE 32
Maximizing the Nutritional Impact of Food Security and Livelihoods Interventions (Actions Against Hunger)
Guide for incorporating nutrition into agricultural interventions
Seed Marketing (FAO) Guide to seed marketing, including a chapter (4) on forecasting seed demand
Feed the Future Handbook of Indicator Definitions (USAID FTF)
Detailed summary of the FTF indicators
Feed the Future Indicators (USAID FTF) Excel table with a summary of FTF indicators
Feed the Future Results Framework (USAID FTF)
The FTF 2013 results framework overview
Technical Note on Developing a Results Framework (USAID FTF)
Technical note that describes the concepts underlying the Results Frameworks for Country Development Cooperation Strategies
Feed the Future Learning Agenda (USAID FTF)
The FTF 2013 learning agenda overview
Selecting Performance Indicators (USAID FTF) Guide for the selection of indicators
Feed the Future Agricultural Indicators Guide (USAID FTF)
Guidance on the collection and use of data for selected FTF agricultural indicators

EARLY GENERATION SEED INVESTMENT PLAN GUIDE 33
CHAPTER 3: DESCRIBING THE INTERVENTION 3.1 INTERVENTION DIAGRAM
Intervention diagrams can be used to supplement narrative, clarify programmatic aims, and
guide the description of the intervention. Three intervention illustrations are provided below for
reference. Figure 23 is an intervention diagram for a program intended to improve the
productivity of EGS production through processor linkages.
Figure 23: Sample intervention diagram.
A second example in Figure 24 diagrams an intervention’s role in developing a local Quality
Declared Seed system.
Lab Nursery Fields
EGS Production Operations & Management
Processor
THEORY OF CHANGE
Smallholders
SHF SHF
SHFSHF
Commercial Farms

EARLY GENERATION SEED INVESTMENT PLAN GUIDE 34
Figure 24: Localized seed production diagram.
Source: USAID, Zambia EGS Study, prepared by The Context Network for Africa Lead (2016).
Lastly, an intervention diagram based on the Tubura model in Rwanda shows the organization’s
role in connecting farmers with inputs, training, and credit (Figure 25).
Figure 25: Tubura intervention diagram.
Source: USAID, Rwanda EGS Study, prepared by The Context Network for Africa Lead (2016).
3.2 INTERVENTION ACTIVITIES
SEQUENCING ACTIVITIES
Tubura
Farmer
Group
80-200
farmers per
group
Inputs: Seed,
Fertilizer
Demo Trials
Loans
Tubura loans money to individual farmers but holds
the group collectively responsible for repaying the
loans; if loan not paid back, group cannot obtain
financial support for one year
Participating farmers must select from
among the varieties recommended by
Tubura and must use the planting and
agronomic management practices
taught by Tubura
Improved Quality Seed versus Farmer-
saved Seed Trials: On-farm, best farming
practices, improved varieties, recognized
local, varieties/blends
Agro-
dealerInputs: Seed,
Fertilizer
Breeder
Seed
QDS
Basic
Seed
Smallholder
Farmers
QDS
Basic
Seed
Smallholder
Farmers
QDS
Basic
Seed
Smallholder
Farmers

EARLY GENERATION SEED INVESTMENT PLAN GUIDE 35
EGS production is a multiyear process. Commercial seed available for sale in a given season is
the result of pre-basic seed production that may have begun years earlier. The long timelines
required for EGS production make the sequencing of intervention activities important. Activities
can be strategically sequenced through the use of a precedence diagram model (Figure 26),
which helps identify interdependencies between activities and determine how activities can be
optimally sequenced. Three questions used to construct such a diagram are:
Which activities must be completed before this activity?
Which activities can happen at the same time as this activity?
Which activities require this activity to be completed before they can start?
Figure 26: Sample precedence diagram method.
ACTIVITY PLANNING
Once the order and timing of activities is established, they can be migrated to an
implementation plan table, like the one in Table 7, which outlines which tasks are to be done by
whom and when.
Table 7: Sample implementation plan table.
Further, a Gantt chart can supplement the implementation plan table, providing an easy-to-
understand visualization of activities and milestones. An example of a Gantt chart is provided in
Table 8 for reference.
Table 8: Example Gantt chart.
Source: Gantt chart adapted from www.tool4dev.org.
1 2 3 4 5 6 7 8 9 10 11 12 1 2 3 4 5 6 7 8 9 10 11 12
Stakeholder Coordination
Coordinate roundtable meeting Project Manager In Progress
Host roundtable meeting Agriculture Ministry Pending
Activity
Activity
Activity
Program Implementation
Activity
Activity
Activity
Activity
Activity
Activity Responsible Party Status2017 2018
A
Start Workflow
C D
B E F
Complete Workflow
Outcomes Activities Responsible Timeframe Budget Budget Source Status
1.1Harmonize variety
registration
processes with
EAC and
COMESA
procedures
Develop a summary comparison
report and distribute among key
agriculture policy stakeholders
Intervention
Working GroupApril 2017 $10,000 Donor Complete
Form policy working group and
draft legislationMinistry of
AgricultureJune 2017 $30,000 National Budget In progress

EARLY GENERATION SEED INVESTMENT PLAN GUIDE 36
3.3 STAKEHOLDERS
STAKEHOLDER BENEFITS
The perspective of stakeholders must be embedded in the program design process. In fact,
stakeholder consideration is a criteria used by NEPAD to evaluate NAIPs. A stakeholder
assessment typically begins by characterizing the projected direct and indirect benefits to each
of the seed sector stakeholders outlined in Chapter 1. Table 9 provides an example of the form
this analysis can take.
Table 9: Sample stakeholder benefit summary.
Additionally, a beneficiary assessment can be used to analyze the intervention from the
perspective of its intended beneficiaries (Salmen, 1991). It relies on learning through a non-
prescriptive combination of observation and interaction with beneficiary groups. The learning
that occurs through the process informs the planning, structuring, and operational delivery of the
intervention. Importantly, beneficiary assessments are intended to be employed before, during,
and after the seed system intervention. Links to more information on conducting beneficiary
assessments is provided in section 3.6.
STAKEHOLDER ROLES & RESPONSIBILITIES
As outlined in Chapter 1, there are many actors in a country’s seed sector platform. Describing
the roles and responsibilities of each is important for internal clarity and external
communication. A stakeholder summary table can provide a concise summary of who is doing
what to implement the intervention (Table 10).
Projected Stakeholder Benefits
StakeholderBenefit
Direct Indirect
Public Sector
Ministry of Agriculture Increased technical capacityReduced costs due to lower
staff turnover
Regional Administrations
National Research Institutions
Private Sector
Farmers
Women’s Trade Group
Agro-Dealers
Local Seed Companies
International Seed Companies
Civil Society
NGO
Print, rural radio, and TV outlets
Academic Institution
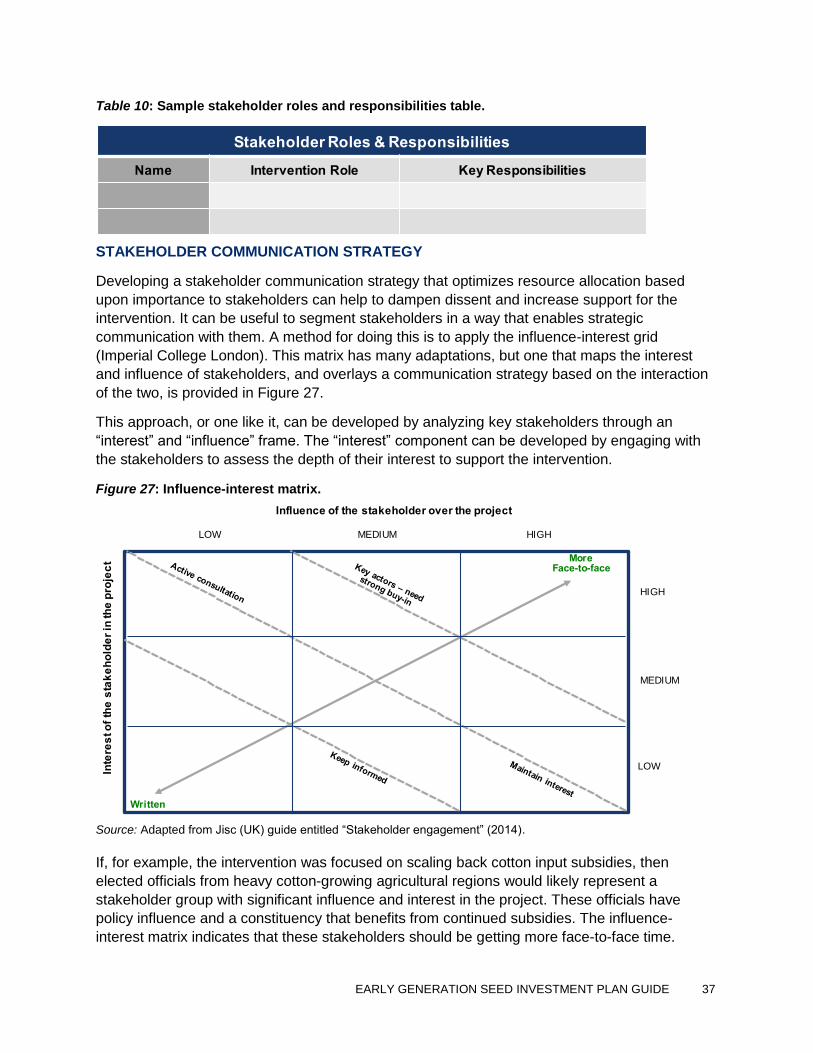
EARLY GENERATION SEED INVESTMENT PLAN GUIDE 37
Table 10: Sample stakeholder roles and responsibilities table.
STAKEHOLDER COMMUNICATION STRATEGY
Developing a stakeholder communication strategy that optimizes resource allocation based
upon importance to stakeholders can help to dampen dissent and increase support for the
intervention. It can be useful to segment stakeholders in a way that enables strategic
communication with them. A method for doing this is to apply the influence-interest grid
(Imperial College London). This matrix has many adaptations, but one that maps the interest
and influence of stakeholders, and overlays a communication strategy based on the interaction
of the two, is provided in Figure 27.
This approach, or one like it, can be developed by analyzing key stakeholders through an
“interest” and “influence” frame. The “interest” component can be developed by engaging with
the stakeholders to assess the depth of their interest to support the intervention.
Figure 27: Influence-interest matrix.
Source: Adapted from Jisc (UK) guide entitled “Stakeholder engagement” (2014).
If, for example, the intervention was focused on scaling back cotton input subsidies, then
elected officials from heavy cotton-growing agricultural regions would likely represent a
stakeholder group with significant influence and interest in the project. These officials have
policy influence and a constituency that benefits from continued subsidies. The influence-
interest matrix indicates that these stakeholders should be getting more face-to-face time.
Stakeholder Roles & Responsibilities
Name Intervention Role Key Responsibilities
LOW MEDIUM HIGH
HIGH
MEDIUM
LOW
Influence of the stakeholder over the project
Inte
res
t o
f th
e s
tak
eh
old
er
in th
e p
roje
ct
Written
MoreFace-to-face

EARLY GENERATION SEED INVESTMENT PLAN GUIDE 38
3.4 MONITORING & EVALUATION
The results framework contains the objectives and indicators used to track and evaluate
performance and is therefore the basis for the intervention’s Monitoring & Evaluation (M&E)
plan. The M&E plan goes further though, by defining the specific data collection methods, roles
and responsibilities, and the plan for disseminating information to stakeholders (Table 11). Key
questions to be addressed within the M&E plan include:
Where will the data needed to track the progress of intervention come from?
Who is accountable for the collection, evaluation, and reporting of intervention progress?
How frequently, and in what format, will intervention monitoring be conducted?
How will insights be disseminated to project stakeholders, including beneficiaries,
managers, and policy makers?
Table 11: Sample M&E summary table.
Source: Table adapted from Evaluation Toolbox article, “Developing a Monitoring & Evaluation Plan.”
A structured approach for developing an M&E system is to build off of the 12 components
identified by the World Bank as being core to a functional M&E system. The components are
segmented into three categories, (1) People, partnerships, and planning, (2) Collecting,
capturing, and verifying data, and (3) Using data for decision making. The 12 components are
listed below, and diagrammed for visualizing their interconnections follows in Figure 28. A
comprehensive resource from the World Bank entitled Making Monitoring and Evaluation
Systems Work provides guidance on using the 12 components to develop and evaluate M&E
systems. A link to this and additional M&E development resources is provided in section 3.6.
People, partnerships, and planning
1. Structure and organizational alignment for M&E systems
2. Human capacity for M&E systems
3. M&E partnerships
4. M&E plans
5. Budgeted M&E work plans
6. Advocacy, communication, and culture for M&E systems
Collecting, capturing, and verifying data
7. Routine monitoring
8. Periodic surveys
9. Databases useful to M&E systems
10. Supportive supervision and data auditing
11. Evaluation and research
Using data for decision-making
Evaluation Monitoring Evaluation
Evaluation Question
Monitoring Question
IndicatorData
SourceResponsible
PartyTimeframe
Responsible Party
ReportingFormat
Reporting Timing

EARLY GENERATION SEED INVESTMENT PLAN GUIDE 39
12. Using information to improve results
Figure 28: Twelve components of a functional M&E system.
Source: Reprinted from Making Monitoring and Evaluation Systems Work (Kusek, G, 2009).
Several practical applications for using the 12 components, as outlined within the World Bank
toolkit, include:
As an organizing framework for thinking about human capital and financial resources
required for the M&E system
As a way to establish a clear division of labor at the country level and a framework within
which all partners can work together
As the basis for evaluating and building the capacity of staff in the intervention’s M&E
unit
As a means to develop indicators to measure levels of M&E system operationalization
3.5 RISK CONSIDERATIONS
A unique set of risks accompany each seed sector intervention. These risks should be assessed
alongside broader business risks to develop an investment risk profile and mitigation strategy
(Table 12). A non-exhaustive list of potential seed sector risks is provided below.

EARLY GENERATION SEED INVESTMENT PLAN GUIDE 40
Table 12: Sample risk profile and mitigation summary.
Source: Table adapted from www.tools4dev.
SEED PRODUCTION RISKS
Working Capital
Working capital is an acute challenge for seed producers because of the long period between
cash inflows. Operational costs are incurred upfront, with the purchase and planting of basic
and/or breeder seed. Returns do not materialize until seeds are multiplied, marketed, and sold.
The time between commencing seed multiplication and selling it can be six months or longer.
This pattern puts a lot of pressure on seed companies to manage the unevenness of cash flows
throughout a production cycle. Structuring the financial aspects of interventions to
accommodate the inherent cash flow volatility of seed production helps reduce risk to seed
company stakeholders and improve the prospects for good outcomes.
Capital Expenditure
The high upfront investment cost required to establish a seed production enterprise is a
meaningful barrier to entry for prospective entrants (Kormawa P. et. al., 2000). For interventions
seeking to encourage private-sector involvement in seed production, ensuring the accessibility
of affordable credit for the purchase of land, infrastructure, and equipment is often an important
precondition. This is especially true for vegetatively propagated crops, like potato and yam,
which require significant investment in rapid propagation technologies to increase EGS supply.
Forecasting
Seed companies’ profitability is dependent upon their ability to predict and to meet demand. Due
to the long seed production cycle, demand forecasts must be made years in advance of
projected sales. Fitting production to long-term demand forecasts, as seed companies must do,
exposes them to under supply or risk of excess inventory. A lack of demand data hinders seed
producers from reaching economies of scale, without undue risk, which would in turn lower
production costs.
Product Life Cycle Management
New seed varieties cannibalize the sale of existing varieties. As a result, seed companies have
to manage the simultaneous ramp-up and ramp-down of varietal production, and the associated
# Risk Probability Severity Actions to Minimize Risk 1 Internal Risks
1.1
Unable to structure agriculture
lending product for seed
entrepreneurs with financial
institutions
Moderate HighAllocate intervention funds for reducing the risk
inherent in credit products
2 External Risks
2.1 Currency devaluation Slight Moderate

EARLY GENERATION SEED INVESTMENT PLAN GUIDE 41
resource allocation (e.g., land) and inventory management. A seed company’s effectiveness in
managing product lifecycles powerfully influences its financial sustainability.
SYSTEMIC RISKS
Intellectual Property Rights
Breeder seed producers are incentivized by, and rely upon, licensing agreements and royalty
revenue to support their operations and continuing investment. Programs that require increasing
breeder seed production should consider how existing intellectual property laws (and their
enforcement) will impact EGS production.
Counterfeiting and Fraud
Counterfeit seed reduces confidence in the EGS system because farmers who believe they
purchased “certified seed” but obtained dismal yields are reluctant to purchase it again. For
crops and countries where counterfeit seed or fraudulent packing is an issue, establishing the
credibility of the seed system through authentication measures and strict enforcement of
consumer fraud laws is key to increasing improved seed adoption.
Farmer Access to Credit
Farmers rely on retained earnings from the sale of crops and income from non-farm activities to
cover the higher cost of improved seed. The reliance on self-financing to fund farm operations is
often the only option because of the limited availability of affordable credit. Credit inaccessibility
has the effect of limiting farmers’ ability to make otherwise profitable investments in agricultural
inputs (K. Baltzer and H. Hansen, 2012). Interventions that emphasize the adoption of high-
quality seed should be combined with efforts to increase the availability of credit to smallholders.
3.6 RESOURCES FOR DESCRIBING THE INTERVENTION
RESOURCE LINK DESCRIPTION
A Guide to Assessing Needs (World Bank) Guide and tools for conducting a needs assessment
Implementation Best Practices for Value Chain Projects (USAID FTF)
A guide of five best practices for implementing value chain projects
Tracking Results in Agriculture and Rural Development in Less-than-ideal Conditions: a Sourcebook of Indicators for Monitoring and Evaluation (FAO)
Sourcebook with guidance and recommendations on indicator selection and M&E
Using M&E to Manage for Impact: A Guide for Project M&E (International Fund for Agricultural Development)
Guide to using and setting up M&E systems

EARLY GENERATION SEED INVESTMENT PLAN GUIDE 42
Making Monitoring and Evaluation Systems Work: A Capacity Development Toolkit (World Bank)
Extensive resource for structuring M&E plans, including budgeting tools and advocacy strategy
Monitoring and Evaluation Unit (Center for Development, Environment, Policy, of SOAS, University of London retrieved via FAO)
Guide to designing and implementing M&E systems
Ten Steps to a Results-Based Monitoring and Evaluation System (World Bank)
Comprehensive guide to developing an M&E system
Handbook on Monitoring and Evaluating for Results (UNDP)
Extensive four-part guide for developing and using an M&E system
Guide to the Use of Digital Financial Services in Agriculture (USAID FTF)
Tool for identifying and selecting digital financial service solutions for payment and financial services challenges
Sampling Guide for Beneficiary-Based Surveys for Select Feed the Future Agricultural Annual Monitoring Indicators (USAID FTF)
A tool to provide technical guidance on the design and use of beneficiary-based surveys to support the collection of data for agriculture-related annual monitoring indicators
M&E Guidance Series Volume I: Monitoring and Evaluation Under Feed the Future (USAID FTF)
Guide outlining the FTF M&E approach

EARLY GENERATION SEED INVESTMENT PLAN GUIDE 43
CHAPTER 4: STRUCTURING THE INTERVENTION 4.1 GOVERNANCE
Project governance defines the policies, processes, and procedures that circumscribe the
intervention. The inclusion of good governance procedures in the investment plan provides
internal clarity and assurances to citizens, government, and donors that appropriate
management controls are in place. Key questions to be addressed include:
What are the stakeholder roles and responsibilities?
How are decisions made?
What are the communication channels among stakeholders and formal reporting roles?
How are stakeholder incentives and the intervention aligned?
What rules, norms, and processes are in place to address inter-stakeholder conflict?
What reporting and communication processes are in place to ensure financial and
operational transparency to outside monitors (e.g., donors, governments, media, and
financiers)?
INTERVENTION STRUCTURE
The intervention structure can be illustrated with a project organizational chart (Figure 29). The
chart shows the formal and informal reporting structure between program implementing
stakeholders.
Figure 29: Sample project organizational chart.
Public Private Partnership or Ministry of Agriculture
Intervention Program Team
Research Institute Agri-Lenders
International Seed Companies
Regional Seed Companies
Administration
Donor

EARLY GENERATION SEED INVESTMENT PLAN GUIDE 44
POLICY IMPLICATIONS
NEPAD guidance for detailing the policy implications of NAIPs holds for seed investment plans
too. The guidance is as follows: The policy implications and outstanding policy issues implicit in
changing the thrust of agriculture sector development should be set out, as well as an
assessment of the difficulty and time required to achieve the change and which entity is
responsible for leading the change (NEPAD).
4.2 PUBLIC PRIVATE PARTNERSHIPS
The structural and demand issues identified in Chapter 1 can be addressed but only if adequate
financial and human resources are applied. It would be a daunting task for governments to
undertake all of the changes necessary to build fully functional EGS systems, even in the
absence of funding constraints. Without funding for EGS systems, governments should be
willing to consider alternatives that incentivize private-sector participation and reduce the need
for government support to the seed sector.
OVERVIEW
A Public-Private Partnership (PPP) is commonly defined as a venture that is funded and
operated through a partnership between the public-sector or government entity and one or more
private-sector companies. Accordingly, the public-sector or government actor may provide
support in a number of ways, including through fiscal policy or the contribution of infrastructure
or expert capabilities. Typically, a PPP involves the transfer of risk from the public sector to the
private sector, with the balance of risk often determined by the allocation of potential value in
the partnership. Several benefits and disadvantages exist for PPPs (IISD, 2011):
Potential Benefits
Increased efficiency, expertise, and innovation from the private sector contribute to
better infrastructure and greater cost and time savings.
Project risks are distributed between public and private sectors according to the party
best equipped to deal with it.
Access to private-sector financing may create additional investment.
PPPs provide the private sector with access to reduced risk, secure, long-term
investment opportunities that are sometimes underwritten by government contracts.
Potential Disadvantages
A PPP may prove to be more expensive in the long-term than standard procurement,
due mainly to the higher costs of private-sector borrowing when compared to
government rates.
Accountability and transparency issues may be distorted under PPP models of financing
and agreements if, for example, private-sector funding components fail to appear in
public spending records. Similarly, evaluation is made more difficult as private sector
data on profits, costs, or lessons learned may be considered proprietary information.
The inclusion of exclusivity agreements within PPP contracts can have the effect of
awarding monopoly markets to private partners.

EARLY GENERATION SEED INVESTMENT PLAN GUIDE 45
Both the public and private sectors should possess PPP-specific capacity for an
agreement to make sense and administered successfully.
STRUCTURING A PPP
IFPRI details the following four mechanisms for formalizing partnerships. The most suitable
mechanism must be determined by the stakeholder or actors on a case-by-case basis.
1. Project addendum: Certain projects funded by government and international donors specify
that the main recipient needs to provide proof of collaboration with a third-party partner. In those
cases, project addenda or letters of intent are developed that specify how the partners will
contribute to and benefit from the project in case it gets funded. Usually, no further partnership
contract is developed after the funding is received.
2. Contractual agreements: In its most basic form, a partnership is a contract that details
agreements between the stakeholders to carry on joint activities in pursuit of a common goal; to
contribute to that goal by combining property, resources, knowledge, and activities and to share
in the profits of the partnership. Under this agreement, stakeholders own the partnership assets
together, have equal rights to manage activities, and are all personally liable for the
partnership’s debts and obligations. Disagreements in the ordinary course of partnership
activities are resolved by a majority of the partners. Disagreements relating to extraordinary
matters and amendments to the partnership agreement require the consent of all stakeholders.
If a partner is the principal agent carrying out the activities of the partnership, the other
stakeholders can be held liable for his or her dealings with third persons. The agreement also
specifies how profits and losses are to be shared. Finally, the contract usually includes a
declaration of partnership, which in some countries can be registered and made available for
public inspection.
3. Temporary union or consortium: A consortium is formed by a contract that delineates the
rights and obligations of each member. It usually ceases to exist when the specific project for
which it was created ends. Each stakeholder retains its separate legal status, and the
consortium’s control over each partner’s resources is generally limited to activities involving the
joint endeavor and the division of profits resulting from it. Consortia are particularly common in
the nonprofit sector, where they are often favored over corporations for taxation purposes.
4. New entity: In some countries, a partnership can also become a legal entity, usually in the
form of a permanent not-for-profit organization. This unit does not cease to exist when a
research project is completed but can carry out an infinite number of projects that match the
entity’s principal objectives. The legal establishment of such a joint venture is usually a long and
complicated process and requires the influx of capital from the stakeholders. However, the
partnership’s independent legal status can help it manage the influence and bias of
stakeholders, develop coherent activities and efficient management structures, and be
accountable to its owners through boards and assemblies. Some countries’ legislation provides
for special types of partnerships: “limited partnerships” are arrangements in which some
partners transfer their right to manage activities in exchange for limited liability for the
partnership’s debts, for example, while “limited liability partnerships” are arrangements in which
all stakeholders have some degree of limited liability. This kind of legislation is not very
prominent in developing countries.

EARLY GENERATION SEED INVESTMENT PLAN GUIDE 46
4.3 FUNDING ARRANGEMENTS
PUBLIC AND DONOR FUNDING
EGS interventions often involve public-sector investment due to NARI’s important role in
breeder seed production of many crops, EGS regulation, and its interest in using EGS to
achieve socioeconomic objectives. The ideal market archetype identified using the framework
developed under the USAID-BMGF partnership can be utilized to help make the case for public-
sector investment.
The point in enlisting the framework is to illustrate a crop’s market archetype, as demonstrated
in Figure 30, and to use the positioning to explain the circumstances that underlie its placement.
If, for example, a crop is classified as falling within the public sector dominant archetype, then
an investment case calling on the public sector is expected. The EGS country reports should
contain assessments of crops by archetype. This analysis can be evaluated and presented to
make the case for public and/or private sector investment.
Figure 30: Example positioning of crops within the archetype framework.
Source: Nigeria EGS Study (2016).
PRIVATE-SECTOR FUNDING
A tangible private-sector contribution is important not only from a resource and sustainability
standpoint but also because its presence is a criteria used by NEPAD to evaluate NAIPs.
Assessments of private seed investment within a country helps stakeholders understand how
public-sector spending complements and supports market development. An approach to
assessing private investment is to evaluate the actors identified in Chapter 1 and to estimate the
type and scale of their resource deployment along a seed value chain (NEPAD).
Le
ve
l o
f d
em
an
d f
or
cro
ps g
row
n
wit
h q
uality
se
ed
of
imp
rov
ed
v
ari
eti
es
High
High Low
Low
Private-Public Collaboration
ArchetypePrivate Sector Dominant Archetype
Public Sector Dominant Archetype
Niche Private Sector
Archetype
Marginal economic value of quality
seed of improved varieties
Maize
Public-Private Collaboration
Archetype
Rice
Soybean
Yam

EARLY GENERATION SEED INVESTMENT PLAN GUIDE 47
4.4 RESOURCES FOR STRUCTURING THE INTERVENTION
RESOURCE LINK DESCRIPTION
Building Public-Private Partnerships for Agricultural Innovation (IFPRI)
Reference guide that can be used in the development of agricultural PPPs
A Guide to Investor Targeting in Agribusiness (World Bank)
Guide for identifying potential private sector investors and conducting an investor targeting campaign
Strengthening Systematic Capacities for Formulation and Management of National Agriculture Investment Plans (FAO)
Comprehensive CAADP NAIP development resource3
Investment Project Financing Economic Analysis Guidance Note (World Bank)
A guide to assess a project’s economic impact and if public sector financing is necessary
Early Generation Seed Study (USAID-BMGF) Guide to seed market archetype methodology
EGS Country Studies - Rwanda, Zambia, Kenya, and Nigeria (USAID-FTF)
Country studies provide examples application of the seed market archetype methodology as well as EGS recommendations and associated PPPs
3 This FAO report includes a series of useful case studies, including: (1) Cameroon: National ownership and leadership for the
CAADP process as a key component of country capacity (pp. 25), (2) Grow Africa: A public-private partnership to accelerate investments (pp. 38), (3) Cameroon: Anchoring the NAIP in the Rural Sector Development Strategy (pp. 44), (4) Democratic Republic of the Congo: Using a participatory approach to define NAIP priorities (pp. 48), Chad: Roles and responsibilities in plan formulation (pp. 50), (5) Lesotho: Outreach and regional peer exchange (pp. 52), (6) Chad and Lesotho: Mainstreaming cross-cutting issues into NAIPs (pp. 57), (7) Cameroon: Participatory design of the results framework (pp. 72), (8) The NAIP results framework in Cameroon (pp. 79-81), (9) Chad: The cost of “realistic” costing (pp. 97), (10) Democratic Republic of the Congo: Holding the business meeting (pp. 102-103), and (11) Tanzania: Achieving coordinated implementation of investment programs (pp. 108-109). The report also provides a “toolbox” in CD-ROM format.

EARLY GENERATION SEED INVESTMENT PLAN GUIDE 48
CHAPTER 5: ADVOCATING FOR SEED SYSTEMS 5.1 ROLE OF SEED SYSTEMS WITHIN NAIPS
The NAIP architecture has three levels. At the highest level are program areas. Within the
program areas exist subprogram areas. Subprogram areas support the realization of program
areas and are comprised of multiple components. Figure 31 makes the relationship between the
three levels clearer.
Figure 31: Sample NAIP architecture.
Source: Adapted from FAO “Strengthening Systematic Capacities for the Formulation and Management of National Agriculture Investment Plans (NAIPs)” (2014).
Theoretically, seed systems could be found at any of the three levels. In practice, however,
seed system development initiatives, to the extent that they are mentioned at all, are typically
found as components. In Zambia’s NAIP (2014-2018), the promotion of seed systems is found
as component of a crosscutting program focused on improving agricultural support systems. In
Mozambique’s NAIP (2014-2018), the development of a cotton seed system is found as a
component within the cotton value chain subprogram.
5.2 INCREASING THE ROLE OF SEED IN NAIPS
Increasing the role of seed systems within NAIPs requires advocacy, i.e., by demonstrating their
importance in agricultural development.
DEMONSTRATING THE IMPORTANCE OF SEED SYSTEMS
NAIP
Program Area 1
Subprogram AreaComponent
Component
Program Area 2
Subprogram AreaComponent
Component
Program Area 3
Subprogram AreaComponent
Component
Program Area 4
Subprogram AreaComponent
Component

EARLY GENERATION SEED INVESTMENT PLAN GUIDE 49
Governmental agriculture priorities and seed system development are interconnected. Explicitly
stating how seed system development aligns with, or even undergirds, agricultural priorities to
achieve country-level objectives is the key to justifying its placement within the NAIP. Doing so
will demonstrate the importance of seed systems to achieve agricultural development and
growth goals.
An approach to showing this connection is to start with the priorities identified in the current or
prospective NAIP and to highlight seed systems’ relevance within each priority (Table 13).
Table 13: Sample mapping of seed system to NAIP thematic areas.
Mozambique – National Agriculture Investment Plan
Component Thematic area Relevance of Seed System
1 Improvement of Production and Productivity
Increased availability and uptake of quality seed is directly correlated with increased production and productivity
2 Market Access
Increasing access to markets will increase the demand for high yielding improved varieties with quality traits, in turn catalyzing EGS system development as a mechanism to deliver improved varieties
3 Food and Nutritional Security …
4 Natural Resources …
5 Reform and Institutional Strengthening
…
Source: Adapted from the Mozambique National Agriculture Investment Plan 2014-2018.
RELATIONSHIP OF SEED SYSTEMS TO REGIONAL PRIORITIES
Establishing the relationship between seed systems and regional agriculture priorities
strengthens the case for investment in seed systems and is an important evaluation criterion of
NAIPs. NAIPs show the linkage between country priorities and CAADP Pillars. A similar tact can
be taken with seed system investment plans and Regional Economic Community (REC)
objectives (Figure 32).

EARLY GENERATION SEED INVESTMENT PLAN GUIDE 50
Figure 32: Linkage between seed systems and REC agricultural priorities.
Source: Economic Community of Western States (ECOWAS) Agriculture Policy/Comprehensive African Agriculture
Development Program (2009).
STAKEHOLDER ROLES IN ADVOCACY
Particular attention should be paid to advocacy because of its importance in mobilizing
stakeholders and persuading decision makers to support seed development. To this end, the
EGS investment plan ought to include a summary of its strategy to win political and social
support for the proposed intervention. Developing an advocacy strategy involves five steps:
5.3 RESOURCES FOR SEED SYSTEM ADVOCACY
RESOURCE LINK DESCRIPTION
An Introduction to Advocacy (USAID) Training guide for developing effective advocacy campaigns
Define AdvocacyObjectives
Identify the Intended Audience
Frame the Message
Develop an Advocacy
Plan
Evaluate the Plan
Role of Seed
• Quality seed results in increased
yields for family farms
• A robust, financially independent,
seed system make enables more
sustainable intensification
Program ComponentsECOWAS Program
Promotion of food
commodities that
contribute to food
sovereignty
Support modernization
of family farms and
sustainable intensification
of production systems
Structuring and organizing
value chains
Promotion of processing and
value addition to products

EARLY GENERATION SEED INVESTMENT PLAN GUIDE 51
ANNEX 1: GUIDES AND TOOLS Actions Against Hunger (ACF). (July 2011). Maximizing the nutritional impact of food security and livelihoods interventions: a manual for field workers. Prepared by Le Cuziat, G. and Mattinen, H. Retrieved from http://www.actionagainsthunger.org/sites/default/files/publications/Maximising_the_Nutritional_Impact_of_Food_Security_and_Livelihoods_Interventions_A_Manual_for_Field_Workers_07.2011_0.pdf
Center for Development, Environment, Policy of SOAS, University of London. (2013). Project planning management-c134 unit ten: monitoring and evaluation. Retrieved from http://www.fao.org/3/a-au767e.pdf
Comprehensive Africa Agriculture Development Programme (CAADP). (April 2010). Post compact review: guidelines. Retrieved from http://www.nepad-caadp.net/content/post-compact-review-guidelines-english
CAADP. (January 14, 2016). The CAADP results framework 2015-2025. Retrieved from http://www.nepad-caadp.net/content/caadp-results-framework-2015-2025-english-0
CAADP. (September, 2016). Country CAADP implementation guidelines under the Malabo Declaration. Retrieved from http://www.nepad.org/resource/country-caadp-implementation-guidelines-under-malabo-declaration
Context, International Cooperation. Social return on investment: a practical guide for the development cooperation sector. (October 2010). Funded by Stichting Het Groene Woudt. Retrieved from http://bigpushforward.net/wpcontent/uploads/2011/09/sroi_practical_guide_context_international_cooperation.pdf
Food and Agriculture Organization of the United Nations (FAO). (1994). Seed marketing. Prepared by Mumby, G. Retrieved from http://www.fao.org/docrep/V4450E/V4450E00.htm
FAO and World Bank. (2008). Tracking results in agriculture and rural development in less-than-ideal conditions: a sourcebook of indicators for monitoring and evaluation. Retrieved from http://hdl.handle.net/10986/6200
FAO. (August 2014). Strengthening systemic capacities for the formulation and management of national agriculture investment plans (NAIPs). Prepared by De Rosa, C., Lachapelle, A. Retrieved from http://www.fao.org/3/a-au763e.pdf
FAO. (February 2015). Household seed security concepts and indicators. Discussion paper prepared by FAO. Retrieved from http://www.fao.org/fileadmin/user_upload/food-security-capacity-building/docs/Seeds/SSCF/Seed_security_concepts_and_indicators_FINAL.pdf
International Center for Tropical Agriculture. (2008). When disaster strikes: a guide to assessing seed system security. Cali, Colombia. Sperling, L. Retrieved from https://books.google.com/books?id=OFmVbLqPTdwC&printsec=frontcover&dq=when+disaster+strikes+a+guide+to+assessing+seed+system+security&hl=en&sa=X&ved=0ahUKEwjH-

EARLY GENERATION SEED INVESTMENT PLAN GUIDE 52
Lj7g_7OAhUKXR4KHcGWDIYQ6AEILzAA#v=onepage&q=when%20disaster%20strikes%20a%20guide%20to%20assessing%20seed%20system%20security&f=false
International Development Research Center (IDRC). (December 2003). Handbook for value chain research. Prepared by Kaplinsky, R., Morris, M. Retrieved from http://www.value-chains.org/dyn/bds/docs/395/Handbook%20for%20Value%20Chain%20Analysis.pdf
International Food Policy Research Institute (IFRPI). (2007). Building public–private partnerships for agricultural innovation: food security in practice technical guide series. Prepared by Hartwich, F., Tola. J., Engler, A., González, C., Ghezan, G., Vázquez-Alvarado, J., Silva, J.A., Espinoza, J., Gottret, M.V. Retrieved from http://ageconsearch.umn.edu/bitstream/46707/2/Building%20Public-Private%20partnerships.pdf
IFRPI. (2016). Metrics, analytical questions, and tools for NAIP design, appraisal, and tracking – DRAFT.
International Fund for Agricultural Development (IFAD). (2002). A guide for project M&E: managing for impact in rural development. Retrieved from https://www.ifad.org/documents/10180/17b47fcb-bd1e-4a09-acb0-0c659e0e2def
IFAD. (July 2009). Community-driven development decision tools. Retrieved from https://www.ifad.org/documents/10180/311a528e-3561-461f-8fb9-987e02c4f0fc
International Finance Corporation (IFC). (2007). Stakeholder engagement: a good practice handbook for companies doing business in emerging markets. Retrieved from http://www.ifc.org/wps/wcm/connect/938f1a0048855805beacfe6a6515bb18/IFC_StakeholderEngagement.pdf?MOD=AJPERES
Organization for Economic Co-operation and Development (OECD). Sustainability assessment methodologies (PowerPoint presentation). Developed by Stevens, C. of OECD. Retrieved from http://www.oecd.org/greengrowth/39925248.pdf
United Nations Development Programme. (June 2002). Handbook on monitoring and evaluating for results. Retrieved from http://web.undp.org/evaluation/documents/HandBook/ME-Handbook.pdf
USAID (1999). An introduction to advocacy: a training guide. Prepared by Sharma, R. under the Supported by Analysis in Africa (SARA) and Health and Human Resources Analysis for Africa (HHRAA) projects. Retrieved from http://pdf.usaid.gov/pdf_docs/pnabz919.pdf
USAID. (2010). Performance monitoring and evaluation TIPS, second edition. Contributors include Britan, G., Mehdi, S.; updated by Adams-Matson, M. Retrieved from http://pdf.usaid.gov/pdf_docs/Pnadw106.pdf
USAID. (September 1, 2010). Implementation best practices for value chain development projects. Prepared by Campbell, R. of ACDI/VOCA. Retrieved from https://www.microlinks.org/sites/microlinks/files/resource/files/Implementation_Best_Practices_VC_Projects.pdf
USAID. (July 2013). Feed the Future. Technical note on developing a results framework. Retrieved from https://usaidlearninglab.org/library/technical-note-developing-results-frameworks

EARLY GENERATION SEED INVESTMENT PLAN GUIDE 53
USAID. (2015). Feed the Future. M&E Guidance series volume I: monitoring and evaluation under Feed the Future. Retrieved from https://www.feedthefuture.gov/sites/default/files/resource/files/FTF_guidance_volume1_overview_2015.pdf
USAID. (March 2015). Feed the Future. Agriculture indicators guide. Prepared by Nelson, S. and Swindale, A. Retrieved from https://agrilinks.org/sites/default/files/resource/files/FTF_Agriculture_Indicators_Guide_Mar_2015.pdf
USAID. (February 2016). Feed the Future. Guide to the use of digital financial services in agriculture. Prepared by Martin, C., Harihareswara, N., Diebold, E., Kodali, H., and Averch, C. supported by USAID’s Mobile Solutions Technical Assistance and Research (mSTAR) project. Retrieved from https://agrilinks.org/sites/default/files/resource/files/DFS_FTF_Guide.pdf
USAID. (February 2016). Feed the Future. Sampling guide for beneficiary-based surveys for select Feed the Future agricultural annual monitoring indicators. Prepared by Stukel, D., Friedman, G. Retrieved from https://agrilinks.org/sites/default/files/resource/files/Sampling-Guide-Beneficiary-Based-Surveys-Feb122016.pdf
USAID. (March 2016). Feed the Future. Intervention guide for the women’s empowerment in agriculture index (WEAI). Prepared by Stern, M., Jones-Renaud, L., Hillesland, M. of ACDI/VOCA. Retrieved from https://www.microlinks.org/sites/default/files/resource/files/WEAI_Intervention_Guide_Final_8.2016.pdf
USAID. (July 15, 2016). Feed the Future. Summary chart of Feed the Future indicators. Retrieved from https://feedthefuture.gov/resource/summary-chart-feed-future-indicators
USAID. (July 25, 2016). Feed the Future. Feed the Future handbook of indicator definitions. Retrieved from https://feedthefuture.gov/resource/feed-future-handbook-indicator-definitions
World Bank. (1984). Economic analysis of agriculture projects. Prepared by Gittinger, J.P. Retrieved from http://www.stanford.edu/group/FRI/indonesia/documents/gittinger/Output/title.html
World Bank. (August 2002). Beneficiary assessment: an approach described. Prepared by Salmen, L. under the Social Development Family of the World Bank. Retrieved from: http://siteresources.worldbank.org/INTPCENG/11433331116505682469/20509250/BAAPProach.pdf
World Bank. (2004). Ten steps to a results-based monitoring and evaluation system. Prepared by Kusek, J. and Rist., R. Retrieved from http://portals.wi.wur.nl/files/docs/ppme/10steps2resultbasedMonitoring.pdf
World Bank. (2009). Making monitoring and evaluation systems work: a capacity development toolkit. Prepared by Gorgens, M. and Kusek, Z. Retrieved from http://hdl.handle.net/10986/2702
World Bank (2012). Designing a results framework for achieving results: a how-to guide. Prepared by Roberts, D., Khattri, N. Retrieved from

EARLY GENERATION SEED INVESTMENT PLAN GUIDE 54
http://siteresources.worldbank.org/EXTEVACAPDEV/Resources/designing_results_framework.pdf
World Bank. (2012). A guide to assessing needs: essential tools for collecting information, making decisions, and achieving development results. Prepared by Watkins, R., Meirs, M.W., and Visser, Y. Retrieved from https://openknowledge.worldbank.org/bitstream/handle/10986/2231/663920PUB0EPI00essing09780821388686.pdf?sequence=1&isAllowed=y
World Bank. (2013). Designing a multi-stakeholder results framework: a toolkit to guide participatory diagnostics and planning for stronger results and effectiveness. Retrieved from https://openknowledge.worldbank.org/handle/10986/17582
World Bank. (April 9, 2013). Investment project financing economic analysis guidance note. Retrieved from http://siteresources.worldbank.org/PROJECTS/Resources/40940-1365611011935/Guidance_Note_Economic_Analysis.pdf
World Bank. (August 2014). A guide to investor targeting in agribusiness. License: CC BY 3.0 IGO. Retrieved from https://openknowledge.worldbank.org/handle/10986/21720
World Bank. (December 2014). Agribusiness indicators: synthesis report. Agriculture Global Practice Discussion Paper, number 91133-AFR. Retrieved from http://documents.worldbank.org/curated/en/698581468009642974/pdf/911330WP0REVIS0iness0Indicators0Web.pdf

EARLY GENERATION SEED INVESTMENT PLAN GUIDE 55
ANNEX 2: USEFUL DATA SOURCES AND REPOSITORIES
Resource Description
Access to Seeds Index
The Access to Seeds Index assesses, scores and ranks seed companies according to their efforts to improve access to quality seeds of improved varieties for smallholder farmers. The Index seeks primarily to identify leadership and good practices, providing an evidence base for the discussion on where and how the seed industry can step up its efforts. As a benchmarking tool, the Index aims to incentivize seed companies to improve their performance.
Africa Lead II
Africa Lead II is USAID’s primary capacity-building program in Sub-Saharan Africa. The program works to help realize FTF and the African Union’s CAADP goals of reduced hunger and poverty by building the capacity of champions, institutions, and stakeholders to develop, lead, and manage the structures needed for African-led agriculture transformation. This website provides access to an extensive library of publications searchable by geography, sector, and types of publication.
Africa Seed Trade Association (AFSTA)
AFSTA is a not-for-profit membership association formed in 2000 to champion interests of private seed companies in Africa. It is registered in Kenya as an international organization with an office for West Africa in Dakar, Senegal. Currently, it has about 100 members comprising seed companies and national seed trade associations, among others. The website provides access to an extensive library of position papers.
Agrilinks
Agrilinks is part of the U.S. government's FTF initiative, which aims to address the root causes of hunger, poverty, and undernutrition and to establish a lasting foundation for change. The Agrilinks portal includes an extensive library of publications, reports, videos, and tools.
CAADP CAADP is a program of the African Union (AU) in the New Partnership for Africa’s Development (NEPAD). The website provides access to publications, news articles, and a video and audio gallery.
Consultative Group to Assist the Poor (CGAP)
CGAP is a global partnership of 34 organizations that seek to advance financial inclusion. The website includes a library of publications and data.
CGIAR The CGIAR website has links to its 15 CGIAR centers and includes an extensive library of reports, research papers, data, and news.
Policy Institutions and Markets Value Chains Knowledge Clearinghouse
The Value Chains Knowledge Clearinghouse is an initiative led by Policies, Institutions, and Markets CGIAR Research Program consisting of IFPRI, CIAT, ILRI, IITA, World Agroforestry Centre, ICRISAT, Bioversity, and CIP. The portal provides a repository of research methods and best practices surrounding value chain performance that can be used by all of the consortium research programs and partners.
Famine Early Warning Systems Network (FEWS NET)
FEW NET is a leading provider of early warning and analysis on food insecurity. Created by USAID in 1985 to help decision-makers plan for humanitarian crises, FEWS NET provides evidence-based analysis on some 35 countries.
FAO Statistics (FAOSTAT)
FAOSTAT is maintained by the statistics division of the Food and Agricultural Organization of the United Nations. In working directly with the

EARLY GENERATION SEED INVESTMENT PLAN GUIDE 56
countries, the statistics division supports the development of national statistical strategies, the strengthening of institutional and technical capacities, and the improvement of statistical systems.
FAO Food Price Monitoring and Analysis Tool
Access to more than 1,100 consumer price series in 85 countries and 43 international cereal export price series.
FAO Gender Toolkit
Database includes the Socio-Economic Gender Analysis, the Agri–Gender Statistics Toolkits, and the Gender and Land Rights Database, and provides a set of tools for gender analysis and assessment for each agricultural sector
FTF FTF resources include access to newsletters, reports, strategy documents, and fact sheets.
Grow Africa
The Grow Africa Partnership was founded jointly by the AU, NEPAD, and the World Economic Forum in 2011. Grow Africa works to increase private sector investment in agriculture and to accelerate the execution and impact of investment commitments. The resources portal provides access to publications, videos, and tools.
Microlinks
Microlinks' mission is to share good practice in inclusive market development around the world. This platform helps users consume and contribute content along a spectrum of issues from pathways out of poverty to mobilizing private capital, market facilitation to models for reaching scale. USAID supports Microlinks and a broad array of knowledge-sharing tools, strategies, and events through the Knowledge-Driven Agricultural Development program.
Monitoring and Analyzing Food and Agricultural Policies (FAO)
Database of select countries classifying public expenditure by commodity and repository of reports, technical notes, policy briefs, and learning material
New Alliance The New Alliance for Food Security and Nutrition is a shared commitment to achieve sustained inclusive, agriculture-led growth in Africa. The portal includes a library of fact sheets, multimedia, reports, and speeches.
Regional Strategic Analysis and Support System (ReSAKSS)
The ReSAKSS portal provides access an extensive library of CAADP documents as well as data and publications.
The African Seed Access Indicators (TASAI)
The central objective of TASAI is to promote the creation and maintenance of enabling environments for competitive seed systems serving smallholder farmers. It is this enabling environment that TASAI seeks to measure, track, and compare across African countries. The intended outcome of this index is improved access to locally adapted, affordable, and high-quality seed of improved varieties by smallholder farmers in Sub-Saharan Africa.
United Nations Comtrade Database
UN Comtrade is a repository of official trade statistics and relevant analytical tables. It contains annual trade statistics starting from 1962 and monthly trade statistics since 2010.
USAID - Enabling Agricultural Trade (USAID-EAT)
The USAID-EAT project promotes inclusive agricultural sector growth, a key component of the U.S. government's FTF initiative, by creating enabling environments for agribusinesses that encourage private-sector investment and promote food security. EAT has a number of tools for analyzing all aspects of the agribusiness enabling environment and has operated in countries around the world.

EARLY GENERATION SEED INVESTMENT PLAN GUIDE 57
United States Department of Agriculture Foreign Agricultural Service (USDA FAS) Database
The USDA FAS links U.S. agriculture to the world to enhance export opportunities and global food security. The website includes four databases providing information on trade, production, and demand, as well as a library of reports and publications.
World Bank Development Indicators
The primary World Bank collection of development indicators, compiled from officially recognized international sources. It presents the most current and accurate global development data available and includes national, regional, and global estimates.

EARLY GENERATION SEED INVESTMENT PLAN GUIDE 58
ANNEX 3: BIBLIOGRAPHY Bill & Melinda Gates Foundation (BMGF), United States Agency for International Development (USAID). (April 2015). Early Generation Seed Study (PowerPoint presentation). Developed by Monitor Deloitte. Retrieved from https://agrilinks.org/sites/default/files/resource/files/EGS%20Study_USAID_Gates_Full.pdf
Comprehensive Africa Agriculture Development Programme (CAADP) Regional Strategic Analysis and Support System (ReSAKSS). Retrieved from: http://www.resakss.org/resources/caadp-documents
European Network and Information Security Agency. (2011). Cooperative models for effective public private partnerships – good practice guide. Prepared by Landitd Ltd.
Federal Democratic Republic of Ethiopia. (September 15, 2010). Ethiopia’s Agricultural Sector Policy and Investment Plan Framework 2010-2020. Addis Ababa, Ethiopia. Retrieved from http://www.valuechains.org/dyn/bds/docs/395/Handbook%20for%20Value%20Chain%20Analysis.pdf
Government of the Republic of Mozambique. (2014). National Agriculture Investment Plan 2014-2018. Maputo, Mozambique. Retrieved from http://www.resakss.org/sites/default/files/pdfs/Final%20PNISA%20Revised%20Version_0.pdf
Government of the Republic of Zambia. (May 2013). Zambia National Agriculture Investment Plan 2014-2018. Lusaka, Zambia. Retrieved from http://www.gafspfund.org/sites/gafspfund.org/files/Documents/6.%20Zambia_investment%20plan.pdf
GRAIN. (February 23, 2015). Seed laws around the world. Retrieved from https://agrilinks.org/sites/default/files/resource/files/Copy%20of%20MASTER%20seed%20laws%20by%20country%20EN.pdf
Inter-American Development Bank (IDB). (December 2010). Designing impact evaluations for agricultural projects. Prepared by Winters, P., Salazar, L., Maffioli, A. of IDB. Retrieved from https://publications.iadb.org/bitstream/handle/11319/1956/Designing%20Impact%20Evaluations%20for%20Agricultural%20Projects.pdf?sequence=1
Oxfam. (September 1, 2014). Moral hazard? ‘Mega’ public-private partnerships in African agriculture. 188 Oxfam Briefing Paper.
USAID. (March 24, 2015). Planning for scale: using what we know about human behavior in the diffusion of agricultural innovation and the role of agricultural extension. Prepared by Simpson, B. Retrieved from https://agrilinks.org/sites/default/files/resource/files/MEAS%20TN%20Scaling%20-%20Brent,%20Simpson%20-%20March%202015.pdf
USAID. (July 2013). Feed the Future learning agenda literature review. Expanded markets, value chains and increased investment. Retrieved from https://agrilinks.org/FTFLearningAgenda.

EARLY GENERATION SEED INVESTMENT PLAN GUIDE 59
USAID. (July 2013). Feed the Future learning agenda literature review. Improving resilience of vulnerable populations. Retrieved from https://agrilinks.org/FTFLearningAgenda.
USAID. (August 2013). Feed the Future learning agenda literature review. Improved nutrition and diet quality. Retrieved from https://agrilinks.org/FTFLearningAgenda.
USAID. (September 2013). Feed the Future learning agenda literature review. Improving research and development. Retrieved from https://agrilinks.org/FTFLearningAgenda.
USAID. (October 2013). Feed the Future learning agenda literature review: Improved agricultural productivity. Retrieved from https://agrilinks.org/FTFLearningAgenda.
USAID. (January 23, 2015). Feed the Future learning agenda literature review: Improved gender integration and women’s empowerment. Retrieved from https://agrilinks.org/library/feed-future-learning-agenda-literature-review-improved-gender-integration-and-womens.
USAID. (June 2016). Kenya Early Generation Seed Study – Country Report, prepared by Context Network for Africa Lead II.
USAID. (August 2016). Nigeria Early Generation Seed Study – Country Report, prepared by Context Network for Africa Lead II.
USAID. (June 2016). Rwanda Early Generation Seed Study – Country Report, prepared by Context Network for Africa Lead II.
USAID. (June 2016). Zambia Early Generation Seed Study – Country Report, prepared by Context Network for Africa Lead II.
World Economic Forum. (April 2014). Creating new models – Innovative public-private partnerships for inclusive development in Latin America. Prepared by the members of the World Economic Forum Global Agenda Council on Latin America.