Embed Size (px)
Citation preview

1 | P a g e O P E R A T I O N E X C E L L E N C E 2 0 1 2
Lean Manufacturing: Which Lean approaches and
tools are best suited for the Pharmaceutical Industry
By Rafi Maslaton
Introduction: Today’s environment is driven by external economic forces, patent expiration,
dwindling pipeline of new drug candidates and increased competition. Price controls are currently enforced throughout Europe, while, in the U.S., changes in the healthcare system are expected to reduce profitability and drive increased demand for lower cost products. Over the next five years, 92 billion dollars worth of name-brand drugs will come off patent. The result: more emphasis on efficient drug manufacturing and R&D and greater recognition of the strategic importance of drug manufacturing. 2012 is focused on achieving operational excellence as a means to better compete against peers in light of these trends. Many Pharmaceutical companies have initiated Lean and Six Sigma initiatives to drive cost reductions throughout the supply chain. The key challenge in adopting Lean Manufacturing is tracking down (I don’t understand what you are trying to say in this sentence). to the origins of the concept as it came from a very different industry, the automotive, hence some of the companies have struggled in choosing the effective approaches and tools to better fit to their business goals. This article focuses on several key Lean tools and provides guidance where these could add value and where some of these tools were not designed for our industry. Tools and approaches such as Single Piece Flow, 5S, OEE, Value Stream Mapping, KANBAN, JIT will be outlined in the article.
The concept of Lean manufacturing originated in the automotive industry, offering a new culture and approach to remove waste and streamline the overall manufacturing process. It has a set of tools to assist in achieving these goals. The main mistake that is often observed in the Pharmaceutical industry, as well as other industries that started adapting lean in their supply chain, is the lack of rationalization between what lean is offering vs. what we really can use in our industry. In other words, what are the right tools and approaches that present the real fit for our industry and what should be used and where.. Today, many companies have already embraced a lean program. In most cases, it is under Operational Excellence within the Process Excellence group and includes Lean and Six Sigma tools. Rather than providing an overview of Lean and repeat much of the content that has already been covered, I have chosen to select a few tools and discuss where in our industry these will be applicable and are worth using vs. places where it was not designed for our industry due to unique characteristics. Let’s start with some of the key tools and approaches as well as lean philosophies and see which ones we should adapt.
Single Piece Flow: refers to the concept of moving one work piece at a time between operations within a work cell; this idea has many benefits. It keeps WIP at the lowest possible level. It encourages work balance, better quality and a host of other internal improvements.

2 | P a g e O P E R A T I O N E X C E L L E N C E 2 0 1 2
Now, let’s examine this philosophy in our industry. Before diving into the Pharmaceutical industry, I would like to provide an example from a different industry, the Semiconductor industry. More than a decade ago, a few industry leaders started with the lean program as a means to compress cycle time, reduce inventory and cost. The biggest mistake was taking the text book and enforcing it on an industry that has key attributes that are not simple to change nor should be changed. The key item was reduced lot size as a means to reducing overall cycle time. Most equipment in the Semiconductor industry benefited from the current lot size at the time which was 25 wafers / units. Once the lot size was reduced, most of the equipment set up and process time remained the same despite the lot size reduction, so utilization went up, as we needed more equipment hours to process the same amount of units and cycle time went up through the roof as bottlenecks started to show up everywhere due to higher demand for equipment process time. This example may be taken from another industry, yet it is identical to our industry as a potential first step in adapting lean. If we try to do the same thing, and basically campaign size will be 1 batch, then we will see a major impact on both equipment and labor hrs in both the lab and manufacturing. For the same reason, the lab, for example, may spend 3-4 hrs in sample preparation and 1 hr to set up HPLC for example. Only a fraction of that time will be spent on any additional sample, so running one sample at a time will be a major efficiency hit on the lab. In the same manner, not campaigning prior to the granulation machine, or compression may lead to excessive cleaning and reduce the effective capacity of the site. The bottom line is an adaptation to Lean should be carefully assessed and only once we fully understand the affect of the proposed changes and analyze analyzed the overall implications in detail, it should be pursued. The key mistake in both industries in the early adaption that is perhaps not realized is that a single unit may need to be taken as 25 wafers in the Semiconductor industry and 2-3 Batches when it comes to high volume products.
OEE: Let’s move to more examples where lean tools work great; OEE Overall Equipment Effectiveness is a great example to demonstrate that, in our industry, there are areas that should leverage OEE as an equipment performance metric, and where OEE does not add value. OEE has been used for many years as a leading metric in hi-tech industries where equipment is used 24/7, and it is one of the most dominant cost components in the manufacturing environment.
OEE DEFINITION: OEE is defined as the percentage of time that equipment is used to produce sellable products at the maximum rate. This measure of tool performance captures all equipment time consumed by the six big losses:
1. Equipment Failure (Unscheduled Downtime) 2. Setup & Adjustment (Including PMs & Engineering) 3. Idling & Assists (Wait for Operator, Minor Stoppages) 4. Speed Loss (Rework, Inefficient Batch Sizing) 5. Defects (Non-Fatal Defects) 6. Reduced Yield (Fatal Defects)

3 | P a g e O P E R A T I O N E X C E L L E N C E 2 0 1 2
As OEE was recognized as an effective metric in the Hi-Tech industries and it is an integrated part of Lean, Pharmaceutical companies have begun to adapt OEE in their production and found it can be very frustrating in some cases.. Packaging and Filling operations that are working 2-3 shift per day 5 days a week could be great candidates for OEE metrics. These operations have the basic fundamentals for OEE approach. There is equipment throughput (Theoretical) i.e., Filling at a rate of 300 vials per minute so if we get 150 vials per minute we know the OEE is 50% and this means 50% opportunity for improvements. There are operational aspects that could influence performance, yield losses that could be reduced, and set up / change over and equipment downtime. The key is to scale the OEE to the hours of operation so if we are working 5 days, the OEE should be based on 5 days vs. the theoretical 7 days per week. Otherwise, we end up with a very low OEE that is discouraging and later becomes meaningless. The way OEE is related to operation excellence is clear; improving OEE increases capacity, yet the relation between OEE to cycle time which is one of the key pillars of operation excellence is not trivial. To simplify this relation, in Figure-2 we can see 2 curves, curve 1 and 2. If we are able to reduce OEE losses (In RED) for the same volume, we create additional flexibility and we are moving from curve 1 to curve 2. This added flexibility can be used for cycle time reduction. However, if we are pushing the utilization, while not addressing OEE losses, we can operate at a high utilization range but also cycle time will increase exponentially as a result which is not desired. To summarize, addressing OEE losses can help create flexibility (additional capacity) and can be translated to cycle time compression. Finally, if a line is running one shift per day as an example, OEE, if measured across the 24 hrs by choice, will be very low and not meaningful, therefore an organization that elects to use OEE should focus on calculating OEE against the operating hrs. The capacity model can show us what the expected increase in output is if we utilize a 2nd shift or a 3rd shift.OEE should not be penalized for that. Now when we consider, let’s say blending operation or granulation, the equipment process in most cases represents a relatively small part of the overall process as charging, cleaning and discharging operations are the most time consuming. So, OEE in this case will not reveal any value added information and should not be used. When we attempt to track OEE in these operations we will see 20%-30% OEE, yet we know where the opportunities areas are: change over, set ups, operator coverage and more, and the extra effort collecting OEE and reporting it does not add value. This leads us to the next Lean tool for improving change overs.
Productivity Improvement
Cyc
le T
ime
Fac
tor
Utilization0% 75% 85% 100%
Ca
pac
ity
Lo
ss
es
New Effective Capacity
Figure-1: Cycle Time and OEE Relation
4 | P a g e O P E R A T I O N E X C E L L E N C E 2 0 1 2
Change Over Reduction: SMED Single Minute Exchange of Die is a tool to facilitate change over reduction to a relatively short duration (e.g., 10 minutes). This can enable a reduction in batch size (campaign size) and minimize the OEE losses as discussed. As discussed before, the characteristics of our industry is more aligned with campaigning than a batch size of one, however, reduction of changeover can bring about major benefits to the manufacturing operation in areas such as capacity, reduced labor, improved equipment reliability, and provide flexibility when needed. So how can SMED be effectively implemented? There are several steps that should be followed, and are key for a successful implementation:
Selection. Use capacity model (Figure-2) to identify the top 3 bottlenecks and focus on the ones that have the longest change over duration.
Establish a strong team. In any Lean initiative the key for success is a strong and cross functional team
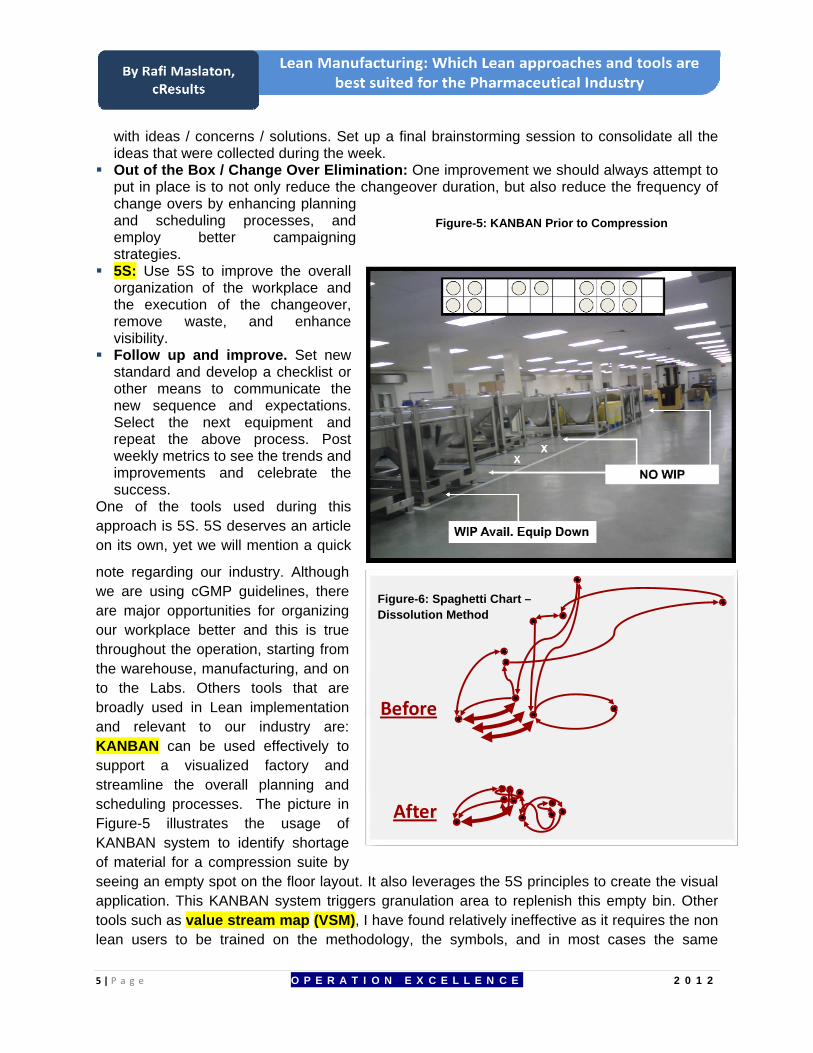
Sequence: map the activities involved in the changeover and optimize the sequence by maximizing the parallel activities, while balancing the workload between the various contributors such as mechanics, line lead, cleaning operators. This is a critical element of the sequencing not only to come up with a better and shorter changeover sequence, but also to design a feasible sequence that does not require 5 additional people for 3 hrs to reduce 20 min. The chart in figure-4 shows an example for a relatively balanced changeover involving a labeler, filler, capper, tray packer, mechanic, case packer and lead
showing how each one of the participants contributes throughput the changeover.
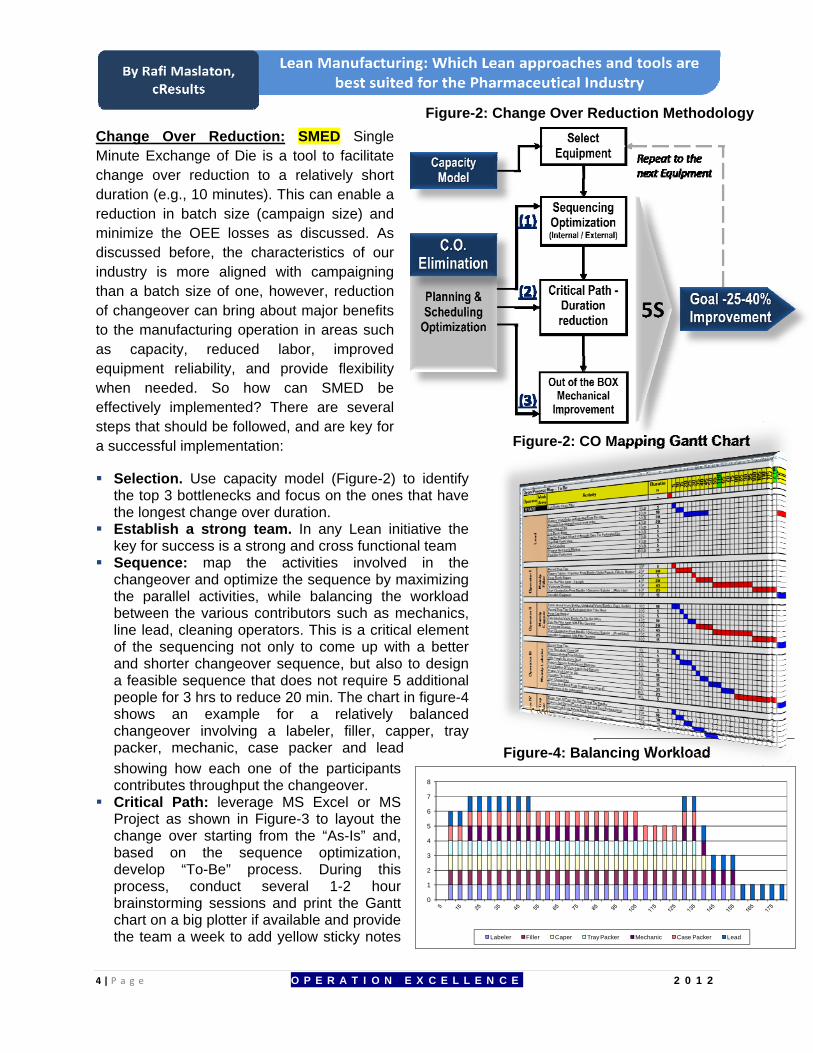
Critical Path: leverage MS Excel or MS Project as shown in Figure-3 to layout the change over starting from the “As-Is” and, based on the sequence optimization, develop “To-Be” process. During this process, conduct several 1-2 hour brainstorming sessions and print the Gantt chart on a big plotter if available and provide the team a week to add yellow sticky notes
Figure-2: Change Over Reduction Methodology
Figure-4: Balancing Workload
Figure-2: CO Mapping Gantt Chart
0
1
2
3
4
5
6
7
8
Labeler Filler Caper Tray Packer Mechanic Case Packer Lead
5 | P a g e O P E R A T I O N E X C E L L E N C E 2 0 1 2
with ideas / concerns / solutions. Set up a final brainstorming session to consolidate all the ideas that were collected during the week.
Out of the Box / Change Over Elimination: One improvement we should always attempt to put in place is to not only reduce the changeover duration, but also reduce the frequency of change overs by enhancing planning and scheduling processes, and employ better campaigning strategies.
5S: Use 5S to improve the overall organization of the workplace and the execution of the changeover, remove waste, and enhance visibility.
Follow up and improve. Set new standard and develop a checklist or other means to communicate the new sequence and expectations. Select the next equipment and repeat the above process. Post weekly metrics to see the trends and improvements and celebrate the success.
One of the tools used during this approach is 5S. 5S deserves an article on its own, yet we will mention a quick
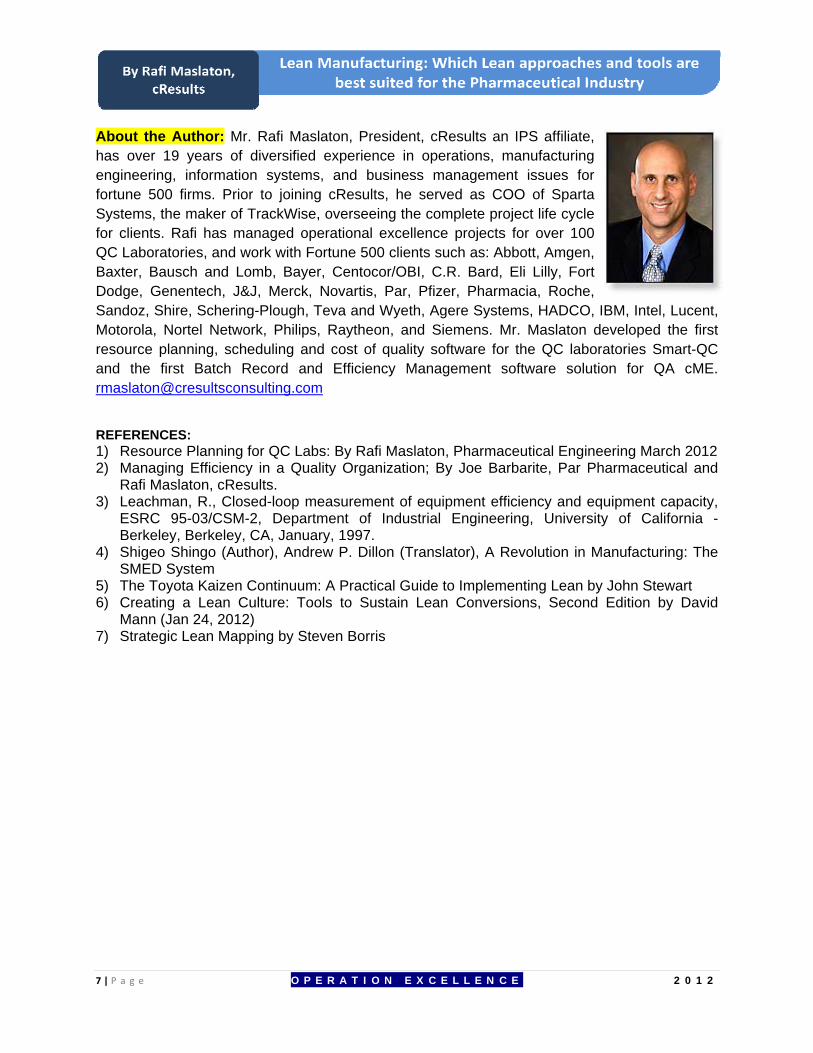
note regarding our industry. Although we are using cGMP guidelines, there are major opportunities for organizing our workplace better and this is true throughout the operation, starting from the warehouse, manufacturing, and on to the Labs. Others tools that are broadly used in Lean implementation and relevant to our industry are: KANBAN can be used effectively to support a visualized factory and streamline the overall planning and scheduling processes. The picture in Figure-5 illustrates the usage of KANBAN system to identify shortage of material for a compression suite by seeing an empty spot on the floor layout. It also leverages the 5S principles to create the visual application. This KANBAN system triggers granulation area to replenish this empty bin. Other tools such as value stream map (VSM), I have found relatively ineffective as it requires the non lean users to be trained on the methodology, the symbols, and in most cases the same
Before
After
Figure-6: Spaghetti Chart –Dissolution Method
Figure-5: KANBAN Prior to Compression

6 | P a g e O P E R A T I O N E X C E L L E N C E 2 0 1 2
information could be presented and analyzed in a more traditional flow diagram accompanied with capacity modeling. Spaghetti chart is an effective tool in our industry and can truly be affective in QC Laboratories, where there is more flexibility to modify the layout and improve the flow by moving instruments or re-arranging the work benches. Manufacturing is a less effective area to use the spaghetti chart as if it is not a Greenfield, the flexibility and the cost of making changes is usually prohibitive. The following chart (Figure-6) is taken from a lab Kaizen event (another Lean tool where employees work together proactively to achieve regular, incremental improvements in the manufacturing process) that focused on the dissolution and HPLC testing method (Figure-7) and made a significnat improvement in terms of walking distance and elimination of waste. Visual Factory: creates a visual language to distinguish quickly between normality and abnormality, and illustrates waste in a manner that it is obvious to everyone. In figure 7, a QC Laboratories dashboard presents the weekly goals of samples and the samples released against this goal as well as the expected number of tests corresponding to these samples. The efficiency of the various teams in the lab, the lab cycle time for the current week, and the on-time delivery performance for the samples released during the current week are also shared. The effect is substantial and can drive the team toward their goals.
Summary: Lean provides a great set of tools to facilitate some of the key drivers that are imperative in today’s economy and industry conditions. Although Lean originated in a different industry, as we discussed throughout the article, there are ample examples for successful deployment of Lean tools in ours. However, at the same time we need to carefully assess the selection of the Lean tools that are a best fit to the business goals knowing the characteristic of our industry.
Figure-7: Visual Factory: QC Dashboard
7 | P a g e O P E R A T I O N E X C E L L E N C E 2 0 1 2
About the Author: Mr. Rafi Maslaton, President, cResults an IPS affiliate, has over 19 years of diversified experience in operations, manufacturing engineering, information systems, and business management issues for fortune 500 firms. Prior to joining cResults, he served as COO of Sparta Systems, the maker of TrackWise, overseeing the complete project life cycle for clients. Rafi has managed operational excellence projects for over 100 QC Laboratories, and work with Fortune 500 clients such as: Abbott, Amgen, Baxter, Bausch and Lomb, Bayer, Centocor/OBI, C.R. Bard, Eli Lilly, Fort Dodge, Genentech, J&J, Merck, Novartis, Par, Pfizer, Pharmacia, Roche, Sandoz, Shire, Schering-Plough, Teva and Wyeth, Agere Systems, HADCO, IBM, Intel, Lucent, Motorola, Nortel Network, Philips, Raytheon, and Siemens. Mr. Maslaton developed the first resource planning, scheduling and cost of quality software for the QC laboratories Smart-QC and the first Batch Record and Efficiency Management software solution for QA cME. [email protected]
REFERENCES: 1) Resource Planning for QC Labs: By Rafi Maslaton, Pharmaceutical Engineering March 2012 2) Managing Efficiency in a Quality Organization; By Joe Barbarite, Par Pharmaceutical and
Rafi Maslaton, cResults. 3) Leachman, R., Closed-loop measurement of equipment efficiency and equipment capacity,
ESRC 95-03/CSM-2, Department of Industrial Engineering, University of California - Berkeley, Berkeley, CA, January, 1997.
4) Shigeo Shingo (Author), Andrew P. Dillon (Translator), A Revolution in Manufacturing: The SMED System
5) The Toyota Kaizen Continuum: A Practical Guide to Implementing Lean by John Stewart 6) Creating a Lean Culture: Tools to Sustain Lean Conversions, Second Edition by David
Mann (Jan 24, 2012) 7) Strategic Lean Mapping by Steven Borris