Embed Size (px)
Citation preview
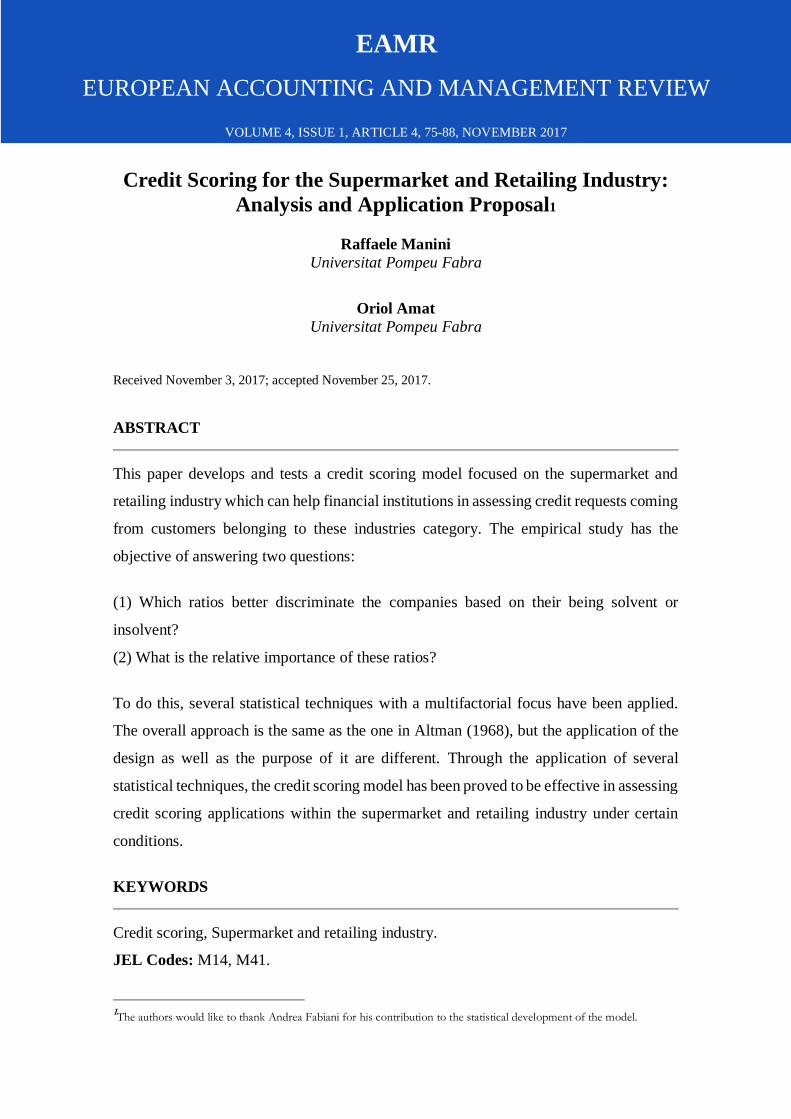
EAMR
EUROPEAN ACCOUNTING AND MANAGEMENT REVIEW
VOLUME 4, ISSUE 1, ARTICLE 4, 75-88, NOVEMBER 2017
Credit Scoring for the Supermarket and Retailing Industry:
Analysis and Application Proposal1
Raffaele Manini
Universitat Pompeu Fabra
Oriol Amat
Universitat Pompeu Fabra
Received November 3, 2017; accepted November 25, 2017.
ABSTRACT
This paper develops and tests a credit scoring model focused on the supermarket and
retailing industry which can help financial institutions in assessing credit requests coming
from customers belonging to these industries category. The empirical study has the
objective of answering two questions:
(1) Which ratios better discriminate the companies based on their being solvent or
insolvent?
(2) What is the relative importance of these ratios?
To do this, several statistical techniques with a multifactorial focus have been applied.
The overall approach is the same as the one in Altman (1968), but the application of the
design as well as the purpose of it are different. Through the application of several
statistical techniques, the credit scoring model has been proved to be effective in assessing
credit scoring applications within the supermarket and retailing industry under certain
conditions.
KEYWORDS
Credit scoring, Supermarket and retailing industry.
JEL Codes: M14, M41.
1The authors would like to thank Andrea Fabiani for his contribution to the statistical development of the model.

Raffaele Manini and Oriol Amat
76
1. Introduction
Credit scoring, is the process of collecting, analyzing and classifying different variables
related to credit in order to asses credit decisions, Hand and Jacka, (1998) and Anderson
(2007). The importance of this field has been increasing over time reaching its peak
during the last financial crisis in 2008 when credit ratings and financial institutions in
general showed severe limitations in assessing credit requests and companies’ solvency
in general. Academic research in the field of credit scoring has the goal of identifying the
variables that have significant influence in companies’ probability of default, so to allow
credit institutions to discriminate between solvent customers and insolvent customers
before actually granting credit. In addition, a slightly improvement in the credit scoring
assessment leads to significant positive results for the lender (Schreiner, 2002; Schreiner,
2004; De Young, Glennon and Nigro, 2008). However, credit scoring techniques, might
be influenced by industry specific characteristics as well as the institution applying it.
This paper builds on the work of Amat, Antón and Manini (2016) which addresses the
limitation of industry specificity when applying a Z score model for credit scoring
purposes. In fact, their model once tested on real companies’ data, had extremely high
overall results in assessing the solvency of specific companies including the television
industry, the airplane industry and much more (Amat, Antón and Manini, 2016).
However, this model could not be properly applied to both financial institutions and
supermarkets/retailing industries because of their industry specificity. This paper, tries to
partially bridge this gap by providing a Z score applicable to the supermarket and retailing
industry. The rest of the paper is organized as follow. The second part will briefly revise
part of the existing literature in credit scoring. The third part will be dedicated to
describing the research methodology and design. Finally, conclusions and limitations of
the paper will be discussed.
2. Literature Review
The main idea behind credit scoring is trying to develop a model which can forecast with
as high predictive power as possible, if a company will have solvency issues. The most
traditional credit scoring models tend to apply a simple basic concept which is comparing
customers’ profiles. If the profile of a credit applicant is closer to a solvent one then it
would be considered solvent, so it would be granted credit otherwise it would be
Credit Scoring for the Supermarket and Retailing Industry: Analysis and Application Proposal
77
considered not solvent. Hence, the financial institution would deny the credit request
(Abdou and Pointon, 2011). To make this kind of comparison, financial institutions can
choose between two main techniques. The loans’ officer subjective assessment that is the
process through which the financial officer in charge after having performed several
checks about the credit applicant decides if granting him credit or not. The advantage of
this approach is the possibility of taking into account most of the aspects being part of a
credit request including qualitative ones (Amat, Antòn, Manini, 2016). The second
methodology financial institutions can apply to decide about granting credit or not is the
application of a credit scoring model. A statistical model taking into account several
factors of the credit application, but mainly relying on quantitative data including
historical performance of the credit applicant and financial stability of the latter.
Nowadays, more complex statistical models have been developed, but at the same time
behavioral science are playing a heavier role within the business science. Therefore, it is
still not possible to neutrally and properly decide between the two methodologies without
missing some part of the big picture. However, what it is clear is the importance of credit
scoring in today’s society which is based on borrowing and lending, so on credit and the
relevance of credit scoring both in research and applications in the private sector. For
instance, the Scoring can be applied to both companies and individuals and it is applied
in different phases (Amat, Pujadas and Lloret, 2012):
• Customer identification phase. In this phase, financial entities can identify those
customers having an appropriate profile to receive the loan (Arimany and
Viladecans, 2015).
• Phase of initial study of the operation to decide whether to accept or not
(acceptance scoring).
• Once the credit has been granted, there is a phase of post monitoring (Behavioral
scoring). During this phase, the scoring is applied to the customers who obtained
the loans and it is useful to assess if it is worth to keep the customer or not, if it is
better to increase or reduce the limits allowed, to identify too risky customers
before it is too late and establish interests and commissions for the renewals.
Raffaele Manini and Oriol Amat
78
• Phase of default. In case the customer defaults, the scoring helps to evaluate the
level of possible losses and the most appropriate actions to take in order to recover
the defaulted payment.
Nowadays, many financial institutions have their own credit scoring and there are even
some companies such as Experian and Equifax which fill in reports about their customers
using credit scoring results. The history of credit scoring started with the FICO score
designed in the USA for the FICO company in 1958. The first credit scoring for credit
cards instead started in 1960 with Montgomery Ward. Still today, there is significant
dispute among scholars and practitioners about what is the best statistical technique to
apply to obtain the best credit scoring model in terms of predicting power. One of the
most famous and respected credit scoring model is the Z score of Altman (1968) whose
model is still one of the most used by credit institutions. Argenti (1983) proposed a model
which aims at determining the probability of insolvency of a company using variables
related to management and control. Along this line many others credit scoring models
have been developed trying to add value to the previous ones. For instance, Hu and Ansell
(2007) analyze for the retailing sector the usefulness of the models for credit risk
evaluation. In this way, they compare four classical methodologies (Naïve Bayes, logistic
regression, recursive partitioning and artificial neuronal networks) with the Sequential
Minimal Optimization (SMO). They used a sample of 195 healthy companies and 51 that
went bankrupt between 1994 to 2002. The five methodologies behaved well in predicting
bankruptcy, in particular, one year before the event took place; moreover, it contrasts to
how it was possible to predict up to five years in advance the bankruptcy with a level of
accuracy superior to 78% and how none of these methodologies resulted to be superior in
this classification. This agrees with the previous results where it was posed as a sample
how bankruptcy prediction models have a predictive capacity of up to five years before a
company goes bankrupt and how it was expected that the closer we get to the bankruptcy
event the higher the predictive ability, so the values of the ratios deteriorate at a higher
intensity (Marín, Antón and Mondragón, 2011), (Amat, Antón and Manini, 2016). The
rest of this section will briefly describe some of the more interesting academic works
related to credits scoring. For instance, in Spain among the first appearances of credit
scoring techniques of automated valuation we can mention Bonilla, Olmeda and Puertas
(2003). As briefly mentioned before, many of the most relevant academic contributions
Credit Scoring for the Supermarket and Retailing Industry: Analysis and Application Proposal
79
in credit scoring research attempt to develop, compare and comment on the statistical
approaches to be used in order to obtain models yielding every time higher predictive
power. Bardos (1998) develops a credit scoring model based on linear discriminant
analysis after describing the tool used by the Central Bank of France to assess credit
concessions. Zhou, Lai and Yen (2009) compare the SVM (support vector machines)
technique with six traditional methods, concluding that the SVM approach yields better
results than the traditional techniques. On the other hand, Shu-Ting, Cheng and Hsieh
(2009) confirm the excellent results obtained with SVM, but they affirm that through the
CLC (Clustering-launched classification) better results can be achieved. Paleologo,
Elisseeff and Antonini (2010) compare the Subagging technique with other traditional
techniques concluding that the latter approach yields higher predictive power. A very
interesting contribution to the field of credit scoring, is Gutierrez (2008) who discusses
the application of non-parametric techniques in credit scoring. He develops a model based
on the Probit model and also comments on the dominance of parametric techniques in the
field. His opinion is that parametric techniques are the most used because they are easier
to apply and interpret. Antón (2007) shows how influential are the different decisions
regarding coefficients and variables for the final outcome of a credit scoring model.
Ochoa, Galeano and Agudelo (2010) adopt a discriminant analysis approach to develop
a credit scoring model which includes not only the statistical analysis of quantitative
variables, but also qualitative ones. The work mentioned so far, focuses mostly on
traditional techniques including LDA and Probit model. However, throughout the
development of the field, some researchers tried to develop models using more complex
techniques such as neuronal networks and decision trees. For example, the study of
Blanco, Pino-Mejías, Lara and Rayo (2013) uses neuronal networks. They develop
several credit scoring models for the microfinance sector using different techniques
including the linear discriminant analysis and the logistic regression. They base their
study on a sample of 5.500 loan applicants for a Peruvian microfinance institution,
concluding that for the microfinance sector, the results coming from neuronal networks
yield better results than those obtained applying traditional techniques. Given that the
main purpose of this paper is not to carefully review the existing literature in credit
scoring, some of the main contributions in the literature have just been briefly described
in order to give the reader a sense of the progresses and changes in general the field have
been going through. However, in case the reader is interested in deepening his knowledge

Raffaele Manini and Oriol Amat
80
of the field analyzing the existing credit scoring literature, a more detailed revision of
such works can be found in Allen, De Long and Sanders (2008) and more recently in
Abdou and Pointon (2011).
3. Methodology
As Amat, Antón and Manini (2016) this study has the aim of identifying a function which
discriminates the companies based on their ability of being solvent. Companies with
higher probability to meet their debt obligations will be considered solvent whereas
companies yielding lower a probability of meeting their debt obligations will be
considered insolvent. To do so, this paper will try to answer the following questions:
1) Which ratios better discriminate the companies based on their degree of solvency?
2) What is the relative importance of these ratios?
To answer these two questions, the authors decided to follow as faithfully as possible the
Altman (1968) approach.
4. Data
To perform the analysis, we use data coming from the SABI database focusing on
companies operating in the following industries:
1) Retail sale in non-specialized store (industry classification 471)
2) Retail sale of food, beverages and tobacco in specialized store (industry
classification 472)
Information are gathered on balance sheet information needed for building ratios from 1
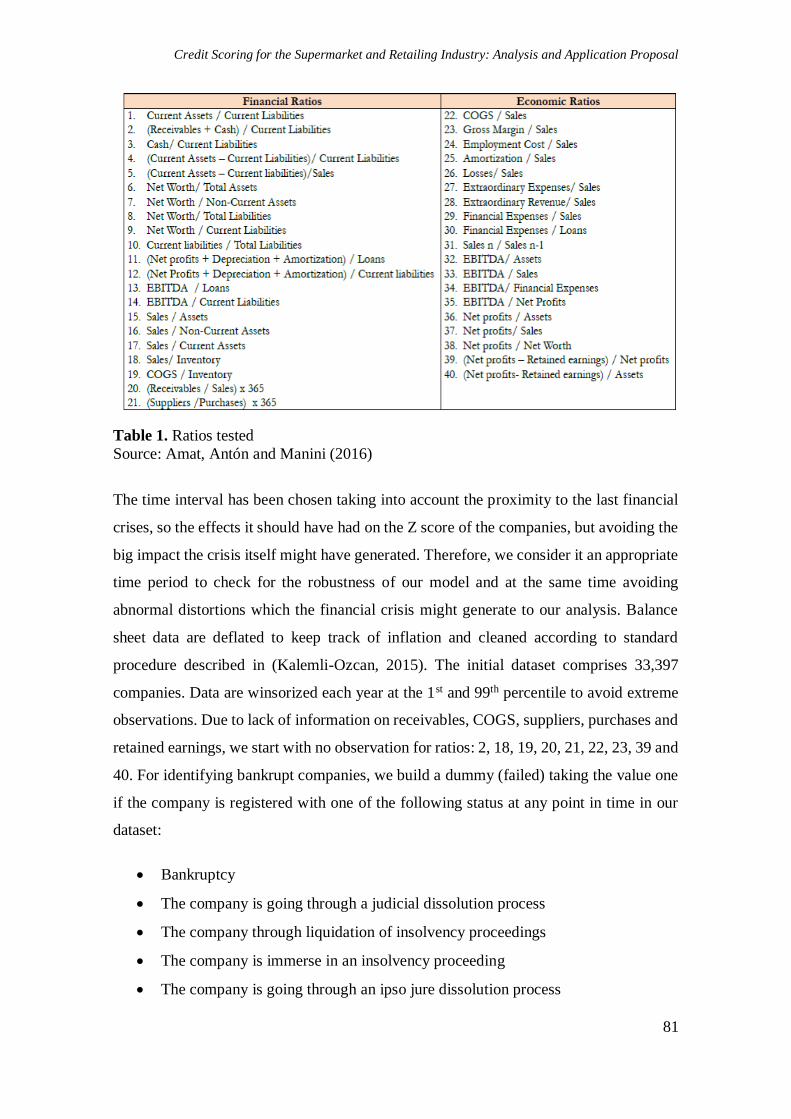
to 40* and related to the period 2005-2006. The choice of using these 40 ratios (see Table
1) reflects the aim of the authors to follow the Altman approach and to continue the work
started by Amat, Antón and Manini (2016).
Credit Scoring for the Supermarket and Retailing Industry: Analysis and Application Proposal
81
Table 1. Ratios tested
Source: Amat, Antón and Manini (2016)
The time interval has been chosen taking into account the proximity to the last financial
crises, so the effects it should have had on the Z score of the companies, but avoiding the
big impact the crisis itself might have generated. Therefore, we consider it an appropriate
time period to check for the robustness of our model and at the same time avoiding
abnormal distortions which the financial crisis might generate to our analysis. Balance
sheet data are deflated to keep track of inflation and cleaned according to standard
procedure described in (Kalemli-Ozcan, 2015). The initial dataset comprises 33,397
companies. Data are winsorized each year at the 1st and 99th percentile to avoid extreme
observations. Due to lack of information on receivables, COGS, suppliers, purchases and
retained earnings, we start with no observation for ratios: 2, 18, 19, 20, 21, 22, 23, 39 and
40. For identifying bankrupt companies, we build a dummy (failed) taking the value one
if the company is registered with one of the following status at any point in time in our
dataset:
• Bankruptcy
• The company is going through a judicial dissolution process
• The company through liquidation of insolvency proceedings
• The company is immerse in an insolvency proceeding
• The company is going through an ipso jure dissolution process
Raffaele Manini and Oriol Amat
82
• Insolvency proceedings
• Suspension of payments
Overall, we end up with 182 bankrupt companies. However, in the analysis will appear
only 100 companies because not every firm year entry in the dataset has information in
all remained ratios. Therefore, we select a subsample of companies with information for
most of the ratios and we will end up with 18 ratios for our final analysis. Basically, the
18 final ratios are those for which we have the most information available.
5. Analysis and Results
As mentioned previously, the sample of bankruptcy companies which will be used in the
analysis is of 100 observations. Also, this paper tries to be as faithful as possible to
Altman (1968). Hence, data about the bankruptcy companies refer to one year before the
bankruptcy. In order to identify the year of bankruptcy, we fix it as the last year for which
there are information on total assets, as data on timing of status are sparse and unreliable.
Due to the higher number of observation on active companies compared to bankruptcy
ones, we can choose those observations that best match the distribution of total assets
such as size in the spirit of Altman (1986). We do this by selecting for each bankrupt
company an active one with closest size in absolute terms. Therefore, our analysis will be
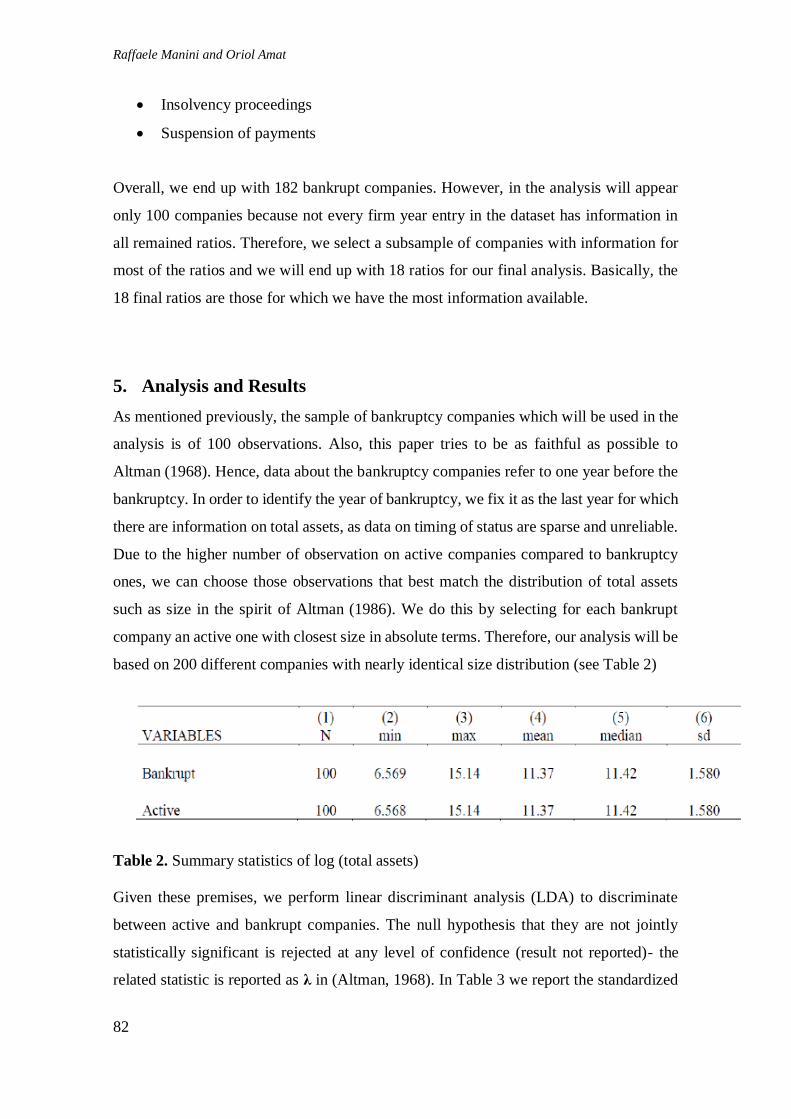
based on 200 different companies with nearly identical size distribution (see Table 2)
Table 2. Summary statistics of log (total assets)
Given these premises, we perform linear discriminant analysis (LDA) to discriminate
between active and bankrupt companies. The null hypothesis that they are not jointly
statistically significant is rejected at any level of confidence (result not reported)- the
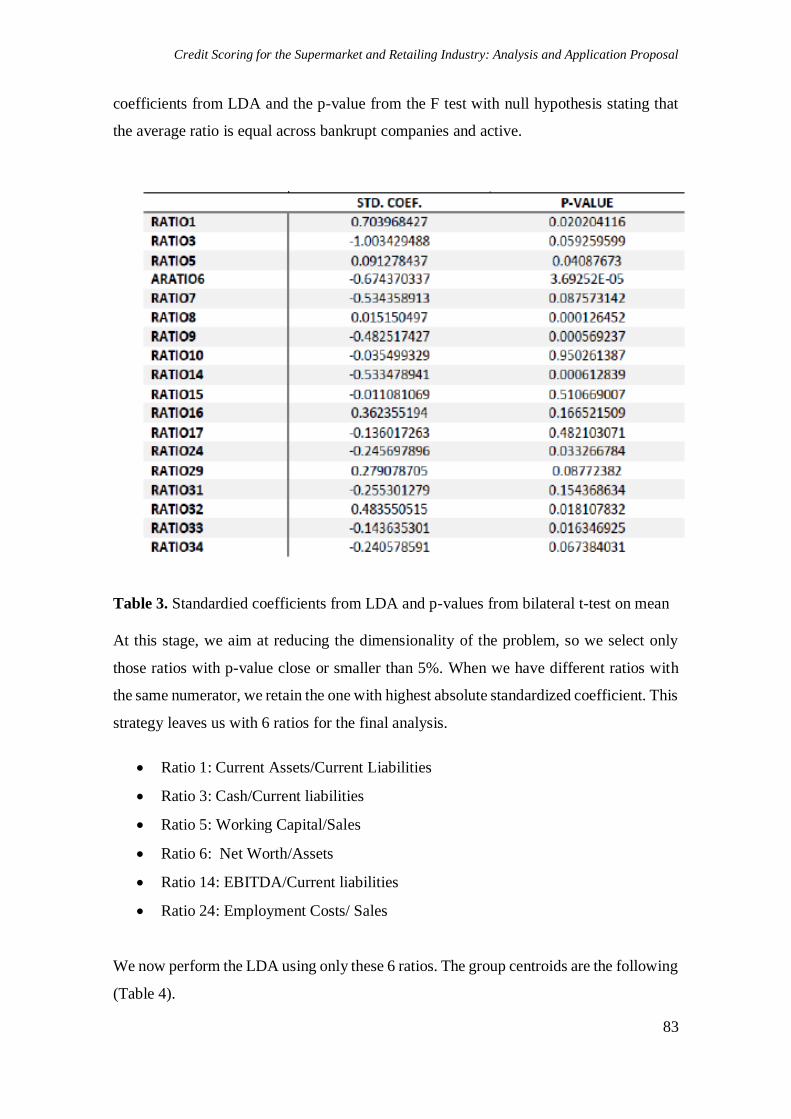
related statistic is reported as λ in (Altman, 1968). In Table 3 we report the standardized
Credit Scoring for the Supermarket and Retailing Industry: Analysis and Application Proposal
83
coefficients from LDA and the p-value from the F test with null hypothesis stating that
the average ratio is equal across bankrupt companies and active.
Table 3. Standardied coefficients from LDA and p-values from bilateral t-test on mean
At this stage, we aim at reducing the dimensionality of the problem, so we select only
those ratios with p-value close or smaller than 5%. When we have different ratios with
the same numerator, we retain the one with highest absolute standardized coefficient. This
strategy leaves us with 6 ratios for the final analysis.
• Ratio 1: Current Assets/Current Liabilities
• Ratio 3: Cash/Current liabilities
• Ratio 5: Working Capital/Sales
• Ratio 6: Net Worth/Assets
• Ratio 14: EBITDA/Current liabilities
• Ratio 24: Employment Costs/ Sales
We now perform the LDA using only these 6 ratios. The group centroids are the following
(Table 4).

Raffaele Manini and Oriol Amat
84
Table 4. Group centroids
Again, the λ statistic implies that the ratios are jointly significant at any level of
significance. Notice that the negative centroid for active firms means that an increase in
a given ratio implies a reduction of the probability of bankruptcy if the related
standardized coefficient is negative and an increase if positive. The final Z function
considering standardized coefficients as in Table 3 is the following:
Z= 0.103 * Ratio1 - 0.671 * Ratio3 - 0.079 * Ratio5 - 0.460 * Ratio6 -0.692 * Ratio14
+ 0.273 * Ratio24
A high level of EBITDA/Current Liabilities (Ratio 14) and Cash/Current Liabilities
(Ratio 3) are the best predictor of firms that are not bankrupt against those that are. The
classification is the following (Table 5).
Table 5. Classification between active and failed companies using the algorithm
Hence our algorithm correctly identifies 62% of bankruptcy companies and 71% of active
companies. As a further check, we apply the algorithm to bankrupt firms in the sample 2
and 3 years before the bankruptcy. The results are described as follows (Table 6 and Table
7).
Credit Scoring for the Supermarket and Retailing Industry: Analysis and Application Proposal
85
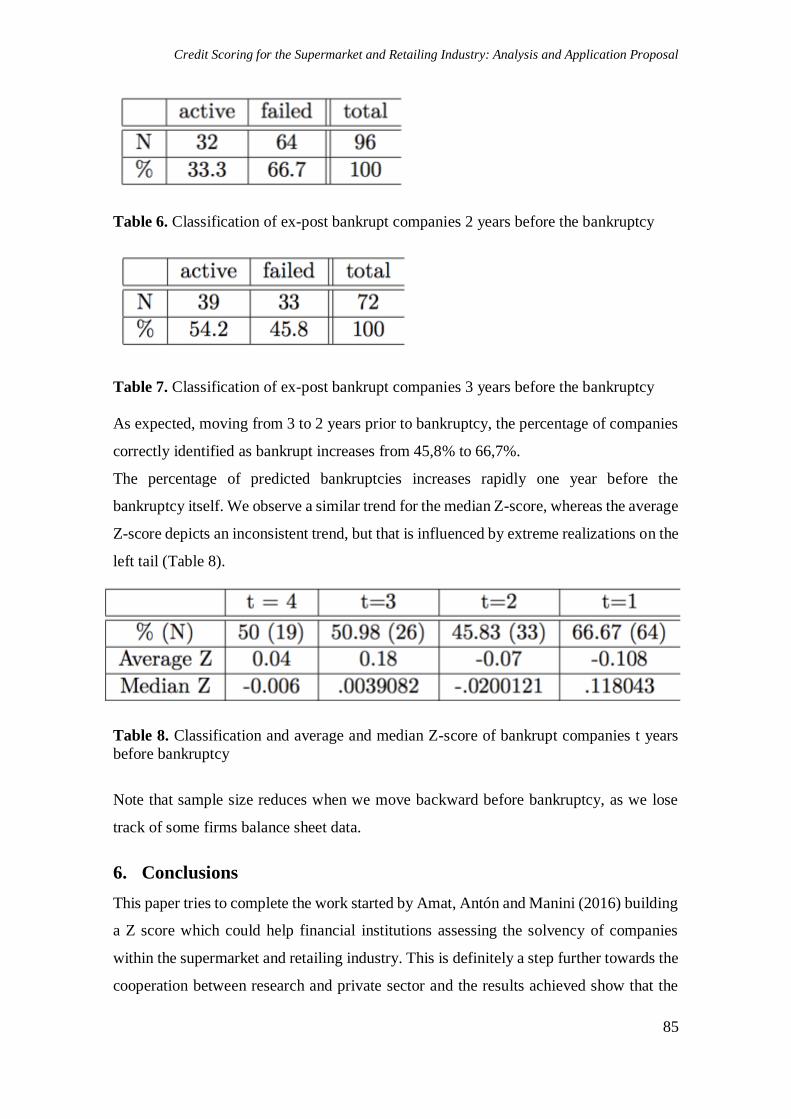
Table 6. Classification of ex-post bankrupt companies 2 years before the bankruptcy
Table 7. Classification of ex-post bankrupt companies 3 years before the bankruptcy
As expected, moving from 3 to 2 years prior to bankruptcy, the percentage of companies
correctly identified as bankrupt increases from 45,8% to 66,7%.
The percentage of predicted bankruptcies increases rapidly one year before the
bankruptcy itself. We observe a similar trend for the median Z-score, whereas the average
Z-score depicts an inconsistent trend, but that is influenced by extreme realizations on the
left tail (Table 8).
Table 8. Classification and average and median Z-score of bankrupt companies t years
before bankruptcy
Note that sample size reduces when we move backward before bankruptcy, as we lose
track of some firms balance sheet data.
6. Conclusions
This paper tries to complete the work started by Amat, Antón and Manini (2016) building
a Z score which could help financial institutions assessing the solvency of companies
within the supermarket and retailing industry. This is definitely a step further towards the
cooperation between research and private sector and the results achieved show that the
Raffaele Manini and Oriol Amat
86
model is fairly reliable considering some limitations such as industry specificity. In fact
this particular model is meant only for the supermarket and retailing industry. The
geographical location of the companies analyzed, in fact the sample analyzed belong
mostly to the Spanish market. Lastly, the methodology applied is a traditional one which
is still the guideline within the credit scoring applications, but it is clear that academic
research in credit scoring is trying to go other ways exploiting the growing knowledge on
applied statistics and big data. Finally, some limitations can be considered. For example,
this study focuses on companies within the Spanish market operating in a very specific
industry field. Moreover, the statistical approach of the study follows the structure of both
Altman (1968) and Amat, Antón and Manini (2016).
Credit Scoring for the Supermarket and Retailing Industry: Analysis and Application Proposal
87
REFERENCES
Abdou, H.A., and Pointon, J. (2011). Credit Scoring, statistical techniques and evaluation
criteria: A review of the literature. Intelligent System in Accounting, Finance and
Management, 18, 59-88. https://doi.org/10.1002/isaf.325
Allen, L., De Long, G., and Saunders, A. (2004). Issues in credit risk modeling of retail
markets. Journal of Banking and Finance, 28, 727-752. https://doi.org/10.1016/S0378-
4266(03)00197-3
Altman, E. (1968). Financial ratios, discriminant analysis and the prediction of corporate
Bankruptcy. Journal of Finance, 23(4)., 589-609. https://doi.org/10.1111/j.1540-
6261.1968.tb00843.x
Amat, O., Antón, M., Manini, R. (2016). Credit Concession Through Credit Scoring.
Analysis and Application proposal. Intangible Capital, 12(6), 1967-9818.
http://dx.doi.org/10.3926/ic.903
Amat, O., Pujadas, P., and Lloret, P. (2012). Análisis de Operaciones de Crédito.
Barcelona: Profit Editorial.
Anderson, R. (2007). The Credit Scoring Toolkit: Theory and practice for retail credit
risk management and decision automation. New York: Oxford University Press.
Antón, M. (2007). Una propuesta alternativa en la valoración del riesgo de fracaso
empresarial mediante la elaboración y aplicación a priori de modelos de predicción de
alerta de crisis. Revista de Contabilidad y Tributación CEF, (288), 111-162.
Argenti, J. (1983). Predicting Corporate Failure, Institute of Chartered Accountants in
English and Wales. Accountants Digest, 138, 1-25.
Arimany, N., and Viladecans, C. (2015). Analysis of the cash flow statement’s usefulness:
An empirical study. European Accounting and Management Review, 1, 75-100.
https://doi.org/10.2139/ssrn.2737292
Bardos, M. (1998). Detecting the risk of company failure at Banque de France. Journal
of Banking and Finance, 10-11, 1405-1419. https://doi.org/10.1016/S0378-
4266(98)00062-4
Blanco, A., Pino-Mejías, R., Lara, J., and Rayo, S. (2013). Credit scoring models for the
microfinance industry using neural networks: Evidence from Peru. Expert Systems with
Applications, 40, 356-364. https://doi.org/10.1016/j.eswa.2012.07.051
Bonilla, M, Olmeda, I., and Puertas, R. (2003). Modelos paramétricos y no paramétricos
en problemas de Credit Scoring. Revista Española de Financiación y Contabilidad,
118(32), 833-869. https://doi.org/10.1080/02102412.2003.10779502
De Young, R., Glennon, D., and Nigro, P. (2008). Borrower-lender distance, credit
scoring, and loan performance: Evidence from International-opaque small business
Raffaele Manini and Oriol Amat
88
borrowers. Journal of Financial Intermediation, 17, 113-143.
https://doi.org/10.1016/j.jfi.2007.07.002
Gutiérrez, M.A. (2008). Anatomía de los modelos de credit scoring. Ensayos Económicos
BCRA, 50, 61-96.
Hand, D.J., and Jacka, S.D. (1998). Statistics in Finance. London: Arnold.
Hu, Y., and Ansell, J. (2007). Measuring retail company performance using credit scoring
techniques. European Journal of Operational Research, 183, 1595-1606.
https://doi.org/10.1016/j.ejor.2006.09.101
Kalemli-Ozcan, S., Sorensen, B., Villegas-Sanchez, C., Volosovych, V., Sevecan, Y.
(2015). How to Construct Nationally Representative Firm Level data from the ORBIS
Global Database NBER Working Papers 21558, National Bureau of Economic Research,
Inc.
Luo, S., Cheng, B., and Hsieh, C. (2009). Prediction model building with clustering-
launched classification and support vector machines in credit scoring. Expert Systems
with Applications, 36, 7562-7566. https://doi.org/10.1016/j.eswa.2008.09.028
Marín, S., Antón, M., and Mondragón, Z. (2011). Crisis bancarias, información financiera
y modelos de predicción: Estudio de un caso. GCG: Revista de Globalización,
Competitividad y Gobernabilidad, 5, 32-41.
Ochoa, J.C., Galeano, W., and Agudelo, L.G. (2010). Construcción de un modelo de
scoring para el otorgamiento de crédito en una entidad financiera. Perfil de Coyuntura
Económica, 16, 191-222.
Paleologo, G., Elisseeff, A., and Antonini, G. (2010). Subagging for credit scoring
models. European Journal of Operational Research, 201, 490-499.
https://doi.org/10.1016/j.ejor.2009.03.008
Schreiner, M. (2002). Ventajas y desventajas del scoring estadístico para las
microfinanzas. Microfinance Risk Management, Washington University in St. Louis, 1-
40.
Schreiner, M. (2004). Scoring arrears at a Microlender in Bolivia. Journal of
Microfinance, 6(2), 65-88.
Zhou, L., Lai, K., and Yen, J. (2009). Credit scoring models with AUC maximization
based on weighted SVM. International Journal of Information and Decision Making,
8(4), 677-696. https://doi.org/10.1142/S0219622009003582