Embed Size (px)
Citation preview
Supplementary Figure 1
Nucleotide distance to the outgroup (S. verrucosus).
Each circle represents the mean distance computed in 10-kb windows across the genome. The dashed lines correspond to ±1 s.d. of the mean distance computed across all individuals.
Nature Genetics: doi:10.1038/ng.3394
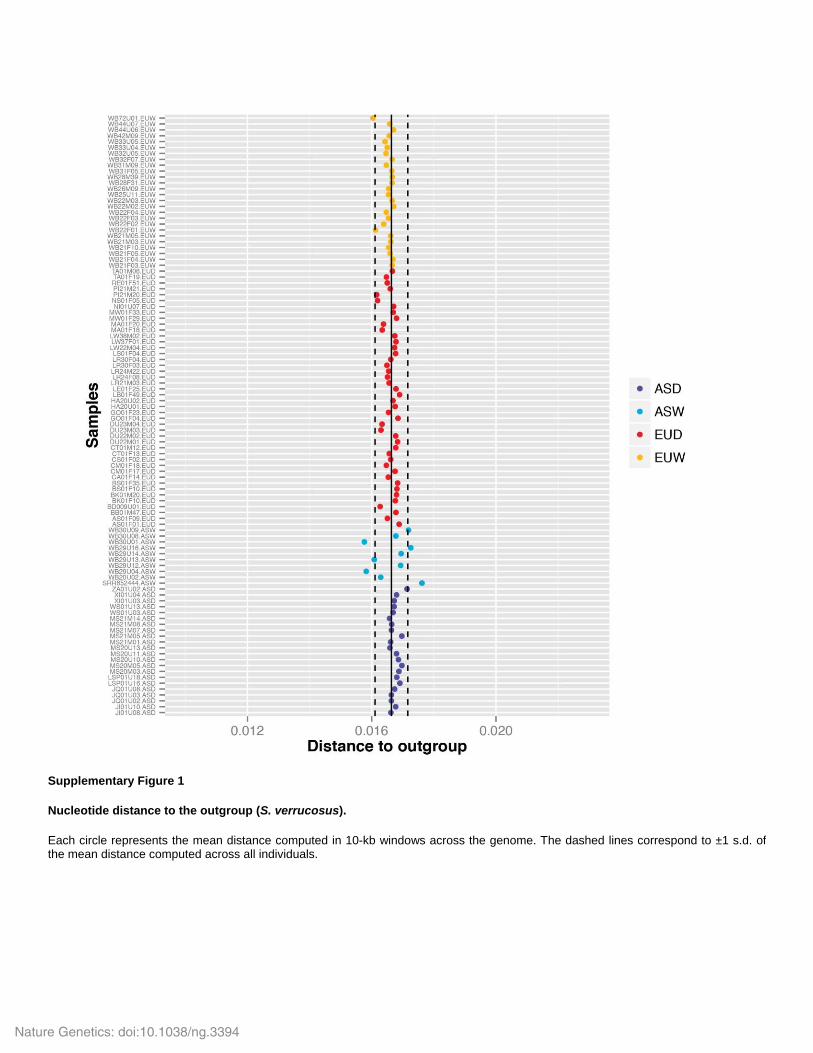
Supplementary Figure 2
All models investigated in this study.
Schematic of all models tested in this study. The upper six models were first compared together. In this comparison, the full model (outlined with a gray square) was the best-fitting model. When all seven models were tested together, the ghost model had the best fit (outlined with a black square). All priors and support values are reported in Supplementary Table 5.
Nature Genetics: doi:10.1038/ng.3394
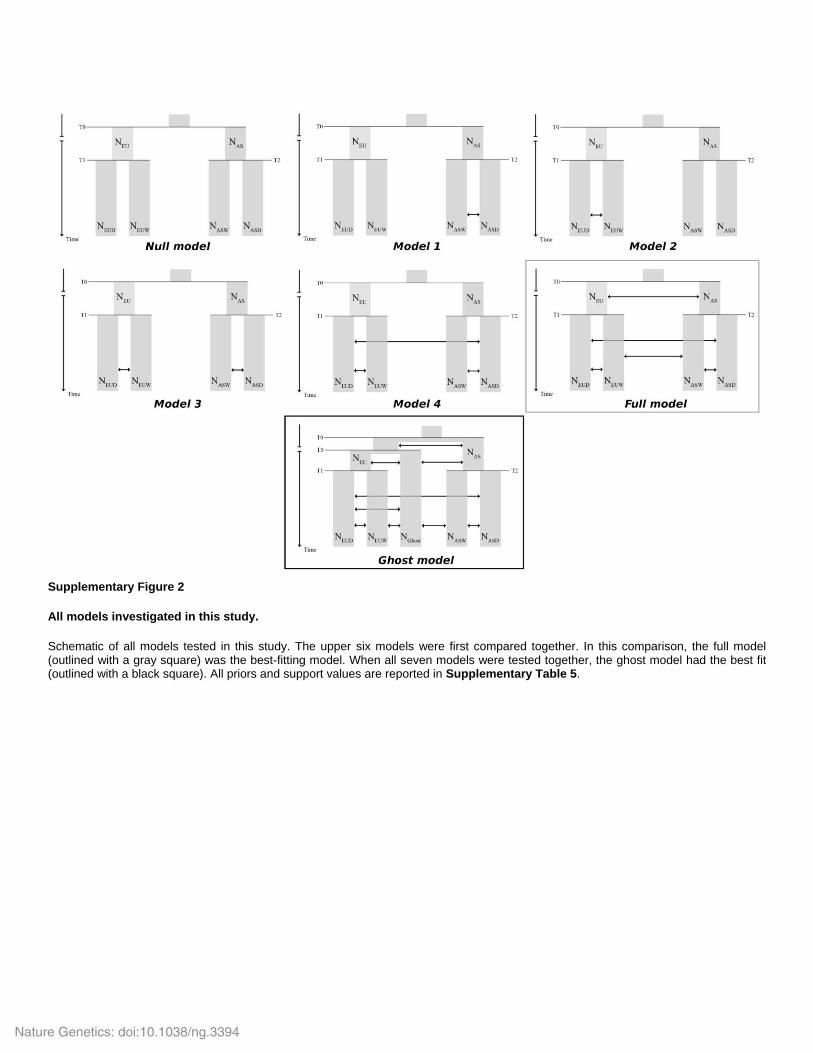
Supplementary Figure 3
Distribution of raw summary statistics under the full and null models.
The dashed red line represents the value of the observed summary statistic. S_mean, mean number of segregating sites; n1, number
of singletons; thetaPi, θ; tajd, Tajima’s D.
Nature Genetics: doi:10.1038/ng.3394
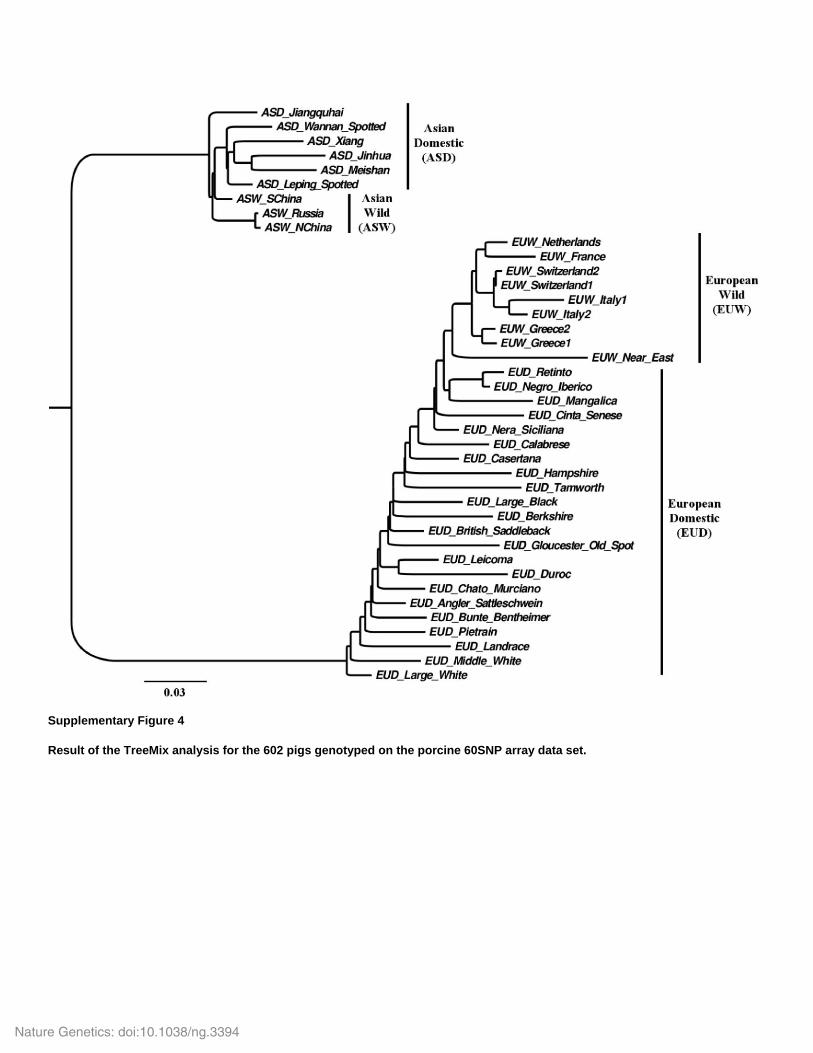
Supplementary Figure 4
Result of the TreeMix analysis for the 602 pigs genotyped on the porcine 60SNP array data set.
Nature Genetics: doi:10.1038/ng.3394
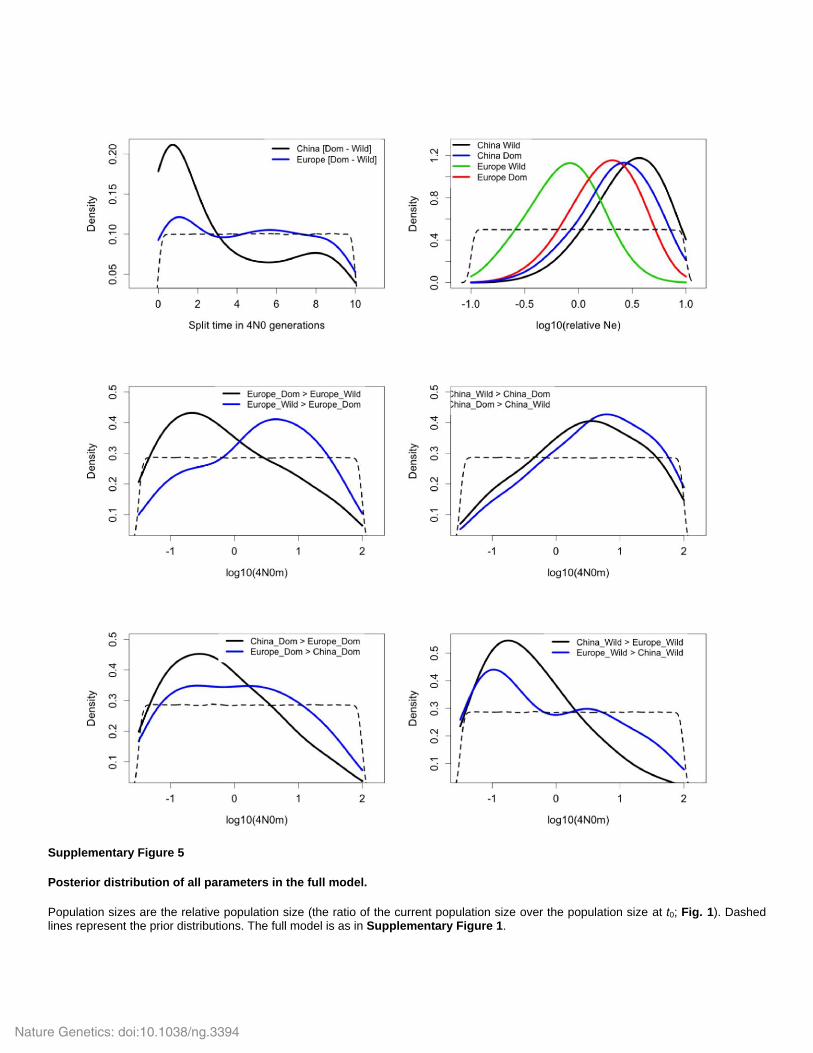
Supplementary Figure 5
Posterior distribution of all parameters in the full model.
Population sizes are the relative population size (the ratio of the current population size over the population size at t0; Fig. 1). Dashed lines represent the prior distributions. The full model is as in Supplementary Figure 1.
Nature Genetics: doi:10.1038/ng.3394
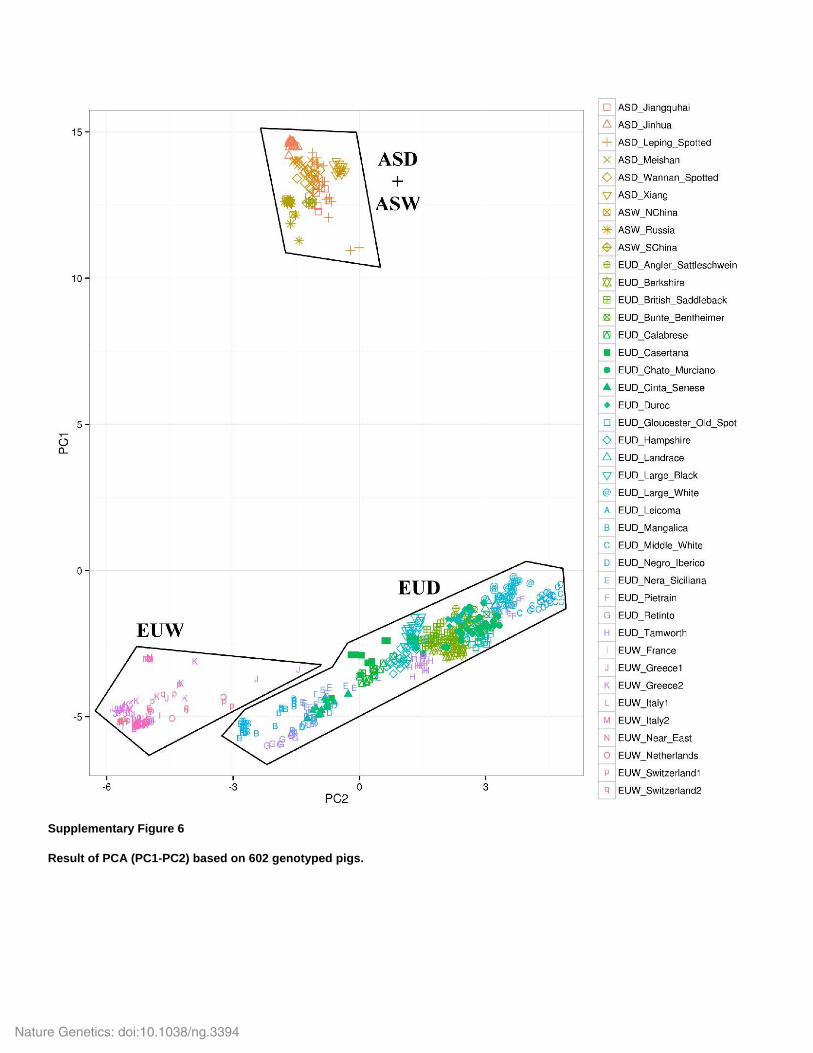
Supplementary Figure 6
Result of PCA (PC1-PC2) based on 602 genotyped pigs.
Nature Genetics: doi:10.1038/ng.3394
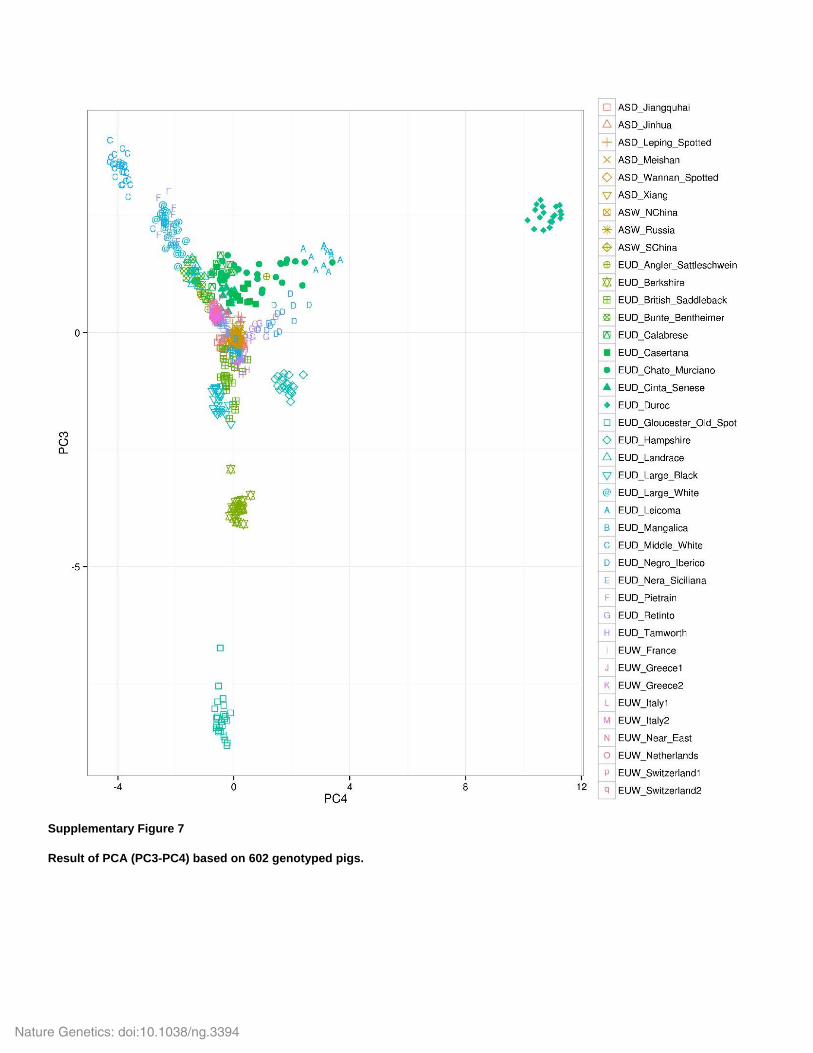
Supplementary Figure 7
Result of PCA (PC3-PC4) based on 602 genotyped pigs.
Nature Genetics: doi:10.1038/ng.3394
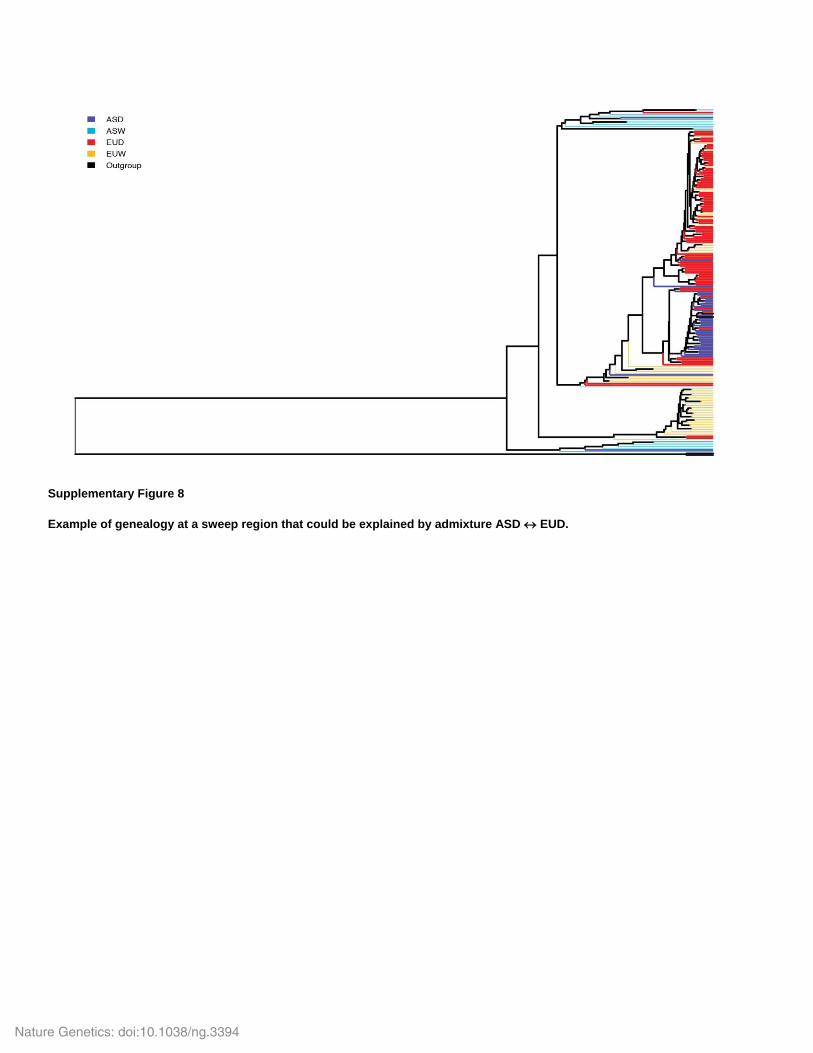
Supplementary Figure 8
Example of genealogy at a sweep region that could be explained by admixture ASD EUD.
Nature Genetics: doi:10.1038/ng.3394
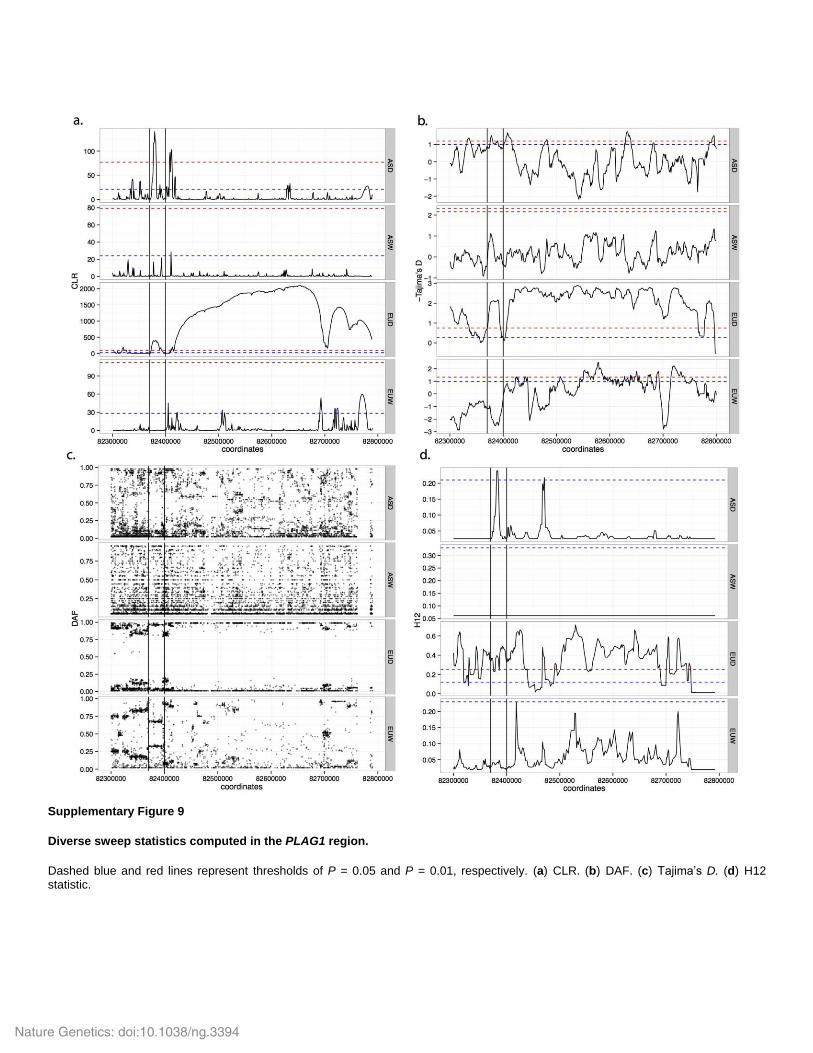
Supplementary Figure 9
Diverse sweep statistics computed in the PLAG1 region.
Dashed blue and red lines represent thresholds of P = 0.05 and P = 0.01, respectively. (a) CLR. (b) DAF. (c) Tajima’s D. (d) H12 statistic.
Nature Genetics: doi:10.1038/ng.3394
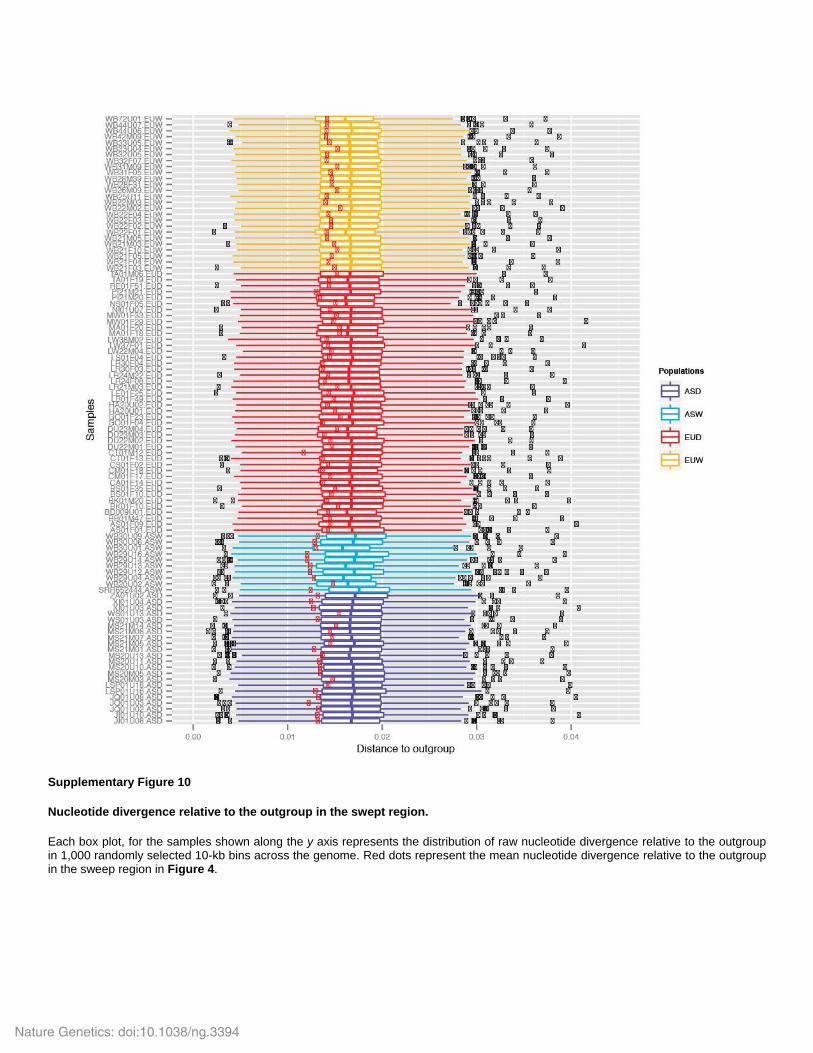
Supplementary Figure 10
Nucleotide divergence relative to the outgroup in the swept region.
Each box plot, for the samples shown along the y axis represents the distribution of raw nucleotide divergence relative to the outgroup in 1,000 randomly selected 10-kb bins across the genome. Red dots represent the mean nucleotide divergence relative to the outgroup in the sweep region in Figure 4.
Nature Genetics: doi:10.1038/ng.3394
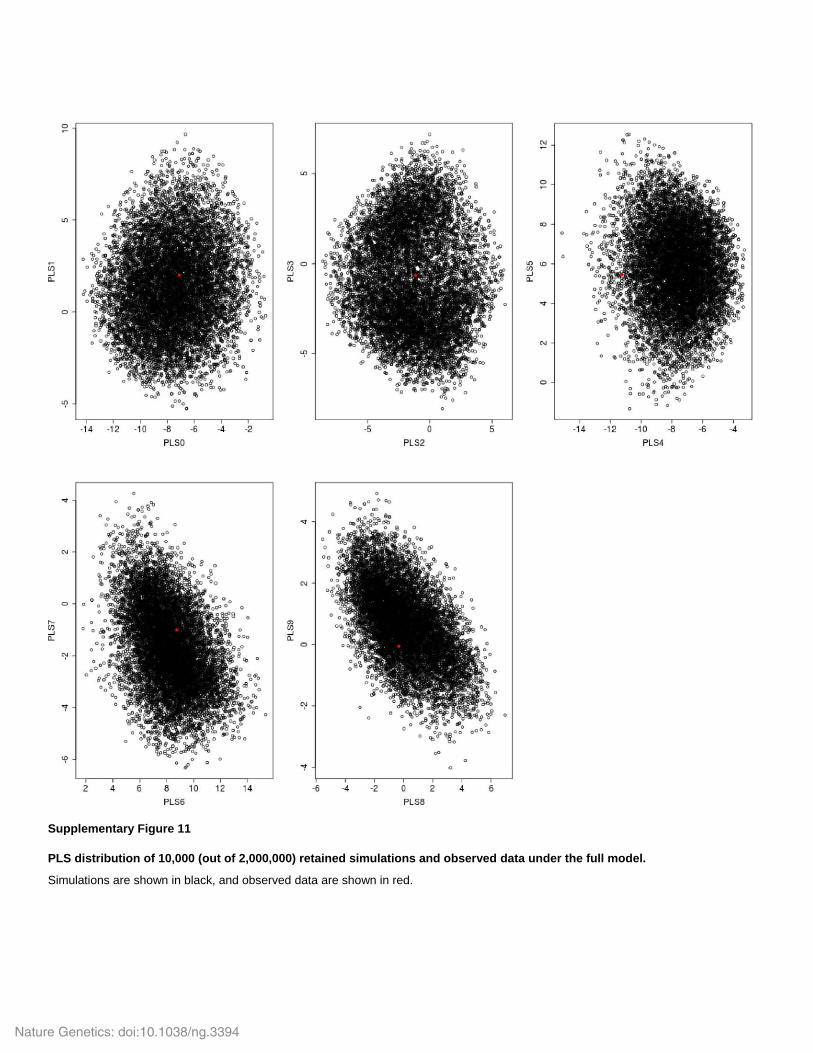
Supplementary Figure 11
PLS distribution of 10,000 (out of 2,000,000) retained simulations and observed data under the full model.
Simulations are shown in black, and observed data are shown in red.
Nature Genetics: doi:10.1038/ng.3394
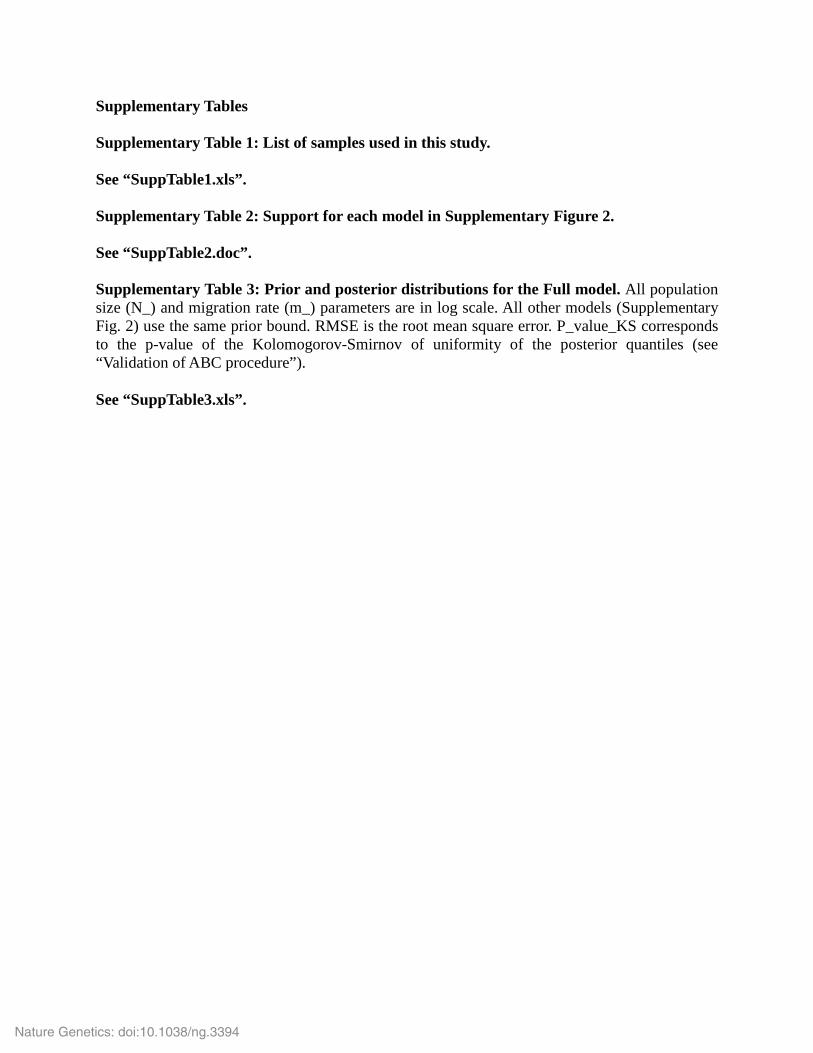
Supplementary Tables Supplementary Table 1: List of samples used in this study. See “SuppTable1.xls”. Supplementary Table 2: Support for each model in Supplementary Figure 2. See “SuppTable2.doc”. Supplementary Table 3: Prior and posterior distributions for the Full model. All population size (N_) and migration rate (m_) parameters are in log scale. All other models (Supplementary Fig. 2) use the same prior bound. RMSE is the root mean square error. P_value_KS corresponds to the p-value of the Kolomogorov-Smirnov of uniformity of the posterior quantiles (see “Validation of ABC procedure”). See “SuppTable3.xls”.
Nature Genetics: doi:10.1038/ng.3394
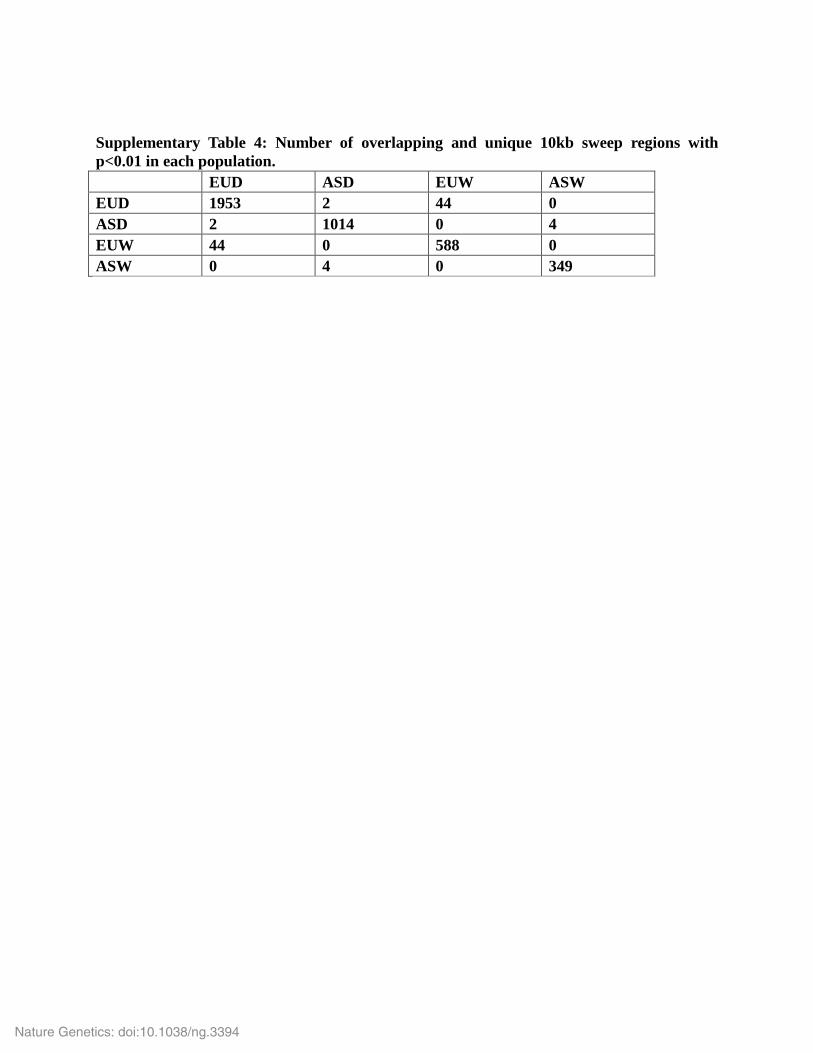
Supplementary Table 4: Number of overlapping and unique 10kb sweep regions with p<0.01 in each population. EUD ASD EUW ASW EUD 1953 2 44 0 ASD 2 1014 0 4 EUW 44 0 588 0 ASW 0 4 0 349
Nature Genetics: doi:10.1038/ng.3394
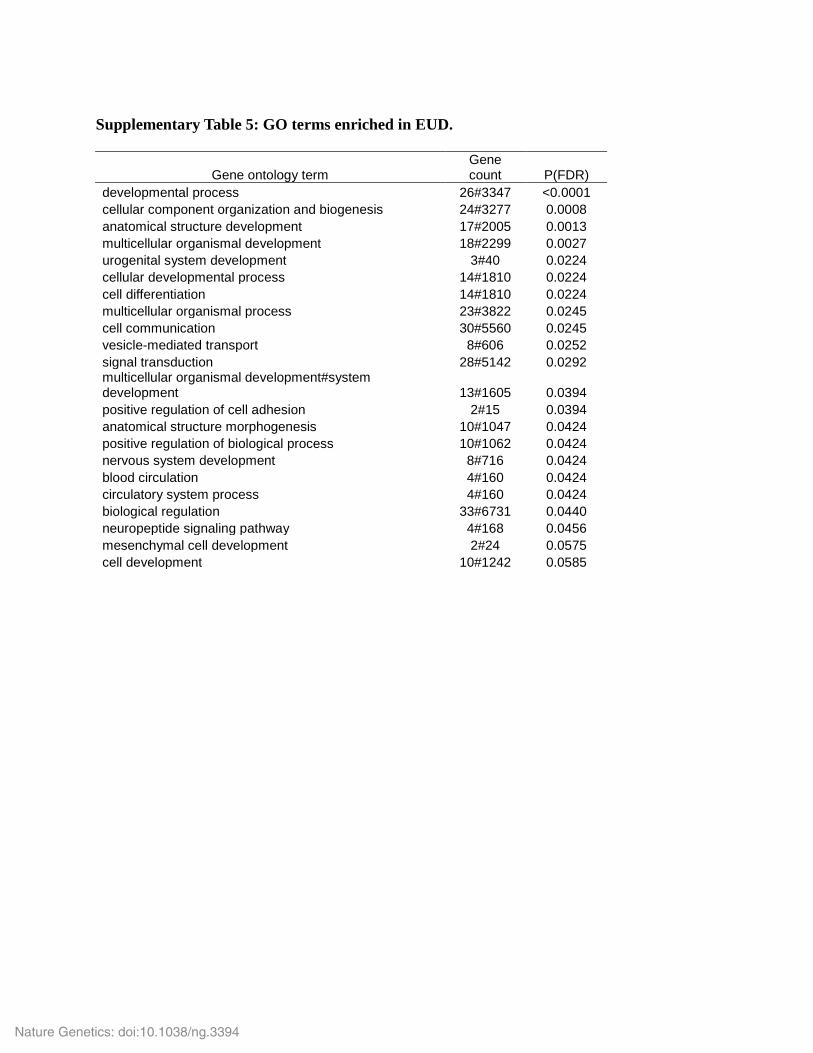
Supplementary Table 5: GO terms enriched in EUD.
Gene ontology term
Gene count P(FDR)
developmental process 26#3347 <0.0001 cellular component organization and biogenesis 24#3277 0.0008 anatomical structure development 17#2005 0.0013 multicellular organismal development 18#2299 0.0027 urogenital system development 3#40 0.0224 cellular developmental process 14#1810 0.0224 cell differentiation 14#1810 0.0224 multicellular organismal process 23#3822 0.0245 cell communication 30#5560 0.0245 vesicle-mediated transport 8#606 0.0252 signal transduction 28#5142 0.0292 multicellular organismal development#system development 13#1605 0.0394 positive regulation of cell adhesion 2#15 0.0394 anatomical structure morphogenesis 10#1047 0.0424 positive regulation of biological process 10#1062 0.0424 nervous system development 8#716 0.0424 blood circulation 4#160 0.0424 circulatory system process 4#160 0.0424 biological regulation 33#6731 0.0440 neuropeptide signaling pathway 4#168 0.0456 mesenchymal cell development 2#24 0.0575 cell development 10#1242 0.0585
Nature Genetics: doi:10.1038/ng.3394
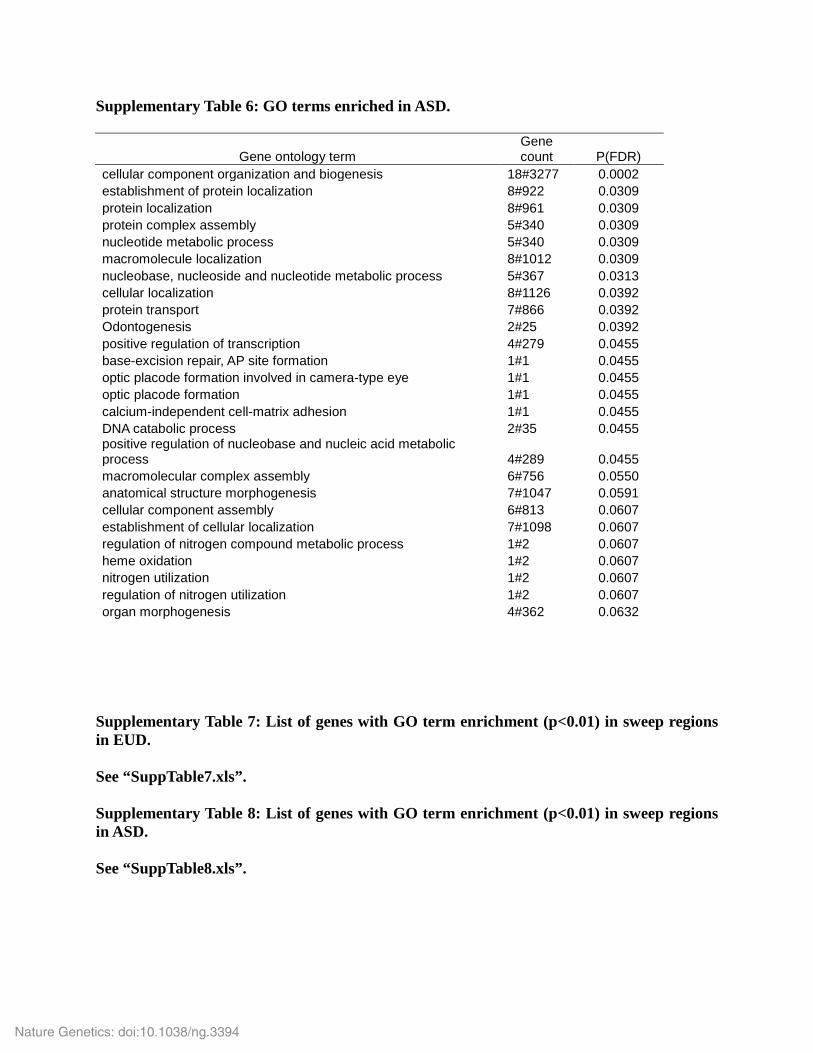
Supplementary Table 6: GO terms enriched in ASD.
Gene ontology term
Gene count P(FDR)
cellular component organization and biogenesis 18#3277 0.0002 establishment of protein localization 8#922 0.0309 protein localization 8#961 0.0309 protein complex assembly 5#340 0.0309 nucleotide metabolic process 5#340 0.0309 macromolecule localization 8#1012 0.0309 nucleobase, nucleoside and nucleotide metabolic process 5#367 0.0313 cellular localization 8#1126 0.0392 protein transport 7#866 0.0392 Odontogenesis 2#25 0.0392 positive regulation of transcription 4#279 0.0455 base-excision repair, AP site formation 1#1 0.0455 optic placode formation involved in camera-type eye 1#1 0.0455 optic placode formation 1#1 0.0455 calcium-independent cell-matrix adhesion 1#1 0.0455 DNA catabolic process 2#35 0.0455 positive regulation of nucleobase and nucleic acid metabolic process 4#289 0.0455 macromolecular complex assembly 6#756 0.0550 anatomical structure morphogenesis 7#1047 0.0591 cellular component assembly 6#813 0.0607 establishment of cellular localization 7#1098 0.0607 regulation of nitrogen compound metabolic process 1#2 0.0607 heme oxidation 1#2 0.0607 nitrogen utilization 1#2 0.0607 regulation of nitrogen utilization 1#2 0.0607 organ morphogenesis 4#362 0.0632
Supplementary Table 7: List of genes with GO term enrichment (p<0.01) in sweep regions in EUD. See “SuppTable7.xls”. Supplementary Table 8: List of genes with GO term enrichment (p<0.01) in sweep regions in ASD. See “SuppTable8.xls”.
Nature Genetics: doi:10.1038/ng.3394
Supplementary Note Quality of re-sequencing data
We assessed the presence of outliers in our data that could influence our ABC analysis (see
below). To investigate this issue we computed, for each sample, the average nucleotide distance
to the outgroup (Supplementary Fig. 1). We computed the number of fixed derived sites
(homozygous derived) and segregating derived sites (heterozygous derived) divided by the total
number of sites in the genome, avoiding CpG islands (Tortereau et al. 2012) and repetitive
elements in 10kb windows. We then computed the mean distance (across all 10kb windows) in
each individual and the mean and standard deviation across all individuals. The results of this
analysis are presented in Supplementary Fig. 1. This figure demonstrates the absence of strong
outliers in EUD, EUW and ASD. However, some samples in the ASW group have a mean
divergence lower or higher than other samples (Supplementary Fig. 1). This is most likely the
result of different degree of heterozygosity (Bosse et al. 2012) and/or admixture with the
outgroup (Frantz et al. 2013; Ai et al. 2015). Thus, this analysis shows that while all other
populations included in the analysis are homogeneous, the ASW are not. This is not surprising
given the ancestry of these populations and the possible admixture from ancient species (Frantz
et al. 2013; Ai et al. 2015; Frantz et al. 2014). We also performed a Principal Component
Analysis (PCA) as implemented in flashpca (Abraham & Inouye 2014) using 500,000 randomly
selected SNPs (with a 100kb minimum distance between SNPs). The SNPs were ascertained in
all populations (Fig. 2a). We also repeated this analysis but with 500,00 SNPs ascertained in
ASD+ASW (Fig. 2c) and EUD+EUW (Fig. 2d). This analysis further supports the heterogeneity
of ASW (Fig 2c.) but does not support the existence of strong outliers in our data set.
Populations for ABC analysis
To test for reproductive isolation between wild and domestic pigs since domestication, we assess
the posterior probability of various models using Approximate Bayesian Computation (ABC; see
below). For the ABC analysis we pooled multiple individuals from different ancestry (see below)
into four populations: European domestics (EUD), European wild (EUW), Asian domestics
(ASD) and Asian wild (ASW). Our PCA analysis (Fig. 2) shows that there here is some genetic
differentiation between wild and domestic populations (Fig. 2). To further test this we ran an
ADMIXTURE analysis (Alexander et al. 2009), to estimate the optimum number of clusters (K)
Nature Genetics: doi:10.1038/ng.3394
in our data set. The analysis was performed on the same 500,000 randomly chosen SNPs as for
the PCA (see above). We used a 5-fold cross-validation procedure to test the fit K=1 to K=10
clusters to the data. We found K=4 minimize the cross-validation error, and hence to be the
optimum number of clusters (Fig. 3). The result of this analysis shows that wild populations were
all well defined, while domestic populations shared significant amounts of ancestry with wild
populations (Fig. 3). The domestic individual with the most shared ancestry with EUW are from
the non-commercial breeds Mangalica, Cassertana, Chato Murciano, Retinto and Negro Iberico
(Fig. 3; Supplementary Table 1).
ABC
102 genomes were used for the ABC analysis. Simulations were performed on 100 10kbp
unlinked loci. To match these simulations we filtered out 10kb loci with more than 10% missing
data (from the variant calling step) in all 104 genomes. We also filtered out any loci containing
CpG islands and within 100kb of coding sequences. We then required that all loci were separated
by at least 100kb to limit the effect of linkage. We polarized mutations using the genome of a
Java Warty pig (S. verrucosus) (Frantz et al. 2013). Lastly we randomly selected 100 loci that
met these criteria. Backward coalescent simulations with recombination were performed using
ms (Hudson 2002) under 7 models (Supplementary Fig. 2). Supplementary Table 3 recapitulates
the priors used for the model parameters. For model testing purposes, we ran 200,000
simulations per model. For each simulation we computed summary statistics, solely based on
allele frequency to avoid phasing issues, using libsequence (Thornton 2003). For each
population, we computed the number of segregating sites (S), number of private mutations (n1),
nucleotide diversity (pi), ThetaW, ThetaH, Tajima’s D, and Fay and Wu’s H. In addition, we
computed Fst as well as all other statistics for each pair of populations. For model testing we
choose a set of informative summary statistics with a Partial Least Squares Discriminant
Analysis as in (Peter et al. 2012) using the 'plsda' function in R (Lê Cao et al. 2009). We
compared all models simultaneously using a standard ABC-GLM approach as implemented in
ABCtoolbox (Wegmann et al. 2010).
For parameters inference we ran 2,000,000 simulations under the full migration model (Fig 1a;
Supplementary Fig. 2). We did not use the ghost model for parameter inference because of the
higher number of parameters in this model (6 extra: 1 Ne, 1 time, 4 migrations) that increases
Nature Genetics: doi:10.1038/ng.3394
parameter space. Moreover, given we have no data about this ghost population, these parameters
cannot be accurately estimated with the current approach (Hammer et al. 2011). We extracted 10
Partial Least Square (PLS) components from the 93 summary statistics in the observed and
simulated data (Wegmann et al. 2009; Supplementary Fig. 11). We retained a total of 10,000
simulations closest to the observed data and applied a standard ABC-GLM (Leuenberger &
Wegmann 2010). We checked for bias in the prior using 1,000 pseudo observed data (POD) sets
with known parameters value (Wegmann & Excoffier 2010). We then computed the coverage
properties of the posterior distribution using our 10,000 closets simulations. Uniformity was
assessed using a classical Kolmogorov-Smirnov test for each parameter independently
(Wegmann & Excoffier 2010) (Supplementary Table 3). We evaluated the power of our approach
to infer each parameter using the 1,000 POD by computing root mean square error of the mode
(RMSEmode; Supplementary Table 3) for known parameters (Wegmann & Excoffier 2010). In
order to check if the data is in agreement with the assumed model we computed the distribution
of the marginal densities of the 10,000 retained simulations for posterior estimation and
computed the fraction of simulation with smaller marginal densities than the observed data set
(Wegmann & Excoffier 2010).
Validation of ABC procedure
To validate our model testing procedure, we used 1,000 pseudo-observed datasets (POD). We
found that our approach can recover the right model for 899 out of 1,000 POD. In addition, we
found that under all models but model 4, the full model and the ghost model (Supplementary Fig.
2), all retained simulation had higher marginal likelihood than the observed data for all models.
This suggests that these models provided a very poor fit to this genomic dataset. In contrast, we
found that the fraction of simulation with lower marginal likelihood was 0.009 for model 4,
0.043 for the full model and 0.1 for the ghost model. This suggests that these models are capable
of reproducing the observed summary statistics (10 PLS components; Supplementary Table 3)
(Peter et al. 2012; Wegmann & Excoffier 2010). We also used 1,000 POD under the full model to
check for biased prior during parameter estimation. To do so, we checked the uniformity of the
posterior quantile distribution using a Kolomogorov-Smirnov test for each parameter (see above)
as suggested by (Wegmann et al. 2009). We found that most parameter had a uniform distribution
(Supplementary Table 3). Lastly, we also checked if the raw summary statistics were consistent
Nature Genetics: doi:10.1038/ng.3394
with the simulations. To do so, we plotted the distribution of multiple summary statistics
obtained from the 10,000 closest simulations retained from the model testing procedure under the
null and full model (Supplementary Fig. 2). All observed summary statistics fell within the
distribution of the simulated data (Supplementary Fig. 3). In addition, in most case the observed
summary statistics were closer to the summary statistics simulated under the full model than the
null model (Supplementary Fig. 3). Some of the summary statistics were more informative than
others (i.e. Fst is more informative S [number of segregating sites] or n1 [number of singletons];
Supplementary Fig. 3).
Ancestry of wild and domestic pigs
To further support our claim of gene-flow between wild and domestic pigs, we assessed the
ancestry of our populations using 622 pigs from the same populations as above, that were
genotyped using the Porcine SNP60 array (Supplementary Table 1; (Ramos et al. 2009)). We first
performed a Principal Component Analysis (PCA) as implemented in flashpca (Abraham &
Inouye 2014) to investigate the relationship among these populations. Unsurprisingly, we found
that the first PC discriminates between Asian and European pigs (Supplementary Fig. 6). This is
in line with previous studies that found that European and Asian wild boar populations likely
diverged around 1My ago (Frantz et al. 2013; Groenen et al. 2012). In addition, we found that
none of the PCs discriminate among Asian populations (Supplementary Fig. 6&7), while PC3-4
show clear differentiation among most European breeds (Supplementary Fig. 7). This result is
most likely due to the fact that the Porcine SNP60 chip was ascertained in European commercial
pigs (Ramos et al. 2009). We repeated this analysis based on SNPs from our 103 genomes (see
above). This analysis further demonstrates the ascertainment bias of the Porcine SNP60 chip in
EUD. Indeed, Fig. 2a shows the exact opposite pattern, with Asian pigs being more variable,
consistent with the hypothesis that this species originated in East Asia (Groenen et al. 2012;
Frantz et al. 2013). To further investigate historical relationship among these populations we
used TreeMix (Pickrell & Pritchard 2012) to fit a bifurcating tree to our 60K dataset.
Surprisingly, we found that EUD and ASD are paraphyletic, while EUW are monophyletic
(Supplementary Fig. 4). To validate this finding we build a neighbor joining phylogeny (using
the BIONJ function in the “ape” R package (Paradis et al. 2004)) of our 103 genomes based IBS
distance matrix as computed by plink (Purcell et al. 2007) using the same set of 500,000 random
Nature Genetics: doi:10.1038/ng.3394
SNPs as for the PCA (see above). This analysis confirms the paraphyly of both ASD and EUD
(Fig. 2b). Such a finding is difficult to reconcile with a simple model of domestication that
involves a single source population and/or little gene-flow between wild and domestics.
However, paraphyly and complex ancestry in domestic pigs could be the result of multiple events
of interbreeding with wild-boars as well as interbreeding between Asian and European domestics
during the 19th century industrial revolution (White 2011a; Groenen et al. 2012; Bosse et al.
2014). Nevertheless, our samples include many non-commercial breeds that are unlikely to be
heavily admixed with Asian domestics (White 2011; Porter 1993).
Migration rates
To further test the hypothesis that gene-flow between ASD and EUD did not influence our
findings we simulated 2 million samples under the best fitting model and used ABC to estimate
the posterior distribution of migration rates (see above). We found that rate of gene flow EUW
→ EUD was quite high. We estimate mEUW,EUD (fraction of the EUD population made up of
EUW migrants each generation) to be 1.1x10⁻⁴ (mode; 95% HPDI [1.3x10⁻⁶-1.7x10⁻³];
Supplementary Table 3), corresponding roughly to 2.3 migrants/generations. On the other hand
we found that the rate of gene-flow EUD → EUW was quite low with mEUD,EUW=5.6x10⁻⁶
(mode; 95% HPDI [8.9x10⁻⁷-9.1x10⁻⁴]; Supplementary Table 3), corresponding roughly to 0.05
migrants/generation. This pattern was slightly reversed in Asia with mASD,ASW=1.5x10⁻⁴ (mode;
95% HPDI [2.4x10⁻⁶-2.3x10⁻³]; Supplementary Table 3; ~5.6 migrants/generations) and
mASW,ASD=8.9x10⁻⁵ (mode; 95% HPDI [2.4x10⁻⁶-2.2x10⁻³]; Supplementary Table 3; ~2.3
migrants/generations). However, the pattern in Asia is difficult to interpret due to the large
confidence interval (HPDI; Supplementary Table 3) most likely due to the complex history of
ASW as well as the limited number of sequences in ASW. Lastly, the rate of migration between
the two domestic populations (ASD and EUD) was much lower, with mEUD,ASD =6.5x10⁻⁶ (mode;
95% HPDI [8.9-7-1.1x10⁻³]; Supplementary Table 3; ~ 0.17 migrants/generation) and
mASD,EUD=7.1x10⁻⁶ (mode; 95% HPDI [8.8x10⁻⁷-7.1x10⁻⁴]; Supplementary Table 3; ~0.14
migrants/generation). This result suggests that the gene-flow between ASD and EUD did not
confound our findings that gene-flow took place between wild and domestic pigs.
Nature Genetics: doi:10.1038/ng.3394
Demography of Asian pigs
The same possible population decline as highlighted in the main text was observed in ASW and
ASD (Supplementary Fig. 5; Fig. 4). This is also consistent with Pleistocene glaciation-induced
population decline (Frantz et al. 2013; Groenen et al. 2012; Bosse et al. 2014). Nevertheless, we
found that contrary to European pigs, ASW had a higher effective population size
(NeASW=35,933; 95% HPDI [6,313-97,702]) than ASD (NeASD=25,947; 95% HPDI [4,906-
97,002]). The proportions of retained simulations were NeASW was greater than NeASD was 0.56
(5,602 out of 10,000). However, for modelling purposes, as well as due to the limited number of
wild boars from Asia available in the study, we made the assumption that all Asian wild boars
form a single population. Indeed, given the common history of ASD and EUD (White 2011a;
Groenen et al. 2012; Bosse et al. 2014) it was necessary for our models to be realistic to include
a surrogate population for ASW. Nevertheless, this assumption likely influenced our
demographic analysis in China; as it was shown previously that population from North and South
China show much greater genetic differentiation than between any modern European wild boar
populations (Larson et al. 2005; Frantz et al. 2013; Groenen et al. 2012; Bosse et al. 2012). In
addition, North and South Chinese wild boars did not form a monophyletic clade in our 60K SNP
analysis (Supplementary Fig. 4). Such unaccounted-for long-term substructure likely influenced,
our quality report (Supplementary Fig. 1). Moreover, possible ancient admixture (Frantz et al.
2013; Frantz et al. 2014; Ai et al. 2015) makes it difficult to draw strong conclusions about
demography of domestication in Chinese pigs. However, this finding is not expected to have any
influence on the conclusion from our gene-flow analysis. Indeed, substructure within ASD could
result in artificial migration ASD → ASW, if one of the ASW subpopulation was closer to ASD,
but substructure cannot explain the migration ASW → ASD if ASD were genetically isolated.
Time of domestication
Our models also include time parameters that represent the time of domestication (T1 and T2 in
Supplementary Fig. 2). However, our ABC validation step suggests that our current
approach/data is expected to provide little power to retrieve these parameters. Indeed, the RMSE
for T1 and T2 was around 2.5 (Supplementary Table 3). This lack of power is reflected in the
shape of our posterior distribution for these parameters (Supplementary Table 3). While the
Nature Genetics: doi:10.1038/ng.3394
uniformity of these posterior distributions could be an artefact of our choice of summary
statistics, it is more likely due to the fact that there is no strong signal for a sharp domestication
episode. This supports our view that domestication of is a diffuse, long-term process, and may
indicate that it is ultimately futile to try to infer the precise timing of the onset of domestication
in pigs.
Selection scan
We used SweeD to detect sweeps (Pavlidis et al. 2013). The program was run for each population
separately using all available SNPs. The highest composite likelihood ratio (CLR) score for
every 10kb interval was used for further analysis. To obtain critical threshold values (p-values),
we used a posterior predictive simulation (PPS) approach. We simulated 2 replicates of 3Mbp
each using the parameters of the 10,000 closest retained simulations from our ABC analysis
(20,000 simulations). Simulations were run using macs (Chen et al. 2009). We derived a critical
threshold for observed CLR in each population using the cumulative descriptive function (CDF)
derived from the CLR distribution that was obtained from the PPS. All regions with p<0.01 were
selected for further analysis. Supplementary Table 5 and 6 provide a list of terms enriched in
EUD and ASD respectively. We computed the overlap of these regions between populations and
defined set of regions unique to each population as well as overlapping only between ASD and
EUD (Supplementary Table 4). These sweep coordinates were then overlapped with the Ensembl
(v75) gene annotation. We tested for enrichment of gene ontology term in each population using
a fisher-exact test with a Benjamini-Hochberg correction for multiple testing as implemented in
the Gostat program (Beissbarth & Speed 2004). We only considered genes with human orthology
(Goa-human).
To perform phylogenetic analysis, we first extracted 20kb bp around putative parallel sweeps.
We then phased these regions in BEAGLE 4 (Browning & Browning 2007) using default
settings. We then built trees using UPGMA as implemented in the R package Phangorn (Schliep
2011) after computing Kimura-2-parameter model corrected distances using the R package ape
(Paradis et al. 2004).
To validate the sweep in Figure 5 we computed the derived allele frequency (DAF), Tajima’s D
and a haplotype based method (H12; Garud et al. 2015). The results are presented in
Nature Genetics: doi:10.1038/ng.3394
Supplementary Fig. 9. Each of these methods provides a clear-cut signal for a sweep in EUD as
shown in Fig. 5 (PLAG1 region). Moreover, Supplementary Fig. 9 shows that the signal in the
upstream region (Fig. 5b) is also significant in and only in ASD and EUD under various
methods. We also investigated whether the signal in this sweep region could be the result of an
elevated mutation rate in this region. To do so, we computed nucleotide divergence to the
outgroup (see section “Quality of re-sequencing data”) in 1,000 randomly selected 10kb
windows across the genome, as well as the sweep region in Fig. 5, for every individual. The
results of this analysis are presented in Supplementary Fig. 10. We found that the nucleotide
divergence to the outgroup was slightly lower in this region than in the rest of the genome; thus
ruling out any effect of accelerated mutation rate influencing our sweep analysis in this region.
Genes under positive selection in domestic pigs
We ensured that each sweeps in domestic populations was not overlapping with a sweep in a
wild population (see main text). Supplementary Table 5 and 6 provide a list of term enriched in
EUD and ASD respectively and Supplementary Table 7 and 8 provide a full list of the genes
overlapping with sweeps. These terms comprise multiple gene candidates related to height
(PLAG1, NCPAG, PENK, RPS20 and LYN in EUD; LEMD3 and UPK1 in ASD) in pigs
(Andersson-Eklund et al. 1998; Rubin et al. 2012) and cattle (Karim et al. 2011; Saatchi et al.
2014) as well as candidates that affect bone and teeth formation (GERM1, PLCL1 in EUD;
PKD1, LEMD3, SCL4A4, ENAM and AMTN in ASD) (Canalis et al. 2012; Nagatomo et al. 2008;
Gazzerro et al. 2007; Aggarwal 2013; Hellemans et al. 2004; Jalali et al. 2014; Lacruz et al.
2010; Hu et al. 2014; Coxon et al. 2012; Dos Santos Neves et al. 2012). We also found genes
involved in development of hippocampal neurons (NRTN) (Quartu et al. 2005; Simanainen et al.
2013), axon guidance (SEMA3C and PLXNC1) (Oschipok et al. 2008; Hernández-Montiel et al.
2008; Gonthier et al. 2007; Ruediger et al. 2013; Niquille et al. 2009; Pasterkamp et al. 2007),
neural crest development (SEMA3C and NRTM) (Brown et al. 2001) and dentrite growth
regulation (AAK1) (Ultanir et al. 2012). In addition, we found candidate genes in ASD involved
in neurite growth (RAB35) (Chevallier et al. 2009) and central nervous system development
(GGA2 and FRS2) (Borgonovo et al. 2012; López-Aranda et al. 2008; Ong et al. 2000). Finally,
we identified genes that have been shown to directly affect or regulate behavioural traits (i.e.
aggressiveness and feeding behaviour) in EUD (APBA2, MC4R, RCAN1) (Sokol et al. 2006;
Nature Genetics: doi:10.1038/ng.3394
Grayton et al. 2013; Bhoiwala et al. 2013; Dierssen et al. 2011; Kim et al. 2000; Xu et al. 2013;
Valette et al. 2013) and in ASD (BAIPA3) (Wojcik et al. 2013).
Purifying selection.
In order to investigate the effect of purifying selection on the genome of domestic and wild pigs
we used the PhyloP (Pollard et al. 2009) annotation provided by UCSC. PhyloP scores are a
base-wise statistics that measure acceleration or conservation based on a multi-species
alignment. Low scores (below 0) imply accelerated evolution, while high scores (greater than 0)
imply conservation. Here we used the PhyloP 60-way vertebrate, obtained for the mouse genome
(mm10) from UCSC. We used liftOver (Hinrichs et al. 2006) and the chain file
mm10ToSusScr3.over.chain provided by UCSC to lift the coordinate from mm10 to susScr3.
Thereafter, we randomly selected 500,000 SNPs from our set of 102 pig samples, for which we
computed derived allele frequency (DAF) and Fst between wild and domestic (Fst ASD-ASW and
EUD-EUW). We then used R to compute a correlation coefficient (Pearson's product-moment)
between DAF / Fst and PhyloP scores. We found that the DAF was negatively correlated with
PhyloP scores in all populations (ASD: ρ=-0.061, p<2.2e-16; ASW: ρ=-0.062, p<2.2e-16; EUD:
ρ=-0.063, p<2.2e-16; EUW: ρ=-0.062, p<2.2e-16). We also found a negative correlation between
Fst and PhyloP score (Fst EUD-EUW: ρ=-0.009, p=2.2e-10; Fst ASD-ASW: ρ=-0.008, p=9.3e-10).
Together these results suggest that high frequency derived alleles are less conserved than
expected by chance and that highly conserved sites are less affected by artificial selection (as
shown by the lower Fst).
References
Abraham, G. & Inouye, M., 2014. Fast principal component analysis of large-scale genome-wide data. Y. Zhang, ed. PloS one, 9(4), p.e93766.
Aggarwal, S., 2013. Skeletal dysplasias with increased bone density: evolution of molecular pathogenesis in the last century. Gene, 528(1), pp.41–5.
Ai, H. et al., 2015. Adaptation and possible ancient interspecies introgression in pigs identified by whole-genome sequencing. Nature Genetics, in press.
Alexander D.H., Novembre J., and Lange K., 2009. Fast model-based estimation of ancestry in unrelated individuals. Genome Research, 19, pp.1655–1664.
Nature Genetics: doi:10.1038/ng.3394
Andersson-Eklund, L. et al., 1998. Mapping quantitative trait loci for carcass and meat quality traits in a wild boar x Large White intercross. Journal of animal science, 76(3), pp.694–700.
Beissbarth, T. & Speed, T.P., 2004. GOstat: find statistically overrepresented Gene Ontologies within a group of genes. Bioinformatics, 20(9), pp.1464–5.
Bhoiwala, D.L. et al., 2013. Overexpression of RCAN1 isoform 4 in mouse neurons leads to a moderate behavioral impairment. Neurological research, 35(1), pp.79–89.
Borgonovo, J. et al., 2012. Expression of coat proteins changes during postnatal development in selected areas of the rat brain. International journal of developmental neuroscience : the official journal of the International Society for Developmental Neuroscience, 30(4), pp.333–41.
Bosse, M., Megens, H.-J., Frantz, L.A.F., Madsen, O., Larson, G., Paudel, Y., Duijvesteijn, N., Harlizius, B., Hagemeijer, Y., Crooijmans, R.P.M.A. & Groenen, M.A.M., 2014. Genomic analysis reveals selection for Asian genes in European pigs following human-mediated introgression. Nature communications, 5, p.4392.
Bosse, M. et al., 2012. Regions of homozygosity in the porcine genome: consequence of demography and the recombination landscape. PLoS genetics, 8(11), p.e1003100.
Bosse, M., Megens, H.-J., Madsen, O., et al., 2014. Untangling the hybrid nature of modern pig genomes: a mosaic derived from biogeographically distinct and highly divergent Sus scrofa populations. Molecular ecology.
Brown, C.B. et al., 2001. PlexinA2 and semaphorin signaling during cardiac neural crest development. Development, 128(16), pp.3071–3080.
Browning, S.R. & Browning, B.L., 2007. Rapid and accurate haplotype phasing and missing-data inference for whole-genome association studies by use of localized haplotype clustering. American journal of human genetics, 81(5), pp.1084–97.
Canalis, E., Parker, K. & Zanotti, S., 2012. Gremlin1 is required for skeletal development and postnatal skeletal homeostasis. Journal of cellular physiology, 227(1), pp.269–77.
Chen, G.K., Marjoram, P. & Wall, J.D., 2009. Fast and flexible simulation of DNA sequence data. Genome research, 19(1), pp.136–42.
Chevallier, J. et al., 2009. Rab35 regulates neurite outgrowth and cell shape. FEBS letters, 583(7), pp.1096–101.
Coxon, T.L. et al., 2012. Phenotype-genotype correlations in mouse models of amelogenesis imperfecta caused by Amelx and Enam mutations. Cells, tissues, organs, 196(5), pp.420–30.
Nature Genetics: doi:10.1038/ng.3394
Dierssen, M. et al., 2011. Behavioral characterization of a mouse model overexpressing DSCR1/ RCAN1. PloS one, 6(2), p.e17010.
Frantz, L.A. et al., 2013. Genome sequencing reveals fine scale diversification and reticulation history during speciation in Sus. Genome biology, 14(9), p.R107.
Frantz, L.A.F. et al., 2014. Testing models of speciation from genome sequences: divergence and asymmetric admixture in Island Southeast Asian Sus species during the Plio-Pleistocene climatic fluctuations. Molecular ecology in press.
Garud, N.R. et al., 2015. Recent Selective Sweeps in North American Drosophila melanogaster Show Signatures of Soft Sweeps. PLoS genetics, 11(2), p.e1005004.
Gazzerro, E. et al., 2007. Conditional deletion of gremlin causes a transient increase in bone formation and bone mass. The Journal of biological chemistry, 282(43), pp.31549–57.
Gonthier, B. et al., 2007. Functional interaction between matrix metalloproteinase-3 and semaphorin-3C during cortical axonal growth and guidance. Cerebral cortex, 17(7), pp.1712–21.
Grayton, H.M. et al., 2013. Altered social behaviours in neurexin 1α knockout mice resemble core symptoms in neurodevelopmental disorders. V. Trezza, ed. PloS one, 8(6), p.e67114.
Groenen, M.A.M. et al., 2012. Analyses of pig genomes provide insight into porcine demography and evolution. Nature, 491(7424), pp.393–398.
Hammer, M.F. et al., 2011. Genetic evidence for archaic admixture in Africa. Proceedings of the National Academy of Sciences of the United States of America, 108(37), pp.15123–8.
Hellemans, J. et al., 2004. Loss-of-function mutations in LEMD3 result in osteopoikilosis, Buschke-Ollendorff syndrome and melorheostosis. Nature genetics, 36(11), pp.1213–8.
Hernández-Montiel, H.L. et al., 2008. Semaphorins 3A, 3C, and 3F in mesencephalic dopaminergic axon pathfinding. The Journal of comparative neurology, 506(3), pp.387–97.
Hinrichs AS, et al., 2006. The UCSC Genome Browser Database: update 2006. Nucleic Acids Res. 34, pp. D590-8
Hu, J.C.-C. et al., 2014. Enamelin is critical for ameloblast integrity and enamel ultrastructure formation. PloS one, 9(3), p.e89303.
Hudson, R.R., 2002. Generating samples under a Wright-Fisher neutral model of genetic variation. Bioinformatics, 18(2), pp.337–338.
Jalali, R. et al., 2014. NBCe1 (SLC4A4) a potential pH regulator in enamel organ cells during enamel development in the mouse. Cell and tissue research.
Nature Genetics: doi:10.1038/ng.3394
Karim, L. et al., 2011. Variants modulating the expression of a chromosome domain encompassing PLAG1 influence bovine stature. Nature genetics, 43(5), pp.405–13.
Kim, K.S. et al., 2000. A missense variant of the porcine melanocortin-4 receptor (MC4R) gene is associated with fatness, growth, and feed intake traits. Mammalian Genome, 11(2), pp.131–135.
Lacruz, R.S. et al., 2010. The sodium bicarbonate cotransporter (NBCe1) is essential for normal development of mouse dentition. The Journal of biological chemistry, 285(32), pp.24432–8.
Larson, G. et al., 2005. Worldwide phylogeography of wild boar reveals multiple centers of pig domestication. Science (New York, N.Y.), 307(5715), pp.1618–21.
Lê Cao, K.-A., González, I. & Déjean, S., 2009. integrOmics: an R package to unravel relationships between two omics datasets. Bioinformatics (Oxford, England), 25(21), pp.2855–6. Leuenberger, C. & Wegmann, D., 2010. Bayesian computation and model selection without likelihoods. Genetics, 184(1), pp.243–52.
López-Aranda, M.F. et al., 2008. A dynamic expression pattern of sGalpha(i2) protein during early period of postnatal rat brain development. International journal of developmental neuroscience : the official journal of the International Society for Developmental Neuroscience, 26(6), pp.611–24.
Nagatomo, K.J. et al., 2008. Transgenic overexpression of gremlin results in developmental defects in enamel and dentin in mice. Connective tissue research, 49(6), pp.391–400.
Niquille, M. et al., 2009. Transient neuronal populations are required to guide callosal axons: a role for semaphorin 3C. PLoS biology, 7(10), p.e1000230.
Ong, S.H. et al., 2000. FRS2 Proteins Recruit Intracellular Signaling Pathways by Binding to Diverse Targets on Fibroblast Growth Factor and Nerve Growth Factor Receptors. Molecular and Cellular Biology, 20(3), pp.979–989.
Pollard K.S., Hubisz M.J., Siepel A., 2006. Detection of non-neutral substitution rates on mammalian phylogenies. Genome Research. 20(1), pp.110-21.
Nature Genetics: doi:10.1038/ng.3394


![Improved Conditional VRNNs for Video PredictionSecond, we introduce more flexible posterior and prior distributions [30]. Current video prediction models usually rely on one shallow](https://img.pdfslide.us/doc/110x75/5fca1c8240521627db2e835d/improved-conditional-vrnns-for-video-prediction-second-we-introduce-more-iexible.jpg)