Embed Size (px)
Citation preview
Ea Energianalyse
Berlin - 18 May 2009Anders Kofoed-Wiuff,Ea Energy Analyses
Berlin - 18 May 2009Anders Kofoed-Wiuff,Ea Energy Analyses
Ea Energianalyse
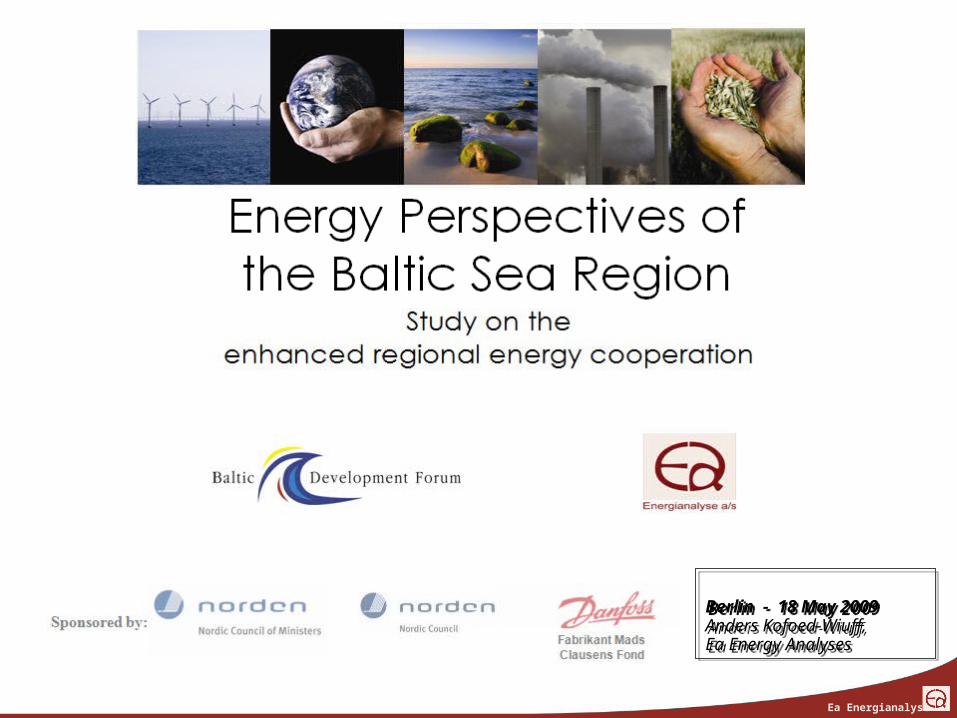
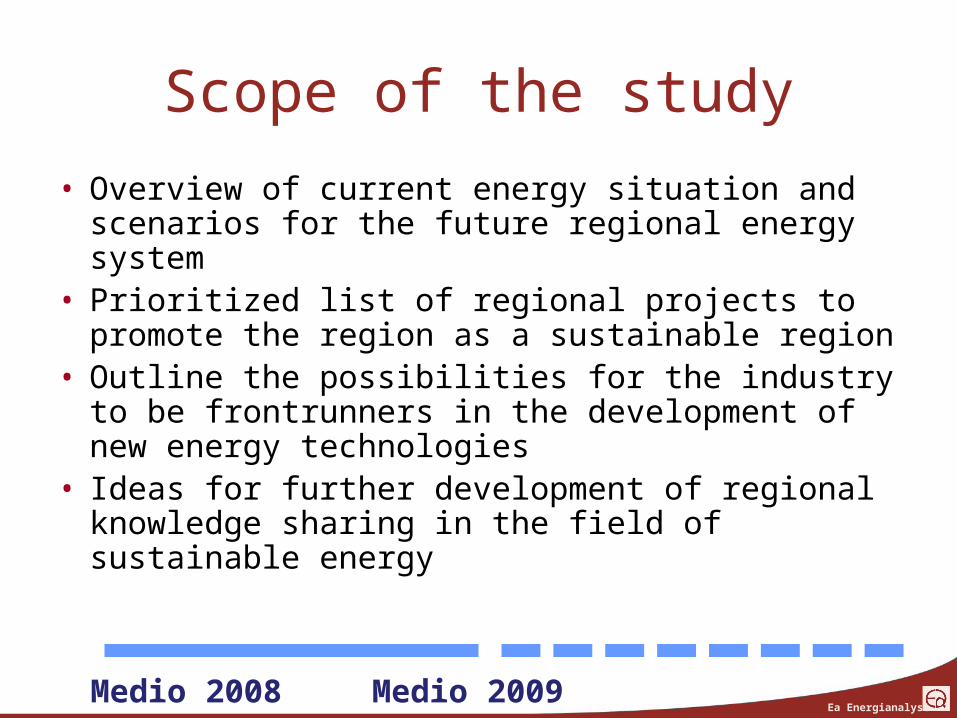
Scope of the study
• Overview of current energy situation and scenarios for the future regional energy system
• Prioritized list of regional projects to promote the region as a sustainable region
• Outline the possibilities for the industry to be frontrunners in the development of new energy technologies
• Ideas for further development of regional knowledge sharing in the field of sustainable energy
Medio 2008 Medio 2009
Ea Energianalyse
Three phases
• Phase I: Review of currrent situation – two scenarios for 2030 (completed)
• Phase II: Detailed scenario analyses of the electricity and district heating markets (ongoing)
• Phase III: Enhanced cooperation in the BSR (starting with Workshop in Kaliningrad, June 2009)
Ea Energianalyse
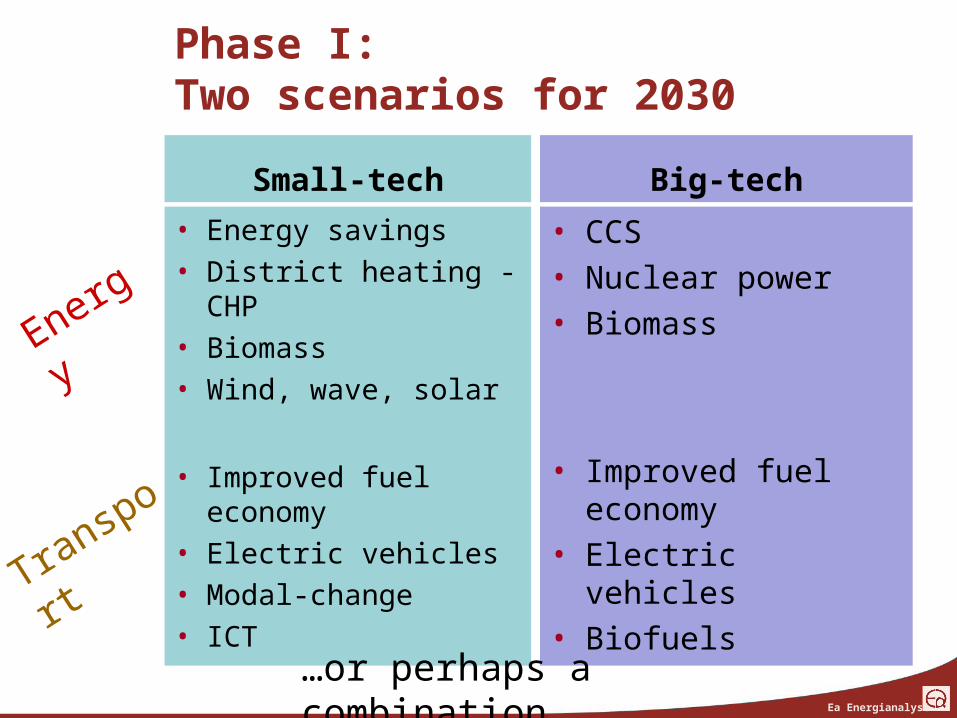
• CCS• Nuclear power• Biomass
• Improved fuel economy
• Electric vehicles• Biofuels
• Energy savings• District heating - CHP• Biomass• Wind, wave, solar
• Improved fuel economy
• Electric vehicles• Modal-change• ICT
Phase I:Two scenarios for 2030
Small-tech Big-tech
Energy
Transport
…or perhaps a combination
Ea Energianalyse
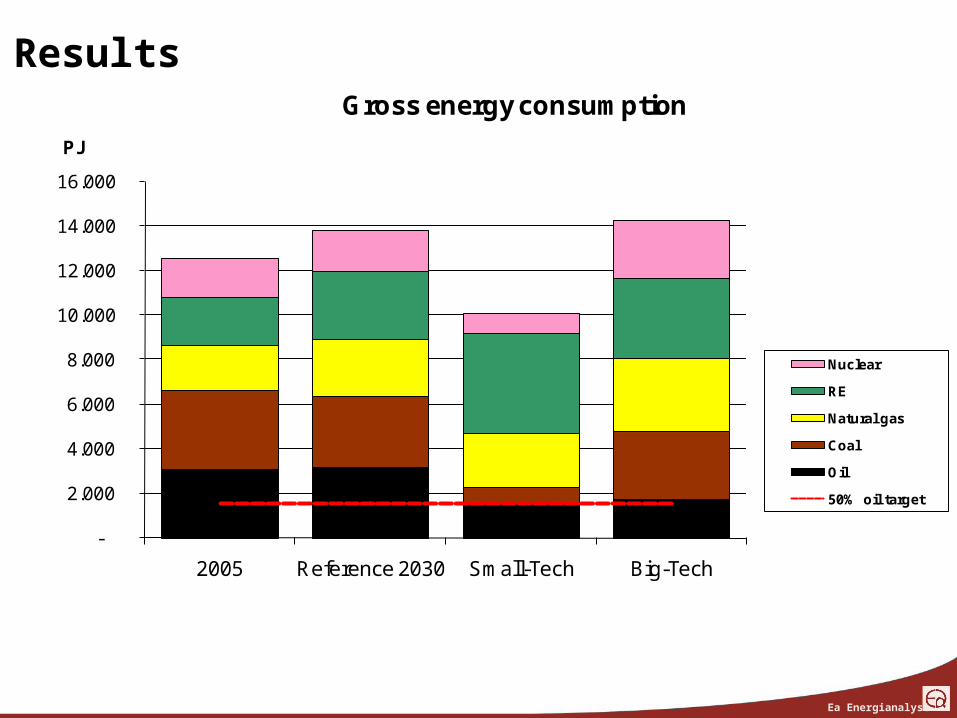
Results
-
2.000
4.000
6.000
8.000
10.000
12.000
14.000
16.000
2005 Reference 2030 Small-Tech Big-Tech
PJ
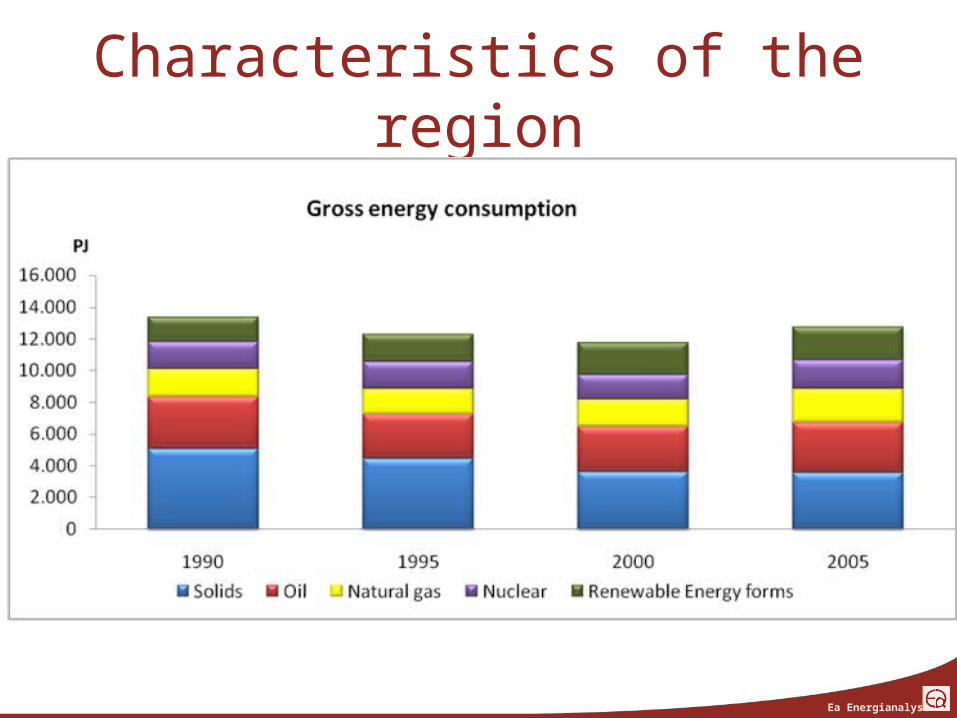
Gross energy consumption
Nuclear
RE
Natural gas
Coal
Oil
50% oil target
Ea Energianalyse
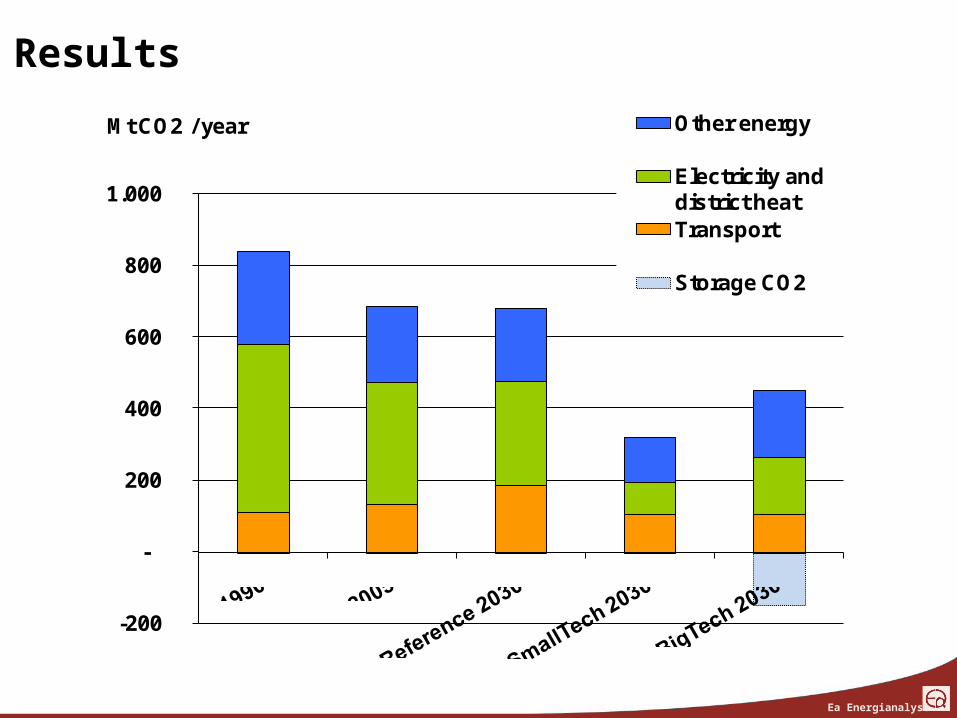
Results
-200
-
200
400
600
800
1.000
Mt CO2 / year Other energy
Electricity and district heatTransport
Storage CO2
Ea Energianalyse
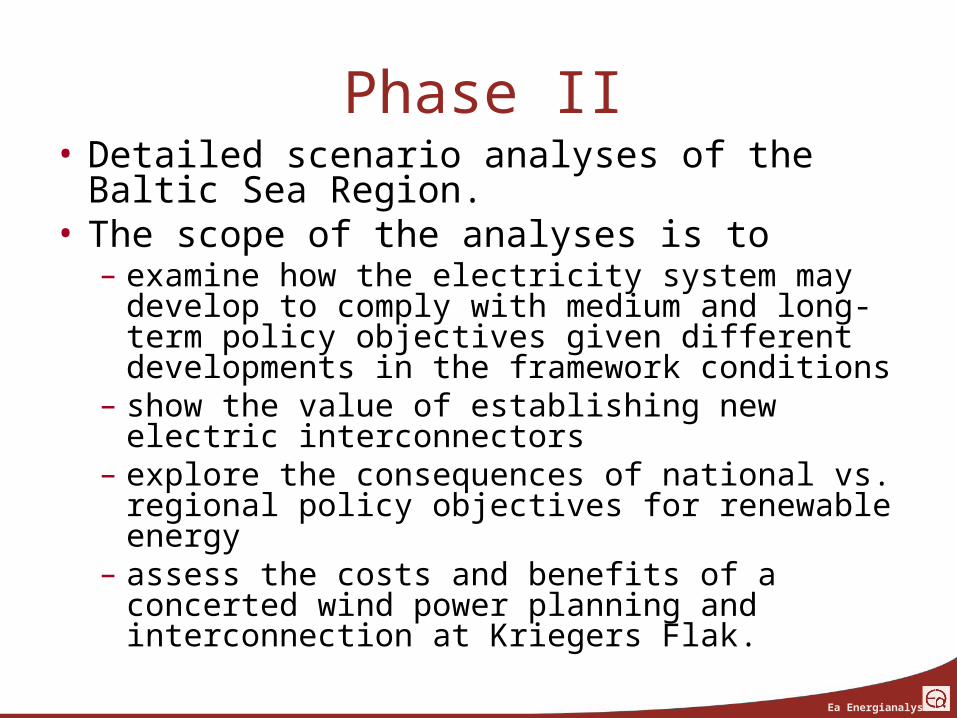
Phase II• Detailed scenario analyses of the Baltic Sea
Region.• The scope of the analyses is to
– examine how the electricity system may develop to comply with medium and long-term policy objectives given different developments in the framework conditions
– show the value of establishing new electric interconnectors
– explore the consequences of national vs. regional policy objectives for renewable energy
– assess the costs and benefits of a concerted wind power planning and interconnection at Kriegers Flak.
Ea Energianalyse
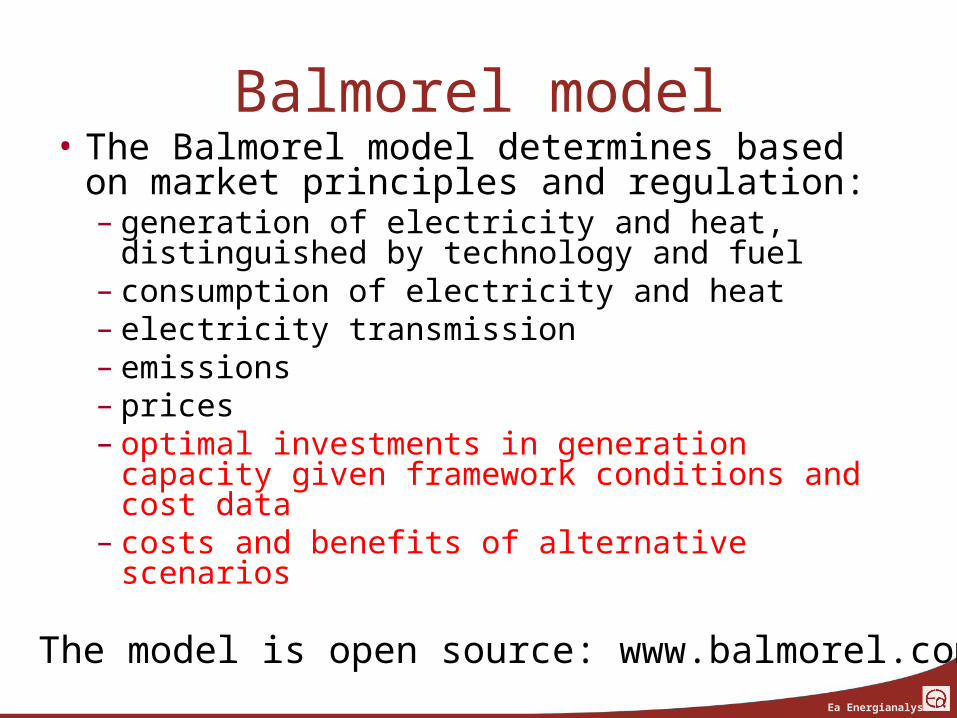
Balmorel model• The Balmorel model determines based on
market principles and regulation:– generation of electricity and heat,
distinguished by technology and fuel– consumption of electricity and heat– electricity transmission– emissions– prices– optimal investments in generation capacity
given framework conditions and cost data– costs and benefits of alternative scenarios
The model is open source: www.balmorel.com
Ea EnergianalyseDE_CS
• Basic model contains 17 areas with transmission constraints
• For the purpose of this study data for Russia is included in the model
• North-West Russia– Karelia– Kola– Pskov– Kaliningrad Arkhangelsk– St. Petersburg incl .
Leningrad– Novgorod– Komi Data is obtained from publicly
available sourcesData is obtained from publicly available sources
Ea Energianalyse
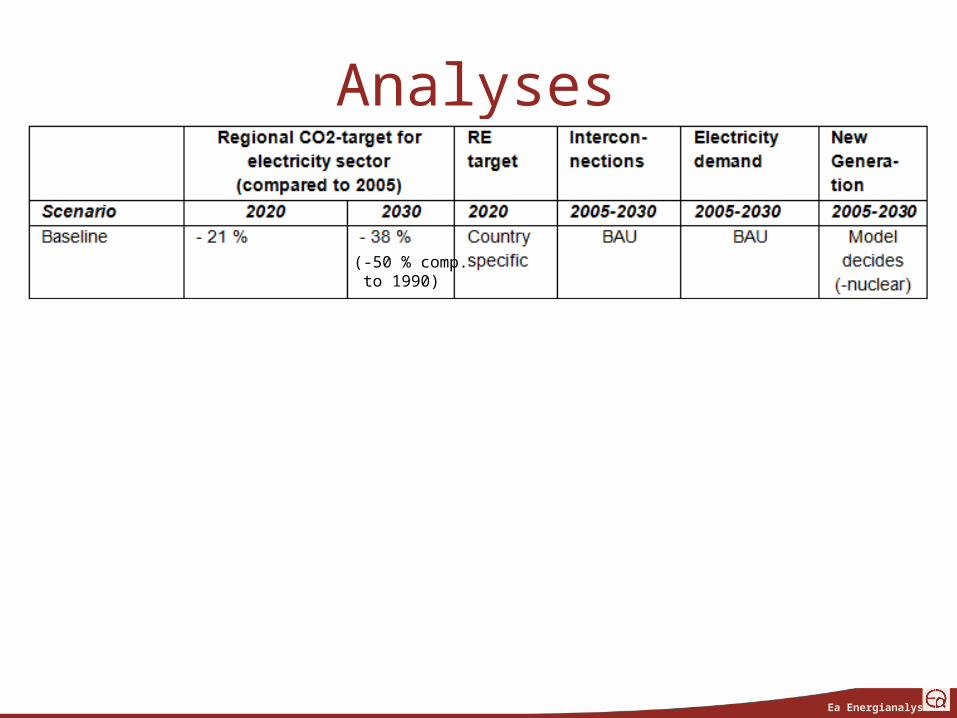
Analyses
Leading to a synthesis scenarios for the region based on the outcome of the analyses and subsequent discussions of the results with key stakeholders in the region
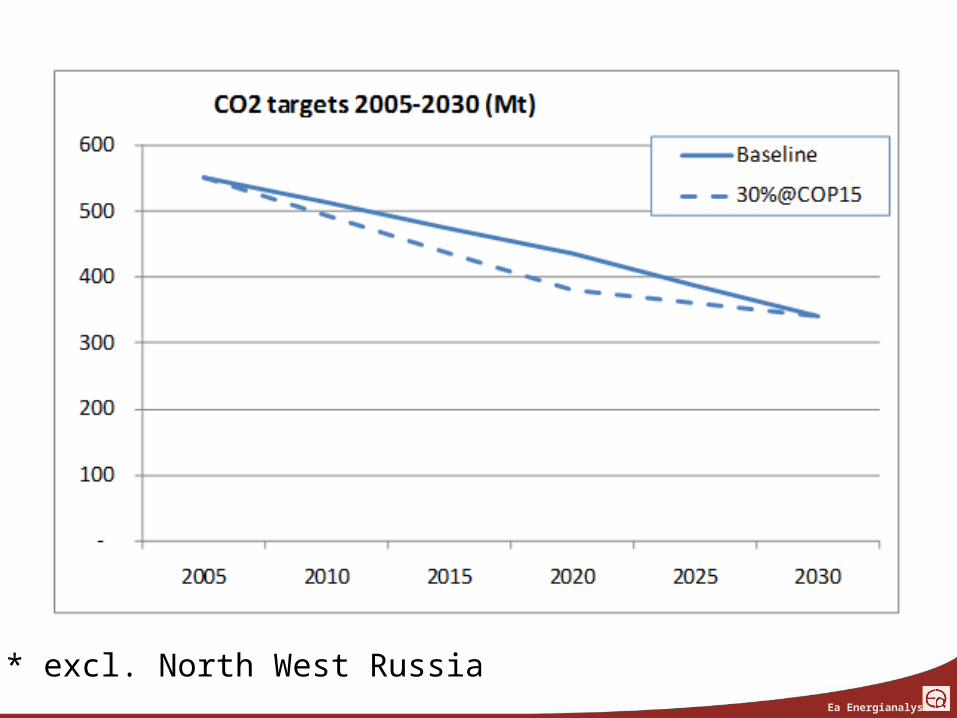
(-50 % comp. to 1990)
Ea Energianalyse
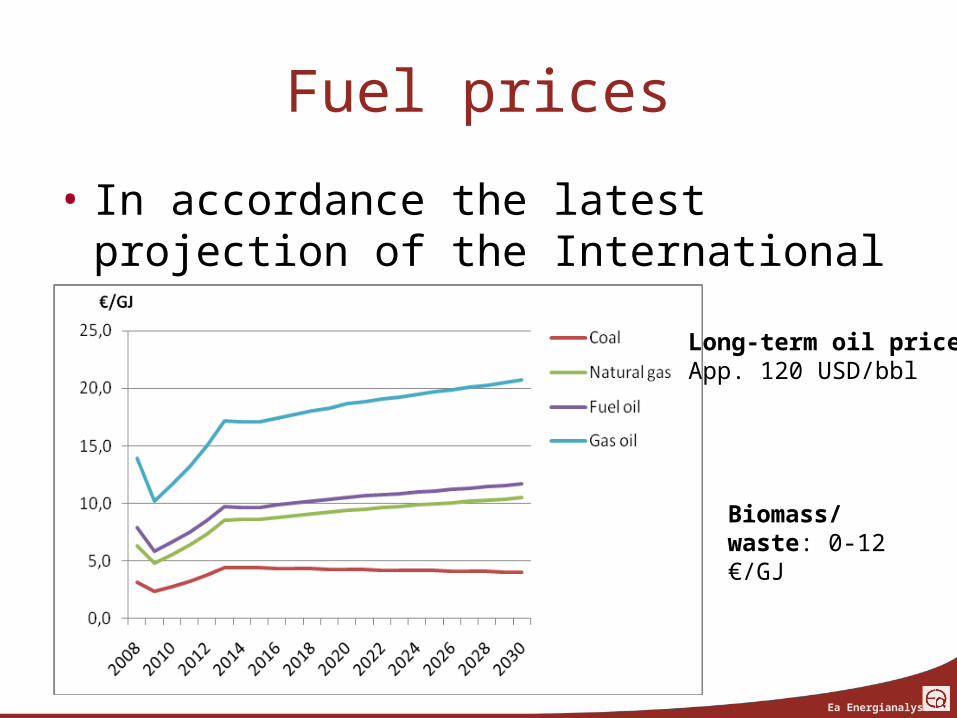
Fuel prices
• In accordance the latest projection of the International Energy Agency
Biomass/waste: 0-12 €/GJ
Long-term oil price:App. 120 USD/bbl
Ea Energianalyse
* excl. North West Russia
Ea Energianalyse
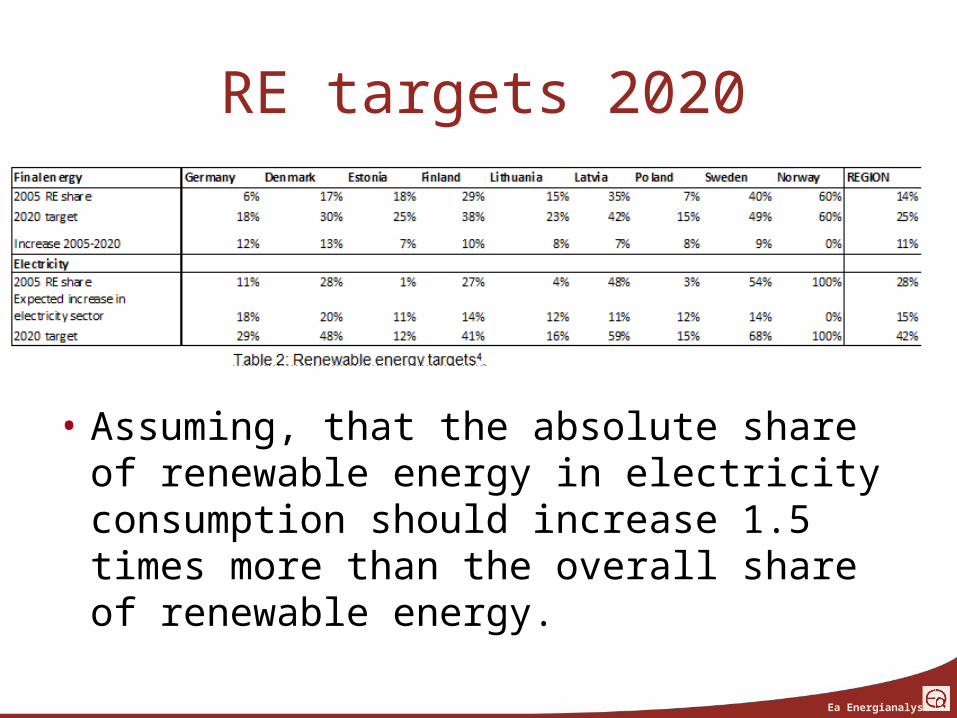
RE targets 2020
• Assuming, that the absolute share of renewable energy in electricity consumption should increase 1.5 times more than the overall share of renewable energy.
Ea Energianalyse
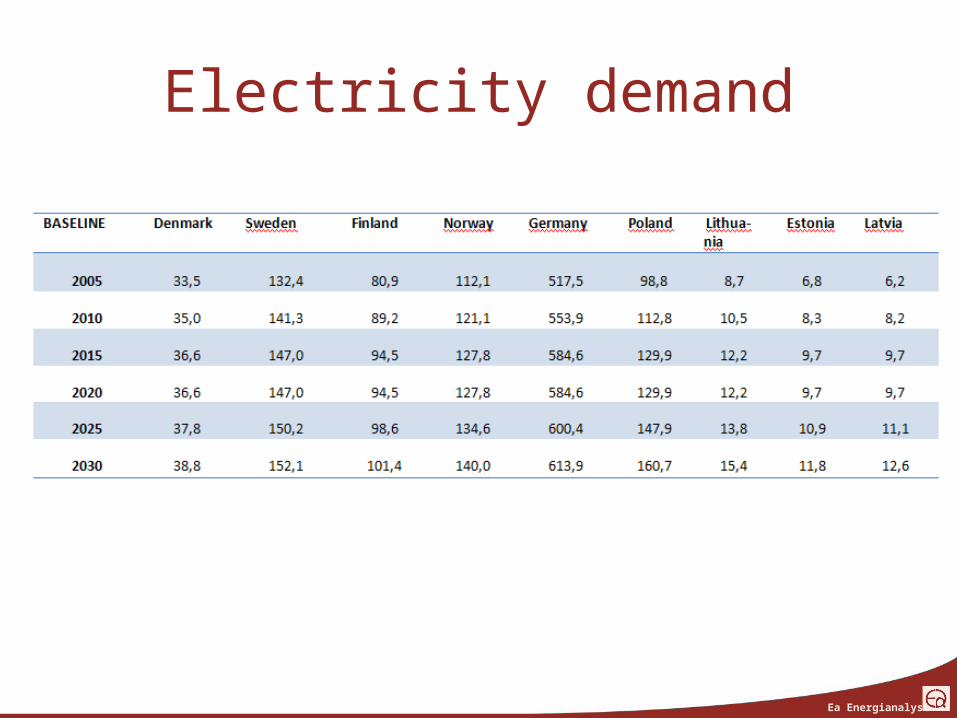
Electricity demand
Ea Energianalyse
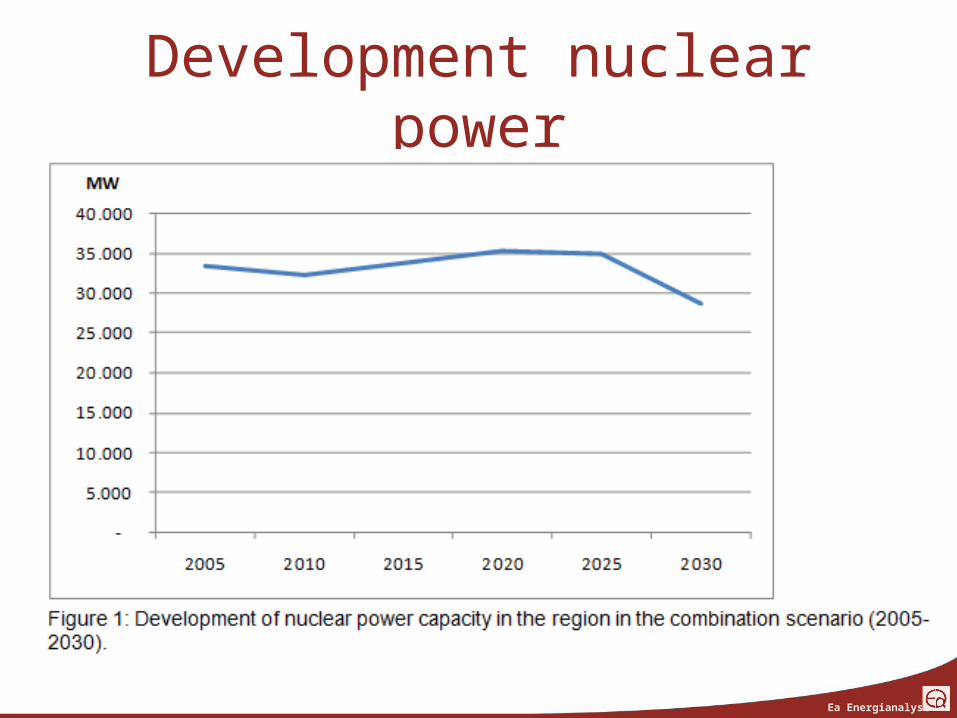
Development nuclear power
Ea Energianalyse
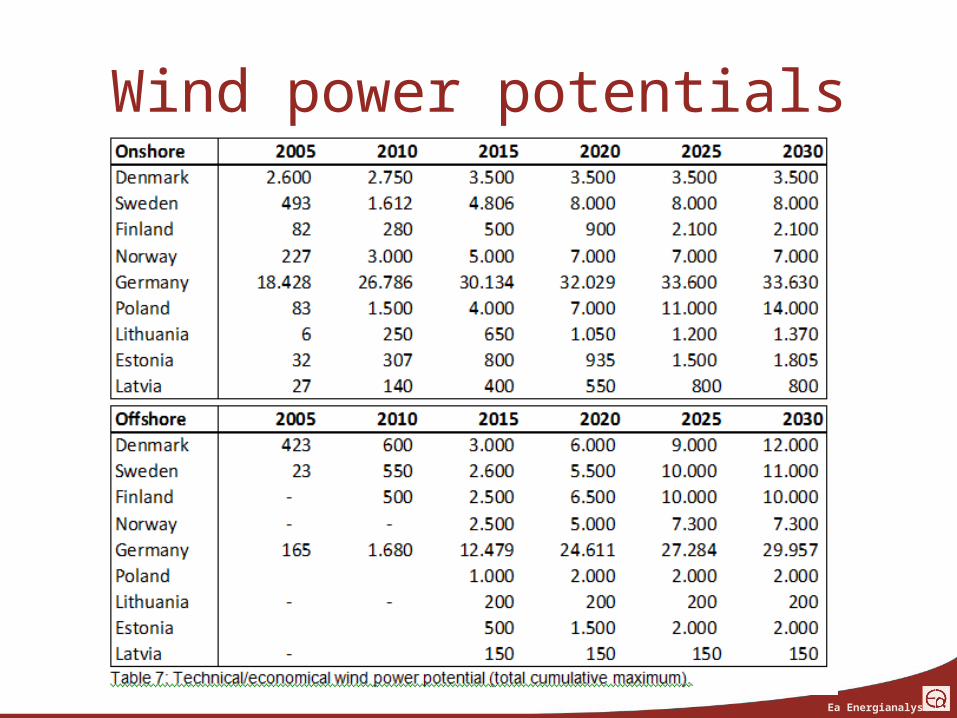
Wind power potentials
Ea Energianalyse
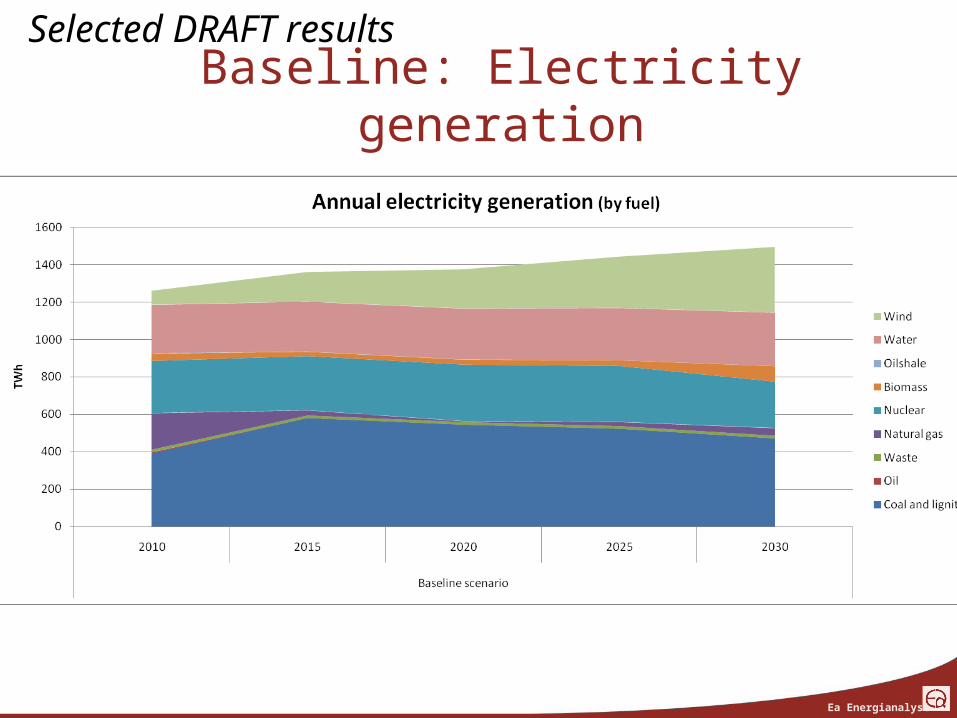
Baseline: Electricity generation
Selected DRAFT results
Ea Energianalyse
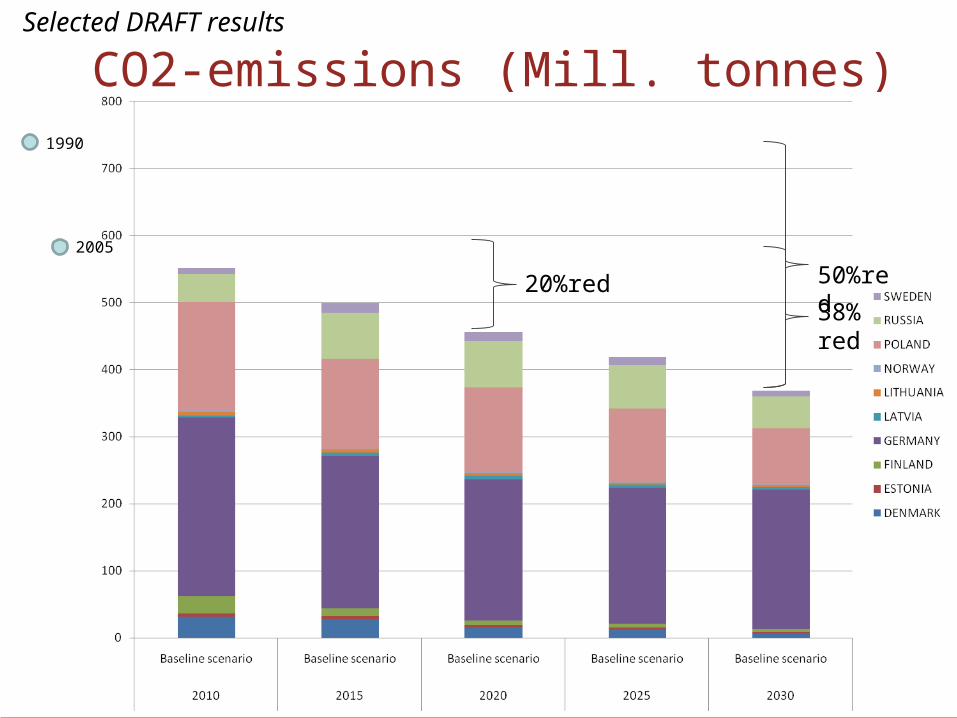
CO2-emissions (Mill. tonnes)Selected DRAFT results
1990
2005
20%red 50%red
38%red
Ea Energianalyse
CO2 and RE pricesShadow prices for CO2 target and RE target
Country
2020 2030
CO2
EUR/ton
RE
EUR/MWhel
CO2
EUR/ton
RE
EUR/MWhel
Denmark
0
16
65
0Estonia 24 0 Finland 23 0Germany 25 0
Latvia 44 6Lithuania 26 0Norway 0 0Poland 46 8Sweden 26 0Russia 16 0
Selected DRAFT results
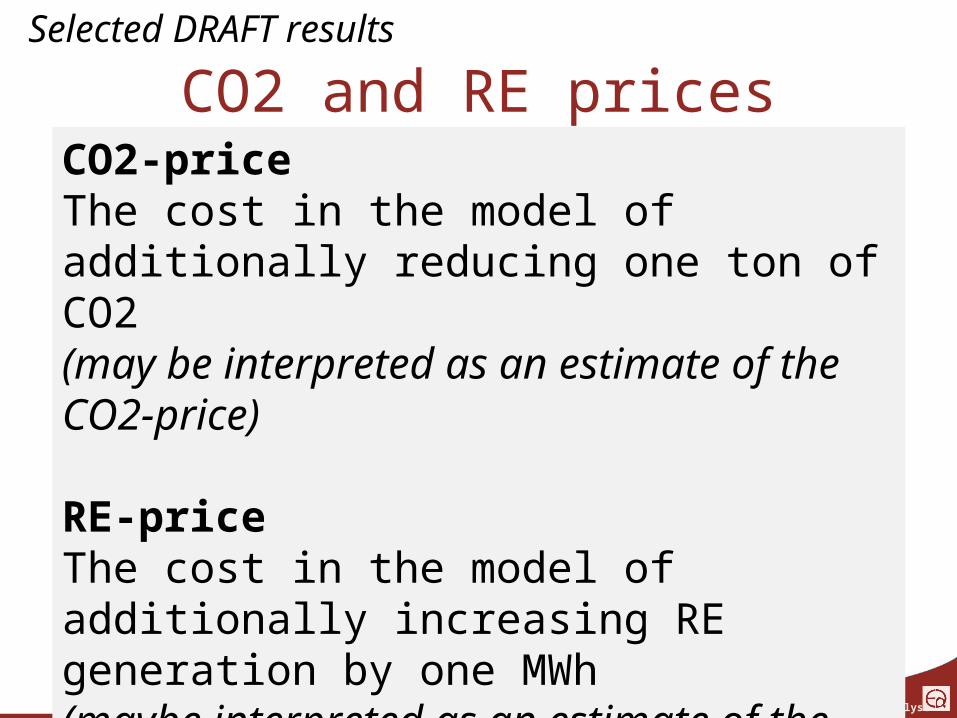
CO2-priceThe cost in the model of additionally reducing one ton of CO2(may be interpreted as an estimate of the CO2-price)
RE-priceThe cost in the model of additionally increasing RE generation by one MWh(maybe interpreted as an estimate of the cost of a RE certificate)
Ea Energianalyse
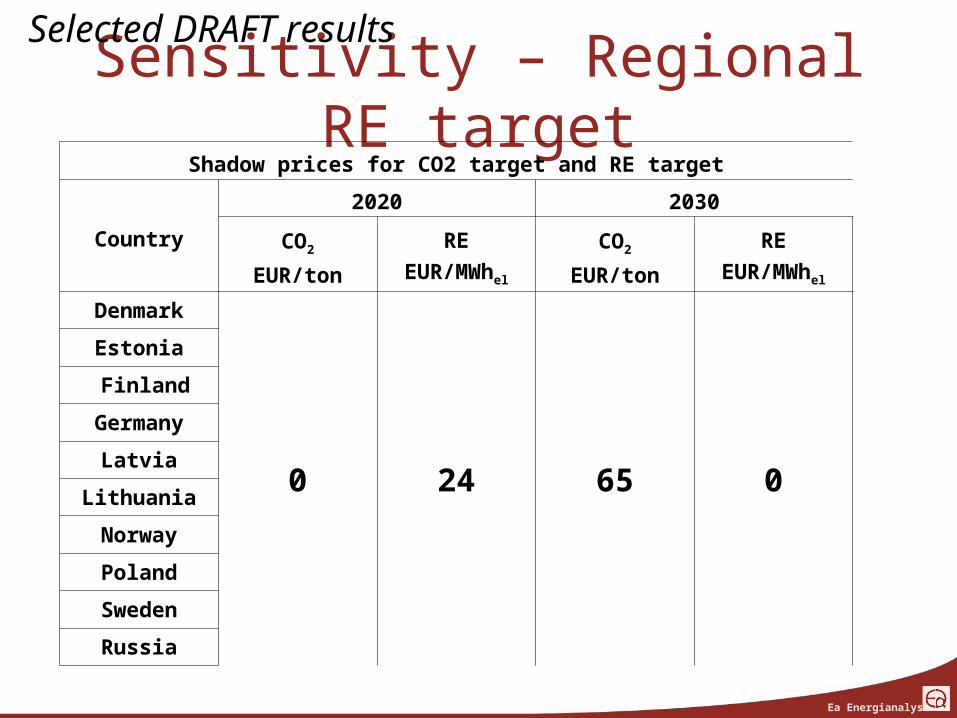
Sensitivity – Regional RE targetSelected DRAFT results
Shadow prices for CO2 target and RE target
Country
2020 2030
CO2
EUR/ton
RE
EUR/MWhel
CO2
EUR/ton
RE
EUR/MWhel
Denmark
0 24 65 0
Estonia
Finland
Germany
Latvia
Lithuania
Norway
Poland
Sweden
Russia
Ea Energianalyse
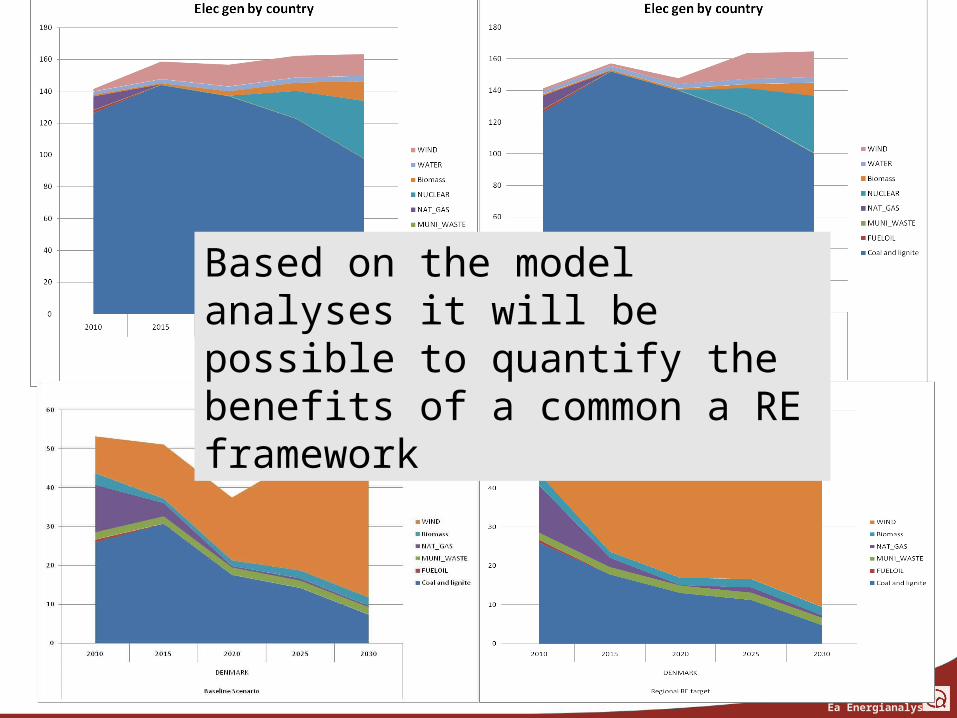
Based on the model analyses it will be possible to quantify the benefits of a common a RE framework
Ea Energianalyse
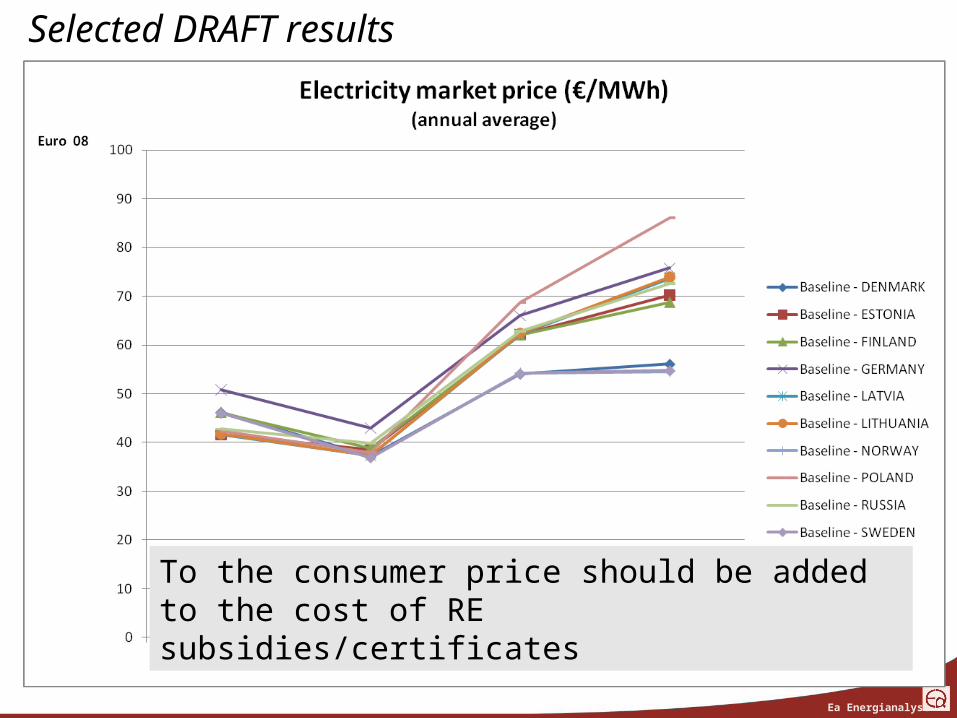
Selected DRAFT results
To the consumer price should be added to the cost of RE subsidies/certificates
Ea Energianalyse
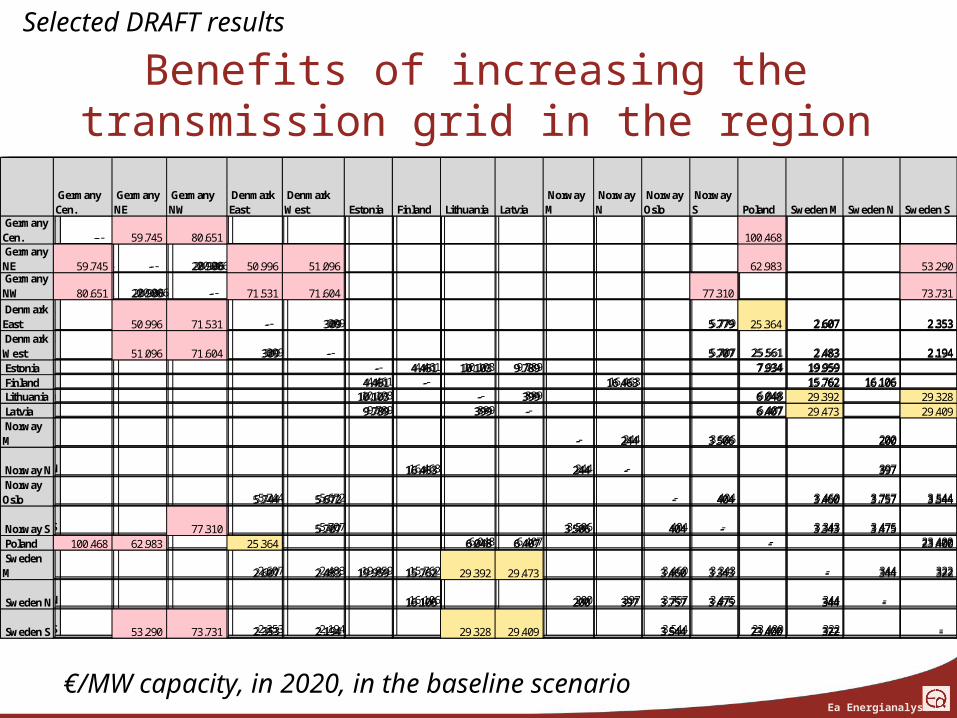
Benefits of increasing thetransmission grid in the region
Selected DRAFT results
Germany Cen.
Germany NE
Germany NW
Denmark East
Denmark West Estonia Finland Lithuania Latvia
Norway M
Norway N
Norway Oslo
Norway S Poland Sweden M Sweden N Sweden S
Germany Cen. - 59.745 80.651 Germany NE 59.745 - 20.906 50.996 51.096 62.983 53.290 Germany NW 80.651 20.906 - 71.531 71.604 77.310 73.731 Denmark East 50.996 71.531 - 309 5.779 25.364 2.607 2.353 Denmark West 51.096 71.604 309 - 5.707 25.561 2.483 2.194 Estonia - 4.461 10.103 9.789 7.934 19.959 Finland 4.461 - 16.463 15.762 16.106 Lithuania 10.103 - 399 6.048 29.392 29.328 Latvia 9.789 399 - 6.407 29.473 29.409 Norway M - 244 3.506 200
Norway N 16.463 244 - 397 Norway Oslo 5.744 5.672 - 404 3.460 3.757 3.544
Norway S 77.310 5.707 3.506 404 - 3.343 3.475 Poland 100.468 62.983 25.364 6.048 6.407 - 23.400 Sweden M 2.607 2.483 19.959 15.762 29.392 29.473 3.460 3.343 - 344 322
Sweden N 16.106 200 397 3.757 3.475 344 -
Sweden S 53.290 73.731 2.353 2.194 29.328 29.409 3.544 23.400 322 -
Germany Cen.
Germany NE
Germany NW
Denmark East
Denmark West Estonia Finland Lithuania Latvia
Norway M
Norway N
Norway Oslo
Norway S Poland Sweden M Sweden N Sweden S
Germany Cen. - 59.745 80.651 100.468 Germany NE 59.745 - 20.906 50.996 51.096 62.983 53.290 Germany NW 80.651 20.906 - 71.531 71.604 77.310 73.731 Denmark East 50.996 71.531 - 309 5.779 25.364 2.607 2.353 Denmark West 51.096 71.604 309 - 5.707 25.561 2.483 2.194 Estonia - 4.461 10.103 9.789 7.934 19.959 Finland 4.461 - 16.463 15.762 16.106 Lithuania 10.103 - 399 6.048 29.392 29.328 Latvia 9.789 399 - 6.407 29.473 29.409 Norway M - 244 3.506 200
Norway N 16.463 244 - 397 Norway Oslo 5.744 5.672 - 404 3.460 3.757 3.544
Norway S 77.310 5.707 3.506 404 - 3.343 3.475 Poland 100.468 62.983 25.364 6.048 6.407 - 23.400 Sweden M 2.607 2.483 19.959 15.762 29.392 29.473 3.460 3.343 - 344 322
Sweden N 16.106 200 397 3.757 3.475 344 -
Sweden S 53.290 73.731 2.353 2.194 29.328 29.409 3.544 23.400 322 -
Germany Cen.
Germany NE
Germany NW
Denmark East
Denmark West Estonia Finland Lithuania Latvia
Norway M
Norway N
Norway Oslo
Norway S Poland Sweden M Sweden N Sweden S
Germany Cen. - 59.745 80.651 100.468 Germany NE 59.745 - 20.906 50.996 51.096 62.983 53.290 Germany NW 80.651 20.906 - 71.531 71.604 77.310 73.731 Denmark East 50.996 71.531 - 309 5.779 25.364 2.607 2.353 Denmark West 51.096 71.604 309 - 5.707 2.483 2.194 Estonia - 4.461 10.103 9.789 7.934 19.959 Finland 4.461 - 16.463 15.762 16.106 Lithuania 10.103 - 399 6.048 29.392 29.328 Latvia 9.789 399 - 6.407 29.473 29.409 Norway M - 244 3.506 200
Norway N 16.463 244 - 397 Norway Oslo 5.744 5.672 - 404 3.460 3.757 3.544
Norway S 77.310 5.707 3.506 404 - 3.343 3.475 Poland 100.468 62.983 25.364 6.048 6.407 - 23.400 Sweden M 2.607 2.483 19.959 15.762 29.392 29.473 3.460 3.343 - 344 322
Sweden N 16.106 200 397 3.757 3.475 344 -
Sweden S 53.290 73.731 2.353 2.194 29.328 29.409 3.544 23.400 322 -
€/MW capacity, in 2020, in the baseline scenario
Ea Energianalyse
Preliminary observations
• The targets set-out can be achieved given the RE resources available (stronger targets could be met)
• Wind power appears to be the most cost-efficient measure (however more detailed analyses required)
• Benefits of increasing strengthening the transmission grid in the region – particular connections within and to/from Germany
• Benefits of cooperation on achieving RE targets
Ea Energianalyse
Next steps
• Final report by June 2009• Presentation of results at
– WS: Energizing the sustainable growth in the Region, Kaliningrad, 10-11 June
– 4 June, Copenhagen, Foreign Ministers • Phase III
– Unfold the potentials identified in the scenario analyses through stakeholder activities and further analyses
– A synthesis scenario for the BSR– Cooperation with Nordic Energy Perspectives
Medio 2008 Medio 2009
Ea Energianalyse
Comments to BSPC report
• Involve the stakeholders in the region• Establish concrete activities on specific topics
– Opportunities for CHP in the big cities around the Baltic– Common plan for off-shore wind in the BS– Action plan for the utilization of municipal waste and
biogas for energy purposes– Information and communication technologies to replace
physical transportation• Mention Kriegers Flak as a showcase for the Baltic
Sea Region• Education of the new energy planners• Highlight the role of the cities as key to the
implementation of energy and climate policies

Ea Energianalyse
THANK YOU
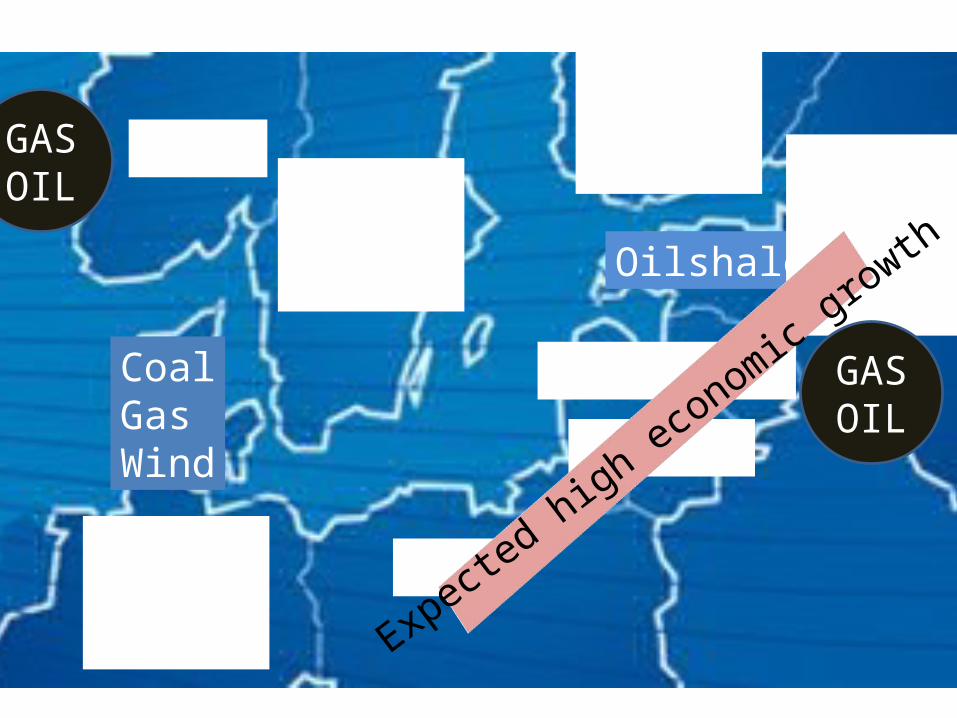
HydroHydroNuclearBio
NuclearBioHydro
CoalNuclearWind
Coal
Hydro, Gas
Oilshale
Nuclear
CoalGasWind
GasCoalHydroNuclear
Expecte
d high economic
growth
GASOIL
GASOIL
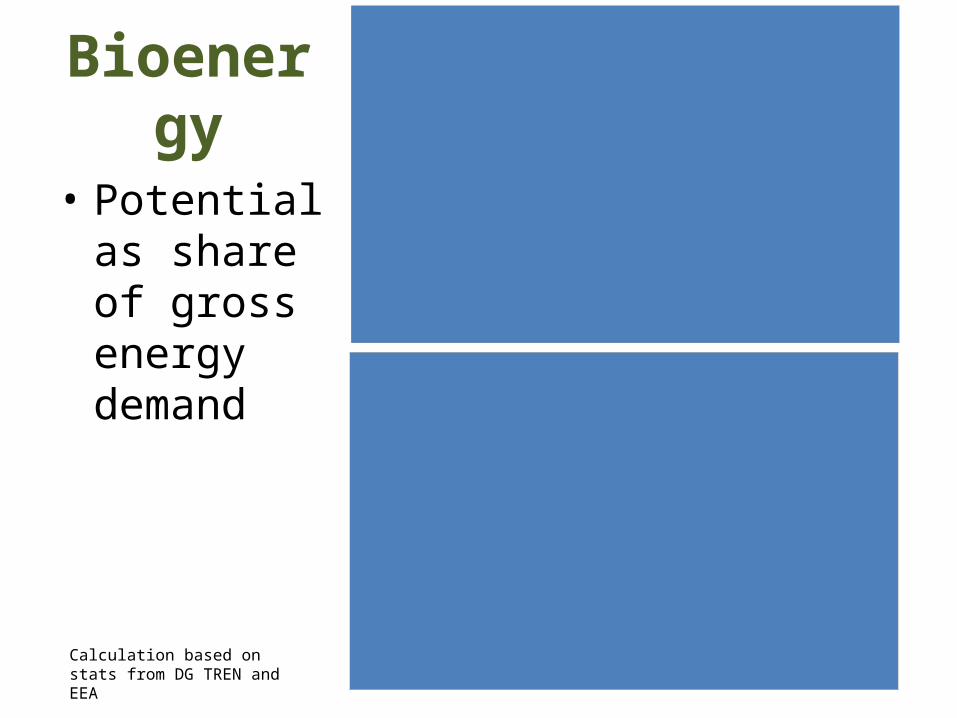
Bioenergy
• Potential as share of gross energy demand
EU 27 16%
Baltic
31%
Calculation based on stats from DG TREN and EEA
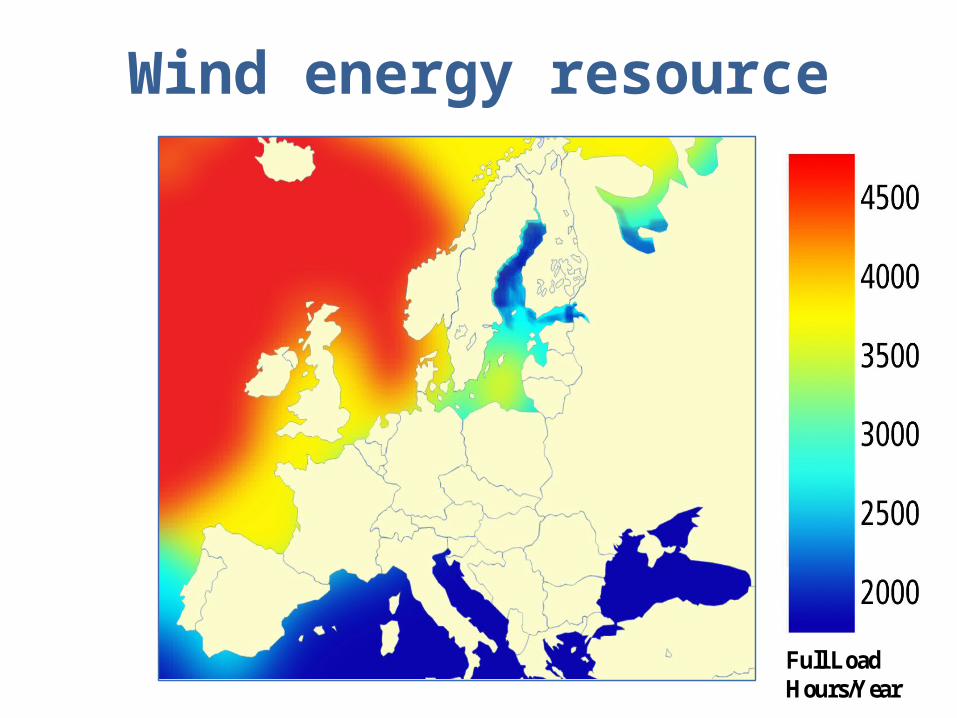
Full Load Hours/Year
Wind energy resource
Ea Energianalyse
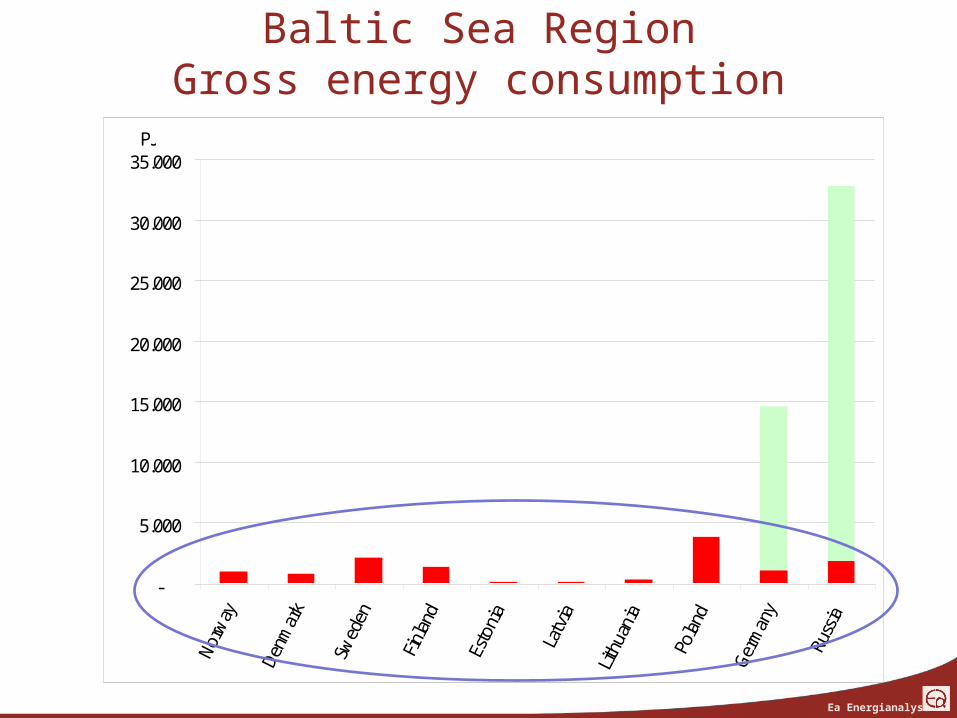
Baltic Sea RegionGross energy consumption
-
5.000
10.000
15.000
20.000
25.000
30.000
35.000
Norw
ay
Denm
ark
Swed
en
Finl
and
Esto
nia
Latv
ia
Lithu
ania
Pola
nd
Germ
any
Russ
ia
PJ
Ea Energianalyse
Characteristics of the region
Ea Energianalyse
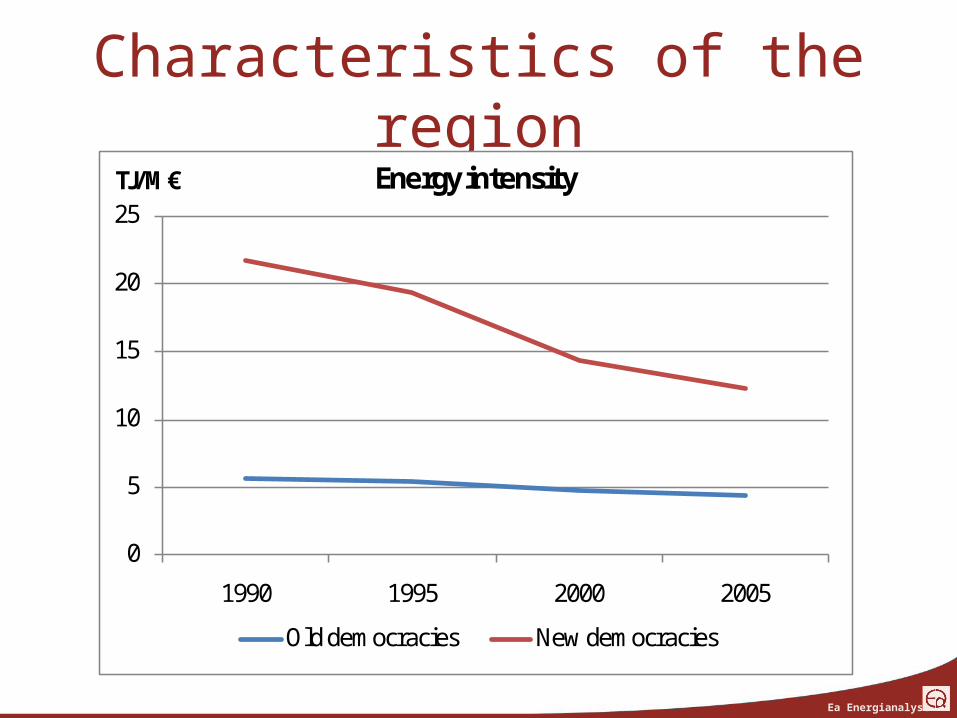
Characteristics of the region
0
5
10
15
20
25
1990 1995 2000 2005
TJ/M€ Energy intensity
Old democracies New democracies
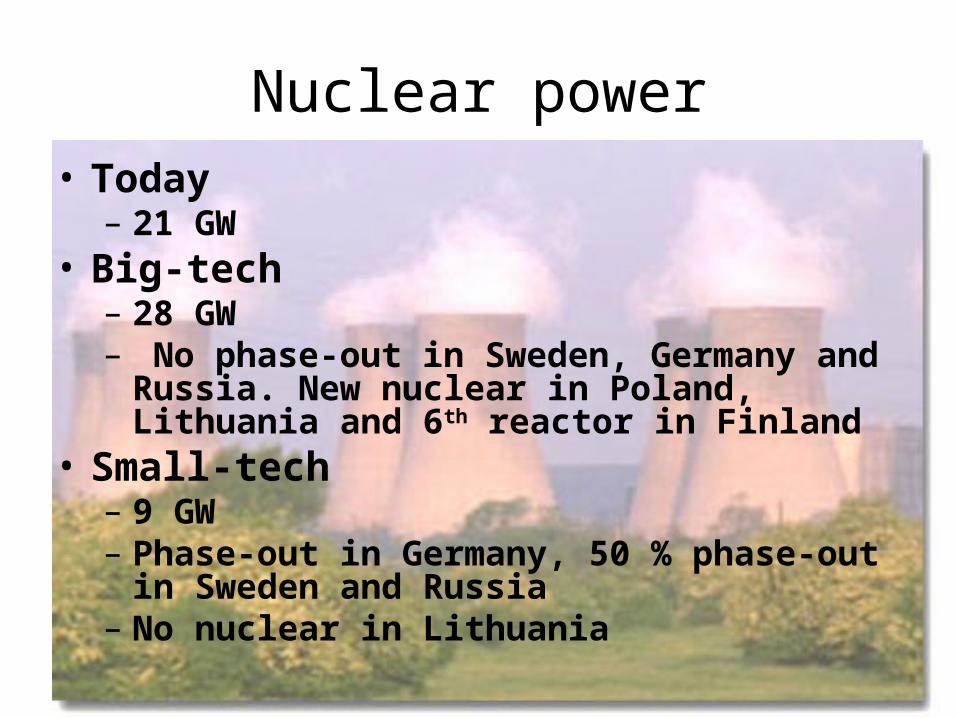
Nuclear power• Today
– 21 GW• Big-tech
– 28 GW– No phase-out in Sweden, Germany and Russia. New
nuclear in Poland, Lithuania and 6th reactor in Finland• Small-tech
– 9 GW– Phase-out in Germany, 50 % phase-out in Sweden
and Russia– No nuclear in Lithuania
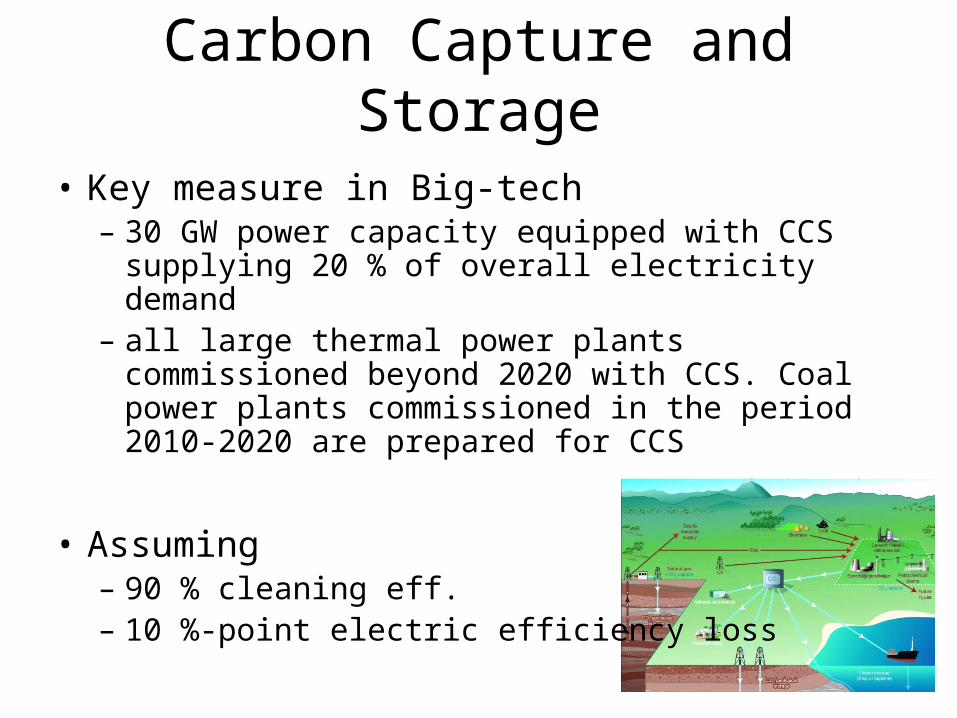
Carbon Capture and Storage
• Key measure in Big-tech– 30 GW power capacity equipped with CCS supplying
20 % of overall electricity demand– all large thermal power plants commissioned beyond
2020 with CCS. Coal power plants commissioned in the period 2010-2020 are prepared for CCS
• Assuming– 90 % cleaning eff.– 10 %-point electric efficiency loss
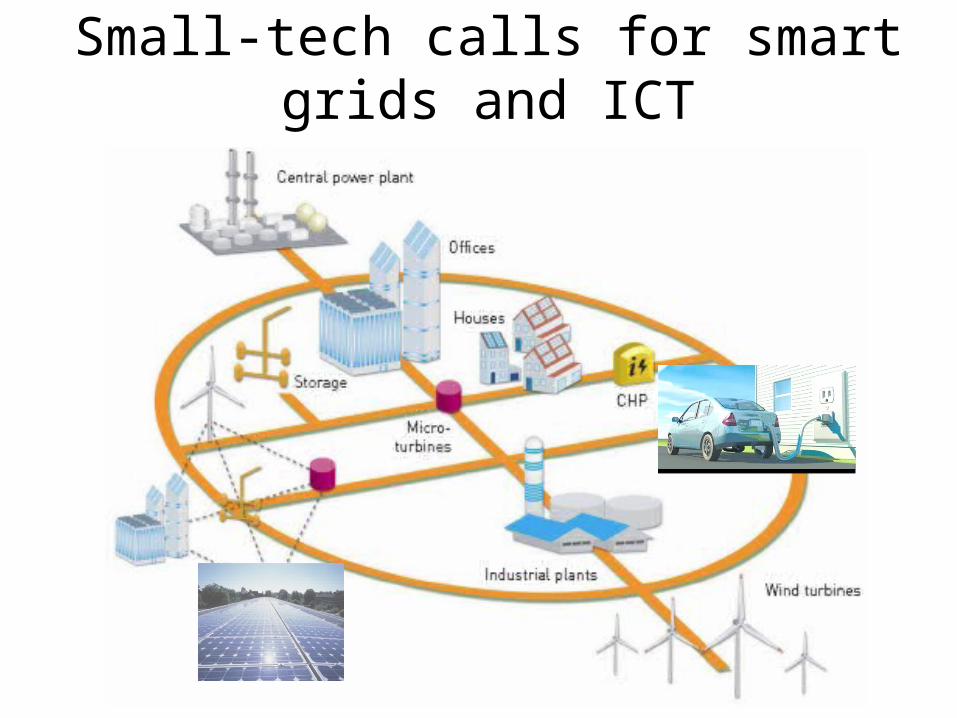
Small-tech calls for smart grids and ICT
Ea Energianalyse
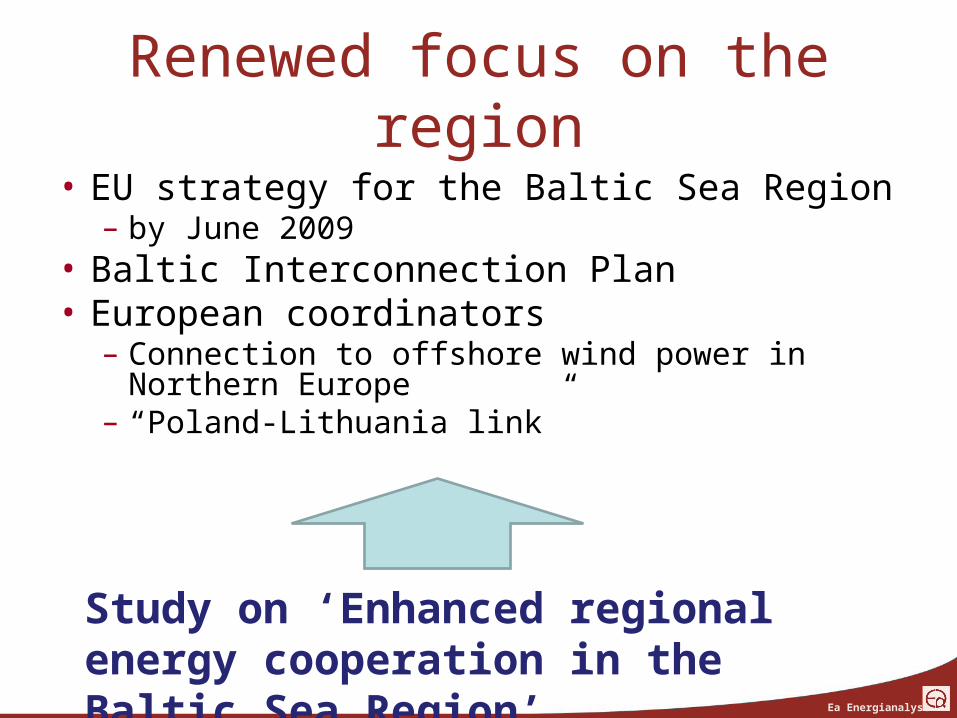
Renewed focus on the region
• EU strategy for the Baltic Sea Region– by June 2009
• Baltic Interconnection Plan• European coordinators
– Connection to offshore wind power in Northern Europe
– “Poland-Lithuania link”
Study on ‘Enhanced regional energy cooperation in the Baltic Sea Region’
Ea Energianalyse
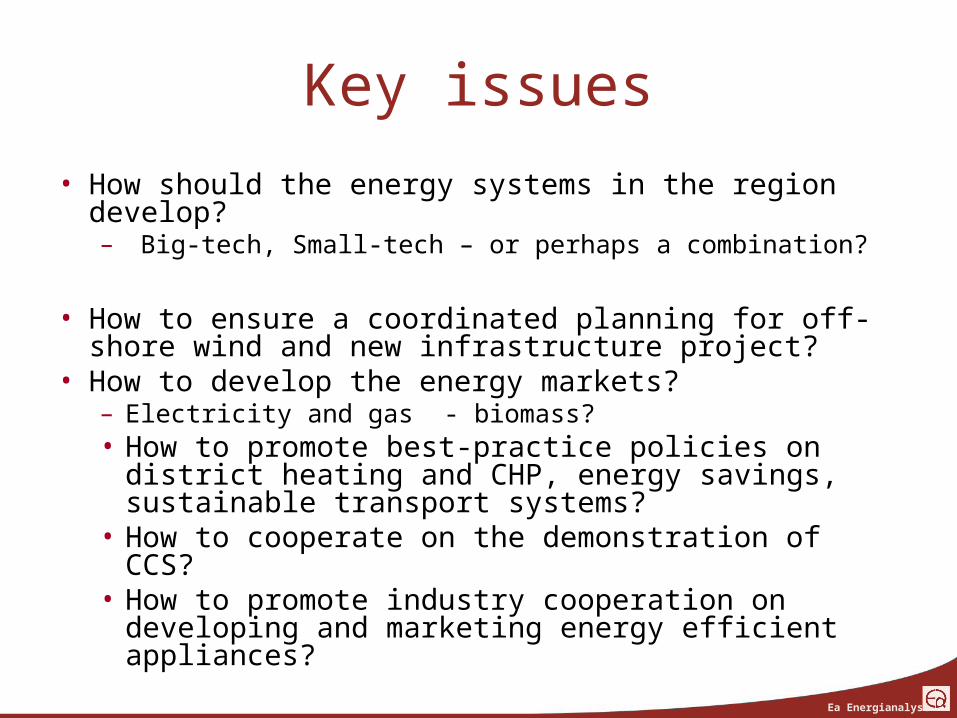
Key issues
• How should the energy systems in the region develop?– Big-tech, Small-tech – or perhaps a combination?
• How to ensure a coordinated planning for off-shore wind and new infrastructure project?
• How to develop the energy markets?– Electricity and gas - biomass?• How to promote best-practice policies on district
heating and CHP, energy savings, sustainable transport systems?
• How to cooperate on the demonstration of CCS?• How to promote industry cooperation on developing
and marketing energy efficient appliances?
Ea Energianalyse
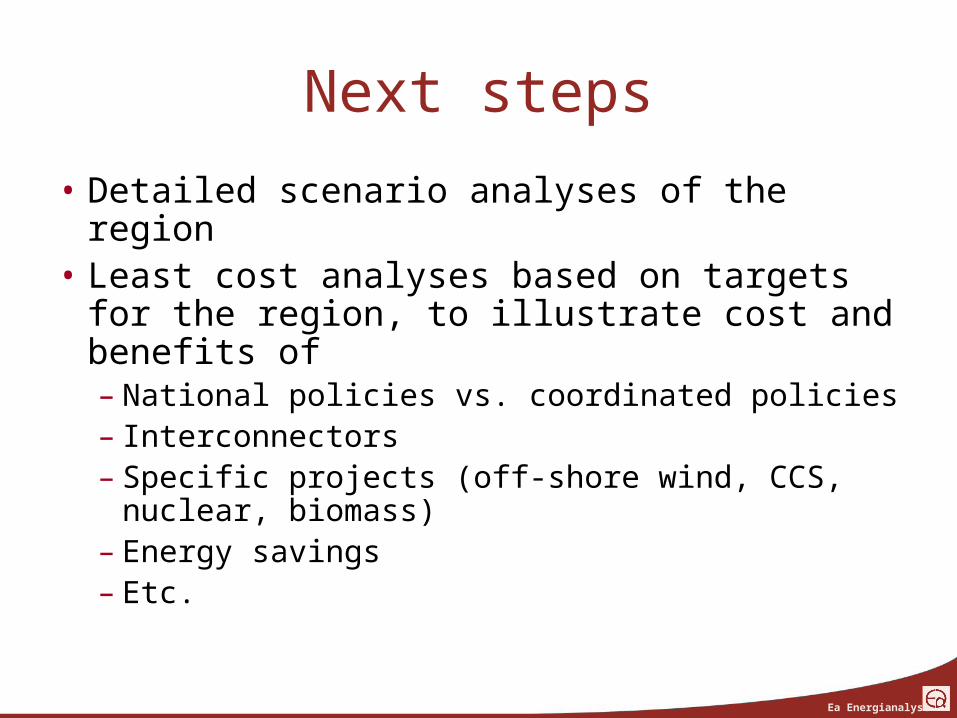
Next steps
• Detailed scenario analyses of the region• Least cost analyses based on targets for
the region, to illustrate cost and benefits of– National policies vs. coordinated policies– Interconnectors– Specific projects (off-shore wind, CCS,
nuclear, biomass)– Energy savings– Etc.