Embed Size (px)
Citation preview
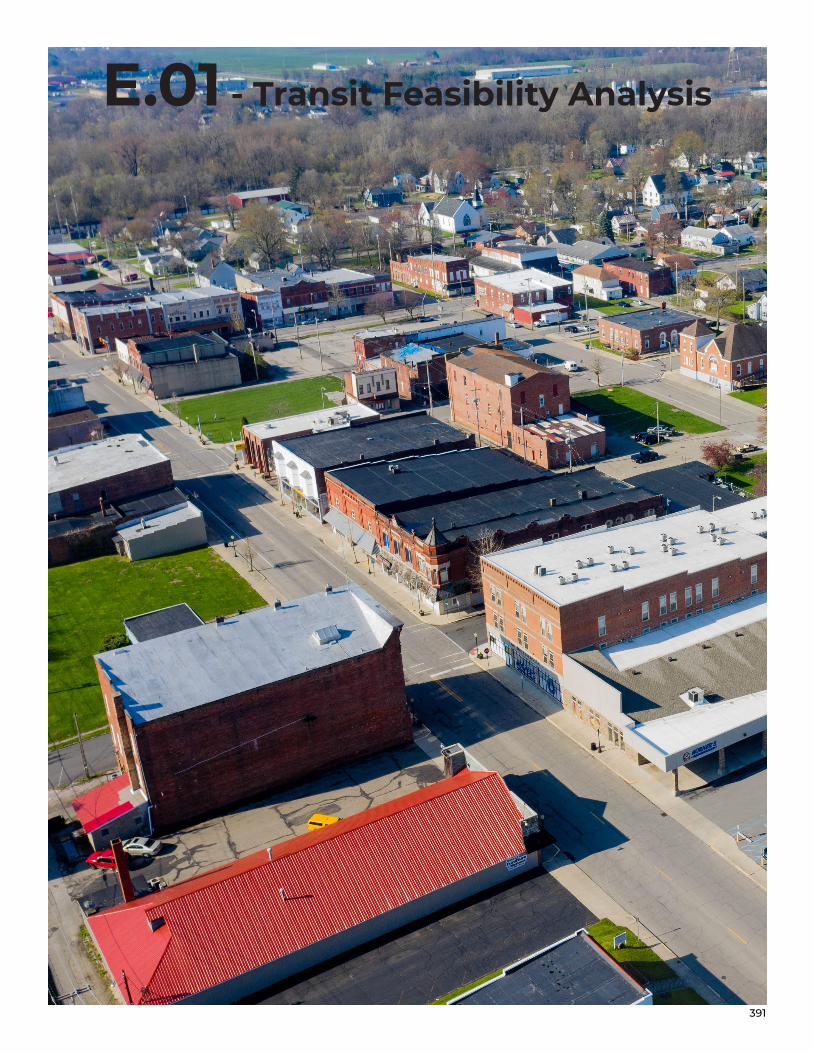
E.01 - Transit Feasibility Analysis
391
Madison County Council of Governments
TRANSIT FEASIBILITY ANALYSIS
FINAL REPORT │ October 5, 2020
55 Railroad Row White River Junction, VT 05001
802.295.4999 www.rsginc.com
PREPARED FOR: MADISON COUNTY COUNCIL OF GOVERNMENTS
SUBMITTED BY:
RSG
392

393
Madison County Council of Governments
TRANSIT FEASIBILITY ANALYSIS
i
CONTENTS 1.0 INTRODUCTION ........................................................................................................... 1
2.0 METHODOLOGY .......................................................................................................... 2
MULTINOMIAL LOGIT MODEL ........................................................................... 2
WEIGHTED SAMPLE ENUMERATION ............................................................... 4
3.0 ANALYSIS .................................................................................................................... 6
FORECAST MODEL INPUTS ............................................................................. 7
SCENARIO COMPARISON................................................................................. 9
4.0 CONCLUSIONS AND RECOMMENDED STEPS ....................................................... 15
LIST OF FIGURES
FIGURE 1: MODE LIST ..................................................................................................... 2 FIGURE 2: MODEL SPECIFICATION................................................................................ 2 FIGURE 3: MNL CHOICE MODEL ESTIMATION RESULTS ............................................ 3 FIGURE 4: VALUE OF TIME ............................................................................................. 3 FIGURE 5: AGGREGATE ONE-WAY TRAVELERS COMPARISON SYSTEMS ............... 3 FIGURE 6: MODE SHARE OF ONE-WAY TRAVELERS COMPARISON
SYSTEMS .................................................................................................................. 4 FIGURE 7: SUBAREA CATCHMENTS ............................................................................. 5 FIGURE 8: PROPOSED COMMUTER RAIL LINE ............................................................. 6 FIGURE 9: PROPOSED EXPRESS BUS ROUTE ............................................................. 7 FIGURE 10: EXPRESS BUS INPUTS................................................................................ 8 FIGURE 11: COMMUTER RAIL INPUTS ........................................................................... 8 FIGURE 12: DRIVE INPUTS .............................................................................................. 8 FIGURE 13: 2045 SCENARIO SUBAREA GROWTH RATES (TIMES BASE
TRIPS) ....................................................................................................................... 8 FIGURE 14: 2045 SCENARIO CONGESTION INCREASES ............................................. 8 FIGURE 15: 2045 ONE WAY DAILY TRAVELERS BY SCENARIO .................................. 9 FIGURE 16: ONE-WAY TRAVELERS BY ORIGIN ZONE (2015 BASE) ......................... 10 FIGURE 17: ONE-WAY TRAVELERS BY ORIGIN ZONE (2045 STATUS QUO) ............ 11 FIGURE 18: ONE-WAY TRAVELERS BY ORIGIN ZONE (2045 INVESTING IN
PLACE) .................................................................................................................... 11 FIGURE 19: 2015 BASE YEAR SCENARIO (EXISTING CONDITIONS) ........................ 12 FIGURE 20: 2045 STATUS QUO SCENARIO ................................................................. 13 FIGURE 21: 2045 INVESTING IN PLACE SCENARIO .................................................... 14
394

395
transit feasibility analysis
1
1.0 INTRODUCTION
RSG coordinated with the Madison County Council of Governments (MCCOG) to conduct a
feasibility analysis of a proposed commuter transit connection between downtown Anderson, IN
and downtown Indianapolis, IN. This study offers a preliminary indication of potential ridership
within the Anderson Metropolitan Planning Area (MPA), and forecasts potential ridership
utilizing scenarios developed as part of the 2045 InMotion Metropolitan Transportation Plan
(MTP).
While the results of this study are not adequate to support a Federal Transit Administration
capital grant application, it does provide necessary insight to indicate whether further, more
detailed study of expanded commuter service is warranted. This study leverages a stated-
preference survey add-on from the 2014 Heartland in Motion Household Travel Survey, and
expands on initial work conducted in 2014 to provide more detailed analysis of the components
that impact potential riders of a new commuter service connection. Additionally, the analysis
leverages big data origin-destination flows between the Anderson MPA developed for the
regional travel demand model, as well as hypothetical highway and transit times.
Working within the constraints of the design of the 2014 stated-preference survey, RSG
analyzed potential ridership for express bus service and commuter rail service.
Additionally, two 2045 development scenarios from the MTP were included in the analysis to
gauge how ridership is anticipated to evolve over 30 years from the 2015 base year:
1. Status Quo
Maintains historical development patterns and trends within the MPA, and functions as the
baseline forecast scenario.
2. Investing in Place
Focuses on the redevelopment of existing downtown areas in the MPA, and anticipates
additional growth from the Indianapolis region into the MPA.
396
Madison County Council of Governments
2
2.0 METHODOLOGY
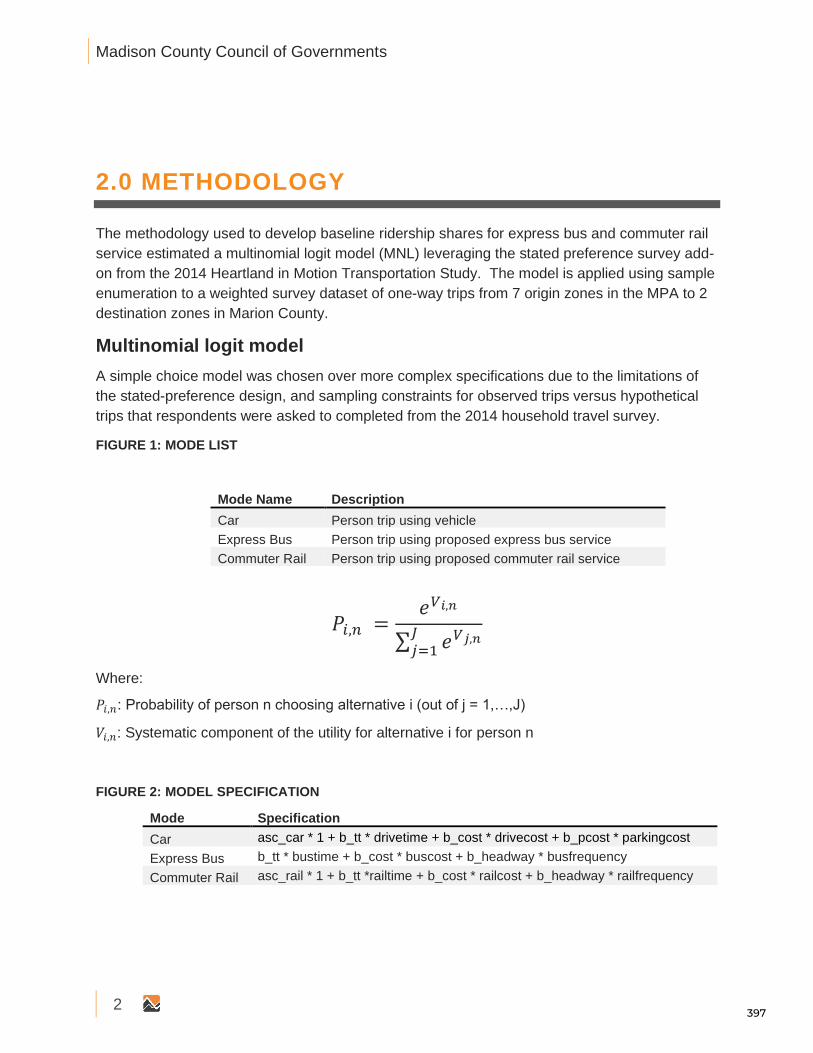
The methodology used to develop baseline ridership shares for express bus and commuter rail
service estimated a multinomial logit model (MNL) leveraging the stated preference survey add-
on from the 2014 Heartland in Motion Transportation Study. The model is applied using sample
enumeration to a weighted survey dataset of one-way trips from 7 origin zones in the MPA to 2
destination zones in Marion County.
Multinomial logit model
A simple choice model was chosen over more complex specifications due to the limitations of
the stated-preference design, and sampling constraints for observed trips versus hypothetical
trips that respondents were asked to completed from the 2014 household travel survey.
FIGURE 1: MODE LIST
𝑃𝑖,𝑛 =𝑒𝑉𝑖,𝑛
∑ 𝑒𝑉𝑗,𝑛𝐽𝑗=1
Where:
𝑃𝑖,𝑛: Probability of person n choosing alternative i (out of j = 1,…,J)
𝑉𝑖,𝑛: Systematic component of the utility for alternative i for person n
FIGURE 2: MODEL SPECIFICATION
Mode Name Description
Car Person trip using vehicle
Express Bus Person trip using proposed express bus service
Commuter Rail Person trip using proposed commuter rail service
Mode Specification
Car asc_car * 1 + b_tt * drivetime + b_cost * drivecost + b_pcost * parkingcost
Express Bus b_tt * bustime + b_cost * buscost + b_headway * busfrequency
Commuter Rail asc_rail * 1 + b_tt *railtime + b_cost * railcost + b_headway * railfrequency
397
transit feasibility analysis
3
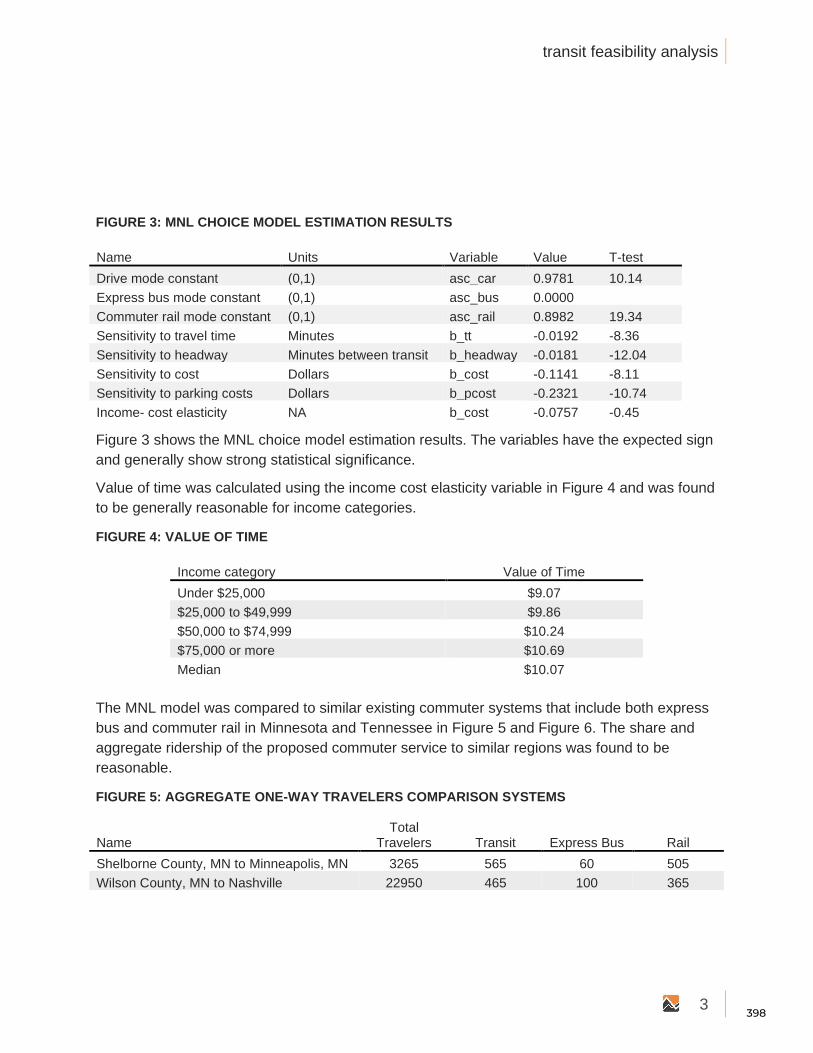
FIGURE 3: MNL CHOICE MODEL ESTIMATION RESULTS
Figure 3 shows the MNL choice model estimation results. The variables have the expected sign
and generally show strong statistical significance.
Value of time was calculated using the income cost elasticity variable in Figure 4 and was found
to be generally reasonable for income categories.
FIGURE 4: VALUE OF TIME
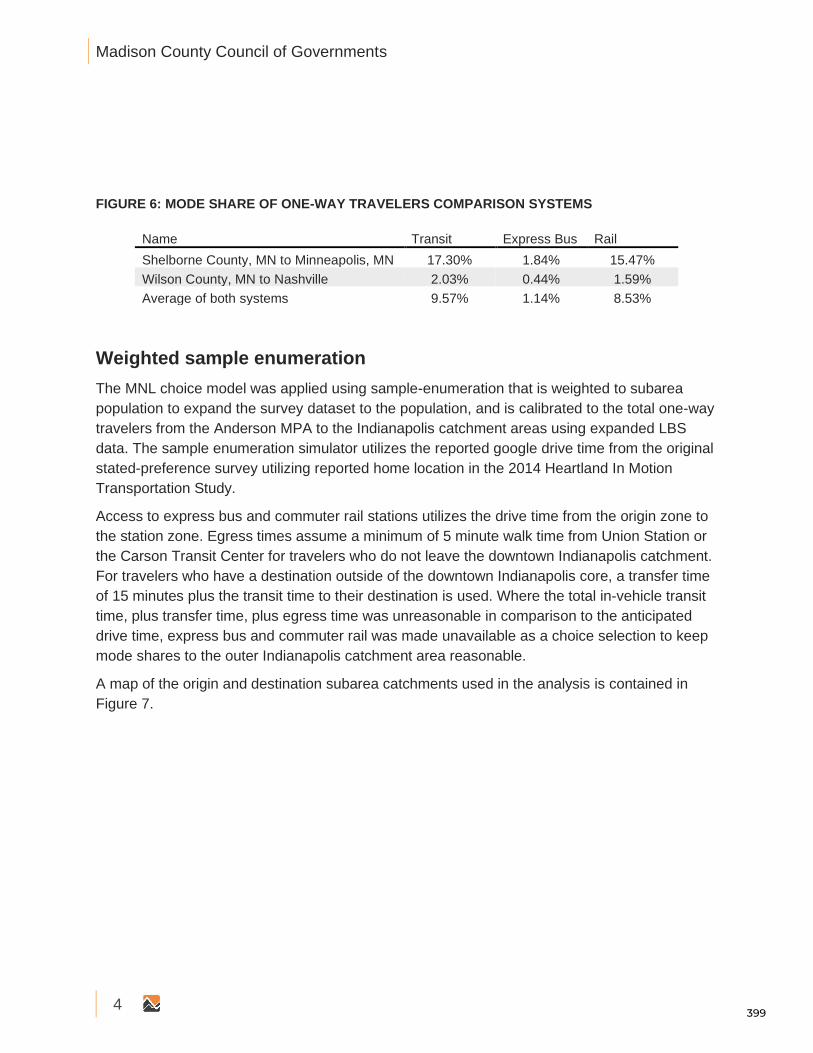
The MNL model was compared to similar existing commuter systems that include both express
bus and commuter rail in Minnesota and Tennessee in Figure 5 and Figure 6. The share and
aggregate ridership of the proposed commuter service to similar regions was found to be
reasonable.
FIGURE 5: AGGREGATE ONE-WAY TRAVELERS COMPARISON SYSTEMS
Name Units Variable Value T-test
Drive mode constant (0,1) asc_car 0.9781 10.14
Express bus mode constant (0,1) asc_bus 0.0000
Commuter rail mode constant (0,1) asc_rail 0.8982 19.34
Sensitivity to travel time Minutes b_tt -0.0192 -8.36
Sensitivity to headway Minutes between transit b_headway -0.0181 -12.04
Sensitivity to cost Dollars b_cost -0.1141 -8.11
Sensitivity to parking costs Dollars b_pcost -0.2321 -10.74
Income- cost elasticity NA b_cost -0.0757 -0.45
Income category Value of Time
Under $25,000 $9.07
$25,000 to $49,999 $9.86
$50,000 to $74,999 $10.24
$75,000 or more $10.69
Median $10.07
Name Total
Travelers Transit Express Bus Rail
Shelborne County, MN to Minneapolis, MN 3265 565 60 505
Wilson County, MN to Nashville 22950 465 100 365
398
Madison County Council of Governments
4
FIGURE 6: MODE SHARE OF ONE-WAY TRAVELERS COMPARISON SYSTEMS
Weighted sample enumeration
The MNL choice model was applied using sample-enumeration that is weighted to subarea
population to expand the survey dataset to the population, and is calibrated to the total one-way
travelers from the Anderson MPA to the Indianapolis catchment areas using expanded LBS
data. The sample enumeration simulator utilizes the reported google drive time from the original
stated-preference survey utilizing reported home location in the 2014 Heartland In Motion
Transportation Study.
Access to express bus and commuter rail stations utilizes the drive time from the origin zone to
the station zone. Egress times assume a minimum of 5 minute walk time from Union Station or
the Carson Transit Center for travelers who do not leave the downtown Indianapolis catchment.
For travelers who have a destination outside of the downtown Indianapolis core, a transfer time
of 15 minutes plus the transit time to their destination is used. Where the total in-vehicle transit
time, plus transfer time, plus egress time was unreasonable in comparison to the anticipated
drive time, express bus and commuter rail was made unavailable as a choice selection to keep
mode shares to the outer Indianapolis catchment area reasonable.
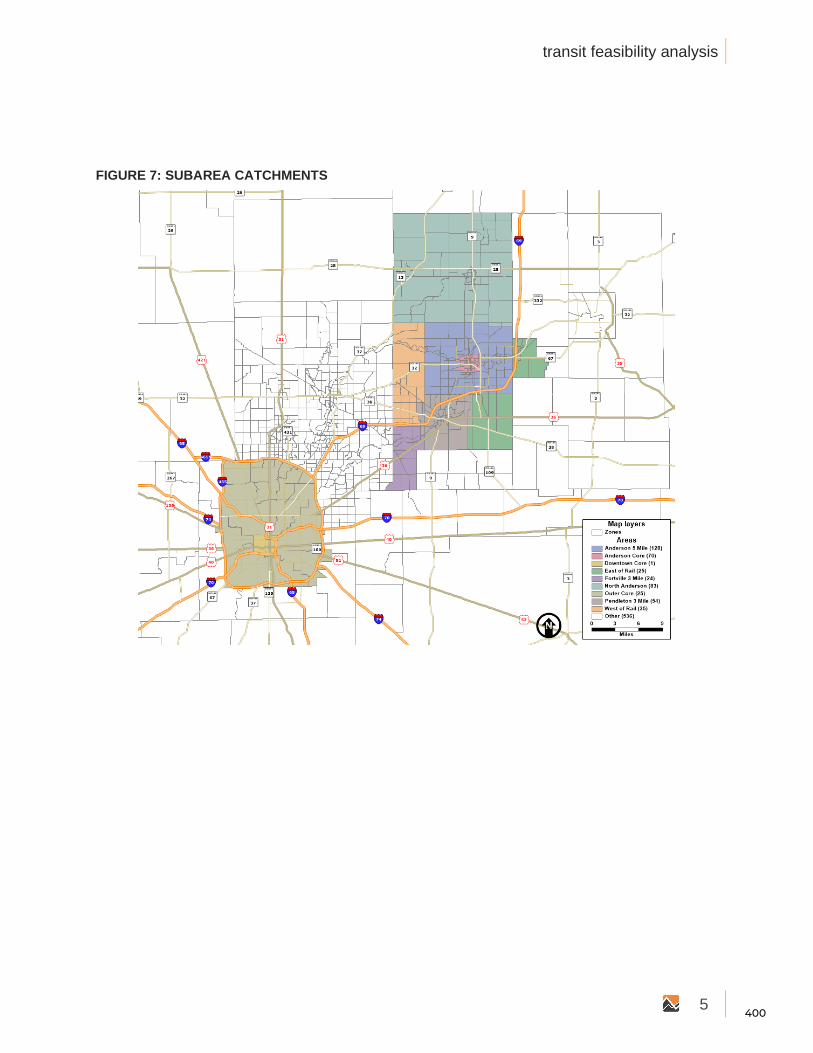
A map of the origin and destination subarea catchments used in the analysis is contained in
Figure 7.
Name Transit Express Bus Rail
Shelborne County, MN to Minneapolis, MN 17.30% 1.84% 15.47%
Wilson County, MN to Nashville 2.03% 0.44% 1.59%
Average of both systems 9.57% 1.14% 8.53%
399
transit feasibility analysis
5
FIGURE 7: SUBAREA CATCHMENTS
400
Madison County Council of Governments
6
3.0 ANALYSIS
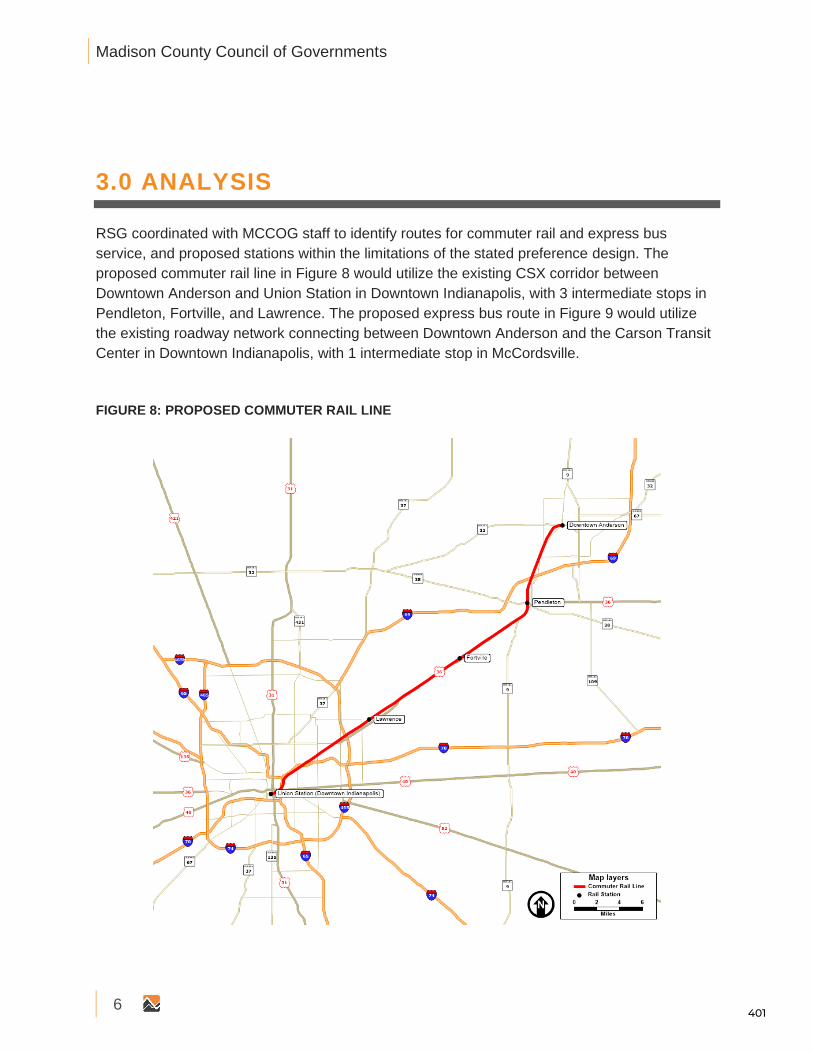
RSG coordinated with MCCOG staff to identify routes for commuter rail and express bus
service, and proposed stations within the limitations of the stated preference design. The
proposed commuter rail line in Figure 8 would utilize the existing CSX corridor between
Downtown Anderson and Union Station in Downtown Indianapolis, with 3 intermediate stops in
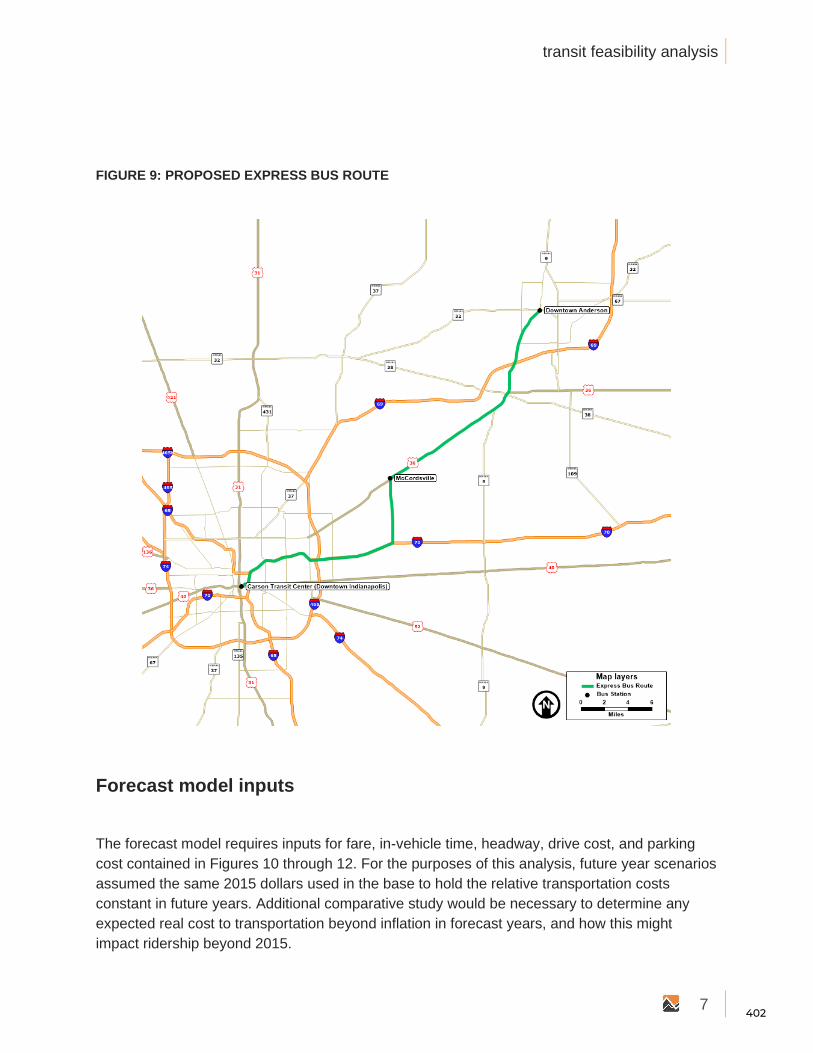
Pendleton, Fortville, and Lawrence. The proposed express bus route in Figure 9 would utilize
the existing roadway network connecting between Downtown Anderson and the Carson Transit
Center in Downtown Indianapolis, with 1 intermediate stop in McCordsville.
FIGURE 8: PROPOSED COMMUTER RAIL LINE
401
transit feasibility analysis
7
FIGURE 9: PROPOSED EXPRESS BUS ROUTE
Forecast model inputs
The forecast model requires inputs for fare, in-vehicle time, headway, drive cost, and parking
cost contained in Figures 10 through 12. For the purposes of this analysis, future year scenarios
assumed the same 2015 dollars used in the base to hold the relative transportation costs
constant in future years. Additional comparative study would be necessary to determine any
expected real cost to transportation beyond inflation in forecast years, and how this might
impact ridership beyond 2015.
402
Madison County Council of Governments
8
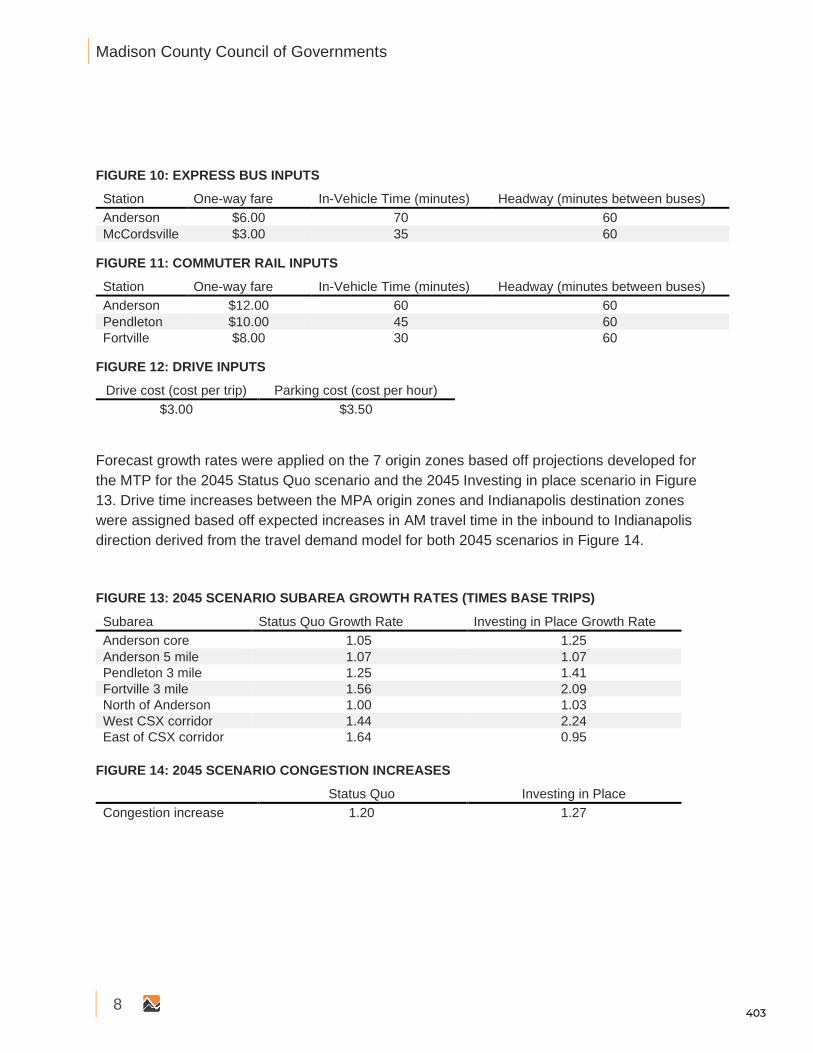
FIGURE 10: EXPRESS BUS INPUTS
FIGURE 11: COMMUTER RAIL INPUTS
FIGURE 12: DRIVE INPUTS
Forecast growth rates were applied on the 7 origin zones based off projections developed for
the MTP for the 2045 Status Quo scenario and the 2045 Investing in place scenario in Figure
13. Drive time increases between the MPA origin zones and Indianapolis destination zones
were assigned based off expected increases in AM travel time in the inbound to Indianapolis
direction derived from the travel demand model for both 2045 scenarios in Figure 14.
FIGURE 13: 2045 SCENARIO SUBAREA GROWTH RATES (TIMES BASE TRIPS)
FIGURE 14: 2045 SCENARIO CONGESTION INCREASES
Station One-way fare In-Vehicle Time (minutes) Headway (minutes between buses)
Anderson $6.00 70 60
McCordsville $3.00 35 60
Station One-way fare In-Vehicle Time (minutes) Headway (minutes between buses)
Anderson $12.00 60 60
Pendleton $10.00 45 60
Fortville $8.00 30 60
Drive cost (cost per trip) Parking cost (cost per hour)
$3.00 $3.50
Subarea Status Quo Growth Rate Investing in Place Growth Rate
Anderson core 1.05 1.25
Anderson 5 mile 1.07 1.07
Pendleton 3 mile 1.25 1.41
Fortville 3 mile 1.56 2.09
North of Anderson 1.00 1.03
West CSX corridor 1.44 2.24
East of CSX corridor 1.64 0.95
Status Quo Investing in Place
Congestion increase 1.20 1.27
403
transit feasibility analysis
9
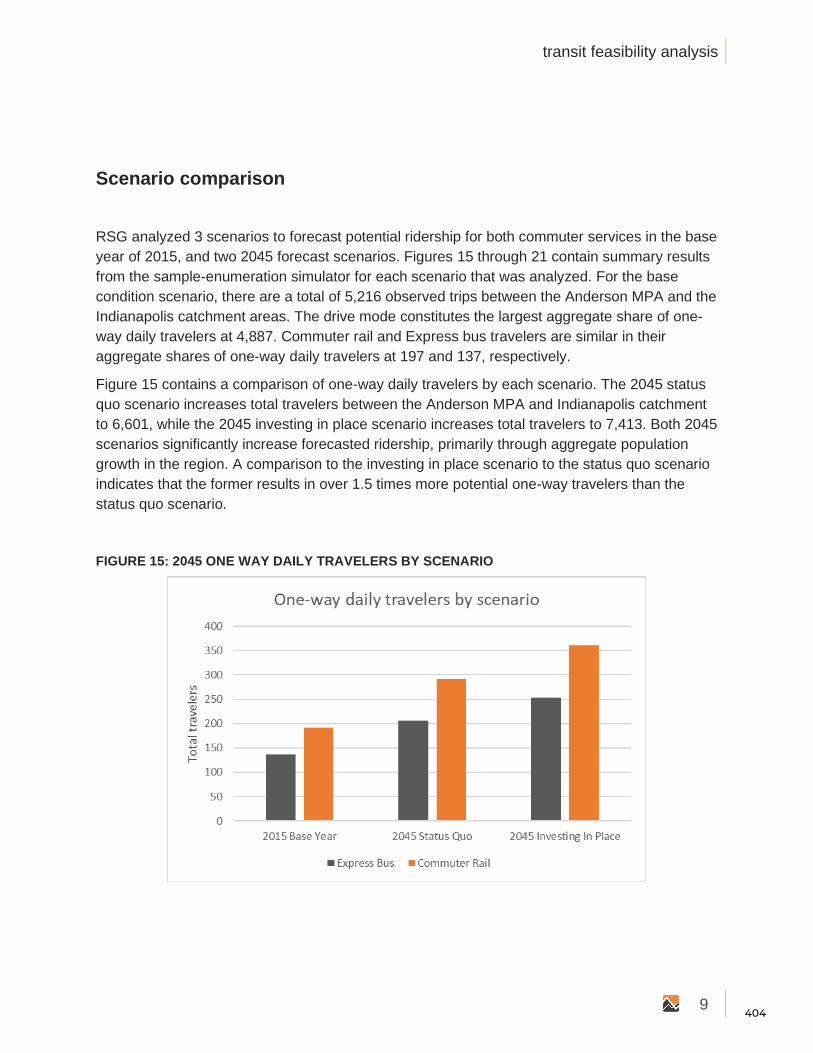
Scenario comparison
RSG analyzed 3 scenarios to forecast potential ridership for both commuter services in the base
year of 2015, and two 2045 forecast scenarios. Figures 15 through 21 contain summary results
from the sample-enumeration simulator for each scenario that was analyzed. For the base
condition scenario, there are a total of 5,216 observed trips between the Anderson MPA and the
Indianapolis catchment areas. The drive mode constitutes the largest aggregate share of one-
way daily travelers at 4,887. Commuter rail and Express bus travelers are similar in their
aggregate shares of one-way daily travelers at 197 and 137, respectively.
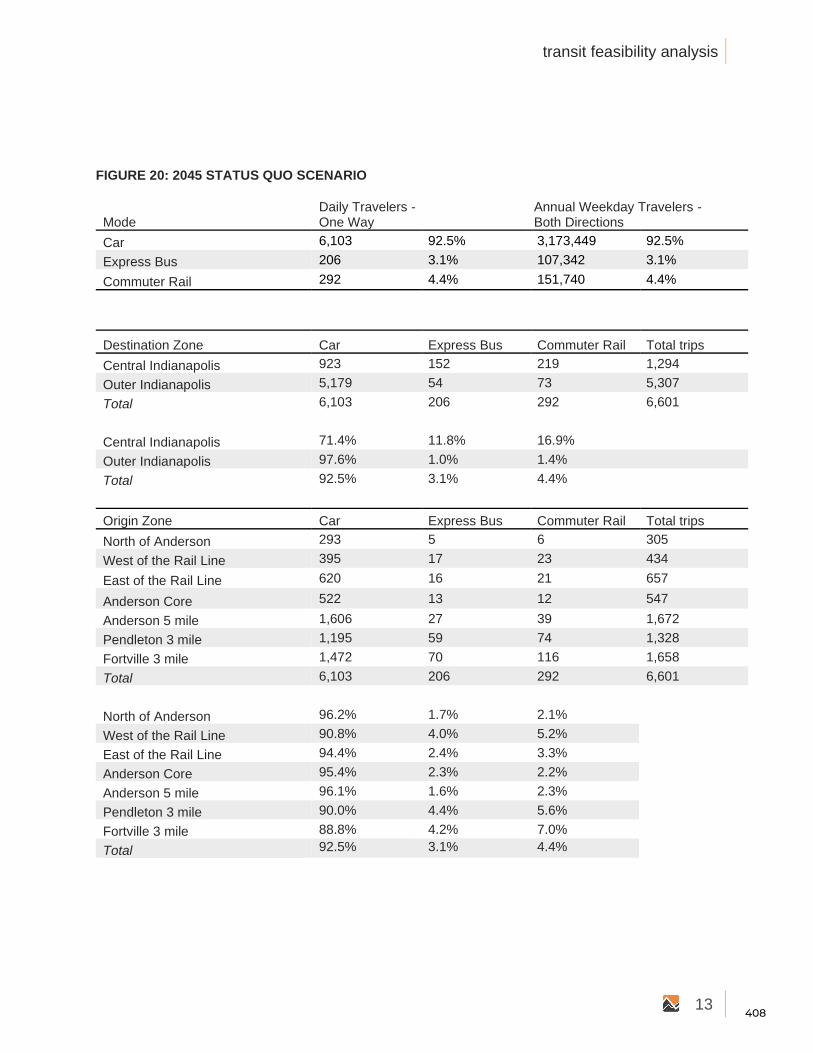
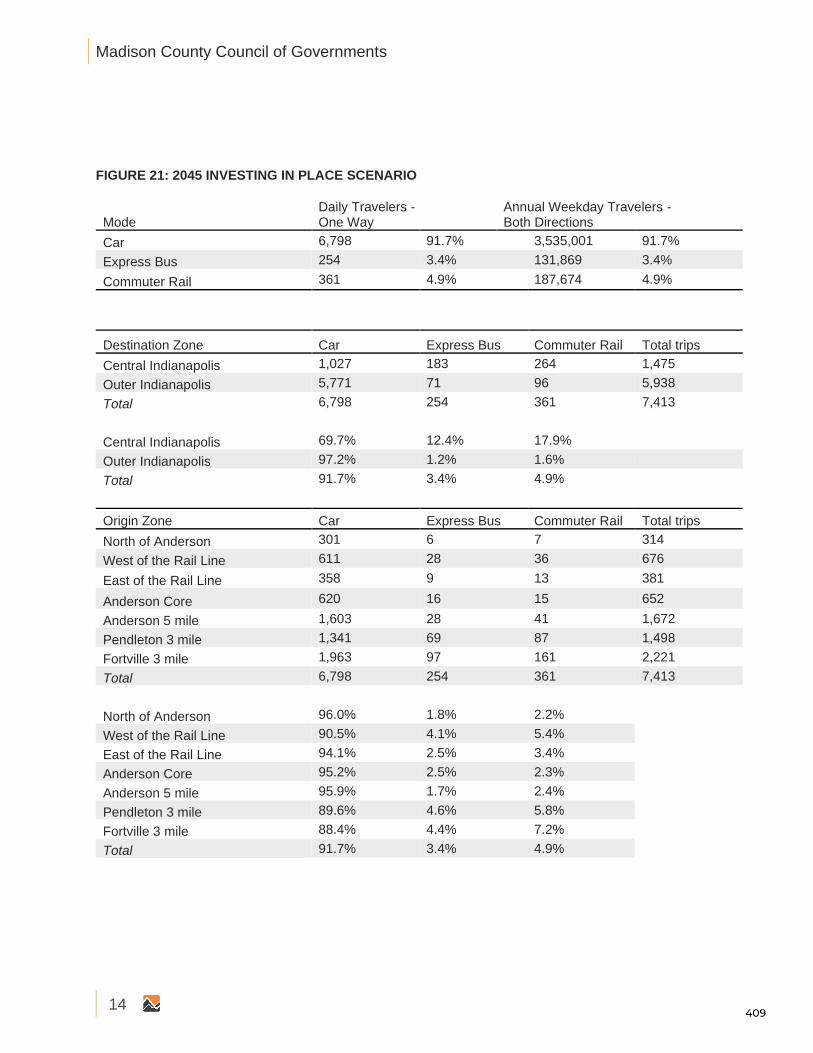
Figure 15 contains a comparison of one-way daily travelers by each scenario. The 2045 status
quo scenario increases total travelers between the Anderson MPA and Indianapolis catchment
to 6,601, while the 2045 investing in place scenario increases total travelers to 7,413. Both 2045
scenarios significantly increase forecasted ridership, primarily through aggregate population
growth in the region. A comparison to the investing in place scenario to the status quo scenario
indicates that the former results in over 1.5 times more potential one-way travelers than the
status quo scenario.
FIGURE 15: 2045 ONE WAY DAILY TRAVELERS BY SCENARIO
404
Madison County Council of Governments
10
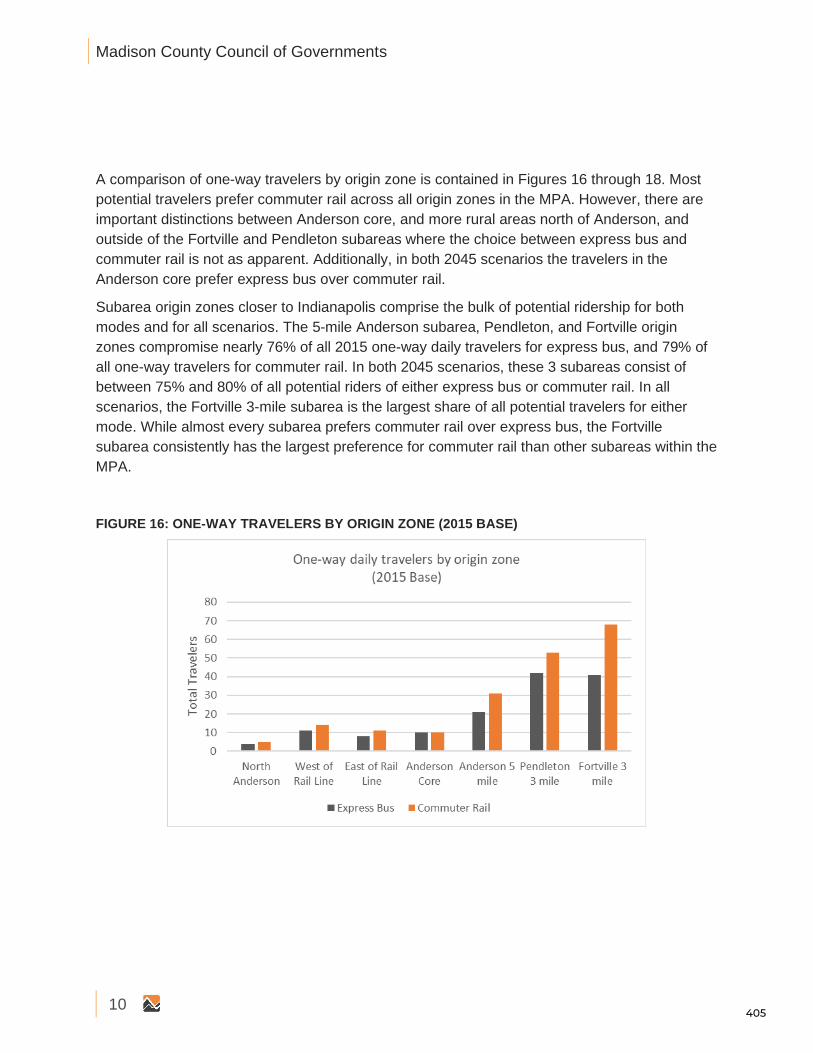
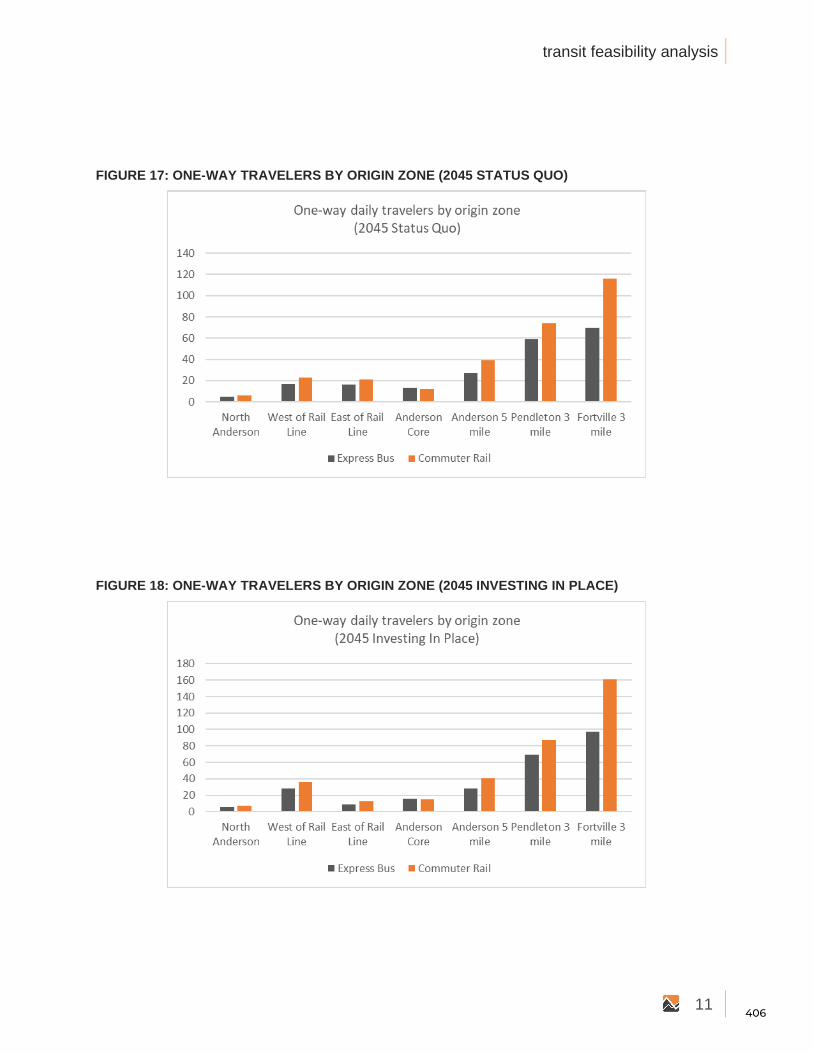
A comparison of one-way travelers by origin zone is contained in Figures 16 through 18. Most
potential travelers prefer commuter rail across all origin zones in the MPA. However, there are
important distinctions between Anderson core, and more rural areas north of Anderson, and
outside of the Fortville and Pendleton subareas where the choice between express bus and
commuter rail is not as apparent. Additionally, in both 2045 scenarios the travelers in the
Anderson core prefer express bus over commuter rail.
Subarea origin zones closer to Indianapolis comprise the bulk of potential ridership for both
modes and for all scenarios. The 5-mile Anderson subarea, Pendleton, and Fortville origin
zones compromise nearly 76% of all 2015 one-way daily travelers for express bus, and 79% of
all one-way travelers for commuter rail. In both 2045 scenarios, these 3 subareas consist of
between 75% and 80% of all potential riders of either express bus or commuter rail. In all
scenarios, the Fortville 3-mile subarea is the largest share of all potential travelers for either
mode. While almost every subarea prefers commuter rail over express bus, the Fortville
subarea consistently has the largest preference for commuter rail than other subareas within the
MPA.
FIGURE 16: ONE-WAY TRAVELERS BY ORIGIN ZONE (2015 BASE)
405
transit feasibility analysis
11
FIGURE 17: ONE-WAY TRAVELERS BY ORIGIN ZONE (2045 STATUS QUO)
FIGURE 18: ONE-WAY TRAVELERS BY ORIGIN ZONE (2045 INVESTING IN PLACE)
406
Madison County Council of Governments
12
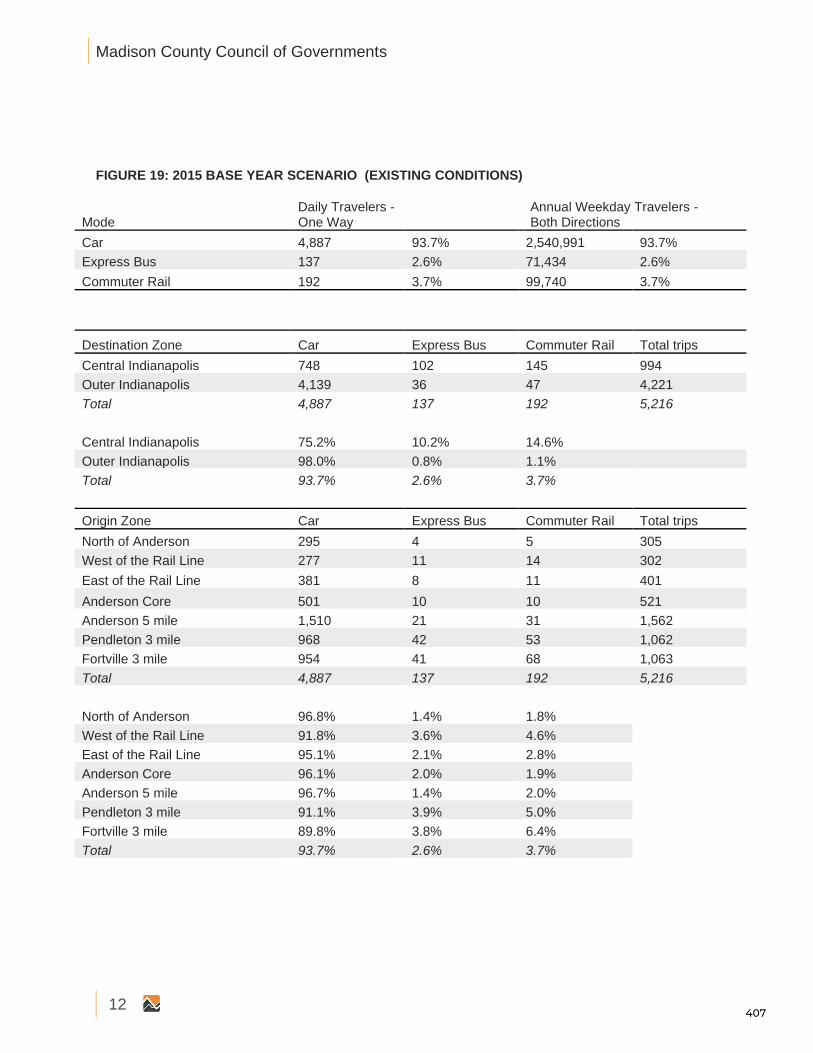
FIGURE 19: 2015 BASE YEAR SCENARIO (EXISTING CONDITIONS)
Mode Daily Travelers - One Way
Annual Weekday Travelers - Both Directions
Car 4,887 93.7% 2,540,991 93.7%
Express Bus 137 2.6% 71,434 2.6%
Commuter Rail 192 3.7% 99,740 3.7%
Destination Zone Car Express Bus Commuter Rail Total trips
Central Indianapolis 748 102 145 994
Outer Indianapolis 4,139 36 47 4,221
Total 4,887 137 192 5,216
Central Indianapolis 75.2% 10.2% 14.6%
Outer Indianapolis 98.0% 0.8% 1.1%
Total 93.7% 2.6% 3.7%
Origin Zone Car Express Bus Commuter Rail Total trips
North of Anderson 295 4 5 305
West of the Rail Line 277 11 14 302
East of the Rail Line 381 8 11 401
Anderson Core 501 10 10 521
Anderson 5 mile 1,510 21 31 1,562
Pendleton 3 mile 968 42 53 1,062
Fortville 3 mile 954 41 68 1,063
Total 4,887 137 192 5,216
North of Anderson 96.8% 1.4% 1.8%
West of the Rail Line 91.8% 3.6% 4.6%
East of the Rail Line 95.1% 2.1% 2.8%
Anderson Core 96.1% 2.0% 1.9%
Anderson 5 mile 96.7% 1.4% 2.0%
Pendleton 3 mile 91.1% 3.9% 5.0%
Fortville 3 mile 89.8% 3.8% 6.4%
Total 93.7% 2.6% 3.7%
407
transit feasibility analysis
13
FIGURE 20: 2045 STATUS QUO SCENARIO
Mode Daily Travelers - One Way
Annual Weekday Travelers - Both Directions
Car 6,103 92.5% 3,173,449 92.5%
Express Bus 206 3.1% 107,342 3.1%
Commuter Rail 292 4.4% 151,740 4.4%
Destination Zone Car Express Bus Commuter Rail Total trips
Central Indianapolis 923 152 219 1,294
Outer Indianapolis 5,179 54 73 5,307
Total 6,103 206 292 6,601
Central Indianapolis 71.4% 11.8% 16.9%
Outer Indianapolis 97.6% 1.0% 1.4%
Total 92.5% 3.1% 4.4%
Origin Zone Car Express Bus Commuter Rail Total trips
North of Anderson 293 5 6 305
West of the Rail Line 395 17 23 434
East of the Rail Line 620 16 21 657
Anderson Core 522 13 12 547
Anderson 5 mile 1,606 27 39 1,672
Pendleton 3 mile 1,195 59 74 1,328
Fortville 3 mile 1,472 70 116 1,658
Total 6,103 206 292 6,601
North of Anderson 96.2% 1.7% 2.1%
West of the Rail Line 90.8% 4.0% 5.2%
East of the Rail Line 94.4% 2.4% 3.3%
Anderson Core 95.4% 2.3% 2.2%
Anderson 5 mile 96.1% 1.6% 2.3%
Pendleton 3 mile 90.0% 4.4% 5.6%
Fortville 3 mile 88.8% 4.2% 7.0%
Total 92.5% 3.1% 4.4%
408
Madison County Council of Governments
14
FIGURE 21: 2045 INVESTING IN PLACE SCENARIO
Mode Daily Travelers - One Way
Annual Weekday Travelers - Both Directions
Car 6,798 91.7% 3,535,001 91.7%
Express Bus 254 3.4% 131,869 3.4%
Commuter Rail 361 4.9% 187,674 4.9%
Destination Zone Car Express Bus Commuter Rail Total trips
Central Indianapolis 1,027 183 264 1,475
Outer Indianapolis 5,771 71 96 5,938
Total 6,798 254 361 7,413
Central Indianapolis 69.7% 12.4% 17.9%
Outer Indianapolis 97.2% 1.2% 1.6%
Total 91.7% 3.4% 4.9%
Origin Zone Car Express Bus Commuter Rail Total trips
North of Anderson 301 6 7 314
West of the Rail Line 611 28 36 676
East of the Rail Line 358 9 13 381
Anderson Core 620 16 15 652
Anderson 5 mile 1,603 28 41 1,672
Pendleton 3 mile 1,341 69 87 1,498
Fortville 3 mile 1,963 97 161 2,221
Total 6,798 254 361 7,413
North of Anderson 96.0% 1.8% 2.2%
West of the Rail Line 90.5% 4.1% 5.4%
East of the Rail Line 94.1% 2.5% 3.4%
Anderson Core 95.2% 2.5% 2.3%
Anderson 5 mile 95.9% 1.7% 2.4%
Pendleton 3 mile 89.6% 4.6% 5.8%
Fortville 3 mile 88.4% 4.4% 7.2%
Total 91.7% 3.4% 4.9%
409
transit feasibility analysis
15
4.0 CONCLUSIONS AND RECOMMENDED STEPS
The 2015 base year forecast of potential commuter service riders indicates relatively low
potential ridership in the Anderson MPA for commuter rail and express bus, respectively. As
expected, 2045 scenarios significantly increase potential ridership of both commuter rail and
express bus. The investing in place scenario results in the largest increase in potential
commuter service travelers within the MPA. This increase in potential ridership is primarily
attributed to uniform expected increases in population in both scenarios, where the Investing in
Place scenario expects larger increases in population. The average increase in population for
the Status Quo scenario is nearly 29%, whereas the expected increase in the Investing in Place
scenario is nearly 43%. Additionally, some increase is attributed to higher population projections
between core areas in the Anderson core, Anderson 5 Mile, Pendleton 3 mile, and Fortville 3
mile areas which represent higher concentrations of eligible choice riders, and riders who are in
closer proximity of anticipated stations or stops. On average, these higher density core locations
increase by nearly 23% in the Status Quo scenario and by nearly 46% in the Investing in Place
scenario. In general, it can be expected that the more people who reside closer to a station or
stop will utilize a potential mass transit service than those who reside further from it, supporting
the notion that more compact, dense areas around planned transit service result in communities
that are “transit ready”. However, some caution should be exercised in this notion, communities
that are dense and compact must also have populations with trip making behavior that have
logical origins and destinations that can be realistically served by a proposed transit service,
and while at the same time provide a competitive alternative to automobiles for eligible travelers.
Calibration of the mode-choice model was conducted by comparing the share, and aggregate
daily one-way ridership using CTPP and Census Journey to Work data in Minnesota and
Tennessee. In these instances, while it's encouraging to note that the forecasted potential
ridership in the Anderson MPA is similar to other areas, caution should be used when
comparing actual ridership to projected ridership because of “new mode” bias in the stated
preference design where respondents have a tendency to favor new transportation choices over
ones that exist in surveys.
A key limitation of the stated-preference design from the 2014 Heartland in Motion
Transportation Study is that the survey did not include sampling of potential riders outside of the
Anderson MPA in Lawrence, McCordsville, and Fishers who would in all likelihood also use this
service. As a result of this design limitation, the application of the choice model does not
include potential travelers from any of these communities. Additionally, the 2014 Heartland in
Motion Study did not sample enough actual daily commuters between the MPA and the
Downtown Indianapolis core. As a result, respondents who reported any trip within a 30-day
period were included in the survey and necessary to achieve a statistically valid model
estimation- this as an additional source of optimism bias that is “hard baked” into this analysis.
410
Madison County Council of Governments
16
If MCCOG continues to study new commuter service in the region, a new stated-preference
survey will be necessary that samples from observed travelers with Downtown Indianapolis
destinations along the entire proposed route of the commuter service outside of the Anderson
MPA. Additionally, MCCOG should refine additional details of how either express bus or
commuter rail would operate, this should include, at a minimum:
• Refinement of in-vehicle travel times on rail or road network
• Refinement of operational hours and headways
• Refinement of commuter service access/egress options
• Inclusion of additional amenities that may attract choice riders
411

412

55 Railroad Row
White River Junction, VT 05001
802.295.4999
www.rsginc.com
White River Junction &
Burlington, VT Arlington, VA Chicago, IL Evansville, IN Portland, OR Salt Lake City, UT San Diego, CA
RSG promotes sustainable business practices that minimize negative impacts on the environment. We
print all proposals and reports on recycled paper that utilizes a minimum of 30% postconsumer waste.
RSG also encourages recycling of printed materials (including this document) whenever practicable.
For more information on RSG’s sustainability practices, please visit www.rsginc.com.
413