Embed Size (px)
Citation preview

EQUUSsoftware
Delivering transparent data to Senior Management:Data Analytics & Dashboard ReportingAlan Bell, VP Technology Solutions

The expectation of GM has evolved
Over the last few years, the expectation of what Global Mobility professionals should do has evolved.
The New Norm
• Identify and implement new process efficiencies and technologies to reduce operating costs
• Provide a link in the organizations talent management strategy
• Manage system integration • Collect all costs related to
assignments and support accrual management
• Explore employee self service• Deliver higher quality
experiences• Advanced ‘insightful’ reporting
• Track and manage assignees• Create and support the
development of the international assignment policy
• Provide basic reporting• Put in place basic management
processes• Support the assignee
No so long ago
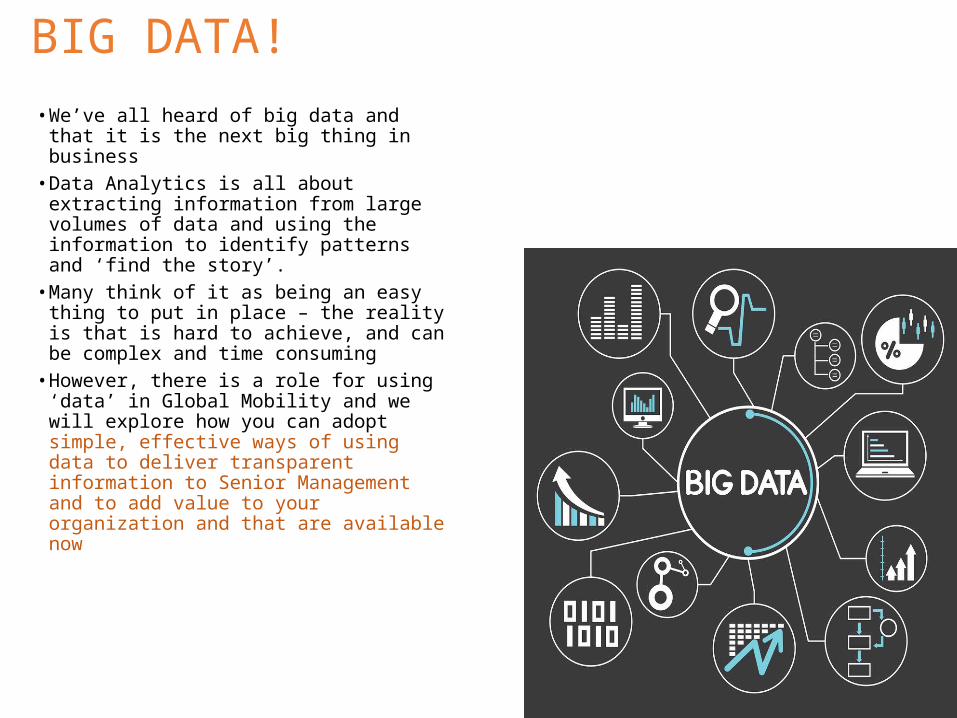
BIG DATA!
• We’ve all heard of big data and that it is the next big thing in business
• Data Analytics is all about extracting information from large volumes of data and using the information to identify patterns and ‘find the story’.
• Many think of it as being an easy thing to put in place – the reality is that is hard to achieve, and can be complex and time consuming
• However, there is a role for using ‘data’ in Global Mobility and we will explore how you can adopt simple, effective ways of using data to deliver transparent information to Senior Management and to add value to your organization and that are available now
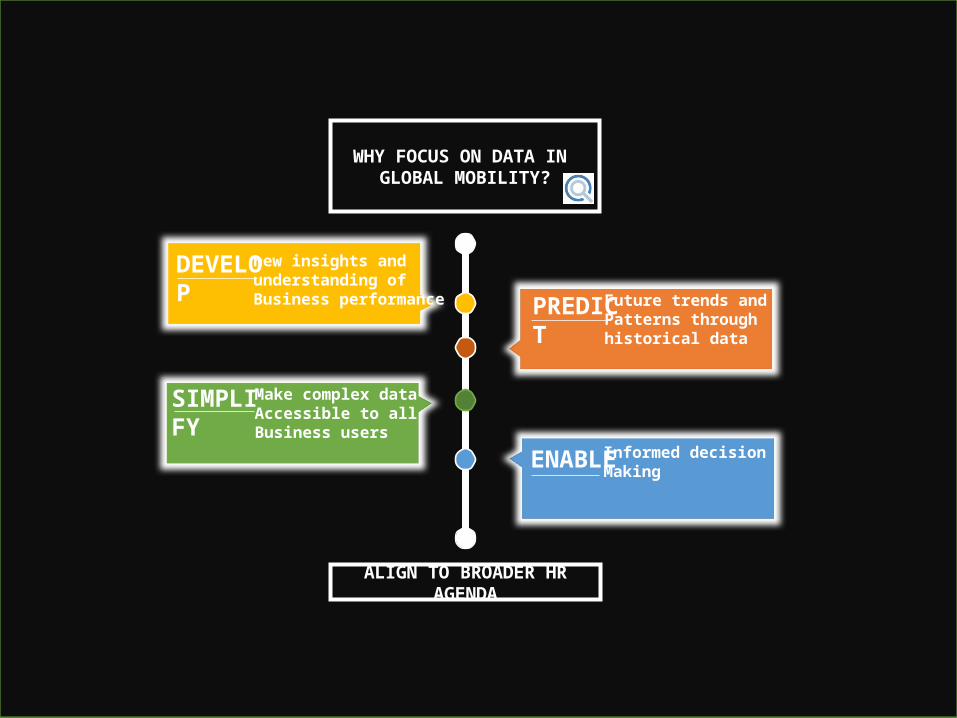
WHY FOCUS ON DATA IN GLOBAL MOBILITY?
DEVELOP new insights and
understanding ofBusiness performance
PREDICT Future trends and Patterns throughhistorical data
SIMPLIFY Make complex data
Accessible to allBusiness users
ENABLE Informed decision Making
ALIGN TO BROADER HR AGENDA

The broader HR Agenda
How does their Global Mobility function compare to the organization’s peer group
Benchmarking information Operating performance
How can the organization reduce cost? Cost Transparency information
What is the service quality for the assignee? Assignee Satisfaction and SLA Measurements
Are we compliant in all areas? Compliance tracking and Internal Audit
What is the overall value to the organization? End to end process measurements Alignment to talent agenda
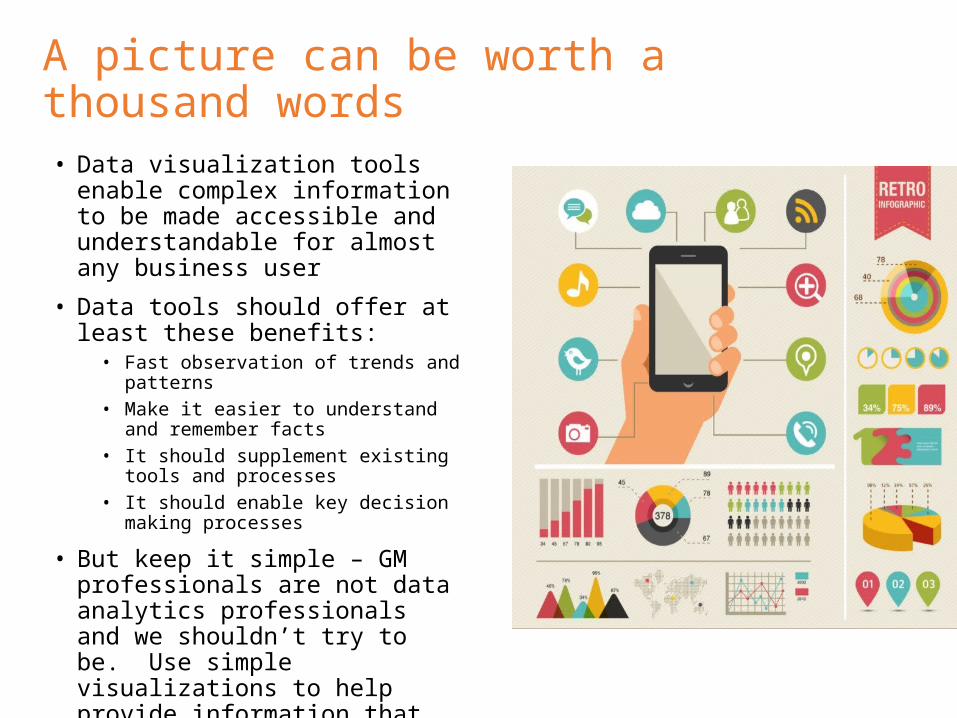
A picture can be worth a thousand words• Data visualization tools enable complex
information to be made accessible and understandable for almost any business user
• Data tools should offer at least these benefits:• Fast observation of trends and patterns• Make it easier to understand and remember
facts• It should supplement existing tools and
processes• It should enable key decision making
processes
• But keep it simple – GM professionals are not data analytics professionals and we shouldn’t try to be. Use simple visualizations to help provide information that informs the HR Community

Benchmark the functionHow can you use data to compare your
Organization with your peer group?
• Global Mobility Headcount
• Total Cost of Mobility Program
• Assignee/Transaction Volumes
• Policies
Enable decisions on Policy Changes, Effectiveness and Operating Models
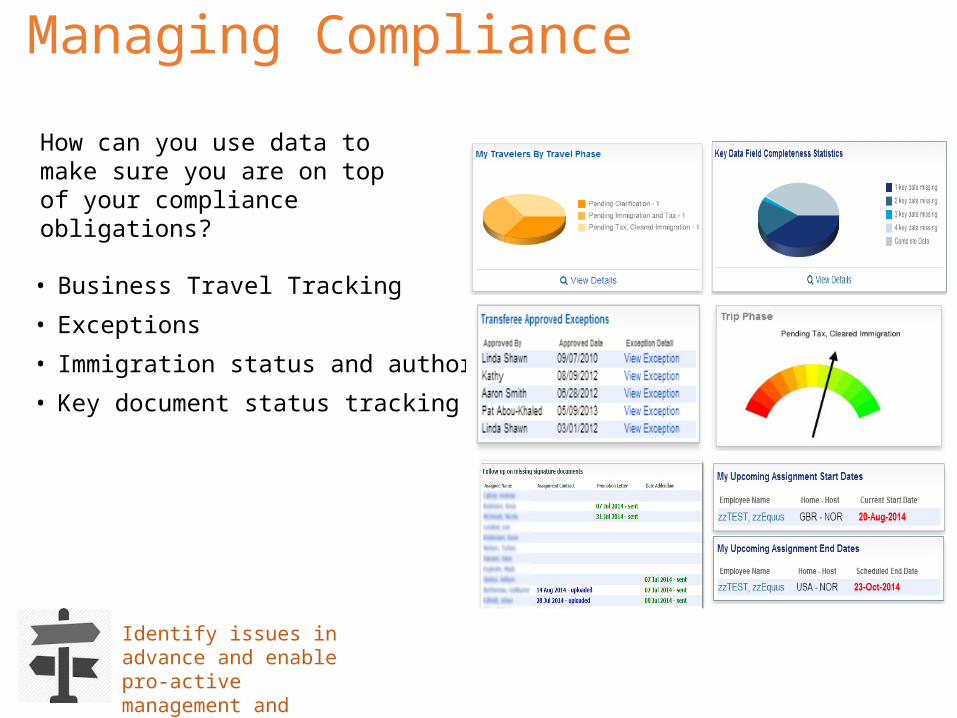
Managing Compliance
• Business Travel Tracking
• Exceptions
• Immigration status and authorization
• Key document status tracking
How can you use data to make sure you are on top of your compliance obligations?
Identify issues in advance and enable pro-active management and resolution
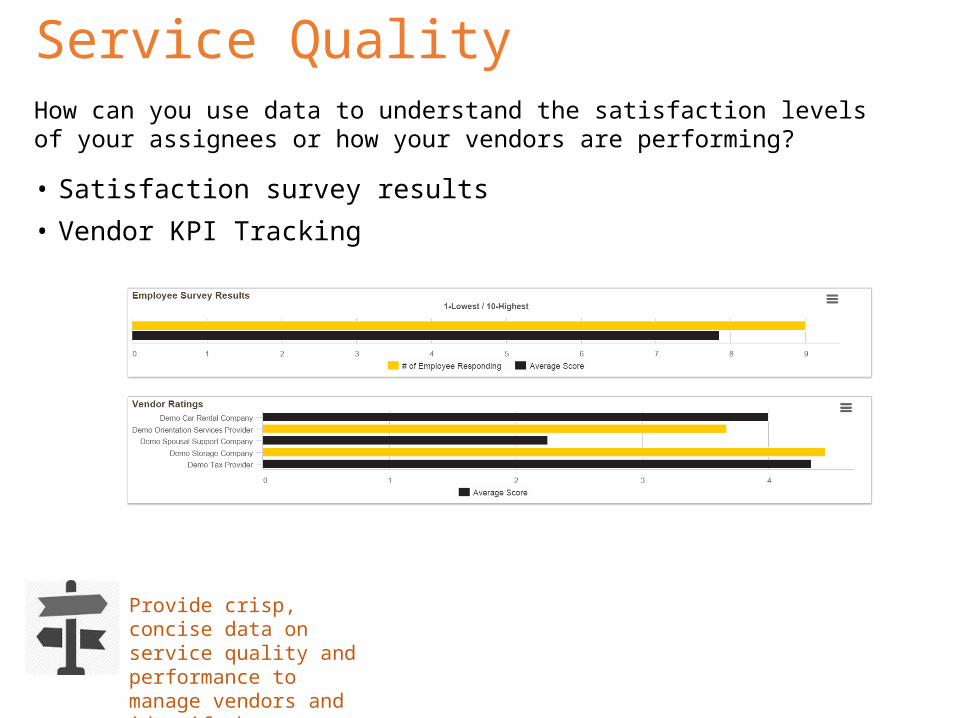
Service Quality
• Satisfaction survey results
• Vendor KPI Tracking
How can you use data to understand the satisfaction levels of your assignees or how your vendors are performing?
Provide crisp, concise data on service quality and performance to manage vendors and identify hot spots
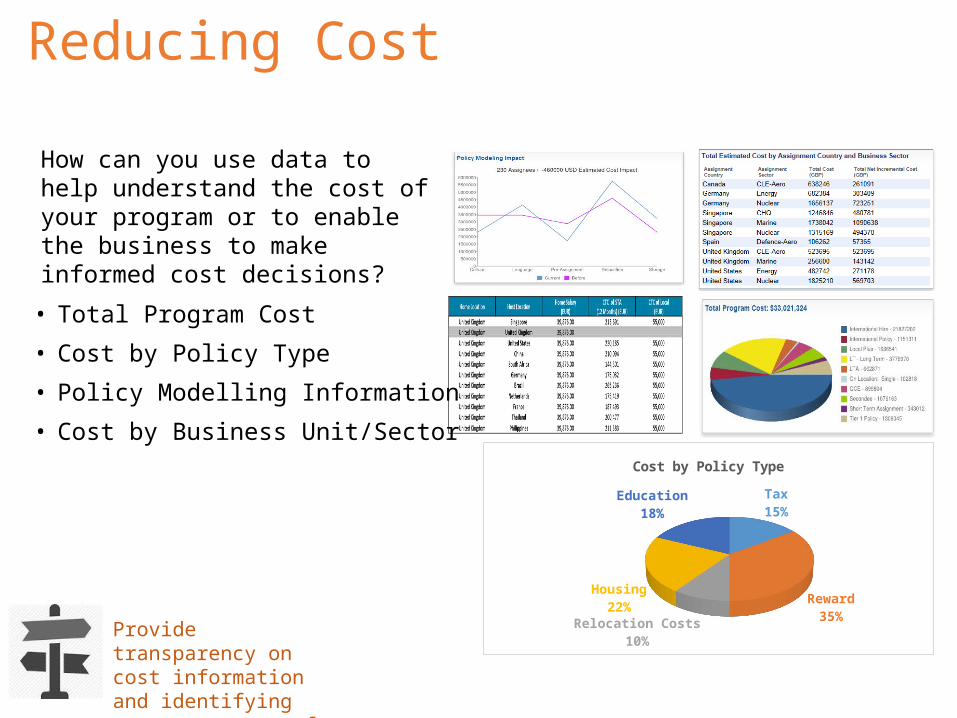
Reducing Cost
• Total Program Cost
• Cost by Policy Type
• Policy Modelling Information
• Cost by Business Unit/Sector
How can you use data to help understand the cost of your program or to enable the business to make informed cost decisions?
Tax15%
Reward35%
Relocation Costs10%
Housing22%
Education18%
Cost by Policy Type
Provide transparency on cost information and identifying areas to target for cost reduction

Effectiveness
• Talent Demographics
• Process efficiencies
• Time on assignment
• Repatriation/Retention statistics(link this into HRIS system. Does an assignment = better retention or improved career acceleration)
Provide useful information to the business about stuff they don’t know
How can you use data to help the business with insights into Mobilityeffectiveness
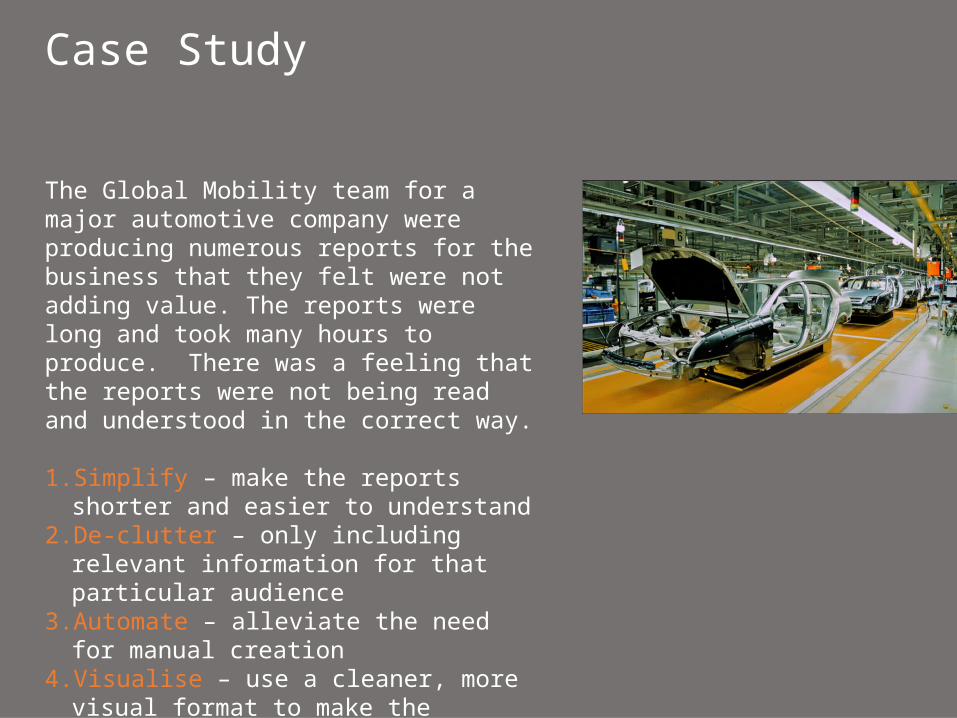
The Global Mobility team for a major automotive company were producing numerous reports for the business that they felt were not adding value. The reports were long and took many hours to produce. There was a feeling that the reports were not being read and understood in the correct way.
1. Simplify – make the reports shorter and easier to understand
2. De-clutter – only including relevant information for that particular audience
3. Automate – alleviate the need for manual creation
4. Visualise – use a cleaner, more visual format to make the reports simpler to understand the data
Case Study

Identify your stakeholder’s goals
e.g. cost reduction, KPI’s, performance measurements, talent metrics, compliance
Utilise the Key Data Elements that inform the agenda
e.g. cost estimates, performance ratings, compliance gaps, technology systems (mobility systems, HRIS systems)
What measurements indicate useful information
e.g. downward/upward trends, pass internal Audit
Use Data Visualisation to provide Data Insight
How do you get started?