Embed Size (px)
Citation preview

The successful implementation of an education dashboard
at KU Leuven
HEIR Conference September 2017
From data to dashboard to deciding on quality
Kurt De Wit, Jeroen De Keyser, Annelies Govaerts, Karen Brans & Piet Verhesschen

Overview • About KU Leuven • Origins • Development process • Using the dashboard • Place in the quality assurance system • Conclusions
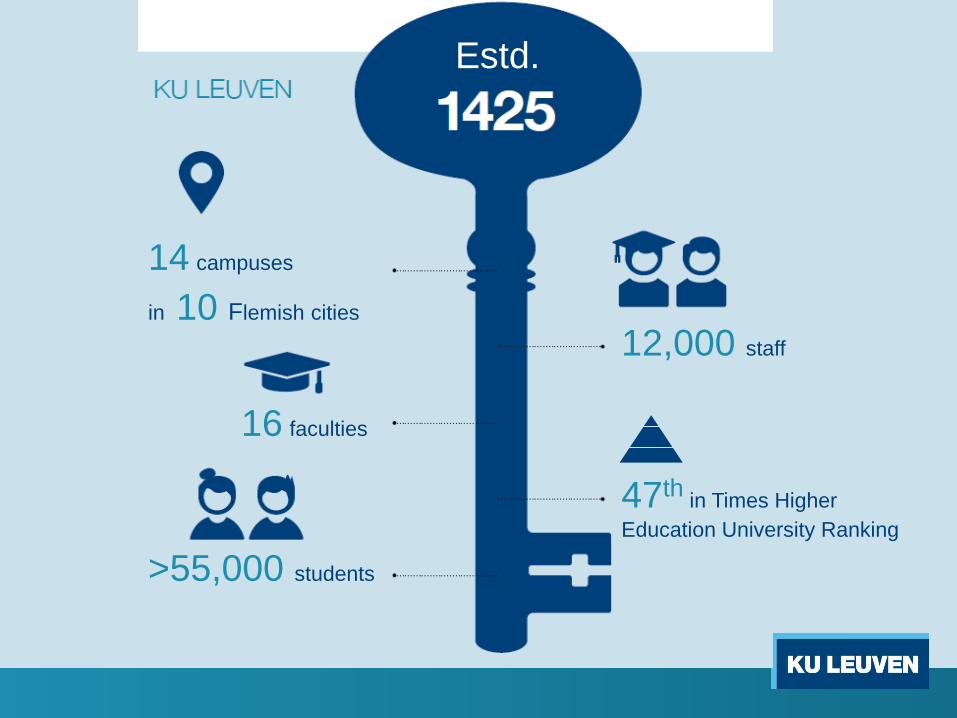
14 campuses
in 10 Flemish cities
16 faculties
>55,000 students
12,000 staff
47th in Times Higher Education University Ranking
Estd.

Origins
=> decisions can be based on quantitative evidence
More data are registered electronically
• Administrative data (enrolment, results, …) • Soft information from questionnaires • Logging data (learning platforms, libraries, …)
data availability
SAP HANA: possible to handle large data sets faster
data processing
License for connected visualisation tool WEB Intelligence
data visualisation te
chno
logi
cal a
dvan
ces
Origins (cont.) • data-informed decision-making
o (governmental) requirement to be transparent and share educational and quality related material
o ESG require monitoring of programmes and stress the importance of public information
o leadership (at KU Leuven) has put increasing value on evidence-informed decision making
=> accelerated the process of developing a dashboard

Development Strong cooperation between IT, education policy unit and users
Prototype
• Developed by education policy unit • Based on existing applications • Based on experience with policy questions
Evaluation
• Discussion with the vice-rector for education • Presented to policymakers at different levels
• Both datacrunchers and number nitwits
Dashboard • Developed by IT unit

Development (cont.)
Dashboard v1
• Launched at the start of 2015-2016 • For the bachelor’s and master’s programmes • At aggregated levels (faculty, university)
Evaluation • By users
Dashboard V2
• More data • Splitting up • Authorizations
Dashboard V3
• Other types of programmes

The ‘education dashboard’ at KU Leuven • Internet-based • Visualization of data • Easy-to-interpret charts & figures • Various topics • Differentiated depending on type of programme

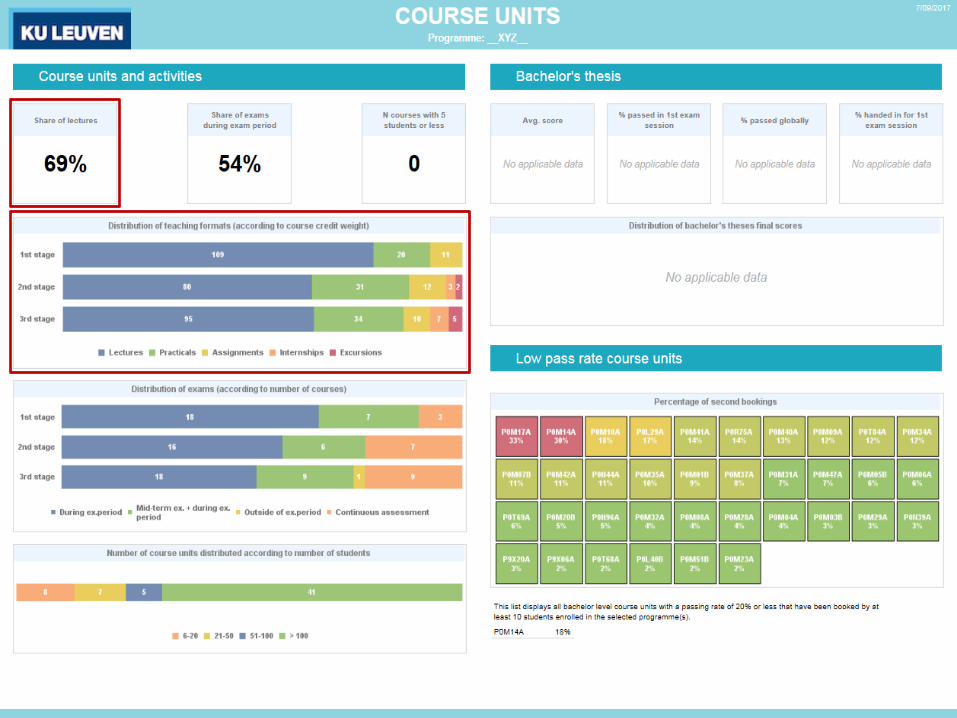
Using the dashboard Dashboard front page Dashboard sheets
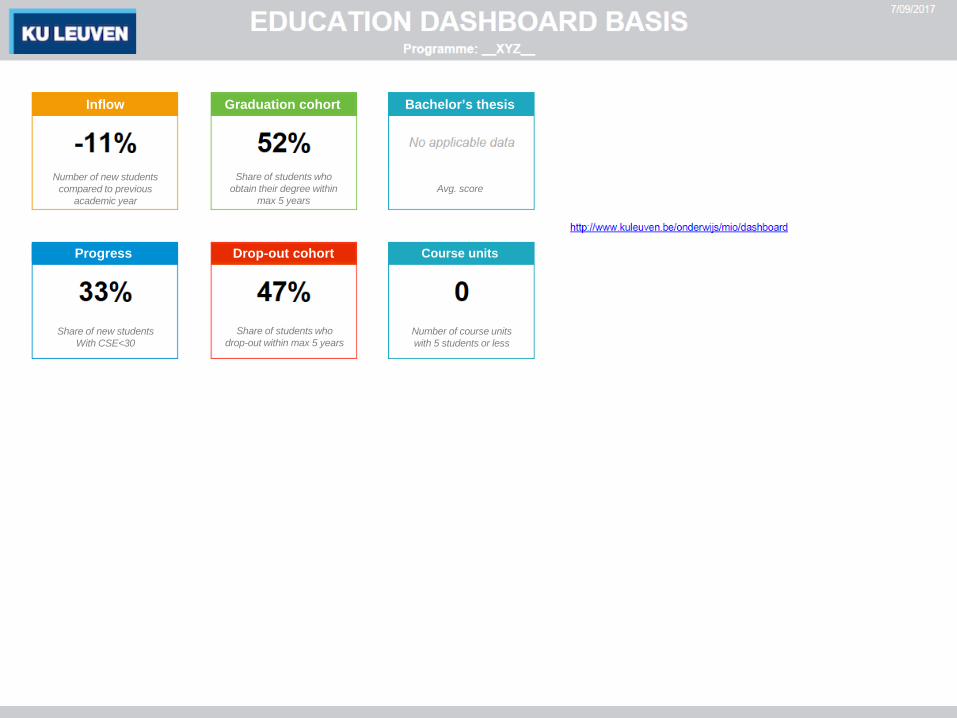
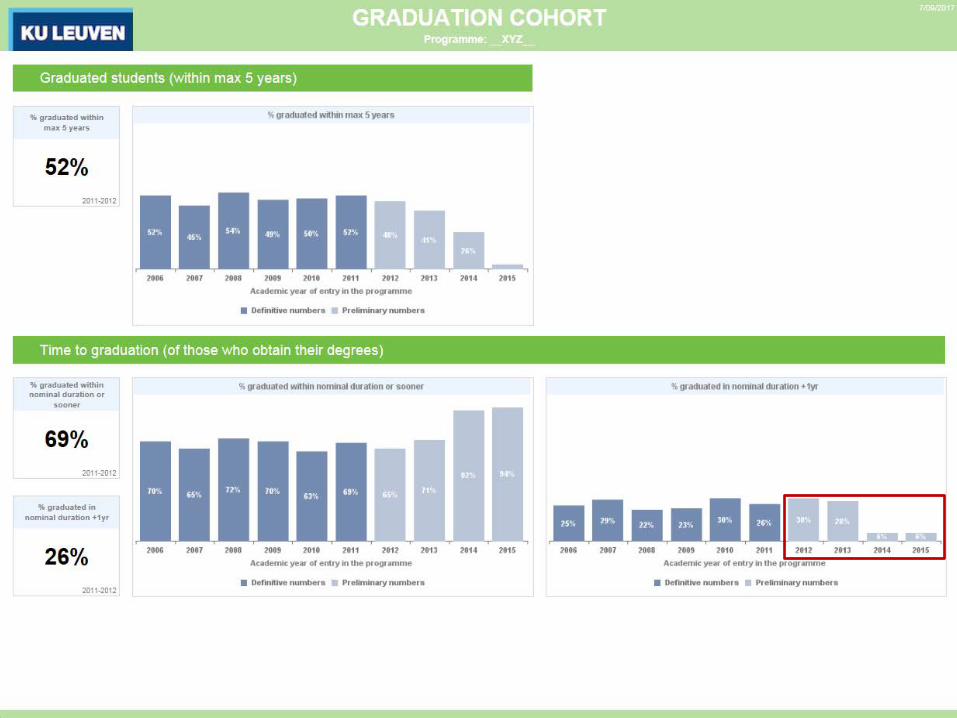
Graduation cohort Bachelor’s thesis Inflow
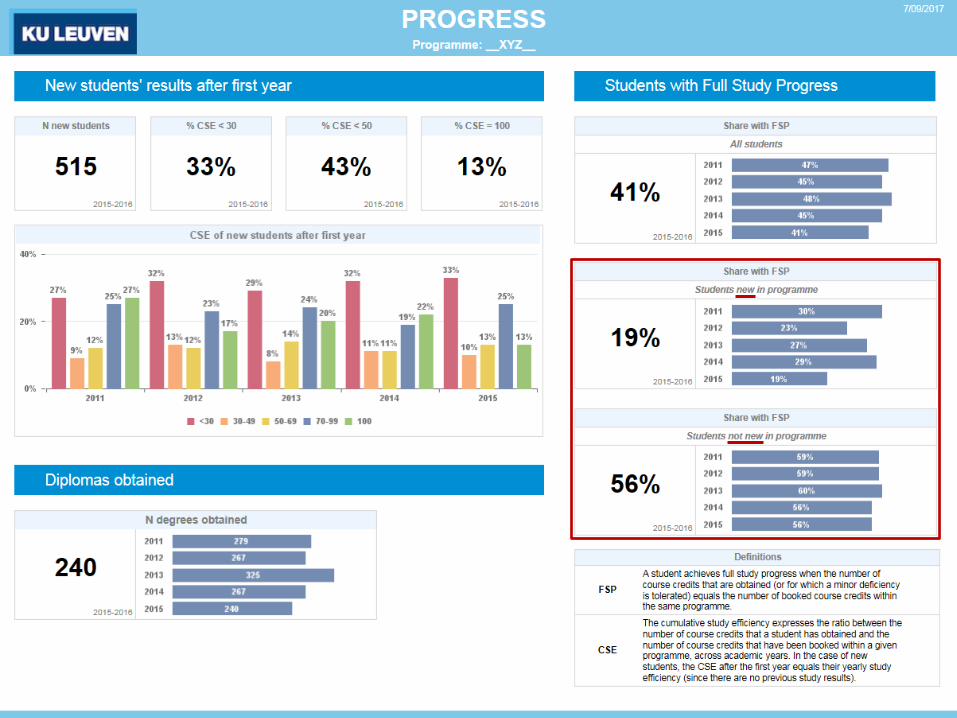
Progress Drop-out cohort Course units
Number of new students compared to previous
academic year
Share of students who obtain their degree within
max 5 years Avg. score
Share of new students With CSE<30
Share of students who drop-out within max 5 years
Number of course units with 5 students or less


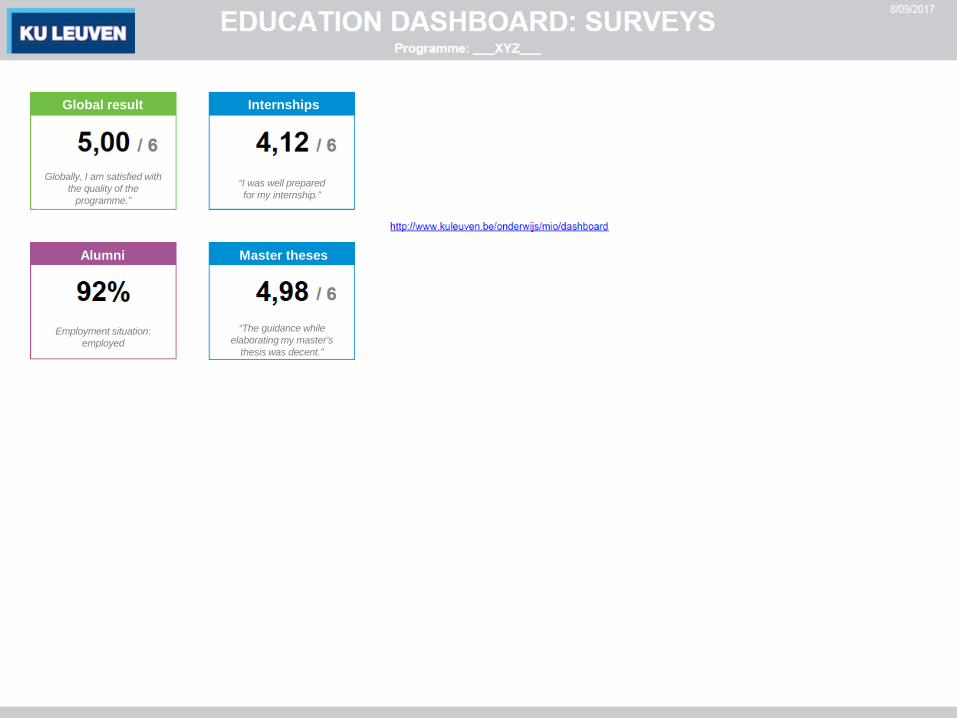
Global result Internships
Master theses Alumni
Employment situation: employed
“The guidance while elaborating my master’s
thesis was decent.”
“I was well prepared for my internship.”
Globally, I am satisfied with the quality of the
programme.”

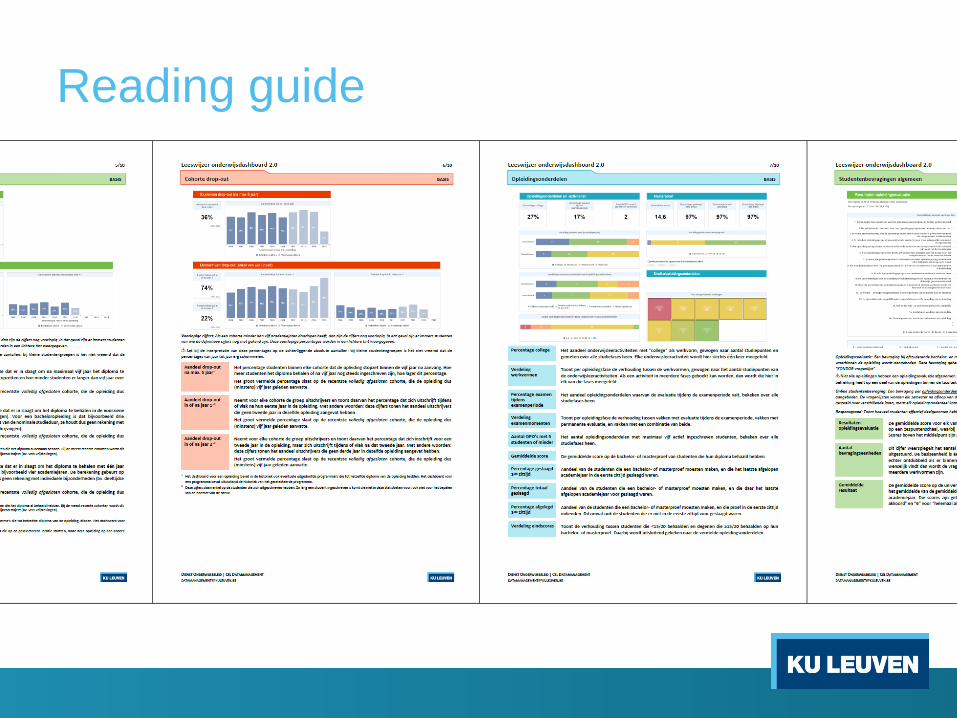
Reading guide
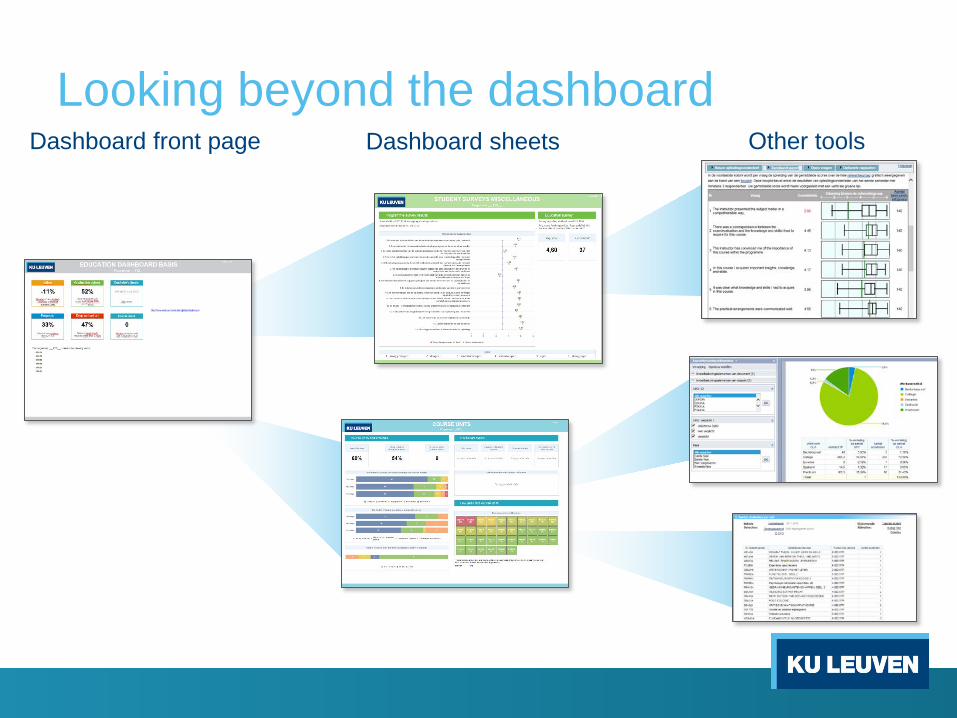
Looking beyond the dashboard Dashboard front page Dashboard sheets Other tools
Place in the QA system • KU Leuven launched a new (proper) QA system
• Based on focus groups
o Students, teachers, staff members o Also alumni, members of the professional field, international peers
• Education dashboard = input for the discussions
• Dashboard data appended to the discussion reports o Consultable on an internal quality assurance portal
Conclusions • It takes effort
o Which design? Which contents? o Consulting with various stake holders
• Results o Important position in QA system o Ad hoc usage o Copied by Flemish HEIs related to KU Leuven
• Maintenance needed • Future
o Other types of programmes o More interactive features?