Embed Size (px)
Citation preview
EARLY-PHASE EVALUATION OF CO2
RECOVERY AT GEOTHERMAL FACILITIES October 2015

This report was prepared by Trimeric Corporation under contract to The World Bank.
It is an output of the ‘Global Geothermal Development Plan’ [Project ID: P130625]. This activity is funded and supported by the Energy Sector Management Assistance Program (ESMAP), a multi-donor trust fund administered by The World Bank, under a global initiative on Renewable Energy Resource Mapping. Further details on the initiative can be obtained from the ESMAP website.
Copyright © October 2015 The International Bank for Reconstruction and Development / THE WORLD BANK 1818 H Street, NW | Washington DC 20433 | USA
The World Bank, ESMAP and the authoring firm(s) do not guarantee the accuracy of the information of this report and accept no responsibility whatsoever for any consequence of their use.
This report is licensed by The World Bank under a Creative Commons Attribution license (CC BY 3.0 IGO). Users should cite The World Bank as the publisher, and make reference to the Energy Sector Management Assistance Program (ESMAP) as the provider of funding for this work. The ESMAP Program Manager would appreciate receiving a copy of the publication that uses this publication for its source, sent to [email protected] or to the postal address above.
All images remain the sole property of their source and may not be used for any purpose without written permission from the source.
Early-Phase Evaluation of CO2 Recovery at Geothermal Facilities
Final Report Revision 3
12 October 2015
Prepared for: The Energy Sector Management Assistance Program,
The World Bank Group Washington, DC
Prepared by:
PO Box 826 Buda, TX 78610 Ph: 512 295 8118 Fax: 512 295 8448
www.trimeric.com
Authors: Darryl Mamrosh, PE – 512 434 9912
Kevin Fisher, PE – 512 431 6323 Ken McIntush, PE – 830 643 4553 Ray McKaskle, PE – 512 785 4939
Carrie Beitler -- 512 826 6605
Page 2 of 41
Contents 1 Summary and Conclusions ..................................................................................................... 4
2 Background and Goals ............................................................................................................ 6
3 Design Basis............................................................................................................................ 8
4 Technology Selection and Process Design ............................................................................. 9
4.1 Product 1: CO2 gas for use in greenhouse ....................................................................... 9
4.1.1 Module 1 (Product 1): Bulk Ammonia Removal ...................................................... 9
4.1.2 Module 2 (Product 1): Liquid Redox Sulfur Recovery for H2S Removal ............. 10
4.1.3 Module 3 (Product 1): Chiller Dehydration ............................................................ 11
4.1.4 Module 4 (Product 1): Low-Pressure Pipeline....................................................... 12
4.2 Product 2: CO2 for use in EOR ..................................................................................... 12
4.2.1 Module 5 (Product 2): Deep Ammonia Removal ................................................... 13
4.2.2 Module 2 (Product 2): Liquid Redox Sulfur Recovery for H2S Removal ............. 13
4.2.3 Modules 6 and 7 (Product 2): Compressions and Pumping to 125 bara, and Dehydration........................................................................................................................... 14
4.3 Product 3: Liquified, Beverage-Grade CO2 .................................................................. 15
4.3.1 Module 5 (Product 3): Deep Ammonia Removal .................................................. 15
4.3.2 Module 2 (Product 3): Liquid Redox Sulfur Recovery for H2S Removal .............. 15
4.3.3 Module 8 (Product 3): Compression to 22 bara ..................................................... 16
4.3.4 Module 13 (Product 3): H2S Scavengers ............................................................... 16
4.3.5 Module 9 (Product 3): Water Scrubber ................................................................... 16
4.3.6 Module 10 (Product 3): Other Impurity Removal .................................................. 17
4.3.7 Module 11 (Product 3): Molecular-Sieve Dehydration .......................................... 17
4.3.8 Module 12 (Product 3): Liquefaction/Distillation ................................................. 17
4.3.9 Module 14 (Product 3): Liquid CO2 Storage .......................................................... 18
4.4 Product 4: Reinjection of NCG for Carbon Capture Credits ........................................ 18
4.4.1 Module 5 (Product 4): Deep Ammonia Removal ................................................... 19
4.4.2 Module 15 (Product 4): Compression to 55 bara .................................................... 19
5 Economic Evaluation ............................................................................................................ 27
5.1 Methods used to estimate capital cost ............................................................................ 27
5.2 Methods used to estimate operating costs ...................................................................... 28
5.3 Product 1: CO2 gas for use in greenhouse ..................................................................... 29
Page 3 of 41
5.3.1 Module 1 (Product 1): Bulk Ammonia Removal .................................................... 29
5.3.2 Module 2 (Product 1): Liquid Redox Sulfur Recovery for H2S Removal ............. 29
5.3.3 Module 3 (Product 1): Chiller Dehydration ............................................................ 29
5.3.4 Module 4 (Product 1): Low Pressure Pipeline ....................................................... 29
5.4 Product 2: CO2 for use in EOR ..................................................................................... 29
5.4.1 Module 5 (Product 2): Deep Ammonia Removal ................................................... 29
5.4.2 Module 2 (Product 2): Liquid Redox Sulfur Recovery for H2S Removal ............. 30
5.4.3 Modules 6 and 7 (Product 2): Compressions and Pumping to 125 bara, and Dehydration........................................................................................................................... 30
5.5 Product 3: Liquid Beverage Grade CO2 ........................................................................ 30
5.5.1 Module 5 (Product 3): Deep Ammonia Removal .................................................. 30
5.5.2 Module 2 (Product 3): Liquid Redox Sulfur Recovery for H2S Removal .............. 30
5.5.3 Module 13 (Product 3): H2S Scavengers ............................................................... 31
5.5.4 Modules 8, 9, 10, 11, 12, 14 (Product 3): Compression, Impurity Removal, Dehydration, Distillation, Liquefaction, Storage .................................................................. 31
5.6 Product 4: Reinjection of NCG for Carbon Capture Credits ........................................ 31
5.6.1 Module 5 (Product 4): Deep Ammonia Removal ................................................... 31
5.6.2 Module 15 (Product 4): Compression to 55 bara .................................................... 31
5.7 Economic Summary ....................................................................................................... 32
6 Removal of Other Impurities ................................................................................................ 35
6.1 Mercury .......................................................................................................................... 35
6.1.1 Mercury Removal Economic Parameters ............................................................... 35
6.2 Carbonyl Sulfide ............................................................................................................ 36
6.2.1 Carbonyl Sulfide Removal Economic Parameters .................................................. 36
6.3 Ethane ............................................................................................................................. 36
6.3.1 Ethane Removal Economic Parameters .................................................................. 37
6.4 Impact of the Removal of Other Impurities on Product Recovery Economics .............. 37
7 Literature Cited ..................................................................................................................... 40
Page 4 of 41
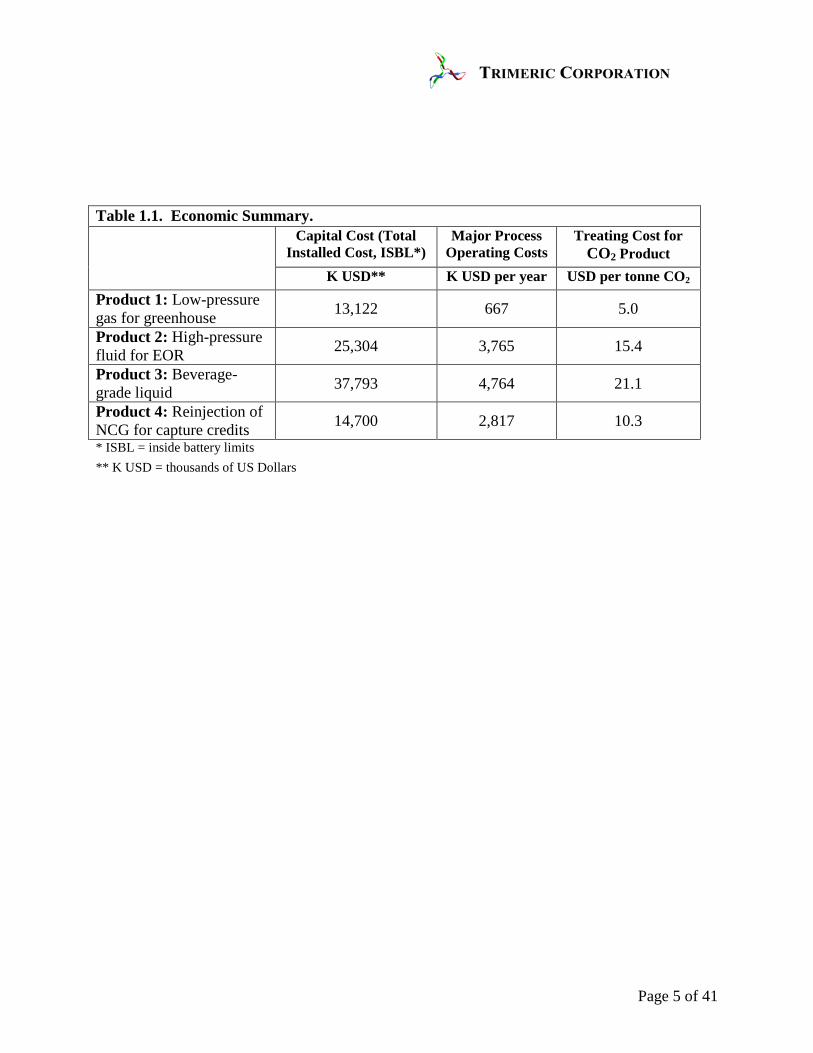
1 Summary and Conclusions The recovery of four different CO2 products from a non-condensable gas (NCG) stream at a geothermal plant was evaluated, and process schemes were proposed for the recovery of the products. The four products are 1) a low-pressure, lower-purity CO2 gas that could be transported via short, low-pressure pipelines and be used to supplement CO2 concentrations in greenhouses, 2) a high-pressure, dense-phase CO2 fluid of intermediate purity suited for use in enhanced oil recovery [EOR] applications, 3) a refrigerated-liquid CO2 product of beverage grade quality [high purity], and 4) subsurface reinjection for sequestration of the CO2-rich NCG stream for presumed capture credits. The NCG feed to the recovery process is assumed to be at a rate of 50 tonne per hour. This flow rate would, for example, correspond to all of the NCG from a 50 MW geothermal power plant emitting 1,000 g/kW-h NCG, or a 100 MW plant emitting 500 g/kW-h. The characteristics of the NCG were based on a hypothetical binary geothermal power plant case characterized by high-gas content in the geothermal fluid; the CO2 content of the NCG feed to the CO2 recovery process was 98.4 mole percent (dry basis), however the stream is assumed to be saturated with water vapor. This work is early phase, and various estimation techniques were used to evaluate the capital and operating costs for the production of these four products. Based on U.S. dollars, capital cost, major process operating cost (power and chemicals), and the estimated total treating cost per tonne of CO2 product (includes power and chemical cost, operating labor, maintenance and G&A, and capital amortization) are shown for the four products in Table 1.1. The estimate for Product 3 is intended to also apply to other refrigerated liquid CO2 grades, such as dry ice, food grade, and industrial grade. Although other grades of liquefied CO2 could possibly be slightly less expensive to produce compared to the beverage grade assumed here, Trimeric believes that the differences are well within the error margins of this early phase estimate. Additionally, Product 4 represents the cost of preparing the NCG stream for reinjection only; it is presumed that the reinjection of the CO2-rich NCG stream, which would otherwise be vented to the atmosphere, would be associated with carbon-capture credit value, and is therefore considered a “product” despite the fact that the CO2 is not actually recovered. This work is based upon a specific composition of the NCG, as described in Section 3 of this report. Trimeric is aware that there are some other components (carbonyl sulfide, ethane, and mercury) not included in the Design Basis NCG composition, which are known to potentially be present in geothermal NCG and are relatively difficult to remove during CO2 recovery; if these compounds were present in significant concentrations, it would result in additional unit operations and costs for the recovery of some of the products. The approximate costs associated to remove these additional components, if necessary, are discussed in Section 6.
Page 5 of 41
Table 1.1. Economic Summary. Capital Cost (Total
Installed Cost, ISBL*) Major Process
Operating Costs Treating Cost for
CO2 Product K USD** K USD per year USD per tonne CO2
Product 1: Low-pressure gas for greenhouse 13,122 667 5.0
Product 2: High-pressure fluid for EOR 25,304 3,765 15.4
Product 3: Beverage-grade liquid 37,793 4,764 21.1
Product 4: Reinjection of NCG for capture credits 14,700 2,817 10.3 * ISBL = inside battery limits ** K USD = thousands of US Dollars
Page 6 of 41
2 Background and Goals Geothermal steam usually contains a small amount (often in the range of one to a few percent) of non-condensable gases, referred to as geothermal non-condensable gas (NCG); the NCG is a mixture which may contain carbon dioxide (CO2), hydrogen sulfide (H2S), nitrogen (N2), hydrogen (H2), ammonia (NH3), argon (Ar), methane (CH4), other light hydrocarbons, other sulfur species, and possibly many other species. The composition of the NCG varies substantially depending upon the geographic location and source reservoir of the steam. Oxygen (O2) may also be introduced to the NCG due to the leakage of air into the process under the vacuum conditions common in the final power generation stage of conventional geothermal power generation plants. However, the ingress of oxygen is not an issue for binary geothermal power plants because the gas is always maintained at positive pressures. In most geothermal power plants the NCG is vented to the atmosphere, although some pollution abatement steps may be required first; for some cases it may be feasible to compress the NCG and re-inject it with condensate/brine (DiPippo, 2012). It is common for H2S, when it is present in NCG at significant concentration, to be removed from NCG prior to venting to the atmosphere due to its toxicity, odor, and eventual fate in the atmosphere as sulfuric acid (acid rain). The Energy Sector Management Assistance Program of the World Bank (ESMAP) wishes to evaluate the technical and economic viability of the capture of CO2 from NCG, with the intent of converting the captured CO2 to a commercially useful form. To accomplish the evaluation, ESMAP contracted with Trimeric Corporation (Trimeric), a process chemical engineering company with extensive experience in CO2 and H2S technologies in the geothermal, industrial-gas, enhanced oil recovery, and other industries (Trimeric Corporation, 2015). This report focuses on CO2 capture from binary geothermal power plants that use high-gas-content geothermal fluids, although the information in this study may be useful in other situations also. The conversion of the CO2 to a commercially useful form may include the removal of impurities, compression, and/or liquefaction of the CO2. This project focused on four specific grades of CO2, which would be considered as potential products: Product 1 - Greenhouse: Low-pressure gas suited for addition to greenhouses, which would be transferred to the user via a pipeline.
Product 2 - Enhanced Oil Recovery (EOR): High-pressure fluid suited for use in EOR, which would be transferred to the user via a pipeline.
Product 3 - Beverage Grade: High-purity liquid suited for food, beverage, dry ice, or general industrial (e.g., urea) uses. Although the CO2 product specifications for food, beverage, dry ice, and general industrial uses are often slightly different (Compressed Gas Association, Inc., 2011), the process technologies used to obtain these different grades are usually very similar; differences in capital and operating cost requirements to produce these different grades are probably not large enough to merit considering them separately in an early-phase economic evaluation.
Product 4 – Reinjection of NCG for Carbon Capture Credits: CO2 is not actually recovered, but instead the NCG is subjected to minimal treatment necessary for recompression and
Page 7 of 41
sequestration by injection into disposal wells. It is assumed that the sequestration of this stream, which would previously have been vented to the atmosphere, would result in the monetary value from carbon capture credits. Further details of these products are provided in the Design Basis section of this document. The economic and design data provided in this study are applicable to the specific cases (NCG characteristics, product specifications) that were considered; consideration of the composition and conditions of the NCG are the key factors in applying the results of this analysis to other geothermal power plants. The composition of geothermal NCG varies greatly, and this study does not provide any information regarding costs for recovering CO2 products for other NCG compositions. This report does, however, include some economic information for cases where the NCG contains small amounts of three impurities components that are not included in the Design Basis gas composition, but are sometimes found in NCG at various locations. The presence of small amounts of these compounds – carbonyl sulfide (COS), ethane (C2H6), and mercury (Hg) – can result in the need for additional specialized unit operations. Trimeric is aware of these three impurity components, and the issues they could cause in CO2 product recovery, from previous work. ESMAP thought it prudent to include the economics for the removal of these species in this study. These three components are not in the Design Basis NCG composition, and the cost of removal is not included in the main presentation of the economics of recovery for the four CO2 products in section 5. Instead, section 6 of this report provides the cost of the removal of these compounds separately, provides information regarding which products would require the removal of these materials were they to be present in the NCG, and supplies a different case for CO2 product recovery economics that includes the removal of all three components. This evaluation is early-phase in nature, and only considers the use of commercialized technologies that could be reasonably applied. The main product of this work is technical and economic data for a reasonable combination of technologies that could be used to produce the desired products from the NCG. The economic evaluation includes estimates for the capital cost, power usage, and other operating costs of the technologies. As is typical for early-phase work such as this, various methods are used to estimate capital and operating costs. The generation of a complete process design was not within the scope of this project, and thus the cost estimates in this report are based on a lower level of information than would be available in a complete process design. Cost information was generated based on other sources, such as literature information, Trimeric’s experience from its work in geothermal, industrial-gas, and enhanced-oil-recovery industries, the experience of Trimeric’s contacts in these industries, and capital cost estimation software.
Page 8 of 41
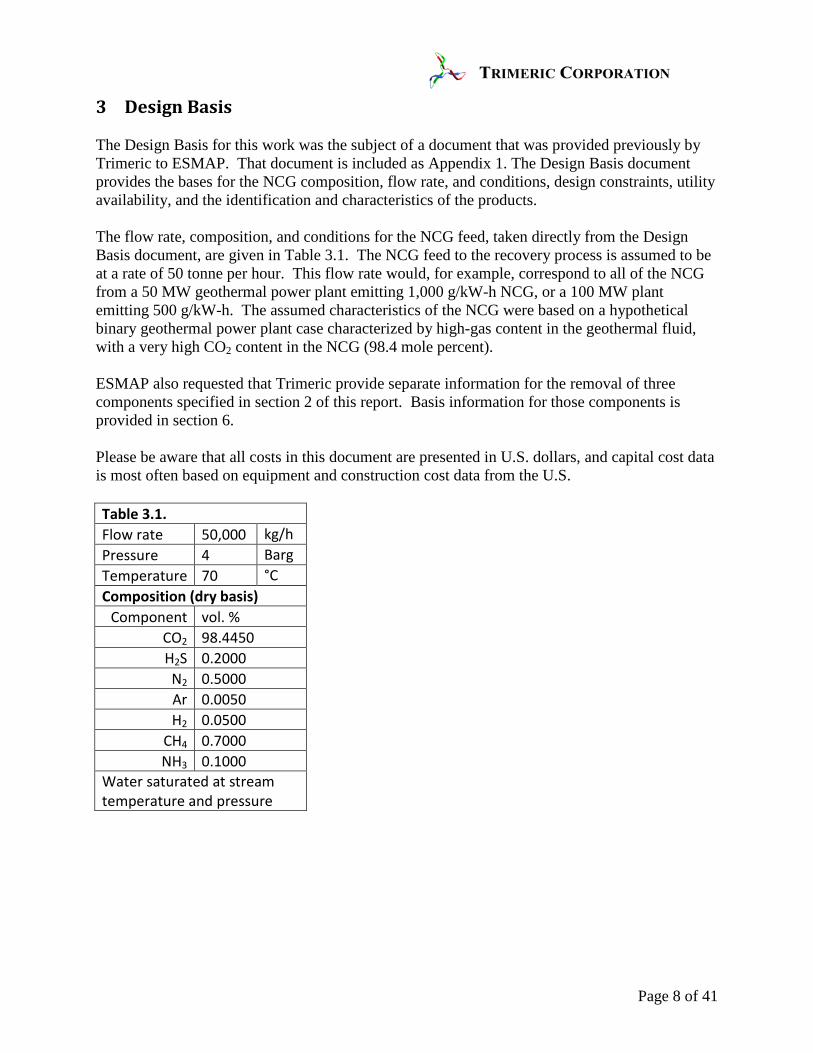
3 Design Basis The Design Basis for this work was the subject of a document that was provided previously by Trimeric to ESMAP. That document is included as Appendix 1. The Design Basis document provides the bases for the NCG composition, flow rate, and conditions, design constraints, utility availability, and the identification and characteristics of the products. The flow rate, composition, and conditions for the NCG feed, taken directly from the Design Basis document, are given in Table 3.1. The NCG feed to the recovery process is assumed to be at a rate of 50 tonne per hour. This flow rate would, for example, correspond to all of the NCG from a 50 MW geothermal power plant emitting 1,000 g/kW-h NCG, or a 100 MW plant emitting 500 g/kW-h. The assumed characteristics of the NCG were based on a hypothetical binary geothermal power plant case characterized by high-gas content in the geothermal fluid, with a very high CO2 content in the NCG (98.4 mole percent). ESMAP also requested that Trimeric provide separate information for the removal of three components specified in section 2 of this report. Basis information for those components is provided in section 6. Please be aware that all costs in this document are presented in U.S. dollars, and capital cost data is most often based on equipment and construction cost data from the U.S. Table 3.1. Flow rate 50,000 kg/h Pressure 4 Barg Temperature 70 °C Composition (dry basis) Component vol. %
CO2 98.4450 H2S 0.2000 N2 0.5000 Ar 0.0050 H2 0.0500
CH4 0.7000 NH3 0.1000
Water saturated at stream temperature and pressure
Page 9 of 41
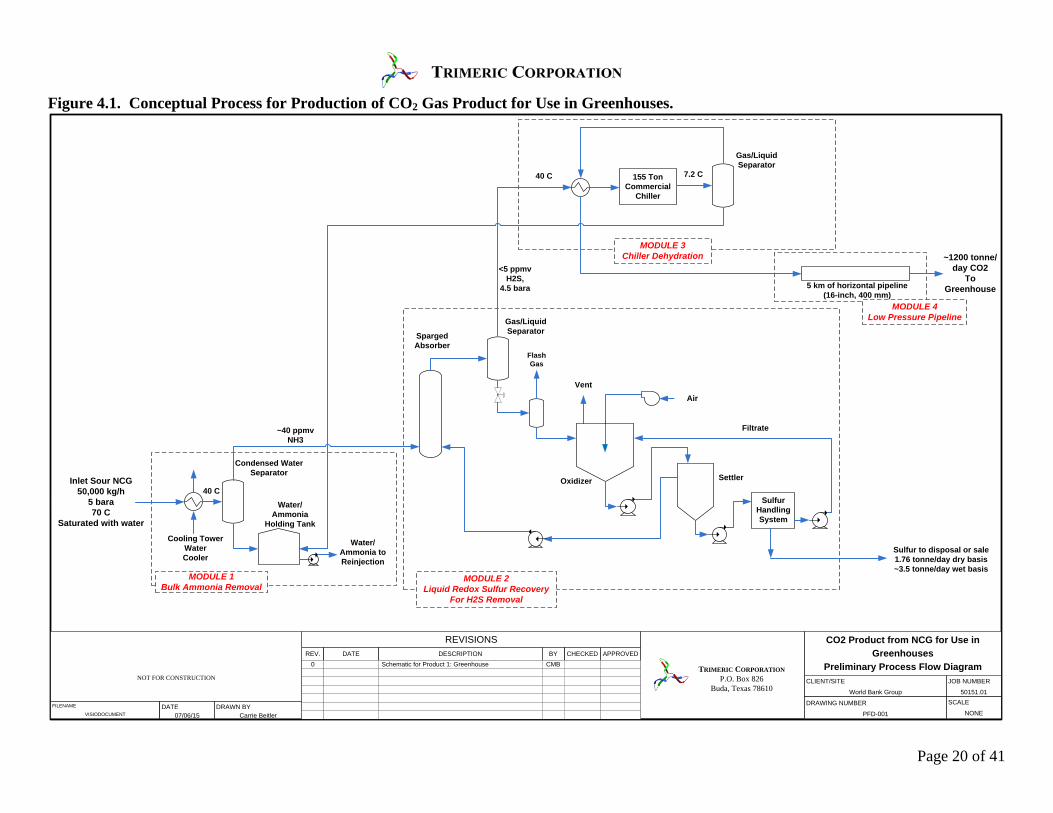
4 Technology Selection and Process Design After defining the Design Basis and the desired products, Trimeric considered the technologies that could be used to produce the desired products. While the scope of this project did not include a formal screening study to pick the best technologies from technical and economic perspectives, Trimeric did use its extensive experience in gas treating and CO2 purification in the geothermal, industrial gas, and enhanced oil recovery industries to pick technologies believed to be reasonable for the requirements. The technologies selected for manufacturing each product are described in the following subsections. A number of specific technologies are required for each product; the specific technologies are referred to in this report as “modules”. Each module performs a specific task, such as removal of ammonia, compression, dehydration, removal of H2S, etc. Some of the same modules are used for more than one product; for example, the H2S removal module is used for three of the products. For each module some key design parameters, which were used to help define the costs, are also supplied. Although some key design parameters are presented, given the limited scope of this project, it was not feasible to present and explain every detail of the design information that was utilized in the project in this report. 4.1 Product 1: CO2 Gas for Use in Greenhouse In order to produce a gas product for use in a greenhouse, it was presumed that the concentration of ammonia and hydrogen sulfide should be reduced for possible safety and odor reasons. It was also assumed that the water concentration would need to be reduced in order to avoid condensation in the pipeline, which could result in pipeline corrosion, slugging flow, and other issues. The rationale for the specification for CO2 for greenhouse use is provided in the Design Basis document (Appendix 1). The modules required for Product 1 are described below. A process flow diagram of the conceptual production process for Product 1, showing the battery limits of the modules, is given in Figure 4.1. 4.1.1 Module 1 (Product 1): Bulk Ammonia Removal The NCG entering the treatment system is at a pressure of 5 bara and a temperature of 70 °C, and is saturated with water. Only a limited amount of ammonia removal is required in order to render the gas acceptable for use in a greenhouse. Three technologies were considered for Module 1 for this product: scrubbing of the ammonia with an acid, water scrubbing, and cooling condensation of the stream. Because the NCG has to be cooled and some water removed anyway, it was determined that the simplest, cheapest method to remove ammonia would probably be to cool the NCG using cooling water in a non-contact heat exchanger with the water condensed from the NCG stream removing some of the ammonia from the NCG. Process simulations (VMGSim) were used to determine that the cooling of the NCG to 40 °C would result in the condensation of enough water
Page 10 of 41
from the NCG such that the ammonia concentration in the NCG would be reduced to roughly 40 ppmv, if the condensed water and gas are at equilibrium with each other. As discussed in the Design Basis document (Appendix 1), this level of ammonia removal is sufficient for the greenhouse case. Therefore, the cooling of the NCG using cooling water was selected for bulk ammonia removal for Module 1. The module consists of a condenser heat exchanger, which uses cooling water from the geothermal power plant, to cool the NCG to 40 °C. The condensate, containing aqueous ammonia, is then separated from the NCG in a separator vessel. The condensate, and any other aqueous streams collected in the various modules would be collected in a holding tank and eventually re-injected with the power plant condensate/brine liquid streams. Some of the key design parameters used to estimate the cost of equipment in this module summarized below:
• Cooler exchanger duty: 4.5 MMBtu/h
• Separator size: 6 ft diameter x 22.25 ft height
• Water holding tank volume: 13,570 gallon
• Main materials of construction: 304/304L SS 4.1.2 Module 2 (Product 1): Liquid Redox Sulfur Recovery for H2S Removal Liquid redox sulfur recovery (LRSR) is used to remove H2S from gas streams in various industries, and is most commonly applied when the amount of H2S to be removed falls in a specific mass flow rate range (Kohl & Nielsen, 1997). For many gas-phase H2S removal applications, disposable liquid or solid chemicals, referred to as “scavengers”, are often used when the amount of H2S to be removed is less than roughly 0.25 tonne per day. On the other hand, for cases where the amount of H2S to be removed is greater than roughly 10 to 20 tonne per day, it is common to use alkanolamines to remove H2S from the gas and then convert the H2S to molten elemental sulfur using the modified-Claus process. For cases between 0.25 and 20 tonne per day, there are a variety of technologies that can be used to remove H2S, but one of the more dominant classes of technology are LRSR processes. LRSR processes use redox chemistry that converts the H2S from the gas directly to elemental (solid) sulfur. The more common modern LRSR processes use chelated iron in the redox chemistry; the iron is continuously regenerated and reused in the process. The sulfur formed in the process is a wet solid and tends to contain some iron chelate and various salts; given the relatively small amount of sulfur that these plants produce, and the low purity of the sulfur, the sulfur is typically either landfilled or sold at a low value. LO-CAT® (Merichem Company) and SulFerox® (Shell, Westfield Engineering) are the most common examples of LRSR plants being built recently in the USA. See these companies’ websites for further details regarding these technologies. Prior to the emergence of the iron-chelate technologies, a vanadium-based LRSR technology (Stretford) was common (Kohl & Nielsen, 1997).
Page 11 of 41
LO-CAT®, SulFerox®, and Stretford have all been applied to H2S removal from NCG at geothermal power plants. The applications of these technologies that Trimeric is most familiar with are cases where the NCG is treated at low pressure, consistent with NCG coming from a vacuum pump or ejector from the last turbine stage of a conventional geothermal power plant (Mamrosh, McIntush, Beitler, Markusson, & Einarsson, 2012). For the ESMAP case, the gas will be available for treatment at roughly 5 bara, and it is assumed that the H2S removal will be done at this pressure. In Trimeric’s experience, LRSR plants that operate at high pressures, particularly at high CO2 concentrations tend to operate with more problems compared with plants that operate at low pressure. Trimeric’s experience indicates that the application of LRSR at the pressures considered in this study may be somewhat more problem-prone compared to other LRSR applications at geothermal power plants; however, the operating pressure of this plant (~5 bara) is within the capability of LRSR technology. The LRSR process shown in the preliminary process flow diagram (PFD) is a configuration typical of an iron chelate process such as LO-CAT® or SulFerox®. In the Sparged Absorber, the H2S is absorbed and quickly converted to solid elemental sulfur, and the chelated iron is reduced from the Fe+3 to the Fe+2 form. In the oxidizer, oxygen from air is used to convert the Fe+2 back to Fe+3. The solid sulfur formed in the Sparged Absorber is present as a slurry in the solution throughout the process. The sulfur is removed from the settler as a thickened slurry and subsequently removed as a wet cake using a filter (or some other solid-liquid separation device). The amount of sulfur produced is 1.76 tonne/day based on pure sulfur, but might be twice that on a wet basis. Iron chelate LRSR processes are capable of reducing H2S in the gas to very low levels, and it is assumed that the process would reduce the H2S to about 1 ppmv. The key design parameter used to estimate the cost of equipment in this module is the H2S mass removal requirement, which is 1.76 tonne/day. Trimeric has found that, for the purposes of early phase estimates, the cost of LRSR plants can be estimated based on the H2S mass removal requirement only. 4.1.3 Module 3 (Product 1): Chiller Dehydration After the H2S removal module, the gas will be at a temperature of roughly 40 °C, saturated with water, and with the concentrations of H2S and ammonia reduced substantially. Because it can be expected that the gas would cool down as it travels down a pipeline, if the gas was delivered directly to the pipeline, condensation of water would result. Condensed water in the pipeline is undesirable because any water that condenses would be acidic and can cause corrosion. Condensed water may also accumulate in low spots causing pressure drop and/or slugging flow. Due to this, it is assumed that dehydration of the gas prior to entry to the pipeline is required to prevent condensation. A number of different options are available for the dehydration of a gas, such as adsorption by molecular sieves, absorption by a glycol, and cooling condensation (Gas Processors Suppliers Association, 2012). For this case, the dehydration requirement is minimal: it is desired only that condensation not occur in the pipeline. Molecular sieves were not considered further for this module due to their high costs. Glycol dehydration and cooling condensation were compared in
Page 12 of 41
detail for this case. Because this gas is at low pressure and has a high fractional water content, the removal of water down to a dew point of about 7.2°C with cooling condensation was economically favored compared to the use of a glycol dehydration process. The gas is assumed to be transported in a buried gas pipeline at a ground temperature of greater than 7.2°C. The reduction of water using cooling is simple, but requires a refrigerated chiller system due to the low temperature that is required (~7.2°C). The process consists of a heat recovery exchanger, followed by a refrigerated heat exchanger. Water condensed in the two exchangers is then removed in a separator vessel. Some of the key design parameters used to estimate the cost of equipment in this module summarized below:
• Chiller duty: 155 tons
• Cross exchanger duty: 0.24 MMBtu/h
• Separator size: 6.5 ft diameter x 12 ft height
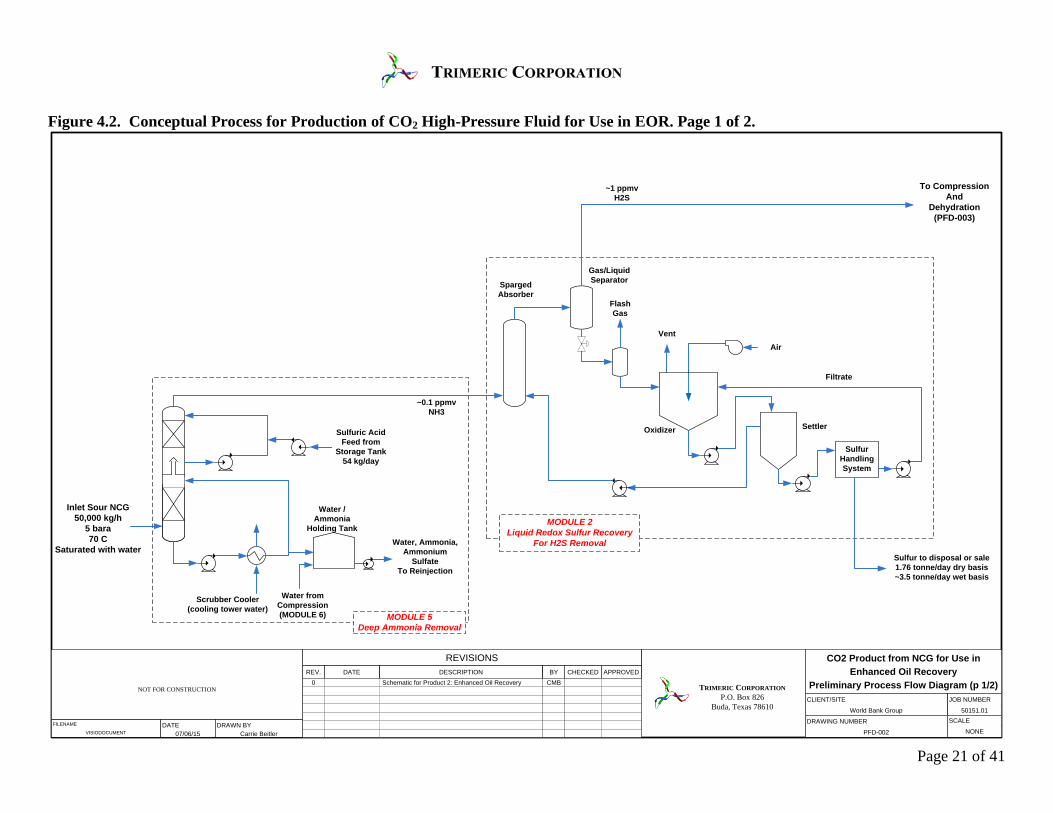
• Main materials of construction: 304/304L SS 4.1.4 Module 4 (Product 1): Low-Pressure Pipeline Per ESMAP’s request, a 5 km pipeline is included for the greenhouse case. Trimeric evaluated the size of pipeline that would be required for transferring the gas 5 km using only the pressure available in the gas after Module 3 (estimated to be ~4.3 bara), and Trimeric also considered the size of the pipeline that would result if the gas were compressed to a higher pressure. Overall, it was judged economically advantageous to build a larger diameter pipeline, rather than compressing the gas (which would result in a smaller diameter pipeline). A 16 inch/400 mm diameter pipeline was estimated to be sufficient to transfer the ~1,200 tonne/day of CO2 product to the greenhouse(s). No elevation changes were included in the pipeline pressure drop calculations. 4.2 Product 2: CO2 for Use in EOR In order to produce a gas product for use in EOR applications, it was assumed that the specifications provided in the Design Basis document in Appendix 1 would be met, and the product would be compressed to a pressure typical of EOR CO2 pipelines (125 bara). In order to meet the purity requirements and in order to avoid problems during compression and/or pipeline transfer, it is assumed that deep ammonia removal, H2S removal to about 1 ppmv, compression, and dehydration are all necessary. The modules used to meet these requirements are discussed in the following subsections. A flow diagram for the conceptual production process for Product 2 is shown in Figure 4.2. The pressure of the CO2 product at the process battery limits is 125 bara. Although a cost for a pipeline is estimated in this project for the greenhouse CO2 product, no pipeline cost is included
Page 13 of 41
for the EOR case. Conversations with ESMAP indicated that potential users of EOR CO2 might be much further away than the 5 km assumed for the greenhouse case; long distance pipeline costs can be an important cost factor and should be considered further by ESMAP and EOR companies, should the use of CO2 for EOR be further developed. 4.2.1 Module 5 (Product 2): Deep Ammonia Removal Although the CO2 product specification for EOR use does not require that ammonia be removed down to very low levels, it is known that ammonia present in bulk CO2 gas can cause problems during compression (solids formation). When it is present in CO2, ammonia is typically removed to low level prior to compression. Although the exact quantification of the issue for this case is outside of the scope and budget of this project, Trimeric assumed that the bulk ammonia removal module (Module 1) used for the greenhouse product would not be sufficient for the EOR case, where compression to very high pressure is required. In order to reduce the ammonia concentration to very low levels (~0.1 ppmv), it is assumed that a scrubbing process using an acid would be required. Sulfuric acid was chosen as a relatively inexpensive, readily available, strong acid that should function adequately; it is also assumed that the product salt solution – ammonium sulfate and ammonium carbonate in water – could readily be mixed with the geothermal power plant condensate/brine stream and disposed of by injection. In order to minimize acid usage, Trimeric designed the scrubber as a two stage system: the first stage (bottom of the contactor column) in which the entering NCG is cooled and the bulk of the ammonia removed by the condensed and recirculating water (as in Module 1). The gas then is contacted (top section of the column) with the recirculating sulfuric acid solution, which serves to remove the remaining ammonia. Spent sulfuric acid solution (ammonium sulfate) overflows through a chimney tray between the two sections of the column, and is mixed with the water (with ammonium carbonate) in the bottom section of the column. Some of the key design parameters used to estimate the cost of equipment in this module summarized below:
• Tower size: 5 ft diameter x 44.5 ft height, total packed height: 31.5 ft
• Recirculation rates: top section – 200 gallon per minute (gpm), bottom sect. – 600 gpm
• Water / ammonium sulfate holding tank volume: 13,570 gallon
• Main materials of construction: 316/316L SS
• Sulfuric acid make-up rate: ~120 lb/day (98% H2SO4) 4.2.2 Module 2 (Product 2): Liquid Redox Sulfur Recovery for H2S Removal H2S removal for EOR product CO2 is identical to that used for the greenhouse CO2 product. Please see section 4.1.2 for the description of LRSR for H2S removal.

Page 14 of 41
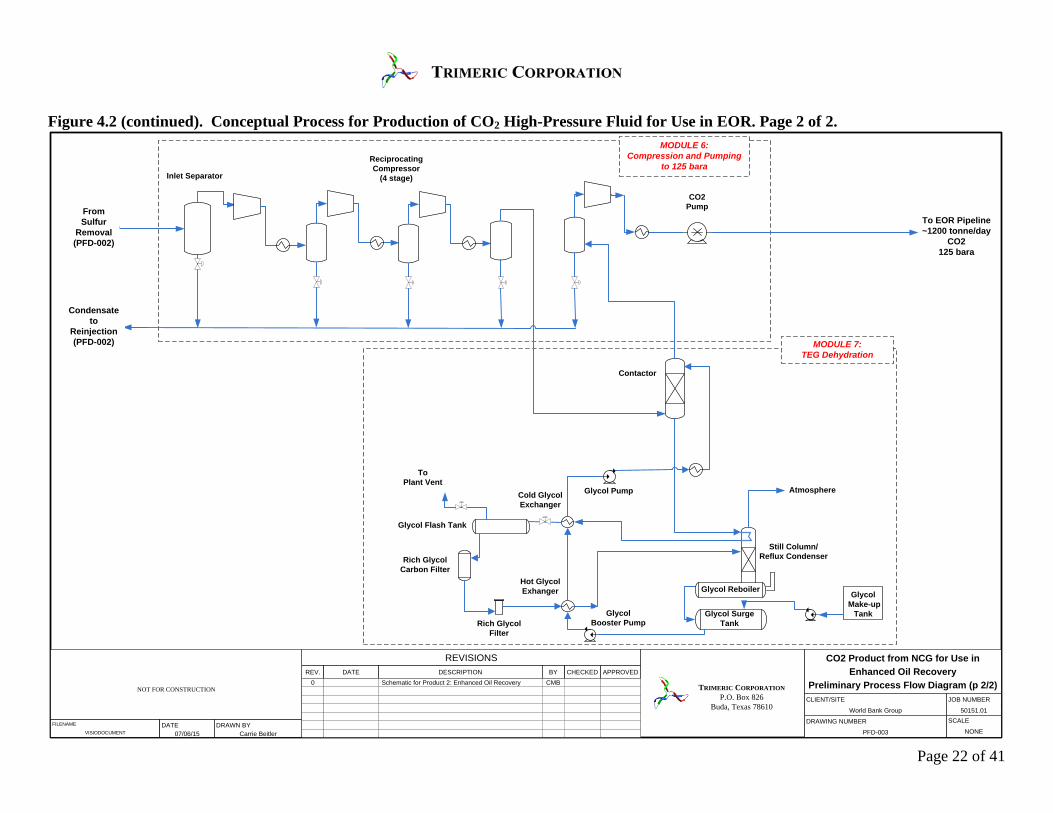
4.2.3 Modules 6 and 7 (Product 2): Compression and Pumping to 125 bara, and Dehydration After H2S and ammonia have both been removed to low levels, the gas is then compressed and dehydrated. To reach the level of dehydration required for the EOR specification, the two technologies that might typically be used are molecular sieve and glycol dehydration. The latter technology was selected because it is known to be able to reach the required water specification, and is usually less expensive than molecular sieves. Two different mechanical devices are used to raise the pressure of the CO2 to the assumed product pressure of 125 bara. A four-stage reciprocating compressor is assumed to be used to raise the pressure of the gas to 83.8 bara. After these four stages of compression, the CO2 stream is a dense-phase supercritical fluid, and the density is high enough (~0.57 kg/L) such that centrifugal pumps can then be used; it is assumed that the pressure is raised to 125 bara using a multistage centrifugal pump. The compression and dehydration processes are interconnected, and they are presented here together for that reason. Rather than operate the dehydration on the gas feed to the compression at ~4.3 bara, or the fully compressed supercritical fluid at 125 bara, it is economically and technically advantageous to dehydrate the gas at an intermediate pressure. Dehydration of the 125 bara fluid using a glycol is problematic for various reasons such as the high density of the CO2 fluid and phase co-solubilities, which lead to excessive losses of glycol into the CO2 stream; dehydration at low pressure (4.3 bara) is expensive (when the gas is saturated with water) due to the large quantity of water that must be removed and the resulting large glycol recirculation rates and regeneration requirements. The solubility of water in CO2 is at a minimum at a pressure of roughly 50 bara, and thus it is usually advantageous to apply a glycol dehydration system in a compression train at the pressure closest to this minimum water solubility pressure. [Another option would be to use a different solvent – glycerol – to dehydrate at 125 bara.] To minimize the cost of dehydration, the glycol dehydration unit is placed in the process such that it will dehydrate the gas at the pressure closest to the pressure at which the solubility of water in the CO2 is near the minimum. Compressor inter-stage cooler exchangers are used to remove water from the gas by condensation after each stage of compression. As a result, much of the dehydration is actually done by the compressor inter-stage coolers. Once the gas has gotten to a pressure near the minimum water solubility pressure (for this case ~42 bara), the gas is then subjected to glycol dehydration. This allows for the glycol unit to be as small as possible and minimizes its operating costs. Dehydration of gas streams using triethylene glycol (TEG) is very common in the gas treatment industry, and it is assumed that a standard TEG system would be applied to dehydrate this gas stream (Gas Processors Suppliers Association, 2012). The process uses TEG to absorb water from the gas in the contactor, and then the TEG is regenerated in a Still Column/Reboiler system by evaporating the water from the TEG. The reboilers of TEG units are often heated by a fuel gas, but the use of electric resistance heating is assumed for this case.
Page 15 of 41
Some of the key design parameters used to estimate the cost of equipment in this module summarized below:
• Compressor: 4-stage, reciprocating compressor with stainless steel construction. 4,700 hp, inter-stage coolers assumed to use cooling tower water.
• CO2 pump: multistage centrifugal pump, 90 hp.
• Dehydration unit: TEG, 109 lb/h water removal rate, 6.2 gpm TEG recirculation rate, reboiler duty 0.33 MMBtu/h.
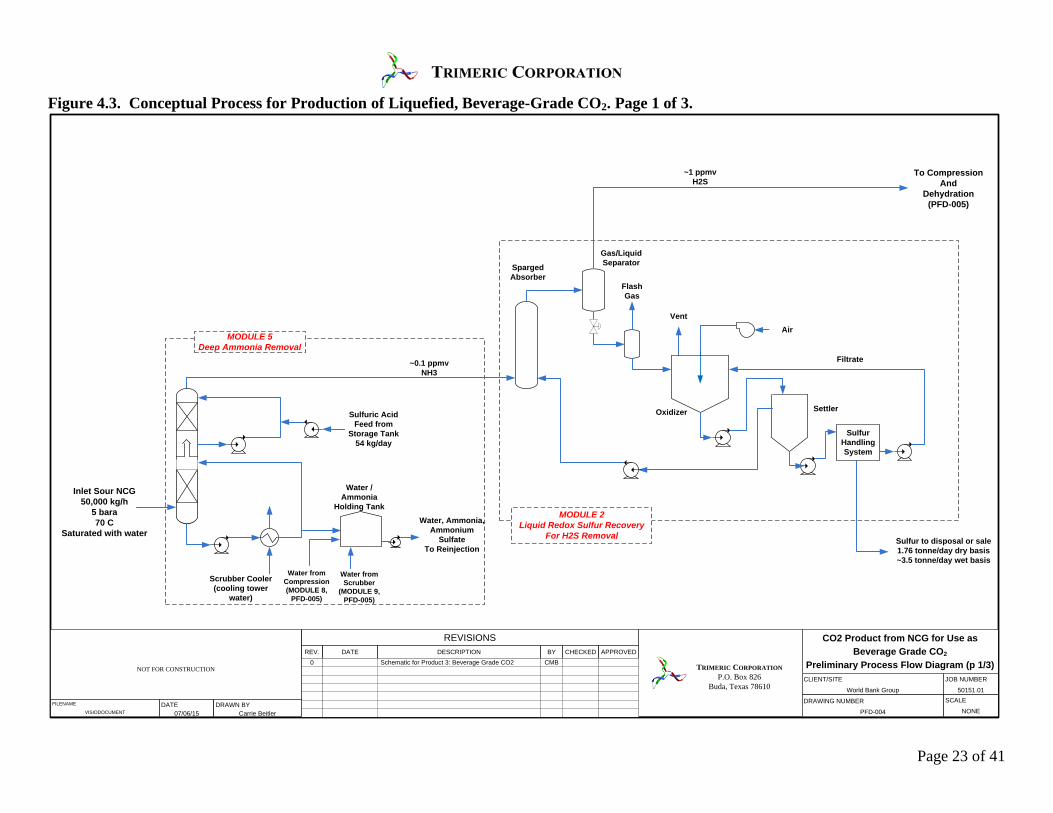
4.3 Product 3: Liquified, Beverage-Grade CO2 As discussed in detail in the Design Basis document, Trimeric used the specification for beverage-grade CO2 (Compressed Gas Association, Inc., 2011) to apply to other liquefied grades, including food grade, dry-ice grade (often the same as food or beverage grade), and industrial grade. For the production of a liquefied, beverage-grade product, the process is more complex due to the fact that nearly all of the impurities must be removed to lower levels. The modules that are used for this product are summarized in the subsections below. A diagram of the conceptual process that could be used to produce Product 3 is given in Figure 4.3. 4.3.1 Module 5 (Product 3): Deep Ammonia Removal Deep ammonia removal is required for a beverage-grade product, and the process is assumed to be the same as that used for the EOR product. See section 4.2.1 for a description of the deep-ammonia-removal process. 4.3.2 Module 2 (Product 3): Liquid Redox Sulfur Recovery for H2S Removal Beverage grade CO2 requires very deep removal of H2S, and an LRSR process cannot necessarily be relied upon by itself. However, the techniques required to get very deep H2S removal are not economical for the removal of the large amount of H2S (~1.7 tonne/day) that must be removed from this NCG stream. Therefore, a two-step process for H2S removal is specified here: an LRSR unit to reduce H2S in the NCG to ~1 ppmv, and then another module (Module 13) will be used to reduce H2S to the very low levels (< 0.1 ppmv) that are required by beverage-grade specifications. It is also common in beverage-grade CO2 production to include a backup H2S scavenger system; that is included in this process in Module 10 (Fisher & McKaskle, 2006). The LRSR H2S removal for this product is the same as that specified for the greenhouse and EOR CO2 products. See section 4.1.2 for a description of this technology.
Page 16 of 41
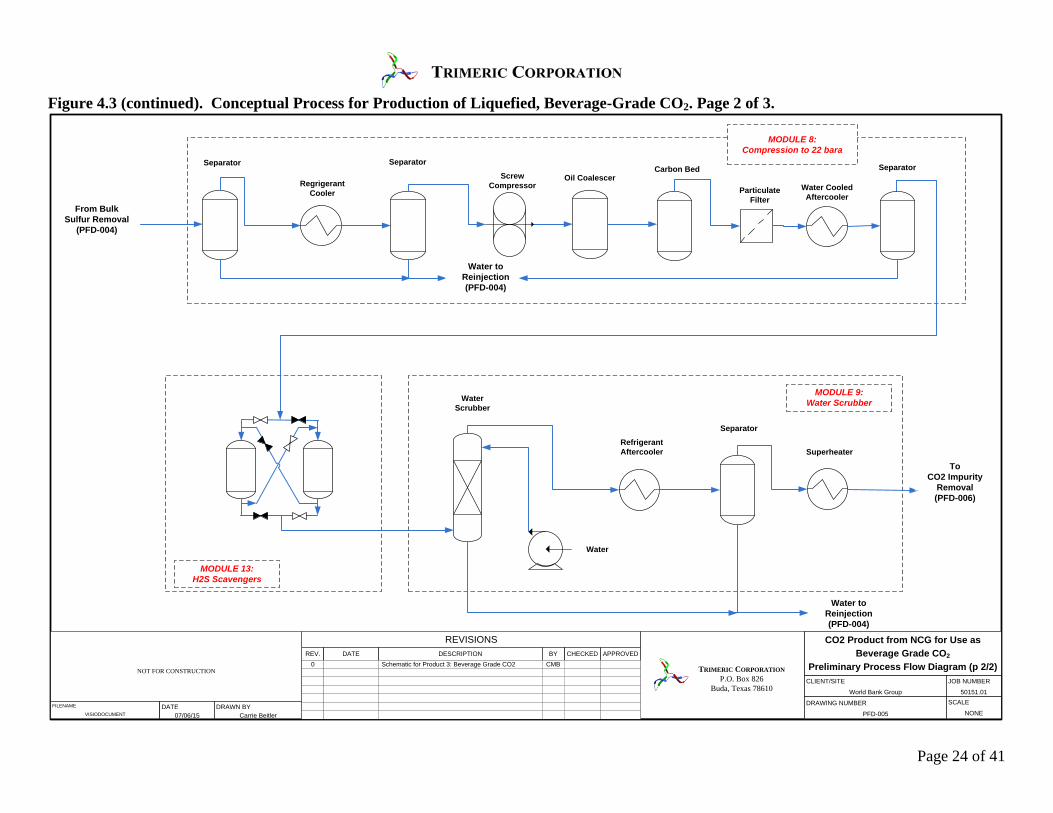
4.3.3 Module 8 (Product 3): Compression to 22 bara After the H2S (to ~1 ppmv) and NH3 (to ~0.1 ppmv) have been removed, the gas is then compressed to about 22 bara. For this compression, a conventional (oil flooded) screw compressor is most economical to use and is assumed here; the power requirement is estimated at 3,000 hp. 4.3.4 Module 13 (Product 3): H2S Scavengers The CO2 gas at about 22 bara is then subjected to a series of further purification processes prior to entering the liquefaction process. The first step is the use of scavenger chemicals to remove essentially all of the remaining H2S (specification is < 0.1 ppmv). It is assumed that a conventional solid scavenger composed of metal oxides supported on a solid adsorbent substrate would be used for this application. An example of this solid scavenger is SulfaTreat® (M-I SWACO division of Schlumberger). Metal oxides react irreversibly with the H2S, forming a solid reaction product. The spent absorbent can typically be landfilled. Solid scavenger systems, such as the SulfaTreat® system assumed here, are typically installed with two to three vessels, sometimes in a lead-lag configuration, with the beds changed out when the adsorbent is spent (Fisher, Lundeen, & Leppin, 1999). Trimeric used design estimates provided by M-I SWACO to estimate the size of the SulfaTreat® vessels, and their adsorbent capacity. The key design parameters used to estimate the cost of equipment in this module are the pressure vessels used to contain the SulfaTreat®, and the amount of the fill of SulfaTreat® adsorbent. These parameters are given below:
• Number of vessels: 3
• Size of vessels: 7.25 ft diameter x 20 ft height
• Initial fill of SulfaTreat® per vessel: 45,000 lb 4.3.5 Module 9 (Product 3): Water Scrubber After the H2S scavengers, the gas is assumed to undergo more purification steps, the next being water scrubbing. There are no specific impurities that this water scrubbing step is targeted to; rather this step is commonly done during the production of liquefied CO2 in order to remove small amounts of miscellaneous water-soluble impurities (in the ppm and ppb concentration range) that might be present in the gas. A once-through scrubber system is assumed for this system; the required flow rate for water is highly dependent upon the concentration of water-soluble species in the gas that must be removed. Trimeric has designed water scrubber systems applied to CO2 recovery from fermentation off-gases that require upwards of 100 gpm of fresh water. It is expected that this application would require a substantially lower feed water flow rate.
Page 17 of 41
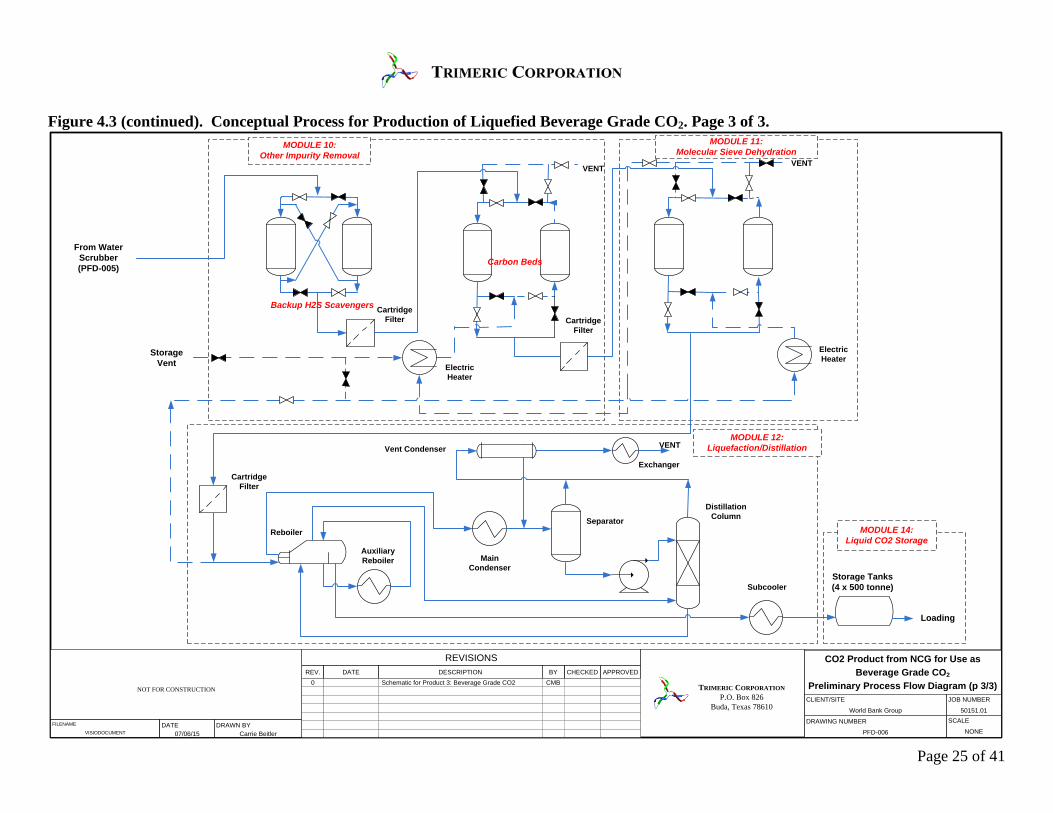
No further details of design for this module were developed because the cost of this module is grouped with a number of other modules in this process, and is based on a lump sum value. 4.3.6 Module 10 (Product 3): Other Impurity Removal After the H2S Scavenger and Water Scrubber, some additional unit operations are typically included in liquefied CO2 production processes to remove small amounts of impurities and also to serve as backups. In this module the gas is first contacted with another H2S scavenger bed (two in lead-lag configuration); it is common in food and beverage grade CO2 production processes to place a backup H2S scavenger bed in order to ensure that there is no breakthrough of H2S above 0.1 ppmv, so a pair of small scavenger units are included in this evaluation. After the backup H2S scavenger beds, carbon beds are included to remove any low-level organic impurities, such as benzene and other light hydrocarbon compounds. The carbon beds are assumed to be regenerable, and electric heaters (266 kW) are used to regenerate the off-line bed. No further details of design for this module were developed because the cost of this module is combined with a number of other modules in this process, and is based on a lump sum value estimated previously. 4.3.7 Module 11 (Product 3): Molecular-Sieve Dehydration The liquefaction of CO2 involves low temperatures (typically on the order of - 26 oC / - 15 oF). Prior to liquefaction, the CO2 must be dehydrated to very low water concentrations (< 1 ppm) in order to prevent hydrate formation, freezing, and other problems relating to the presence of water. Molecular sieves are capable of achieving lower concentrations of water than conventional glycol dehydration systems, and molecular sieves are usually required in food-and-beverage-grade CO2 liquefaction processes. Two molecular sieve beds are included so that one can be on-line and the other available to be regenerated. Regeneration is achieved by passing a heated dry gas slip-stream (7,500 lb/h) through the bed. Electric heating (266 kW) is used for the regeneration heat source. No further details of design for this module were developed because the cost of this module is combined with a number of other modules in this process, and is based on a lump sum value estimated previously. 4.3.8 Module 12 (Product 3): Liquefaction/Distillation The liquefaction/distillation process liquefies the CO2 by refrigeration and purifies the product by distillation. The main impurities removed in the distillation are the gas compounds with significantly higher volatility than CO2, such as nitrogen, argon, hydrogen, and methane. These impurity compounds are removed from the CO2 product as part of the overhead gas stream (vented to the atmosphere) from the distillation system.
Page 18 of 41
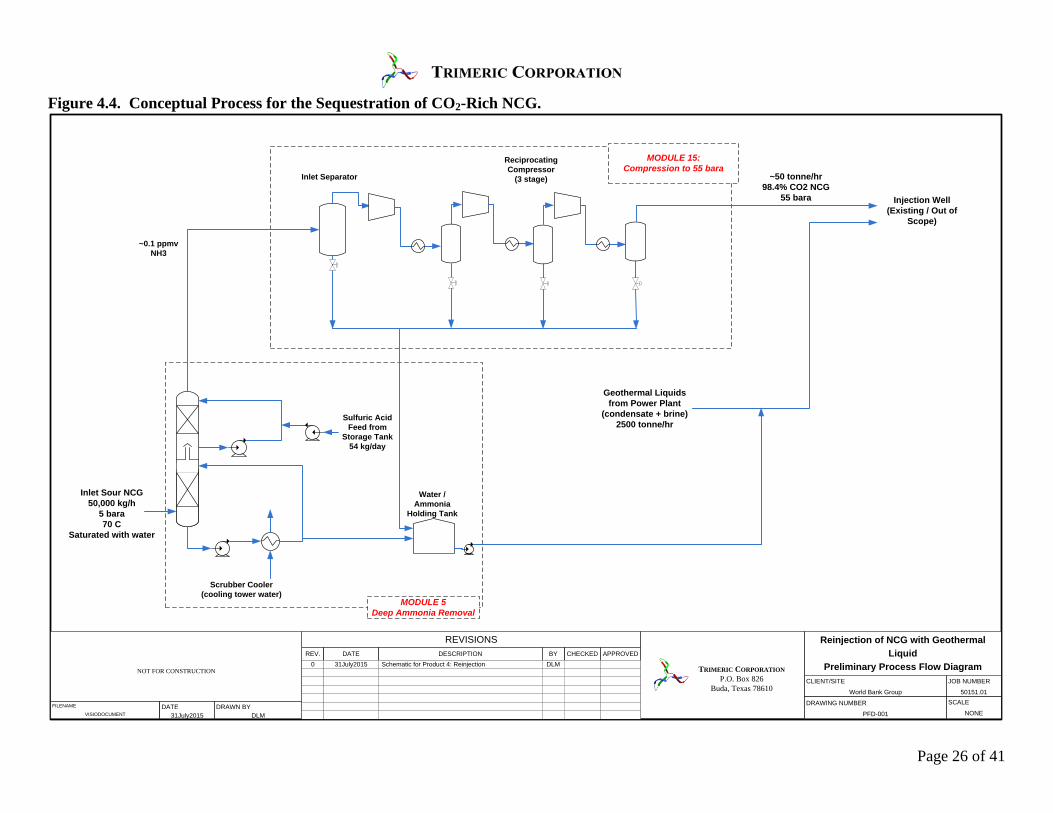
No further details of design for this module were developed because the cost of this module is combined with a number of other modules in this process, and is based on a lump sum value estimated previously. 4.3.9 Module 14 (Product 3): Liquid CO2 Storage Liquefied CO2 product is often stored on-site, and it can be shipped by tank car, ship, or tank truck as a refrigerated liquid. Given the typically remote location of geothermal power plants, it is assumed that the product would be shipped by tank truck. Four storage tanks with a capacity of 500 tonne of CO2 each were assumed to be required for storage, which represents about 1.7 days of production storage capacity. Trimeric judged that a longer storage capacity was not required, because the geothermal power plant could readily stop producing CO2 product if necessary (e.g., due to interruption in tank truck service) and vent the NCG to the atmosphere, without affecting operation of the power plant. 4.4 Product 4: Reinjection of NCG for Carbon Capture Credits Because the NCG is primarily CO2, it is assumed that reinjection of this gas stream, heretofore vented to the atmosphere, would have a monetary value due to carbon capture credits. Because the CO2 is not actually recovered as a product, it is logical that the stream would be processed to the minimum extent that would allow for it to be reinjected. This study assumes that the NCG would be dissolved in the geothermal fluids (condensate plus brine) from the geothermal power plant, and disposed of combined with the fluids in the injection well. Dissolution of the NCG into the fluids requires a relatively high pressure, so the main costs for this product are associated with the compression of the NCG. Per discussion with ESMAP, the volume of liquid that the NCG would be dissolved in is 2,500 tonne/hr. The liquid supply is constrained by the assumptions that dissolved gases constitute 2% of the mass of the geothermal fluid, and the gas flow rate is 50 tonne/hr. A liquid temperature of 70°C was used. The NCG would be compressed to the pressure required to dissolve it in the liquid, but the dissolution into the liquid would occur at the depth in the reservoir at which the liquid is at the required pressure for dissolution of the NCG due to hydrostatic pressure. Therefore, this study does not include pumping of the geothermal liquids to the required pressure; rather this study only includes the unit operations necessary to compress the NCG to the required pressure. Simulations in WinSim DESIGN II were used to evaluate the solubility of the NCG stream in the liquid stream as a function of pressure at 70 °C. The pressure was then determined that would result in a single phase liquid at 70 °C. The liquid was treated as pure water, which is acknowledged as a potential source of inaccuracy; but to mitigate this factor, the required pressure was increased by 25%. It was estimated that a pressure of 55 bara would be required to achieve the dissolution of the NCG into the geothermal liquid stream for reinjection. Because of the aforementioned problems associated with ammonia during compression of CO2 streams, this product scheme requires that deep ammonia removal also be done. Therefore, this
Page 19 of 41
product requires two modules: deep ammonia removal and compression. A process flow diagram of the conceptual production process for Product 4, showing the battery limits of the modules, is given in Figure 4.4. Neither H2S, nor water should need to be removed in order for the gas to be compressed and pipelined a (presumably) short distance to the injection well. 4.4.1 Module 5 (Product 4): Deep Ammonia Removal Deep ammonia removal is likely to be required prior to compression in order to avoid the formation of solids during compression. This module is identical to that required for two other products and was described earlier; see section 4.2.1. 4.4.2 Module 15 (Product 4): Compression to 55 bara After ammonia has been removed to low levels, the gas can be compressed. A three-stage reciprocating compressor (4,270 hp) with intercooling (cooling tower water) serves as the basis for estimating the costs of the equipment required to raise the pressure of the gas to 55 bara.
Page 20 of 41
Figure 4.1. Conceptual Process for Production of CO2 Gas Product for Use in Greenhouses.
REVISIONSREV. CHECKEDDESCRIPTIONDATE BY APPROVED
CO2 Product from NCG for Use in Greenhouses
Preliminary Process Flow DiagramJOB NUMBER
50151.01
CLIENT/SITE
World Bank Group
DRAWING NUMBER
PFD-001
SCALE
NONE
0 Schematic for Product 1: Greenhouse CMB
NOT FOR CONSTRUCTION
FILENAME
VISIODOCUMENTDATE
07/06/15DRAWN BY
Carrie Beitler
TRIMERIC CORPORATIONP.O. Box 826
Buda, Texas 78610
Condensed Water Separator
Cooling Tower WaterCooler
Inlet Sour NCG50,000 kg/h
5 bara70 C
Saturated with water
40 C
Sparged Absorber
Gas/LiquidSeparator
Oxidizer Settler
Flash Gas
Vent
SulfurHandlingSystem
Sulfur to disposal or sale1.76 tonne/day dry basis~3.5 tonne/day wet basis
Filtrate
Air
Water/Ammonia toReinjection
155 TonCommercial
Chiller
Gas/LiquidSeparator
5 km of horizontal pipeline (16-inch, 400 mm)
MODULE 1Bulk Ammonia Removal
MODULE 2Liquid Redox Sulfur Recovery
For H2S Removal
MODULE 3Chiller Dehydration ~1200 tonne/
day CO2To
Greenhouse
40 C 7.2 C
<5 ppmv H2S,
4.5 bara
~40 ppmv NH3
Water/Ammonia
Holding Tank
MODULE 4Low Pressure Pipeline
Page 21 of 41
Figure 4.2. Conceptual Process for Production of CO2 High-Pressure Fluid for Use in EOR. Page 1 of 2.
~40 ppmv NH3
REVISIONSREV. CHECKEDDESCRIPTIONDATE BY APPROVED
CO2 Product from NCG for Use in Enhanced Oil Recovery
Preliminary Process Flow Diagram (p 1/2)JOB NUMBER
50151.01
CLIENT/SITE
World Bank Group
DRAWING NUMBER
PFD-002
SCALE
NONE
0 Schematic for Product 2: Enhanced Oil Recovery CMBNOT FOR CONSTRUCTION
FILENAME
VISIODOCUMENTDATE
07/06/15DRAWN BY
Carrie Beitler
TRIMERIC CORPORATIONP.O. Box 826
Buda, Texas 78610
Inlet Sour NCG50,000 kg/h
5 bara70 C
Saturated with water
Sparged Absorber
Gas/LiquidSeparator
Oxidizer Settler
Flash Gas
Vent
SulfurHandlingSystem
Filtrate
Air
Scrubber Cooler(cooling tower water)
Water, Ammonia,Ammonium
SulfateTo Reinjection
Sulfuric AcidFeed from
Storage Tank54 kg/day
To CompressionAnd
Dehydration (PFD-003)
~0.1 ppmvNH3
MODULE 5Deep Ammonia Removal
MODULE 2Liquid Redox Sulfur Recovery
For H2S RemovalSulfur to disposal or sale1.76 tonne/day dry basis~3.5 tonne/day wet basis
~1 ppmv H2S
Water /Ammonia
Holding Tank
Water from Compression (MODULE 6)
Page 22 of 41
Figure 4.2 (continued). Conceptual Process for Production of CO2 High-Pressure Fluid for Use in EOR. Page 2 of 2.
REVISIONSREV. CHECKEDDESCRIPTIONDATE BY APPROVED
CO2 Product from NCG for Use in Enhanced Oil Recovery
Preliminary Process Flow Diagram (p 2/2)JOB NUMBER
50151.01
CLIENT/SITE
World Bank Group
DRAWING NUMBER
PFD-003
SCALE
NONE
0 Schematic for Product 2: Enhanced Oil Recovery CMBNOT FOR CONSTRUCTION
FILENAME
VISIODOCUMENTDATE
07/06/15DRAWN BY
Carrie Beitler
TRIMERIC CORPORATIONP.O. Box 826
Buda, Texas 78610
Inlet Separator
Contactor
Still Column/Reflux Condenser
Glycol ReboilerHot Glycol Exhanger
Cold GlycolExchanger
Glycol Pump
Glycol Flash Tank
Rich Glycol Carbon Filter
Glycol Surge TankRich Glycol
Filter
To Plant Vent
Glycol Make-up
TankGlycol Booster Pump
Reciprocating Compressor
(4 stage)
CO2 Pump
Condensateto
Reinjection(PFD-002)
To EOR Pipeline ~1200 tonne/day
CO2125 bara
MODULE 6:Compression and Pumping
to 125 bara
MODULE 7:TEG Dehydration
From Sulfur
Removal(PFD-002)
Atmosphere
Page 23 of 41
Figure 4.3. Conceptual Process for Production of Liquefied, Beverage-Grade CO2. Page 1 of 3.
REVISIONSREV. CHECKEDDESCRIPTIONDATE BY APPROVED
CO2 Product from NCG for Use as Beverage Grade CO2
Preliminary Process Flow Diagram (p 1/3)JOB NUMBER
50151.01
CLIENT/SITE
World Bank Group
DRAWING NUMBER
PFD-004
SCALE
NONE
0 Schematic for Product 3: Beverage Grade CO2 CMBNOT FOR CONSTRUCTION
FILENAME
VISIODOCUMENTDATE
07/06/15DRAWN BY
Carrie Beitler
TRIMERIC CORPORATIONP.O. Box 826
Buda, Texas 78610
Sparged Absorber
Gas/LiquidSeparator
Oxidizer Settler
Flash Gas
Vent
SulfurHandlingSystem
Filtrate
Air
Sulfuric AcidFeed from
Storage Tank54 kg/day
To CompressionAnd
Dehydration(PFD-005)
~0.1 ppmvNH3
Inlet Sour NCG50,000 kg/h
5 bara70 C
Saturated with waterWater, Ammonia,
Ammonium Sulfate
To Reinjection
MODULE 5Deep Ammonia Removal
Water /Ammonia
Holding Tank
Water from Compression (MODULE 8,
PFD-005)
Scrubber Cooler(cooling tower
water)
MODULE 2Liquid Redox Sulfur Recovery
For H2S Removal Sulfur to disposal or sale1.76 tonne/day dry basis~3.5 tonne/day wet basis
~1 ppmv H2S
Water fromScrubber
(MODULE 9, PFD-005)
Page 24 of 41
Figure 4.3 (continued). Conceptual Process for Production of Liquefied, Beverage-Grade CO2. Page 2 of 3.
REVISIONSREV. CHECKEDDESCRIPTIONDATE BY APPROVED
Figure 4. Denbury Smackover CO2CO2 & H2S Compression
Process Flow DiagramJOB NUMBER
50151.01
CLIENT/SITE
World Bank Group
DRAWING NUMBER
PFD-005
SCALE
NONE
0 Schematic for Product 3: Beverage Grade CO2 CMBNOT FOR CONSTRUCTION
FILENAME
VISIODOCUMENTDATE
07/06/15DRAWN BY
Carrie Beitler
TRIMERIC CORPORATIONP.O. Box 826
Buda, Texas 78610
CO2 Product from NCG for Use as Beverage Grade CO2
Preliminary Process Flow Diagram (p 2/2)
Separator
Regrigerant Cooler
SeparatorScrew
CompressorOil Coalescer
Carbon Bed
Particulate Filter
Water Cooled Aftercooler
Water Scrubber
Refrigerant Aftercooler
Separator
Superheater
Water
From BulkSulfur Removal
(PFD-004)
To CO2 Impurity
Removal(PFD-006)
MODULE 9:Water Scrubber
MODULE 8:Compression to 22 bara
Water to Reinjection(PFD-004)
Water to Reinjection(PFD-004)
MODULE 13:H2S Scavengers
Separator
Page 25 of 41
Figure 4.3 (continued). Conceptual Process for Production of Liquefied Beverage Grade CO2. Page 3 of 3.
REVISIONSREV. CHECKEDDESCRIPTIONDATE BY APPROVED
Figure 5. Denbury Smackover CO2 Storage & Utilities
Process Flow DiagramJOB NUMBER
50151.01
CLIENT/SITE
World Bank Group
DRAWING NUMBER
PFD-006
SCALE
NONE
0 Schematic for Product 3: Beverage Grade CO2 CMBNOT FOR CONSTRUCTION
FILENAME
VISIODOCUMENTDATE
07/06/15DRAWN BY
Carrie Beitler
TRIMERIC CORPORATIONP.O. Box 826
Buda, Texas 78610
CO2 Product from NCG for Use as Beverage Grade CO2
Preliminary Process Flow Diagram (p 3/3)
Storage Tanks (4 x 500 tonne)
VENT
From Water Scrubber(PFD-005)
Storage Vent
VENTVENT
Cartridge Filter
Electric Heater
Electric Heater
Cartridge Filter
Reboiler
Auxiliary Reboiler Main
Condenser
Separator
Exchanger
Distillation Column
Subcooler
Vent Condenser
Cartridge Filter
Backup H2S Scavengers
Carbon Beds
MODULE 11:Molecular Sieve Dehydration
MODULE 10:Other Impurity Removal
MODULE 12:Liquefaction/Distillation
Loading
MODULE 14:Liquid CO2 Storage
Page 26 of 41
Figure 4.4. Conceptual Process for the Sequestration of CO2-Rich NCG.
REVISIONSREV. CHECKEDDESCRIPTIONDATE BY APPROVED
Reinjection of NCG with Geothermal Liquid
Preliminary Process Flow DiagramJOB NUMBER
50151.01
CLIENT/SITE
World Bank Group
DRAWING NUMBER
PFD-001
SCALE
NONE
0 31July2015 Schematic for Product 4: Reinjection DLMNOT FOR CONSTRUCTION
FILENAME
VISIODOCUMENTDATE
31July2015DRAWN BY
DLM
TRIMERIC CORPORATIONP.O. Box 826
Buda, Texas 78610
Inlet Sour NCG50,000 kg/h
5 bara70 C
Saturated with water
Scrubber Cooler(cooling tower water)
Sulfuric AcidFeed from
Storage Tank54 kg/day
~0.1 ppmvNH3
MODULE 5Deep Ammonia Removal
Water /Ammonia
Holding Tank
Inlet Separator
Reciprocating Compressor
(3 stage) ~50 tonne/hr 98.4% CO2 NCG
55 bara
MODULE 15:Compression to 55 bara
Geothermal Liquids from Power Plant
(condensate + brine)2500 tonne/hr
Injection Well(Existing / Out of
Scope)
Page 27 of 41
5 Economic Evaluation In this early-phase comparative economic analysis, a variety of methods were used to estimate capital and operating costs for the process systems. The following sections provide information about the methods that were used, and also present the data. 5.1 Methods Used to Estimate Capital Cost Two basic approaches were taken in the estimation of capital costs for modules:
A. Purchased equipment cost (PEC) of major equipment was estimated and then installation factors were applied to the PEC to estimate the cost of the installed process equipment.
B. The use of data available to Trimeric regarding cost estimates produced for similar complete process system modules, or the cost of actual constructed plants. Typically, such data is not for the same exact size or time period as that required in this study, and the cost data must be scaled to account for the differences.
When using method A. (above), Trimeric estimated the PEC using two data sources:
• Aspentech Capital Cost Estimator (v. 8.4), which generates the PEC estimates for major equipment based on input design parameters.
• Trimeric’s previous experience regarding the PEC of this type of equipment. Trimeric then applied commonly used installation factors to convert the individual PEC to installed costs for the equipment. The following installation multiplication factors were used to convert purchased equipment cost (PEC) to total installed cost (TIC):
• Vessels, exchangers, pumps, tanks: 4
• Package skidded chiller: 2
• Package skidded compressors: 1.85
• Package skidded glycol dehydration unit: 1.5
When Trimeric used method B. (above), the source data were previous estimates or actual plant cost data representing the TIC for a process module, groups of modules, or a complete facility. When such data could be used, they were scaled as necessary based on the unit’s characteristic capacity. For example, many complete gas treating modules, such as a TEG dehydration system, can be scaled in cost based on a simple exponent rule:
Cost2 = Cost1 * (Capacity2/Capacity1)n (where n=0.6 for many types of process systems) The above exponent method was used to convert the costs of complete process modules (such as TEG dehydration systems) or groups of modules (such as a majority of the systems in the CO2 liquefaction process) from the capacity of the source data to the capacity required of this project.
Page 28 of 41
First quarter 2014 was used for the cost time basis. PECs generated by Aspentech software used this time basis; equipment costs derived from other sources which did not use the first quarter 2014 time basis were escalated using Nelson Ferrar Capital Factors (Oil & Gas Journal, 2015). As discussed in the Design Basis document, capital cost estimates are inside battery limit (ISBL), which implies that the estimated costs only cover the installed process systems, and does not cover items that are not part of the process system. Items that are not considered part of an ISBL limit included (but are not limited to) land purchase, site preparation, access roads, office buildings, control buildings, provision of utilities which are not specifically included in the process design; examples of utility systems that could be required but are not included in this estimate include cooling towers, instrument air compression, electrical substations, and pipelines (unless specifically included such as for the greenhouse case). After a TIC is estimated for each process module, a contingency factor is also applied. Trimeric chose 20% as the contingency factor, which is typical for early phase studies when only well-established technologies such as those in this study are being considered. The same contingency value was applied to all process modules. 5.2 Methods Used to Estimate Operating Costs Major operating costs for a process include a few distinct types of costs. The ones included in this study area:
• Major Utility Costs. Electricity is the only utility cost included in this study. Some other minor costs are ignored, such as the provision of cooling water and instrument air, because they are trivial compared to electricity cost.
• Chemical and Other Disposable Material Costs: Some disposable chemicals are required in some of the modules, such as H2S scavengers and sulfuric acid. Only the more significant costs such as H2S scavengers and sulfuric acid are included in this study.
• Operations Labor: In early phase projects such as this, it is difficult to predict with much accuracy the amount of operations labor that will be required. Trimeric used engineering judgment to estimate the full time equivalent (FTE) operating staff that could be required for each module (or group of modules), and applied an estimated annual cost ($100,000 / FTE) for operations labor (fully loaded) in the USA.
• Maintenance and G&A Costs: For early phase estimation work, maintenance and general and administrative (G&A) overhead costs are frequently estimated as a fraction of the project TIC per year. That approach was used in this study: 2% of TIC/year was assumed for maintenance, and 2.5% of TIC/year was assumed for G&A.
• Capital Amortization: Amortization of capital cost is usually included in any early phase cost analyses. For this study, Trimeric assumed that the capital amortization was based on a simple 20 year, straight line, no interest method; i.e., capital amortization per year = total project cost / 20.
Page 29 of 41
In the estimation of the costs of utility and chemical costs, it was assumed that that process facility operates a total of 350 days per year. 5.3 Product 1: CO2 Gas for Use in Greenhouse 5.3.1 Module 1 (Product 1): Bulk Ammonia Removal The capital cost was based on the use of Aspentech software using key design parameters for individual pieces of major process equipment, with installation factors applied to obtain an installed cost. Very little electrical power is required for this module, and no chemicals are required. 5.3.2 Module 2 (Product 1): Liquid Redox Sulfur Recovery for H2S Removal The capital cost for LRSR was based on budgetary estimates and quotations for SulFerox® and LO-CAT® units for other applications previously obtained by Trimeric. Trimeric scaled the cost data based on the key design parameter for LRSR units: the mass rate at which H2S is removed from the gas. Operating costs for the LRSR units were developed based on the same budgetary estimates and quotations. Typically, the vendor provided power and chemical usage estimates, and Trimeric scaled these estimates accordingly. 5.3.3 Module 3 (Product 1): Chiller Dehydration The capital cost for this module was based on two methods: costs for the cross exchanger and separator vessel were based on Aspentech software (with installation factors applied by Trimeric), and the cost for the chiller was based on budgetary estimates and quotations from previous work. The main utility cost for this module is electrical power for the 155 ton chiller. 5.3.4 Module 4 (Product 1): Low Pressure Pipeline Trimeric is aware of various methods with which the cost of pipelines can be estimated, including literature sources (Carroll, 2010) and based on estimates for CO2 pipeline construction from other project experience. Trimeric used an average value of the costs estimated based on a few of the above sources; the cost estimates are based on both the length of the pipeline and the diameter of the pipeline. 5.4 Product 2: CO2 for Use in EOR 5.4.1 Module 5 (Product 2): Deep Ammonia Removal Aspentech software was used to estimate the PEC for major equipment for the deep ammonia removal module, based on the input of key design parameters. The PEC data was converted to TIC by the application of installation factors.
Page 30 of 41
Major process operating costs consist of electrical power for pumping, and sulfuric acid for removing ammonia from the gas. A typical (U.S.) commercial sulfuric acid unit cost – $0.035/lb for bulk 98% H2SO4 – was assumed in the calculation of the total cost for sulfuric acid. 5.4.2 Module 2 (Product 2): Liquid Redox Sulfur Recovery for H2S Removal This module is identical to that used for the greenhouse gas product. See section 5.3.2 for comments regarding capital and operating cost estimation. 5.4.3 Modules 6 and 7 (Product 2): Compression and Pumping to 125 bara, and Dehydration The capital costs for compression and pumping were based on cost data from other projects known to Trimeric. For reciprocating CO2 compressors (stainless steel construction), the installed capital cost can often be estimated to be in a range of $1,500 to $2,500 per horsepower. For this study we chose a value of $2,300/hp; this higher end value is attributed primarily to the fact that the compression is starting at a relatively low pressure (compression of lower density gas is typically more expensive compared to starting with higher density gas). The capital cost for the dense-phase CO2 pump was based on scaling of a recent quotation for a similar unit of larger capacity. The major operating cost for the CO2 compression and pumping is electric power. The power requirements were estimated using process simulations in WinSim DESIGN II. The capital cost of the TEG dehydration unit was scaled from quotation/budgetary estimate data from similar units of different sizes. Major process operating costs for the TEG unit include makeup for TEG losses and electrical power for pumps and the reboiler; these cost factors were estimated by scaling data from previous designs. 5.5 Product 3: Liquid Beverage Grade CO2 5.5.1 Module 5 (Product 3): Deep Ammonia Removal The deep ammonia removal process is assumed to be the same as that used for the EOR product. See section 5.4.1 for a summary of the methods used for capital and operating costs for this module. 5.5.2 Module 2 (Product 3): Liquid Redox Sulfur Recovery for H2S Removal The LRSR H2S removal for this product is the same as that specified for the greenhouse and EOR CO2 products. See section 5.3.2 for a description of the methods used to estimate the capital and operating costs for this module.
Page 31 of 41
5.5.3 Module 13 (Product 3): H2S Scavengers M-I SWACO provided process design information for use of SulfaTreat® for H2S scavenging in this application. Trimeric used the vessel size information as input to Aspentech software to estimate the PEC for the scavenger vessels. The fill cost of SulfaTreat® was based on M-I SWACO’s and Trimeric’s estimates. 5.5.4 Modules 8, 9, 10, 11, 12, 14 (Product 3): Compression, Impurity Removal, Dehydration,
Distillation, Liquefaction, Storage Most of the modules for the beverage grade liquid CO2 product are considered on a combined, “lump-sum” basis for the purposes of estimating the capital and operating costs. Trimeric has previously executed a project in which it was necessary to design these modules and generate capital and operating costs for them, at a different capacity than for this application. Rather than try to separate out the various cost components, in the interest of conserving project budget, Trimeric scaled the known total project cost data for these modules as a whole. The operating costs were similarly scaled. The major process operating cost for this module is electrical power. The major power users are the CO2 compressors, refrigeration unit (ammonia) compression, pumps, and the various process heaters required for molecular sieve regeneration, carbon bed regeneration, and gas reheating. Some chemical costs are also incurred in these modules, mostly due to planned occasional replacement of molecular sieve, carbon beds, and H2S backup scavenger materials. ESMAP should note that it may be possible to reduce power usage by making use of waste heat sources at the geothermal power plant, such as hot brine or steam condensate, as a replacement for electrical heaters. It was not feasible to evaluate such optimization issues in the scope of this project. 5.6 Product 4: Reinjection of NCG for Carbon Capture Credits 5.6.1 Module 5 (Product 4): Deep Ammonia Removal The deep ammonia removal process is assumed to be the same as that used for the EOR product. See section 5.4.1 for a summary of the methods used for capital and operating costs for this module. 5.6.2 Module 15 (Product 4): Compression to 55 bara The capital costs for compression and pumping were based on cost data from other projects known to Trimeric. For reciprocating CO2 compressors (stainless steel construction), the installed capital cost can often be estimated to be in a range of $1,500 to $2,500 per horsepower. For this study we chose a value of $2,300/hp; this higher end value is attributed primarily to the fact that the compression is starting at a relatively low pressure (compression of lower density
Page 32 of 41
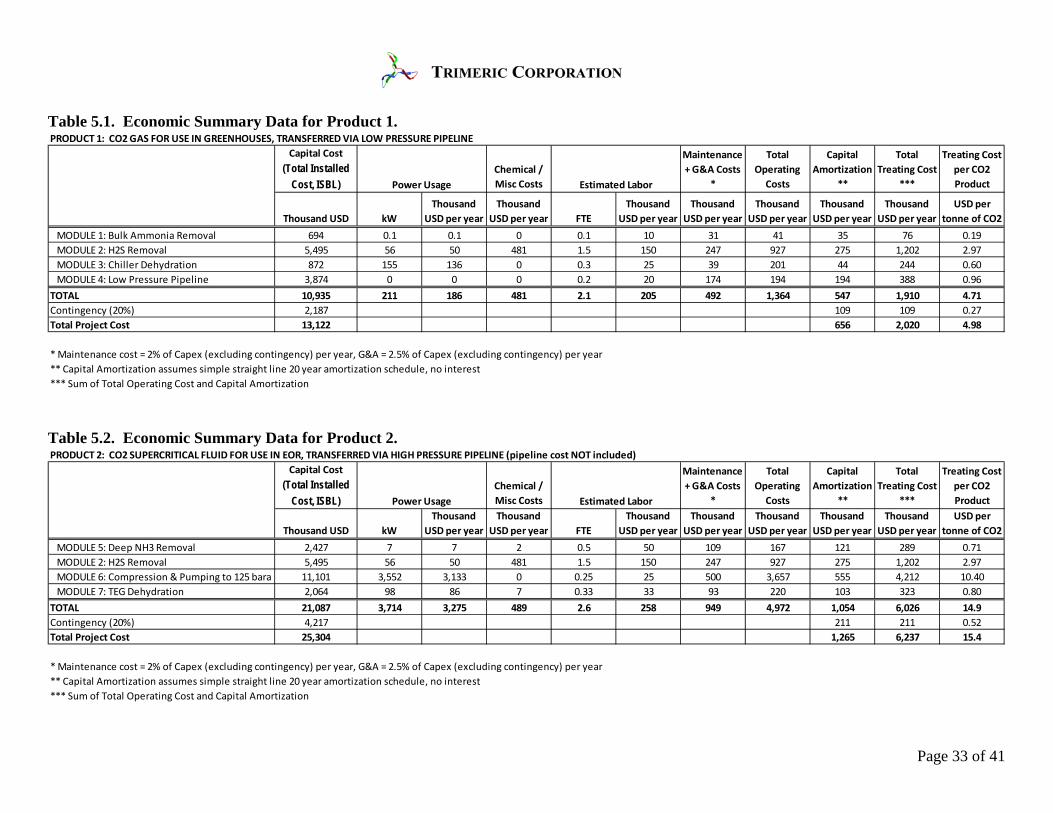
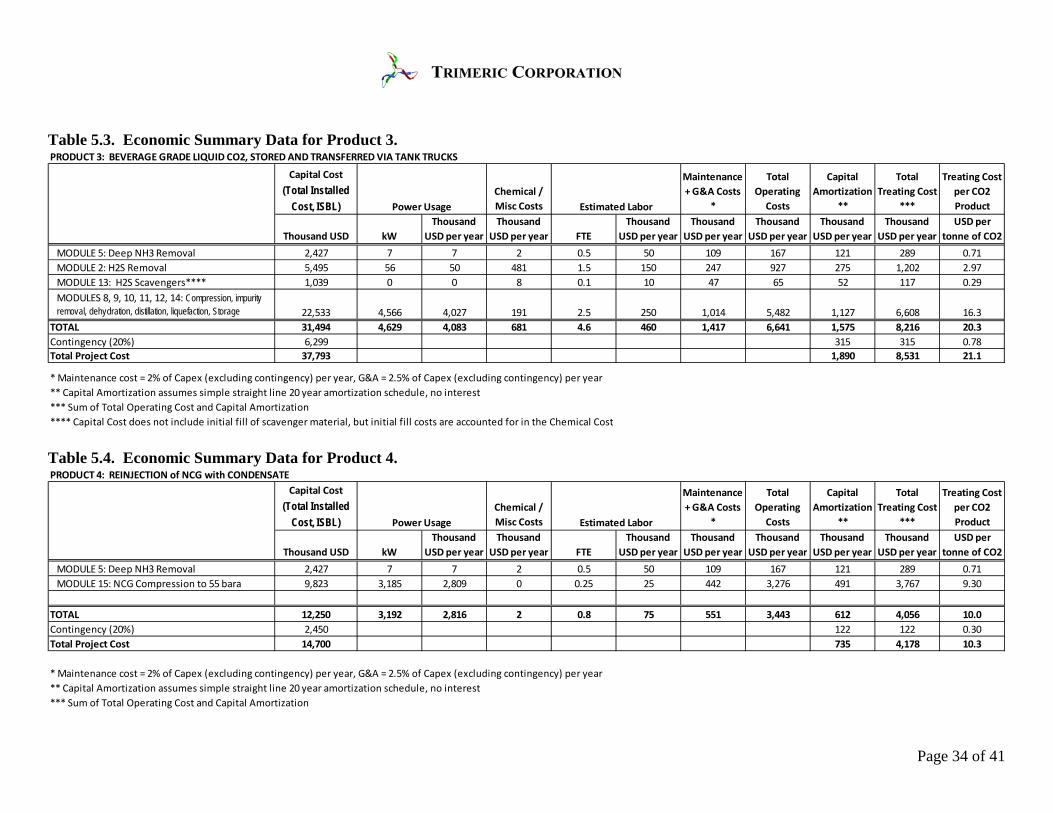
gas is typically more expensive compared to starting with higher density gas). The major operating cost for the CO2 compression is electric power. The power requirements were estimated using process simulations in WinSim DESIGN II. 5.7 Economic Summary Tables 5.1, 5.2, 5.3, and 5.4 show the economic parameters for the products. The costs for individual modules, or groups of modules, are shown separately. The capital cost for the individual modules does not include the contingency factor. The contingency factor is only applied to the sum of the module costs. The products have markedly different costs, as might be expected due to the purity and physical states that are required for the products. Total estimated ISBL project costs for the less expensive products – greenhouse gas (including a 5 km pipeline) and NCG reinjection – are $13.1 million and $14.7 million, respectively. The more expensive cases – EOR (for which pipeline costs are not included) and beverage grade liquid CO2 product – have estimated total ISBL project costs of $25.3 million and $37.8 million, respectively. Major process operating costs (electrical power, chemicals) for the greenhouse case is much lower than the other cases: only $667 thousand per year versus $2,817, $3,765, and $4,764 thousand per year for the reinjection, EOR, and the beverage grade cases, respectively. Much of the operating costs are due to electricity usage for compression. If labor costs, maintenance and G&A, and capital amortization are added to the estimated electrical power and chemical costs, a “total treating cost” can be estimated. The total treating cost refers to the cost to recover the CO2 per tonne of the product. This number is of use in the evaluation of the feasibility of manufacturing the product, because this total treating cost can be compared directly to the potential sales value of the product. The total treating costs are estimated to be $4.98, $10.3, $15.4, and $21.1 per tonne of CO2 recovered for the greenhouse, reinjection, EOR, and beverage grade cases, respectively.
Page 33 of 41
Table 5.1. Economic Summary Data for Product 1.
Table 5.2. Economic Summary Data for Product 2.
PRODUCT 1: CO2 GAS FOR USE IN GREENHOUSES, TRANSFERRED VIA LOW PRESSURE PIPELINECapital Cost
(Total Installed Cost, ISBL)
Chemical / Misc Costs
Maintenance + G&A Costs
*
Total Operating
Costs
Capital Amortization
**
Total Treating Cost
***
Treating Cost per CO2 Product
Thousand USD kWThousand
USD per yearThousand
USD per year FTEThousand
USD per yearThousand
USD per yearThousand
USD per yearThousand
USD per yearThousand
USD per yearUSD per
tonne of CO2 MODULE 1: Bulk Ammonia Removal 694 0.1 0.1 0 0.1 10 31 41 35 76 0.19 MODULE 2: H2S Removal 5,495 56 50 481 1.5 150 247 927 275 1,202 2.97 MODULE 3: Chiller Dehydration 872 155 136 0 0.3 25 39 201 44 244 0.60 MODULE 4: Low Pressure Pipeline 3,874 0 0 0 0.2 20 174 194 194 388 0.96TOTAL 10,935 211 186 481 2.1 205 492 1,364 547 1,910 4.71Contingency (20%) 2,187 109 109 0.27Total Project Cost 13,122 656 2,020 4.98
* Maintenance cost = 2% of Capex (excluding contingency) per year, G&A = 2.5% of Capex (excluding contingency) per year** Capital Amortization assumes simple straight line 20 year amortization schedule, no interest*** Sum of Total Operating Cost and Capital Amortization
Power Usage Estimated Labor
PRODUCT 2: CO2 SUPERCRITICAL FLUID FOR USE IN EOR, TRANSFERRED VIA HIGH PRESSURE PIPELINE (pipeline cost NOT included)Capital Cost
(Total Installed Cost, ISBL)
Chemical / Misc Costs
Maintenance + G&A Costs
*
Total Operating
Costs
Capital Amortization
**
Total Treating Cost
***
Treating Cost per CO2 Product
Thousand USD kWThousand
USD per yearThousand
USD per year FTEThousand
USD per yearThousand
USD per yearThousand
USD per yearThousand
USD per yearThousand
USD per yearUSD per
tonne of CO2 MODULE 5: Deep NH3 Removal 2,427 7 7 2 0.5 50 109 167 121 289 0.71 MODULE 2: H2S Removal 5,495 56 50 481 1.5 150 247 927 275 1,202 2.97 MODULE 6: Compression & Pumping to 125 bara 11,101 3,552 3,133 0 0.25 25 500 3,657 555 4,212 10.40 MODULE 7: TEG Dehydration 2,064 98 86 7 0.33 33 93 220 103 323 0.80TOTAL 21,087 3,714 3,275 489 2.6 258 949 4,972 1,054 6,026 14.9Contingency (20%) 4,217 211 211 0.52Total Project Cost 25,304 1,265 6,237 15.4
* Maintenance cost = 2% of Capex (excluding contingency) per year, G&A = 2.5% of Capex (excluding contingency) per year** Capital Amortization assumes simple straight line 20 year amortization schedule, no interest*** Sum of Total Operating Cost and Capital Amortization
Power Usage Estimated Labor
Page 34 of 41
Table 5.3. Economic Summary Data for Product 3.
Table 5.4. Economic Summary Data for Product 4.
PRODUCT 3: BEVERAGE GRADE LIQUID CO2, STORED AND TRANSFERRED VIA TANK TRUCKS
Capital Cost (Total Installed
Cost, ISBL) Chemical / Misc Costs
Maintenance + G&A Costs
*
Total Operating
Costs
Capital Amortization
**
Total Treating Cost
***
Treating Cost per CO2 Product
Thousand USD kWThousand
USD per yearThousand
USD per year FTEThousand
USD per yearThousand
USD per yearThousand
USD per yearThousand
USD per yearThousand
USD per yearUSD per
tonne of CO2 MODULE 5: Deep NH3 Removal 2,427 7 7 2 0.5 50 109 167 121 289 0.71 MODULE 2: H2S Removal 5,495 56 50 481 1.5 150 247 927 275 1,202 2.97 MODULE 13: H2S Scavengers**** 1,039 0 0 8 0.1 10 47 65 52 117 0.29
MODULES 8, 9, 10, 11, 12, 14: Compression, impurity removal, dehydration, distillation, liquefaction, Storage 22,533 4,566 4,027 191 2.5 250 1,014 5,482 1,127 6,608 16.3
TOTAL 31,494 4,629 4,083 681 4.6 460 1,417 6,641 1,575 8,216 20.3Contingency (20%) 6,299 315 315 0.78Total Project Cost 37,793 1,890 8,531 21.1
* Maintenance cost = 2% of Capex (excluding contingency) per year, G&A = 2.5% of Capex (excluding contingency) per year** Capital Amortization assumes simple straight line 20 year amortization schedule, no interest*** Sum of Total Operating Cost and Capital Amortization**** Capital Cost does not include initial fill of scavenger material, but initial fill costs are accounted for in the Chemical Cost
Power Usage Estimated Labor
PRODUCT 4: REINJECTION of NCG with CONDENSATECapital Cost
(Total Installed Cost, ISBL)
Chemical / Misc Costs
Maintenance + G&A Costs
*
Total Operating
Costs
Capital Amortization
**
Total Treating Cost
***
Treating Cost per CO2 Product
Thousand USD kWThousand
USD per yearThousand
USD per year FTEThousand
USD per yearThousand
USD per yearThousand
USD per yearThousand
USD per yearThousand
USD per yearUSD per
tonne of CO2 MODULE 5: Deep NH3 Removal 2,427 7 7 2 0.5 50 109 167 121 289 0.71 MODULE 15: NCG Compression to 55 bara 9,823 3,185 2,809 0 0.25 25 442 3,276 491 3,767 9.30
TOTAL 12,250 3,192 2,816 2 0.8 75 551 3,443 612 4,056 10.0Contingency (20%) 2,450 122 122 0.30Total Project Cost 14,700 735 4,178 10.3
* Maintenance cost = 2% of Capex (excluding contingency) per year, G&A = 2.5% of Capex (excluding contingency) per year** Capital Amortization assumes simple straight line 20 year amortization schedule, no interest*** Sum of Total Operating Cost and Capital Amortization
Power Usage Estimated Labor
Page 35 of 41
6 Removal of Other Impurities The NCG composition discussed in Section 3 is taken from the Design Basis for this project. However, during discussion of this Design Basis, Trimeric brought up some other impurities – mercury (Hg), carbonyl sulfide (COS), and ethane (C2H6) – that are sometimes present in geothermal NCG and can require special removal technologies (assuming that their removal is required for the desired product). This list of three components is not intended to be a complete list of all significant impurities that could be found in NCG that may require special removal technologies; these three components represent examples that Trimeric is aware of from recent experience. A summary of possible removal technologies for these three components, and the associated costs, are given in the following three subsections. After that, the impact on the recovery cost for the four products is discussed. 6.1 Mercury Mercury removal from NCG may be required because mercury may be considered a pollutant and/or a health hazard. Mercury removal could potentially be required for two of the CO2 products considered in this study: gas for use in greenhouses (Product 1) and liquefied beverage grade (Product 3), because of the potential safety/health risk. Mercury, when it is present in geothermal NCG to any measureable extent, would typically be at very low concentrations: in the parts per billion range. When mercury must be removed from NCG, it is commonly done by adsorption. Activated carbon that has been treated with sulfur (e.g., Calgon HGR) is one of the adsorbents that can be used to remove mercury from gas streams down to very low levels (e.g., <0.01 μg/Nm3). After being adsorbed onto the solid surface, the mercury reacts with sulfur to produce mercuric sulfide, which is retained on the carbon. Occasional replacements of the adsorbent media are required. 6.1.1 Mercury Removal Economic Parameters For the removal of mercury, the main capital cost will be for the adsorption bed vessels. Trimeric used rule-of-thumb design bases (50 ft/min velocity, residence time of 10 sec) for this type of adsorption bed to estimate the size of the adsorption vessels, yielding a vessel size of 10 ft diameter x 10 ft height. The system design included two adsorption beds (2 x 100% capacity). The installed capital cost for the vessels is estimated to be $528 thousand. The adsorbent fill cost for the two vessels is estimated to be $160 thousand (this cost is not included in the capital cost, but is instead included in the economic analysis as an operating cost), with the adsorbent lifetime of two or more years likely. Based on an assumed two year adsorbent lifetime, the cost for adsorbent replacement would be $40 thousand per year; this annual cost is included as an operating cost.
Page 36 of 41
6.2 Carbonyl Sulfide Carbonyl sulfide is sometimes found (usually at ppm levels) in natural gas and geothermal NCG, particularly when significant amounts of both H2S and CO2 are present. For this estimate we assumed that 5 ppm (molar) of COS or less was present in the NCG, and it would have to be removed to 0.1 ppm or less. For the four products that this study considers, COS removal would probably only be required for the liquefied beverage grade product. COS can be removed from a gas stream via catalytic hydrolysis to CO2 and H2S (Udengaard & Berzins, 1985). The reaction would be carried out in a fixed-bed reactor vessel containing a catalyst such as Puraspec® 2312. In the beverage grade CO2 production process, the hydrolysis reactor would be placed downstream of the compressors (Module 8); the compression after-cooler design would probably be modified to allow the gas to be fed to the reactor at the appropriate temperature. The hydrolysis reaction would result in the product of small amounts of H2S and CO2. The H2S would be removed in the downstream H2S scavenger beds (Module 13). 6.2.1 Carbonyl Sulfide Removal Economic Parameters The primary capital cost for COS removal are the vessels (typically 2) to contain the catalyst. No other major equipment should be required. The installed capital cost is estimated to be $310 thousand; this does not include an initial catalyst charge ($270 thousand). The catalyst is estimated to have a ten-year life, so an annual catalyst cost of $27 thousand is included as an operating cost. 6.3 Ethane Ethane may be found in NCG at some locations, and if present at significant concentrations it may need to be removed via a separate technology, particularly for the production of liquefied beverage grade CO2. For this estimate, it was assumed that roughly 100 to 200 ppm (molar) of ethane or less was present in the NCG. For the four products that this study considers, ethane removal would be required for the liquefied beverage grade product, but probably not for the other products. One technology that can be used to remove ethane from gases similar to this NCG stream is catalytic oxidation (catox), and this technology was the basis for ethane removal in this study. In this process scheme, the catox process would be placed after the carbon beds (Module 10) and before the dehydration (Module 11). The catox is a high temperature (roughly 950 °F) oxidation of ethane with oxygen, resulting in the production of water and CO2. Some methane will also be oxidized, although conditions would be set to minimize this side reaction. In order to avoid the addition of excessive amounts of nitrogen, etc., liquid oxygen is used as the oxygen source rather than air. Most of the feed preheat to the reactor is done using cross-exchange with the product gas, but an electric heater is required to provide some of the heat.
Page 37 of 41
6.3.1 Ethane Removal Economic Parameters The ethane process would consist primarily of gas feed/product cross-exchangers, a feed trim heater (electric), and a fixed catalyst bed. A platinum-based catalyst would likely be used, and is assumed to have a 10-year life. A source of liquid O2 is required for this process, and it is assumed that truck delivery of O2 would be consistent with the demand of about 0.85 ton/day; the oxygen requirement can be affected by the amount of ethane present in the feed gas. No capital cost is included for O2 storage because O2 supply companies often provide the storage tanks for long-term supply contracts of this size. The electric heater size and power draw are also a potential variable in this process. The concentration of ethane in the feed gas affects the power load of the heater: with more ethane present, the heat of oxidation results in a lower heater power load. The cost of power was based on an estimated 150 kW power requirement for the heater. The total installed capital cost for the catox system is estimated to be $3,525 thousand, which does not include the initial catalyst charge ($500 thousand). Major process operating costs include power ($132 thousand/year), catalyst replacement ($50 thousand/year), and liquid oxygen ($60 thousand/year). 6.4 Impact of the Removal of Other Impurities on Product Recovery Economics The economic estimates for the recovery of the CO2 products provided in Section 5 do not include the costs of the removal of these three other impurities. Economic estimates were also made where the costs of the removal of these impurities were included; these additional costs are presented in this section. It is probably not a requirement that these three impurities, were they to be present in significant concentrations, would have to be removed from all of the products. Trimeric’s rational regarding the need to remove these impurities for each of the four products considered in this project is as follows: Product 1 - Greenhouse: Ethane and COS in the very small concentrations assumed in this study would probably not be significant if the gas to be diluted into greenhouse air. However, even very small amounts of mercury can be considered hazardous. Therefore, the cost of mercury removal was included for this product.
Product 2 - Enhanced Oil Recovery (EOR): None of the three impurities should have to be removed in order to produce this product.
Product 3 - Beverage Grade: Beverage grade specifications would require that all three impurities be removed from this product.
Product 4 – Reinjection of NCG for Carbon Capture Credits: None of the three impurities should have to be removed in order to produce this product. If these three impurities are present in the NCG at the levels discussed, only the economics of Product 1 and Product 3 will change meaningfully. Revised economic summary tables for these

Page 38 of 41
two products, which include the costs for removal of the additional impurities, are shown in Tables 6.1 and 6.2. The modified economics for Product 1 show that the addition of mercury removal has only a small impact on the overall capital cost and recovery cost of the CO2 for use in greenhouses. However, the need to remove mercury, COS, and ethane, if they are all present in the NCG, results in significant increased costs for Product 3 (Beverage grade CO2): an increase of about 13% in capital cost and about a 9% increase in the total treating cost of the CO2 product.

Page 39 of 41
TABLE 6.1. Economic Summary Data for Product 1, with the Removal of Mercury Also Required.
Table 6.2. Economic Summary Data for Product 3, with the Removal of Mercury, COS, and Ethane Also Required.
PRODUCT 1: CO2 GAS FOR USE IN GREENHOUSES, TRANSFERRED VIA LOW PRESSURE PIPELINE. CASE 1B: MERCURY REMOVAL INCLUDED.Capital Cost
(Total Installed Cost, ISBL)
Chemical / Misc Costs
Maintenance + G&A Costs
*
Total Operating
Costs
Capital Amortization
**
Total Treating Cost
***
Treating Cost per CO2 Product
Thousand USD kWThousand
USD per yearThousand
USD per year FTEThousand
USD per yearThousand
USD per yearThousand
USD per yearThousand
USD per yearThousand
USD per yearUSD per
tonne of CO2 MODULE 1: Bulk Ammonia Removal 694 0.1 0.1 0 0.1 10 31 41 35 76 0.19 MERCURY REMOVAL**** 528 0 0 40 0.1 10 24 74 26 100 0.25 MODULE 2: H2S Removal 5,495 56 50 481 1.5 150 247 927 275 1,202 2.97 MODULE 3: Chiller Dehydration 872 155 136 0 0.3 25 39 201 44 244 0.60 MODULE 4: Low Pressure Pipeline 3,874 0 0 0 0.2 20 174 194 194 388 0.96TOTAL 11,463 211 186 521 2.2 215 516 1,437 573 2,011 4.96Contingency (20%) 2,293 115 115 0.28Total Project Cost 13,755 688 2,125 5.24
* Maintenance cost = 2% of Capex (excluding contingency) per year, G&A = 2.5% of Capex (excluding contingency) per year** Capital Amortization assumes simple straight line 20 year amortization schedule, no interest*** Sum of Total Operating Cost and Capital Amortization**** Capital Cost does not include initial fill of scavenger material, but initial fill costs are accounted for in the Chemical Cost
Power Usage Estimated Labor
PRODUCT 3: BEVERAGE GRADE LIQUID CO2, STORED AND TRANSFERRED VIA TANK TRUCKS. CASE 3B: MERCURY, COS, ETHANE REMOVAL INCLUDED.
Capital Cost (Installed
Equipment, ISBL) Chemical / Misc Costs
Maintenance + G&A Costs
*
Total Operating
Costs
Capital Amortization
**
Total Treating Cost
***
Treating Cost per CO2 Product
Thousand USD kWThousand
USD per yearThousand
USD per year FTEThousand
USD per yearThousand
USD per yearThousand
USD per yearThousand
USD per yearThousand
USD per yearUSD per
tonne of CO2 MODULE 5: Deep NH3 Removal 2,427 7 7 2 0.5 50 109 167 121 289 0.71 MERCURY REMOVAL**** 528 0 0 40 0.1 10 24 74 26 100 0.25 COS REMOVAL**** 310 0 0 27 0.1 10 14 51 15 66 0.16 ETHANE REMOVAL**** 3,525 150 132 110 0.2 20 159 421 176 597 1.47 MODULE 2: H2S Removal 5,495 56 50 481 1.5 150 247 927 275 1,202 2.97 MODULE 13: H2S Scavengers**** 1,039 0 0 8 0.1 10 47 65 52 117 0.29
MODULES 8, 9, 10, 11, 12, 14: Compression, impurity removal, dehydration, distillation, liquefaction, Storage 22,533 4,566 4,027 191 2.5 250 1,014 5,482 1,127 6,608 16.3
TOTAL 35,858 4,779 4,215 858 5.0 500 1,614 7,187 1,793 8,979 22.2Contingency (20%) 7,172 359 359 0.88Total Project Cost 43,029 2,151 9,338 23.0
* Maintenance cost = 2% of Capex (excluding contingency) per year, G&A = 2.5% of Capex (excluding contingency) per year** Capital Amortization assumes simple straight line 20 year amortization schedule, no interest*** Sum of Total Operating Cost and Capital Amortization**** Capital Cost does not include initial fill of catalysts and adsorbents for Hg, COS, ethane removal, and H2S scavenging, but initial fill costs are accounted for in Chemical Costs
Power Usage Estimated Labor
Page 40 of 41
7 Literature Cited (2015). Oil & Gas Journal. March 2015. Carroll, J. (2010). Acid Gas Injection and Carbon Dioxide Sequestration. Salem, MA: Scrivener
Publishing. Compressed Gas Association, Inc. (2011). CGA G-6.2-2011. DiPippo, R. (2012). Geothermal Power Plants. Waltham, MA: Elsevier. Fisher, K., & McKaskle, R. (2006). Evaluation of CO2 Capture Options from Ethanol Plants.
Prepared for the Illinois State Geological Survey, Champaign, IL. http://trimeric.com/publications.html
Fisher, K., Lundeen, J., & Leppin, D. (1999). Fundamentals of H2S Scavenging for Treatment of
Natural GAs. 9th GRI Sulfur Recovery Conference. Gas Processors Suppliers Association. (2012). Engineering Data Book. Tulsa, OK: Gas
Processors Association. Kohl, A., & Nielsen, R. (1997). Gas Purification (5th ed.). Houston: Gulf Publishing. Mamrosh, D., McIntush, K., Beitler, C., Markusson, S., & Einarsson, K. (2012). Screening of
H2S Abatement Options for Geothermal Noncondensable Gas at Bjarnarflag. Geothermal Resources Council Annual Meeting. Reno, NV. http://trimeric.com/publications.html
Trimeric Corporation. (2015). CO2 Processing/Capture/Sequestration Service Capabilities.
Retrieved from http://trimeric.com/co2-processing.html (2015) Udengaard, N., & Berzins, V. (1985). Catalytic Conversion of COS for Gas Clean-Up. In S.
Newman, Acid and Sour Gas Treating Processes. Houston, TX: Gulf Publishing.

Page 41 of 41
Appendix 1. Design Basis Document
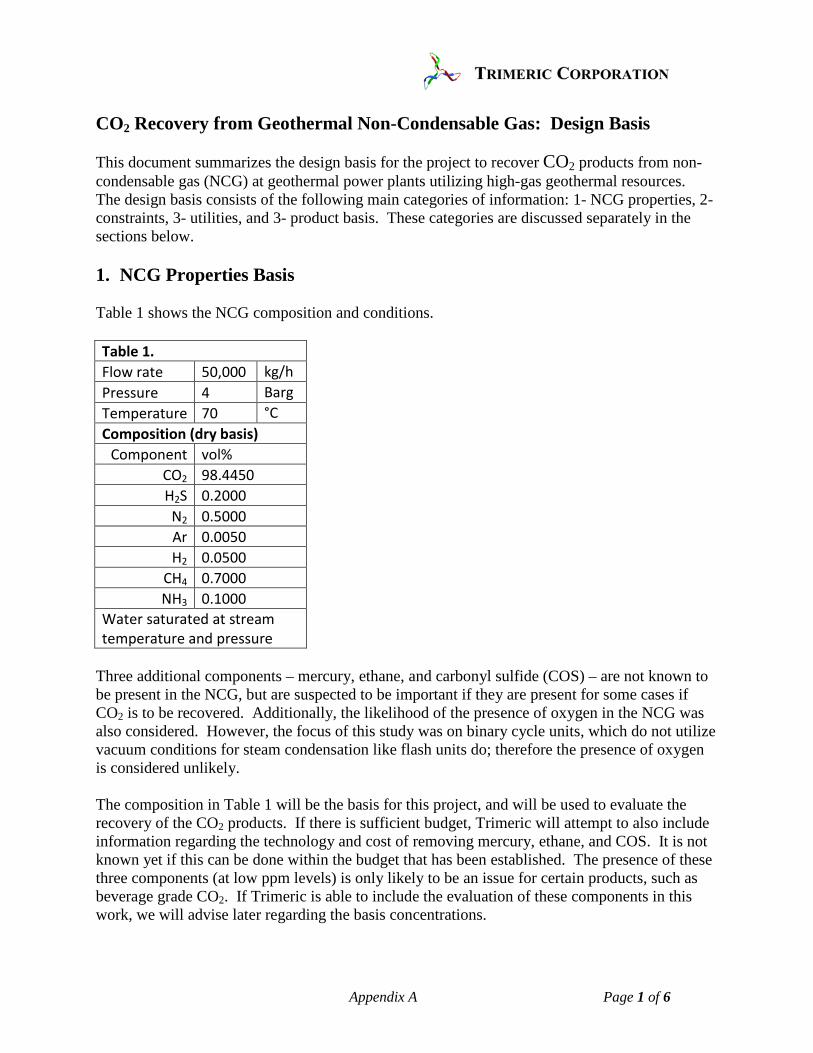
Appendix A Page 1 of 6
CO2 Recovery from Geothermal Non-Condensable Gas: Design Basis This document summarizes the design basis for the project to recover CO2 products from non-condensable gas (NCG) at geothermal power plants utilizing high-gas geothermal resources. The design basis consists of the following main categories of information: 1- NCG properties, 2- constraints, 3- utilities, and 3- product basis. These categories are discussed separately in the sections below. 1. NCG Properties Basis Table 1 shows the NCG composition and conditions. Table 1. Flow rate 50,000 kg/h Pressure 4 Barg Temperature 70 °C Composition (dry basis) Component vol%
CO2 98.4450 H2S 0.2000 N2 0.5000 Ar 0.0050 H2 0.0500
CH4 0.7000 NH3 0.1000
Water saturated at stream temperature and pressure
Three additional components – mercury, ethane, and carbonyl sulfide (COS) – are not known to be present in the NCG, but are suspected to be important if they are present for some cases if CO2 is to be recovered. Additionally, the likelihood of the presence of oxygen in the NCG was also considered. However, the focus of this study was on binary cycle units, which do not utilize vacuum conditions for steam condensation like flash units do; therefore the presence of oxygen is considered unlikely. The composition in Table 1 will be the basis for this project, and will be used to evaluate the recovery of the CO2 products. If there is sufficient budget, Trimeric will attempt to also include information regarding the technology and cost of removing mercury, ethane, and COS. It is not known yet if this can be done within the budget that has been established. The presence of these three components (at low ppm levels) is only likely to be an issue for certain products, such as beverage grade CO2. If Trimeric is able to include the evaluation of these components in this work, we will advise later regarding the basis concentrations.
Appendix A Page 2 of 6
2. Constraints The following significant constraints, which will be used in technology selection and cost estimation, were identified in the Trimeric Scope of Work document and during subsequent project discussions.
• H2S disposition: H2S removed from the NCG cannot be vented to the atmosphere, nor can it be burned and the SO2 vented to the atmosphere. Common acceptable disposition methods for the H2S for this project include subsurface reinjection, conversion of the H2S to elemental sulfur, or conversion of the H2S to an easy-to-dispose-of waste product, such as an aqueous salt solution.
• Technology selection: Only technologies that are currently known to be viable and
proven for this application will be considered; developmental technologies will be excluded. Trimeric will select a combination of technologies for each product that are considered to be viable and should meet the requirements; no detailed comparison of competing options will be done.
• Scope of estimates: The scope of the cost estimates will be confined to inside battery limits (ISBL) items only. This implies that the cost estimate data provided would just cover the actual processes used to recovery the CO2, including the cost of major equipment, and the cost of installing that major equipment (e.g., piping, electrical, instrumentation, foundations). Items that are considered outside of the gas treatment process (outside battery limits, OSBL) will be excluded from these estimates; common OSBL items associated with a new processing facility might include office and lab buildings, access roads, purchase or lease of land, and provision of utilities (e.g., electrical substation).
• Product specifications: Trimeric provided commonly-used specifications for CO2 products that World Bank Group is interested in including in this study, and this work is based on these specifications. It is possible that these specifications may not apply to the eventual uses of these products in some countries.
• Economic Basis: Costs will be provided based on typical USA equipment and construction costs. The time basis for costs will be defined in the report (likely to be 1st quarter 2014), and costs will be given in USD (unless World Bank Group wishes the costs to be converted to another currency).
2. Utilities We are to assume that a natural gas pipeline is not located at the CO2 recovery facility. While it may be economically feasible to provide natural gas pipeline service should it be essential to a specific process, Trimeric will focus on the use of electrical power when reasonable. Sufficient power will be assumed to be available at the unit cost of 0.105 USD/kWh. For small fuel requirements, it will probably be assumed that a liquid fuel such as propane would be provided at
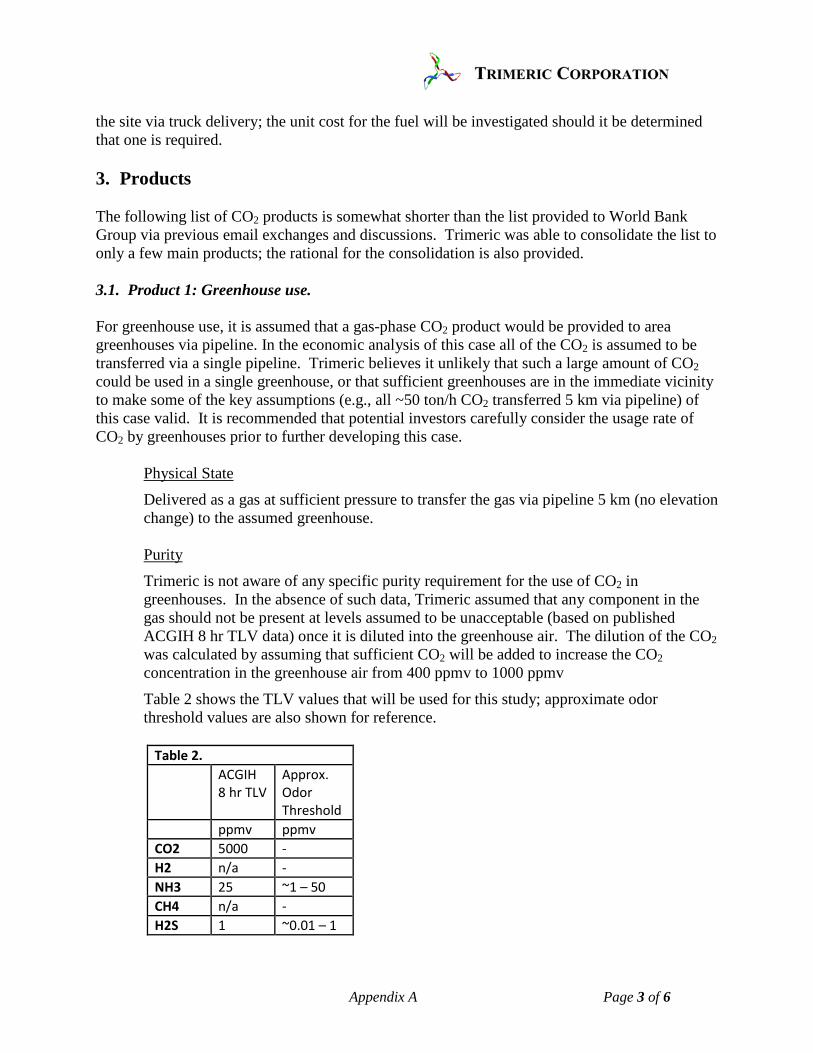
Appendix A Page 3 of 6
the site via truck delivery; the unit cost for the fuel will be investigated should it be determined that one is required. 3. Products The following list of CO2 products is somewhat shorter than the list provided to World Bank Group via previous email exchanges and discussions. Trimeric was able to consolidate the list to only a few main products; the rational for the consolidation is also provided. 3.1. Product 1: Greenhouse use. For greenhouse use, it is assumed that a gas-phase CO2 product would be provided to area greenhouses via pipeline. In the economic analysis of this case all of the CO2 is assumed to be transferred via a single pipeline. Trimeric believes it unlikely that such a large amount of CO2 could be used in a single greenhouse, or that sufficient greenhouses are in the immediate vicinity to make some of the key assumptions (e.g., all ~50 ton/h CO2 transferred 5 km via pipeline) of this case valid. It is recommended that potential investors carefully consider the usage rate of CO2 by greenhouses prior to further developing this case.
Physical State
Delivered as a gas at sufficient pressure to transfer the gas via pipeline 5 km (no elevation change) to the assumed greenhouse. Purity
Trimeric is not aware of any specific purity requirement for the use of CO2 in greenhouses. In the absence of such data, Trimeric assumed that any component in the gas should not be present at levels assumed to be unacceptable (based on published ACGIH 8 hr TLV data) once it is diluted into the greenhouse air. The dilution of the CO2 was calculated by assuming that sufficient CO2 will be added to increase the CO2 concentration in the greenhouse air from 400 ppmv to 1000 ppmv
Table 2 shows the TLV values that will be used for this study; approximate odor threshold values are also shown for reference.
Table 2. ACGIH
8 hr TLV Approx. Odor Threshold
ppmv ppmv CO2 5000 - H2 n/a - NH3 25 ~1 – 50 CH4 n/a - H2S 1 ~0.01 – 1
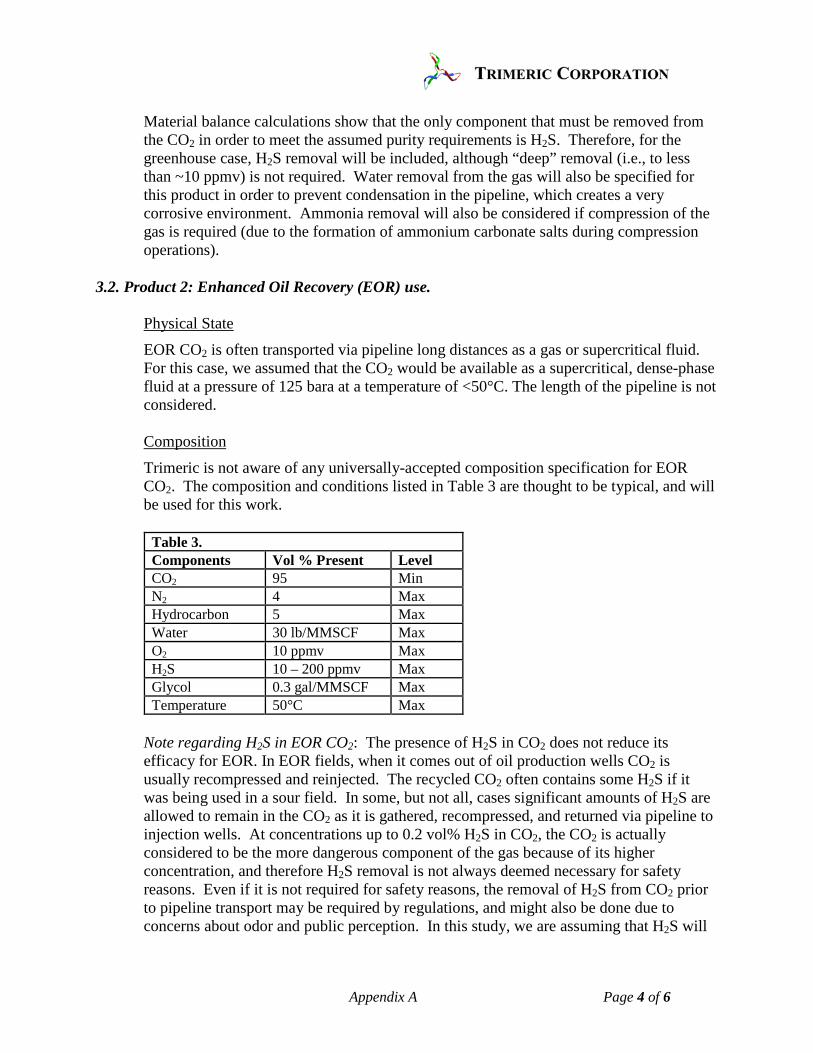
Appendix A Page 4 of 6
Material balance calculations show that the only component that must be removed from the CO2 in order to meet the assumed purity requirements is H2S. Therefore, for the greenhouse case, H2S removal will be included, although “deep” removal (i.e., to less than ~10 ppmv) is not required. Water removal from the gas will also be specified for this product in order to prevent condensation in the pipeline, which creates a very corrosive environment. Ammonia removal will also be considered if compression of the gas is required (due to the formation of ammonium carbonate salts during compression operations).
3.2. Product 2: Enhanced Oil Recovery (EOR) use.
Physical State
EOR CO2 is often transported via pipeline long distances as a gas or supercritical fluid. For this case, we assumed that the CO2 would be available as a supercritical, dense-phase fluid at a pressure of 125 bara at a temperature of <50°C. The length of the pipeline is not considered. Composition
Trimeric is not aware of any universally-accepted composition specification for EOR CO2. The composition and conditions listed in Table 3 are thought to be typical, and will be used for this work.
Table 3. Components Vol % Present Level CO2 95 Min N2 4 Max Hydrocarbon 5 Max Water 30 lb/MMSCF Max O2 10 ppmv Max H2S 10 – 200 ppmv Max Glycol 0.3 gal/MMSCF Max Temperature 50°C Max
Note regarding H2S in EOR CO2: The presence of H2S in CO2 does not reduce its efficacy for EOR. In EOR fields, when it comes out of oil production wells CO2 is usually recompressed and reinjected. The recycled CO2 often contains some H2S if it was being used in a sour field. In some, but not all, cases significant amounts of H2S are allowed to remain in the CO2 as it is gathered, recompressed, and returned via pipeline to injection wells. At concentrations up to 0.2 vol% H2S in CO2, the CO2 is actually considered to be the more dangerous component of the gas because of its higher concentration, and therefore H2S removal is not always deemed necessary for safety reasons. Even if it is not required for safety reasons, the removal of H2S from CO2 prior to pipeline transport may be required by regulations, and might also be done due to concerns about odor and public perception. In this study, we are assuming that H2S will
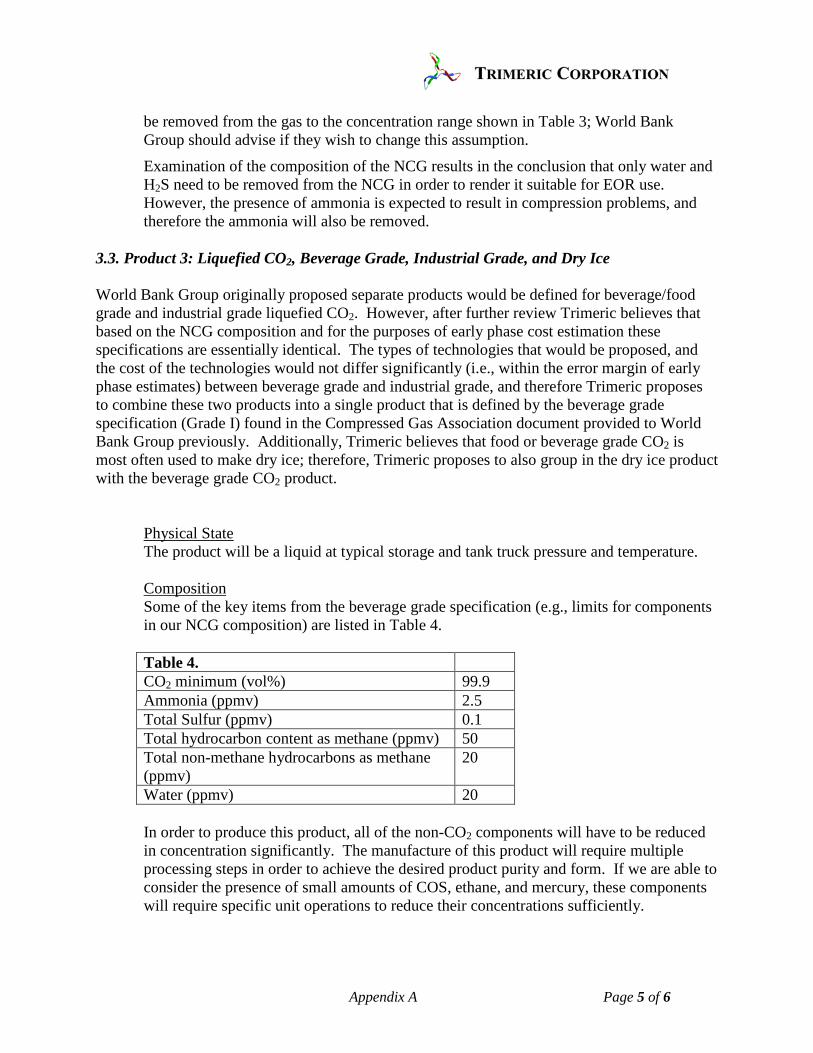
Appendix A Page 5 of 6
be removed from the gas to the concentration range shown in Table 3; World Bank Group should advise if they wish to change this assumption.
Examination of the composition of the NCG results in the conclusion that only water and H2S need to be removed from the NCG in order to render it suitable for EOR use. However, the presence of ammonia is expected to result in compression problems, and therefore the ammonia will also be removed.
3.3. Product 3: Liquefied CO2, Beverage Grade, Industrial Grade, and Dry Ice World Bank Group originally proposed separate products would be defined for beverage/food grade and industrial grade liquefied CO2. However, after further review Trimeric believes that based on the NCG composition and for the purposes of early phase cost estimation these specifications are essentially identical. The types of technologies that would be proposed, and the cost of the technologies would not differ significantly (i.e., within the error margin of early phase estimates) between beverage grade and industrial grade, and therefore Trimeric proposes to combine these two products into a single product that is defined by the beverage grade specification (Grade I) found in the Compressed Gas Association document provided to World Bank Group previously. Additionally, Trimeric believes that food or beverage grade CO2 is most often used to make dry ice; therefore, Trimeric proposes to also group in the dry ice product with the beverage grade CO2 product.
Physical State The product will be a liquid at typical storage and tank truck pressure and temperature.
Composition Some of the key items from the beverage grade specification (e.g., limits for components in our NCG composition) are listed in Table 4. Table 4. CO2 minimum (vol%) 99.9 Ammonia (ppmv) 2.5 Total Sulfur (ppmv) 0.1 Total hydrocarbon content as methane (ppmv) 50 Total non-methane hydrocarbons as methane (ppmv)
20
Water (ppmv) 20 In order to produce this product, all of the non-CO2 components will have to be reduced in concentration significantly. The manufacture of this product will require multiple processing steps in order to achieve the desired product purity and form. If we are able to consider the presence of small amounts of COS, ethane, and mercury, these components will require specific unit operations to reduce their concentrations sufficiently.

Appendix A Page 6 of 6
3.4. Product 4: Reinjection of NCG with Well Liquids Recently, Trimeric also proposed that World Bank Group consider re-injecting all of the NCG back into the reservoir with the condensate/brine currently being re-injected. Although this concept does not represent a “product”, it could result in the generation of value via carbon capture credits. World Bank Group considers this option to be the last in priority. Trimeric will only evaluate this option if sufficient budget is remaining, and does not yet know if that will be the case. Further development of this option will only be considered later in the project.