Embed Size (px)
Citation preview

Part-financed by
the European
Union
E-NAVIGATION UNDERWAY
INTERNATIONAL CONFERENCE ON E-NAVIGATION
Crown of Scandinavia
January 31 to February 2, 2011
The conference is jointly organized by the EfficienSea project and IALA and was supported by the Nautical Institute and
the International Association for Marine Electronics Companies
2
Index.
Under Keel Clearance Management - an element of e-navigation in Torres Strait ............................... 3
The EfficienSea e-Navigation approach Filling the gap... ....................................................................... 14
Portable Pilot Unit – a trendsetter for e- Navigation and an essential part of Vessel Traffic Management in Ports? .................................................................................................................................. 27
What can shore-side authorities bring to e-Navigation? ......................................................................... 29
High Speed Maritime Mesh Network System for e-Navigation ............................................................... 30
e-Navigation Testbeds in the United States - interagency cooperation in alignment with international efforts ...................................................................................................................................... 41
AIS+ - facilitating on board use of AIS Application-Specific Messages ................................................ 42
Testing of AIS Application-Specific Messages to Improve U.S. Coast Guard VTS Operations .......... 49
New opportunities with AIS information from satellite. Experience from the Norwegian AIS satellite project. ............................................................................................................................................. 59
e-Navigation Test Bed Development in Estonia ....................................................................................... 64
Test bed for evaluation of methods for decision support in collision avoidance ................................. 72
Making the Phantom Real: A Case of Applied Maritime Human Factors .............................................. 86
3
Under Keel Clearance Management - an element of e-navigation in Torres Strait
Mahesh Alimchandani
Master Mariner, MBA, AFRIN, MNI
Network Planning Manager and Nautical Adviser
Australian Maritime Safety Authority
E mail: [email protected]
Tel: + 61 2 6279 5927
Fax: + 61 2 6279 5002
Mobile: + 61 419 668 264
ABSTRACT
Under Keel Clearance Management (UKCM) systems are being increasingly adopted at ports, both as a means to enhance the safety of navigation and to increase the efficiency of shipping transportation.
Navigation in Torres Strait is very demanding due to limiting depths, narrow shipping lanes and numerous
reefs, coral cays and islands. Additionally, transiting ships can expect to encounter strong tidal streams and trade winds, complex tides and reduced visibility in the wet season.
The Australian Maritime Safety Authority (AMSA) has recently embarked on the implementation of a UKCM
system for Torres Strait. The UKCM system will be used to validate the existing safety margin for deep draught vessels transiting the region and the appropriateness of current draught limitations.
It is expected that the UKCM system will enhance the safety and efficiency of navigation which will help
protect the sensitive marine environment. It also has the potential to offer economic benefits to commercial shipping.
UKCM in Torres Strait is perhaps among the first few applications of UKCM being used in a coastal
navigation environment. The system will be an important element of the emerging concept of e-navigation.
The paper will describe the operational model for UKCM, as envisaged by AMSA. It will also describe the system‘s role in e-navigation and the business and utility services required of the system.
4
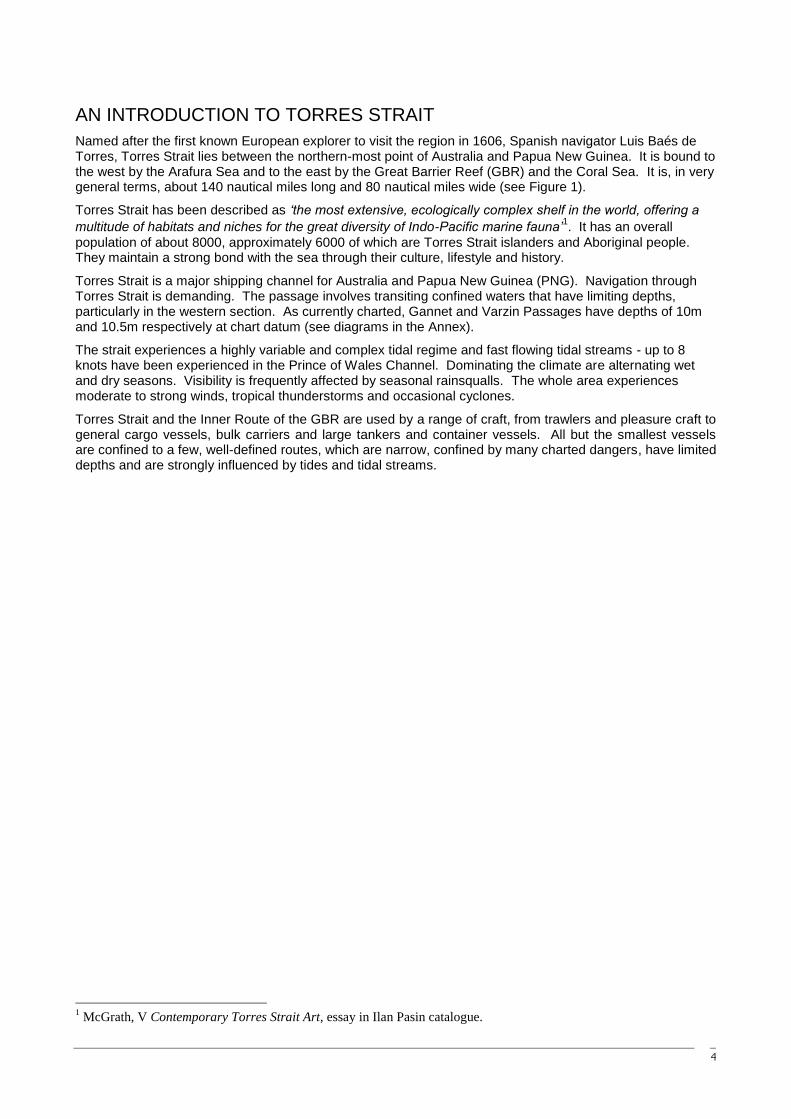
AN INTRODUCTION TO TORRES STRAIT
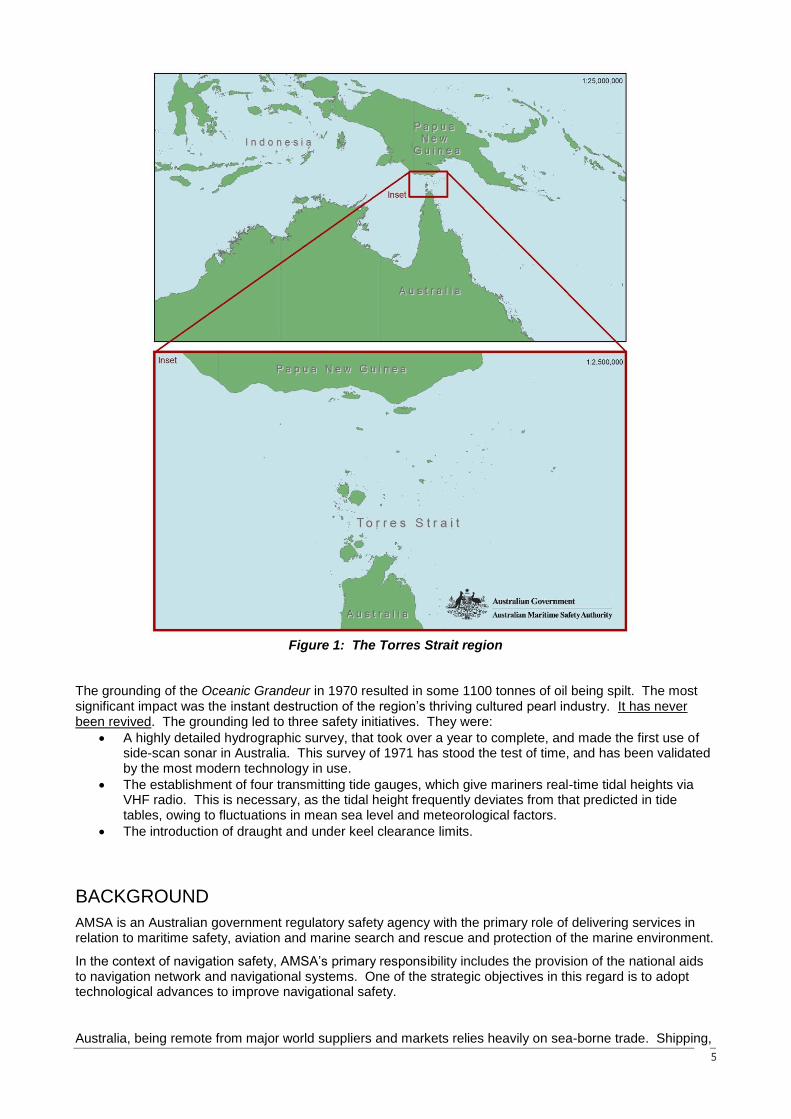
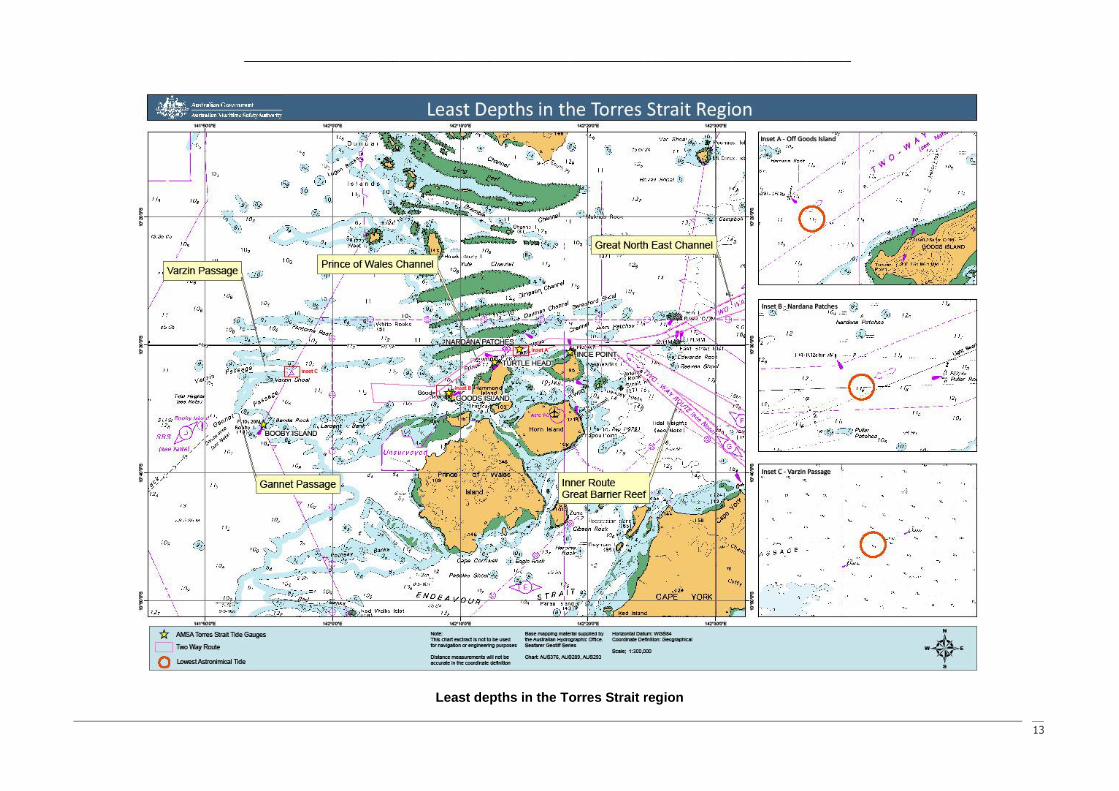
Named after the first known European explorer to visit the region in 1606, Spanish navigator Luis Baés de Torres, Torres Strait lies between the northern-most point of Australia and Papua New Guinea. It is bound to the west by the Arafura Sea and to the east by the Great Barrier Reef (GBR) and the Coral Sea. It is, in very general terms, about 140 nautical miles long and 80 nautical miles wide (see Figure 1).
Torres Strait has been described as ‗the most extensive, ecologically complex shelf in the world, offering a
multitude of habitats and niches for the great diversity of Indo-Pacific marine fauna‘1. It has an overall
population of about 8000, approximately 6000 of which are Torres Strait islanders and Aboriginal people. They maintain a strong bond with the sea through their culture, lifestyle and history.
Torres Strait is a major shipping channel for Australia and Papua New Guinea (PNG). Navigation through Torres Strait is demanding. The passage involves transiting confined waters that have limiting depths, particularly in the western section. As currently charted, Gannet and Varzin Passages have depths of 10m and 10.5m respectively at chart datum (see diagrams in the Annex).
The strait experiences a highly variable and complex tidal regime and fast flowing tidal streams - up to 8 knots have been experienced in the Prince of Wales Channel. Dominating the climate are alternating wet and dry seasons. Visibility is frequently affected by seasonal rainsqualls. The whole area experiences moderate to strong winds, tropical thunderstorms and occasional cyclones.
Torres Strait and the Inner Route of the GBR are used by a range of craft, from trawlers and pleasure craft to general cargo vessels, bulk carriers and large tankers and container vessels. All but the smallest vessels are confined to a few, well-defined routes, which are narrow, confined by many charted dangers, have limited depths and are strongly influenced by tides and tidal streams.
1 McGrath, V Contemporary Torres Strait Art, essay in Ilan Pasin catalogue.
5
Figure 1: The Torres Strait region
The grounding of the Oceanic Grandeur in 1970 resulted in some 1100 tonnes of oil being spilt. The most significant impact was the instant destruction of the region‘s thriving cultured pearl industry. It has never been revived. The grounding led to three safety initiatives. They were:
A highly detailed hydrographic survey, that took over a year to complete, and made the first use of side-scan sonar in Australia. This survey of 1971 has stood the test of time, and has been validated by the most modern technology in use.
The establishment of four transmitting tide gauges, which give mariners real-time tidal heights via VHF radio. This is necessary, as the tidal height frequently deviates from that predicted in tide tables, owing to fluctuations in mean sea level and meteorological factors.
The introduction of draught and under keel clearance limits.
BACKGROUND
AMSA is an Australian government regulatory safety agency with the primary role of delivering services in relation to maritime safety, aviation and marine search and rescue and protection of the marine environment.
In the context of navigation safety, AMSA‘s primary responsibility includes the provision of the national aids to navigation network and navigational systems. One of the strategic objectives in this regard is to adopt technological advances to improve navigational safety.
Australia, being remote from major world suppliers and markets relies heavily on sea-borne trade. Shipping,
6
which is among the most international of industries, is therefore extremely important to the Australian economy. Over 95% of Australia‘s trade by volume is carried by sea and a large proportion of this is in ships that transit Torres Strait and the GBR.
THE CASE FOR AN UNDER KEEL CLERANCE MANAGEMENT SYSTEM
BRIEF HISTORY
In recent years, vessel operators have requested AMSA to re-examine the prevailing draught limitation of 12.2m in Torres Strait. The general expectation from industry is that an under keel clearance management (UKCM) system will permit vessels with draughts greater than 12.2m to transit Torres Strait safely on certain days (bathymetric and met-ocean conditions permitting). An increase in the maximum permissible draught will offer significant economic benefits, resulting in a positive impact on the Australian economy.
AMSA had earlier deferred addressing the issue of draught restrictions, as there was low uptake of pilotage in Torres Strait. Also, it was recognised that new, highly accurate, modern hydrographic surveys would be required.
In 2006, AMSA commissioned a study on the implementation of a UKCM system for Torres Strait. The study found that an AMSA-managed UKCM system would provide the means to obtain a more accurate assessment of the margin of safety. It would also provide the basis for any future change (increase or decrease) to the current draught limitation of 12.2m, to maintain safety margins.
AMSA has considered alternative delivery methods for UKCM and consulted industry. In response to the recommendations of a review titled Delivery of Coastal Pilotage Services in the Great Barrier Reef and Torres Strait, Review Panel Report October 2008, AMSA decided that a single UKCM system for use in Torres Strait be selected through an open tender process.
Therefore, there will be one supplier of the system. AMSA has decided that the UKCM system will be used for the management of all transits of vessels whose draught is eight (8) metres or greater.
The selection process was completed in December 2009. OMC International Pty Ltd (OMC) has been selected as the preferred supplier for the provision of the UKCM system. OMC is a Melbourne-based UKCM service provider.
THE OBJECTIVES
AMSA recognises that the UKCM system will be an aid to navigation and an enabler for e-navigation. The system will provide vessels and their coastal pilots with tidal windows and transit plans using predicted, historic and real-time met-ocean inputs. The system will, in conjunction with AMSA‘s rules for maximum draughts and a minimum net UKC, assist a vessel to transit Torres Strait more safely and efficiently. Indeed, the UKCM system in Torres Strait will be a modern decision-making tool, one that will ‗join‘ ship and shore and create a ‗wide area decision support system‘. The objectives for introducing UKCM are to deliver enhanced safety and efficiency of navigation by:
validating the existing safety margin for deep draught vessels transiting the region; and
evaluating the appropriateness of the current draught regime.
OPERATIONAL OVERVIEW
AREA OF OPERATION
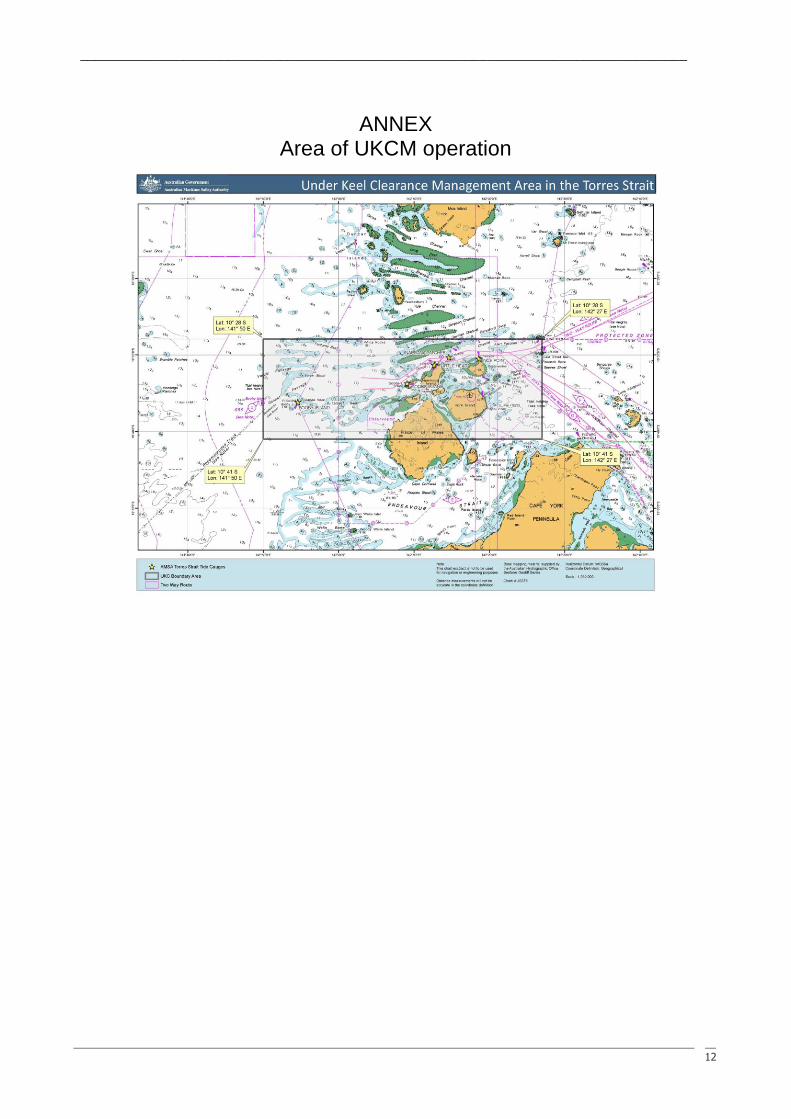
The UKCM area in Torres Strait is defined as the navigable channels between the longitudes of 141 degrees and 50 minutes East and 142 degrees and 27 minutes East (Figure 2 in the Annex).
AMSA will regulate UKCM in Torres Strait and manage the provision of the UKCM system. The UKCM system will provide a robust mechanism for pilotage providers ashore to generate, on demand, tidal windows and transit plans for a vessel intending to transit Torres Strait. The coastal pilots will use the UKCM system as a modern, e-navigation tool for conducting passages of deep draught vessels.
OPERATIONAL STAGES
It is envisaged that UKCM in Torres Strait will operate in three stages. These are outlined below:
7
Voyage Planning Stage: In this stage, authorised users will be able to conduct advance planning for the possible transit of a vessel by calculating the maximum draught and associated tidal windows (in conjunction with AMSA‘s rules for draught and net UKC). The UKCM system will make use of vessel particulars and predicted met-ocean inputs. Transit Planning Stage: In this stage, pilotage providers will be able to generate (and update), on demand, a tidal window and associated transit plans for an intended transit. The UKCM system will use predicted vessel motion and met-ocean inputs, but these will be refined using the latest real-time inputs available. UKCM Assisted Transit Stage: When transiting the area, the pilot will use a portable unit linked to the UKCM system ashore. This will allow the pilot to monitor the safety of the transit and make adjustments to the transit plan, as may be required, in real time.
Voyage Planning Stage
The UKCM system will provide a long term voyage planning capability, allowing the calculation of the maximum draught and associated tidal windows (in conjunction with AMSA‘s rules for draught and UKC
2), for
any given vessel and date.
The UKCM system will make use of predicted met-ocean conditions and vessel particulars. It will be used to explore ‗what if‘ scenarios and allow a ‗look ahead‘ of up to twelve months.
This capability may be used to assist in the making of decisions on the routeing of vessels through Torres Strait.
Transit Planning Stage
The transit planning stage commences once a ship manager/master notifies a pilotage provider of the intention to transit Torres Strait. The UKCM system will provide the capability to:
Enable a pilotage provider to generate tidal windows, transit plans and the minimum net UKC on demand;
Calculate predicted vessel motion and its effect on net UKC;
Automatically update the tidal windows and transit plans based on the latest met-ocean information available;
Electronically compare and highlight any changes to the tidal windows and transit plans for a given vessel;
Monitor a vessel‘s progress against its transit plan;
Validate a vessel‘s particulars against SHIPSYS (a controlled list of vessels that includes IMO number, name and call sign);
Automatically export the latest transit plan information electronically to REEFVTS; and
Allow multiple authorised users to view the transit plan of a vessel.
2 Marine Order Part 54 states that a pilot must not pilot a ship through the Prince of Wales Channel or the
Gannet and Varzin Passages unless the ship:
(a) has a draught that does not exceed 12.2 metres; and
(b) has a net minimum under keel clearance of:
(i) if the ship is in the Prince of Wales Channel and has a draught of less than 11.90
metres — 1.0 metre; or
(ii) if the ship is in the Prince of Wales Channel and has a draught of 11.90 metres or
greater — 10% of the draught of the ship; or
(iii) if the ship is in the Gannet and Varzin Passages — 1.0 metre.
8
UKCM Assisted Transit Stage
The UKCM assisted transit stage commences as a vessel enters the UKCM area and the pilot is on board. In this stage, a pilot can access the UKCM system, in real-time, to update the transit plan. The UKCM system will provide the capability to:
Automatically update the transit plan and net UKC at regular, predefined intervals, taking into account real-time met-ocean information, vessel‘s position and speed;
Enable the pilot to make adjustments to the transit plan using a PPU;
Ensure both the PPU and the UKCM system ashore are updated simultaneously when any changes are made to the transit plan;
Electronically compare and highlight any changes from the previous transit plan generated; and
Allow multiple authorised users to view the transit of the vessel through the UKCM area, to help monitor a pilots‘ adherence to the active transit plan.
This stage gives effect to some of the envisaged elements of e-navigation by facilitating safe navigation and integrating and presenting information on board and ashore to support decision-making.
ROLES AND RESPONSIBILITIES
Table 1 below is an outline of the roles and responsibilities of the key stakeholders.
Table 1: Roles and responsibilities of key stakeholders
Entity Role/Responsibility
Shipping company/agent Provide the required vessel particulars including hydrostatic details and ETA at the UKCM area to the pilot provider.
Master Provide the required final stability particulars prior to the pilot boarding/transiting the area.
Coastal Pilots/pilotage providers
Utilise the UKCM system. Manage tidal windows and transit plans.
AMSA Oversight the use of the UKCM system by coastal pilots and pilotage providers in accordance with Marine Order Part 54. Provide validated sensor data for use by the UKCM system. Provide pilotage provider/pilot access to the UKCM system.
UKCM provider Ensure contracted service is provided to AMSA including delivery to the specified performance and availability criteria.
REEFVTS3 Provide UKCM-related information, as part of the ongoing
delivery of an Information Service4, in a manner consistent with
IMO Assembly Resolution A (857) 20 Guidelines for Vessel Traffic Services.
The UKCM system aims to improve the reliability of decision making, by linking ship and shore systems, thereby dramatically reducing the risk of grounding. This objective is congruous with that of e-navigation.
OVERVIEW OF THE UKCM SYSTEM
INPUTS
The UKCM system will have access to a set of predictive, historic and real-time met-ocean input data from sensors maintained by AMSA in Torres Strait. This will be required to calculate voyage and transit plans. The input data for UKCM is summarised in Table 2 below:
3 The Coastal Vessel Traffic Service in the Great Barrier Reef and Torres Strait region.
4 An Information Service is a service to ensure that essential information becomes available in time for on-
board navigational decision making.
9
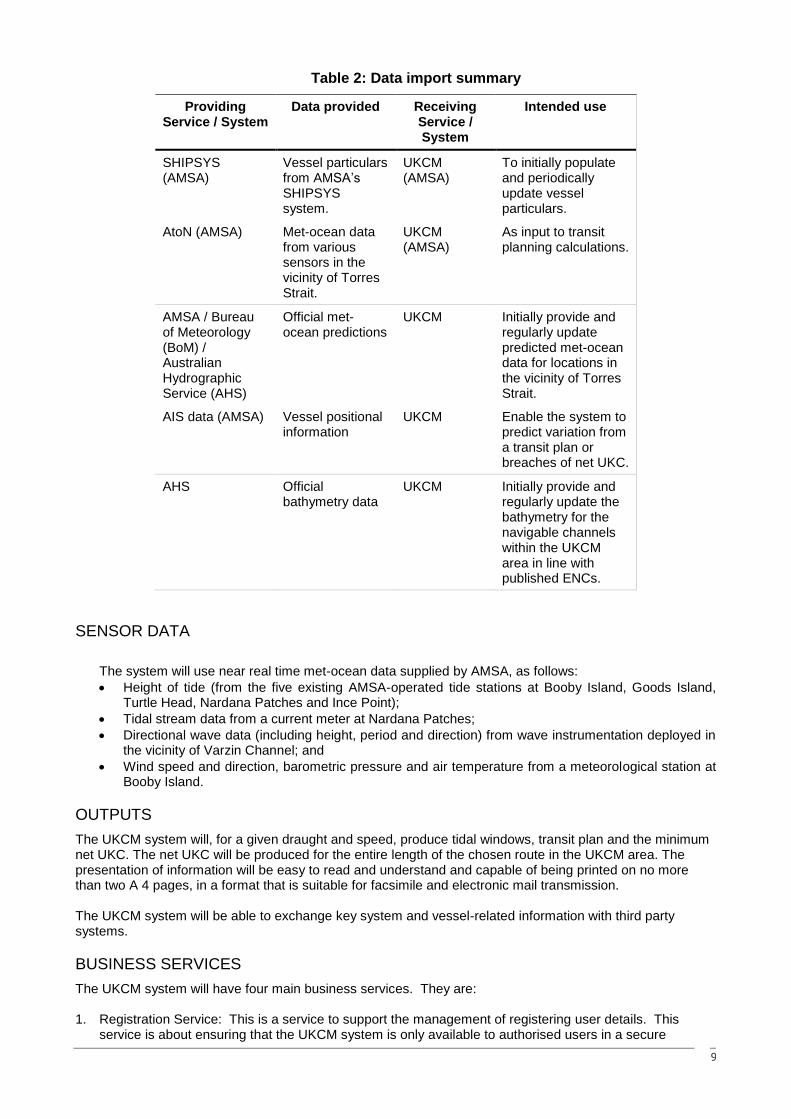
Table 2: Data import summary
Providing Service / System
Data provided Receiving Service / System
Intended use
SHIPSYS (AMSA)
Vessel particulars from AMSA‘s SHIPSYS system.
UKCM (AMSA)
To initially populate and periodically update vessel particulars.
AtoN (AMSA) Met-ocean data from various sensors in the vicinity of Torres Strait.
UKCM (AMSA)
As input to transit planning calculations.
AMSA / Bureau of Meteorology (BoM) / Australian Hydrographic Service (AHS)
Official met-ocean predictions
UKCM Initially provide and regularly update predicted met-ocean data for locations in the vicinity of Torres Strait.
AIS data (AMSA) Vessel positional information
UKCM Enable the system to predict variation from a transit plan or breaches of net UKC.
AHS Official bathymetry data
UKCM Initially provide and regularly update the bathymetry for the navigable channels within the UKCM area in line with published ENCs.
SENSOR DATA
The system will use near real time met-ocean data supplied by AMSA, as follows:
Height of tide (from the five existing AMSA-operated tide stations at Booby Island, Goods Island, Turtle Head, Nardana Patches and Ince Point);
Tidal stream data from a current meter at Nardana Patches;
Directional wave data (including height, period and direction) from wave instrumentation deployed in the vicinity of Varzin Channel; and
Wind speed and direction, barometric pressure and air temperature from a meteorological station at Booby Island.
OUTPUTS
The UKCM system will, for a given draught and speed, produce tidal windows, transit plan and the minimum net UKC. The net UKC will be produced for the entire length of the chosen route in the UKCM area. The presentation of information will be easy to read and understand and capable of being printed on no more than two A 4 pages, in a format that is suitable for facsimile and electronic mail transmission. The UKCM system will be able to exchange key system and vessel-related information with third party systems.
BUSINESS SERVICES
The UKCM system will have four main business services. They are: 1. Registration Service: This is a service to support the management of registering user details. This
service is about ensuring that the UKCM system is only available to authorised users in a secure
10
manner. 2. Vessel Service: A service to input and maintain vessel particulars. This service enables new vessel
particulars to be recorded in the system. Particulars for existing vessel‘s records can be sourced from other systems and maintained in the UKCM system.
3. Voyage Planning Service: A service to support the long term planning of transits through Torres Strait.
Voyage Planning Service allows ship operators to explore ‗what-if‘ scenarios and determine maximum safe draughts and associated tidal windows. It includes the determination of a maximum safe draught for a transit and tidal windows.
4. Transit Planning Service: A service to support the planning of transits through Torres Strait. It includes
determination of maximum draught for a transit, times at key waypoints (and speeds to make good those way points) and the resultant net UKC throughout the transit. The Transit Planning Service will ensure pilotage providers and coastal pilots have up-to-date information on the predicted minimum net UKC determined for a particular transit.
UTILITY SERVICES
A set of utility services will support the business services in the UKCM system. Data validation, business messages, system monitoring, system administration and reporting services are examples of some such services.
IMPLEMENTING THE UKCM SYSTEM
It is expected that the UKCM system in Torres Strait will be operational in early 2011. Implementing the system will involve a number of ‗sub-projects‘. In no particular order of importance, some of the major activities are:
VALIDATION OF THE UKCM SYSTEM
Initially, an independent third party will be contracted to validate the output of the operation of the UKCM
system. This will be required prior to trialling it on a range of transiting ships and finally declaring it
operational. Subsequently, independent validation will be required to be carried out on a periodic basis.
DEVELOPMENT OF STANDARD OPERATING PROCEDURES
Standard Operating Procedures or SOPs are being developed, so that shipmasters, pilots, the system provider and AMSA have a common understanding of the manner in which the system is to be used.
COMMUNICATIONS PLAN
A communication plan is being developed. This will aim to inform shipmasters, coastal pilots, pilotage providers, the shipping industry and other stakeholders about the UKCM system.
REVISION OF MARINE ORDER PART 54
AMSA will enforce the use of the single UKCM system by the coastal pilots and pilotage providers through Marine Order Part 54. Marine Orders are subordinate legislation created under the regulation making
powers of the Navigation Act 1912. In general, Marine Orders provide the specific or technical
requirements that are to be implemented or adhered to.
VALIDATION AND CALIBRATION OF AMSA‘S SENSORS
AMSA is instituting a regime to verify the accuracy of sensor data and periodically re-calibrate all sensors, independent of the contractor.
LIAISON WITH THE AUSTRALIAN HYDROGRAPHIC SERVICE
AMSA is working closely with the Australian Hydrographic Service (AHS), to ensure that high accuracy surveys required by the UKCM system are available.
11
CONCLUSION
The waters of Torres Strait are hazardous, particularly for deep-draught vessels under the command of those unfamiliar with the conditions in the region. The reliance of indigenous people upon its environment (and its vulnerability to pollution damage) makes Torres Strait an area of great concern, in the context of maritime and environmental safety. Over the years, Australia has put in place several measures with the twin objectives of enhancing the safety of navigation and protecting the marine environment in Torres Strait. The IMO strategy for the implementation of e-navigation highlights that there is a clear and compelling need to equip shipboard users and those ashore responsible for the safety of shipping with modern, proven tools that are optimised for good decision making in order to make maritime navigation and communication more reliable and user friendly. The overall goal is to improve safety of navigation and to reduce errors. A fully integrated, real-time under keel clearance management system is current generation technology and an important element of e-navigation, which will contribute measurably to the safety and efficiency of vessels transiting Torres Strait.
__________________________________________________________________________________
12
ANNEX Area of UKCM operation
__________________________________________________________________________________
13
Least depths in the Torres Strait region

14
The EfficienSea e-Navigation approach Filling the gap...
Mads Bentzen, Ole Borup and Thomas Christensen
[email protected], [email protected], [email protected] Danish Maritime Safety Administration
This paper describes the approach to e-Navigation taken by the EU co-funded project EfficienSea. The paper describes the overall aim, the strategy, the process
/ methodology, the implemented features and the preliminary results.
The EfficienSea project and the approach to e-Navigation
The EfficienSea project is co-funded by the EU Baltic Sea Regional Programme. There are 16 partners in the project of which the following participate in the work package on e-Navigation:
Danish Maritime Safety Administration; lead partner and leading e-Navigation work package
Swedish Maritime Administration
Swedish Transport Administration
SSPA Sweden
Chalmers University of Technology
Finnish Transport Agency
Helsinki University of Technology
Kymenlaakso University of Applied Sciences
Norwegian Coastal Administration
Estonian Maritime Administration
Maritime University of Szczecin
National Institute of Telecommunications
Gdynia Maritime University
Maritime Office in Gdynia
The aim of the e-Navigation work is twofold:
To prepare the participating organizations for the e-Navigation ―revolution‖
To undertake tasks that will support and benefit the overall e-Navigation process
The above aims are intended to be obtained by developing prototype e-Navigation services, establishing a test bed in the Baltic Sea region with test users and the necessary infrastructure and finally test the prototype services in the test bed. The prototype services will be revised during the tests based on the feedback from the users.
This approach will obviously assist the participating organizations in preparing for the e-Navigation ―revolution‖. This will include gaining knowledge of which areas of competences that will be needed, which technologies that it will be relevant to invest in and other aspects.
The tested services will be described in detail, including their portrayal, functionality and necessary infrastructure. It is the intension that this description will be submitted to the IMO as a contribution to the e-Navigation gap analysis that currently is being conducted, thus supporting the overall e-Navigation process and thereby fulfilling the second aim mentioned above.
15
Methods chosen / used
IMO has stated very firmly, that the identification of e-Navigation services must be user driven. It is our strong belief that a solely user driven approach is inadequate, as would be a solely engineer driven approach. The optimal approach involves users, engineers and man-machine interface specialists from the beginning of the project. The EffcienSea e-Navigation project methodology has been to identify possible e-Navigation services by means of different approaches:
- simulation sessions, in order to analyze how things are done today in the maritime environment. The simulation sessions included both ship and shore side users. Based on the simulations, areas needing improvement from future e-Navigation services were identified.
- workshops/focus groups with navigators, VTS Operators, Port Authorities, Pilots and other maritime experts.
- development of an interactive presentation (Mock-up) based on feedback and results from above sessions. The mock-up has been discussed in workshops with end users to mature ideas and describe services in detail.
The different services and functions will be tested in different ways to ensure correct and valuable results. The tests will be a mix of isolated tests where only one vessel is needed and coordinated tests with two or more participating vessels. Some of the tests will run for the entire test period (e.g. METOC and MSI) and others will be for shorter periods of time (e.g. Exchange of Intended Route and Route Suggestion). The tests will be performed primarily by vessels own crew, in some cases with additional members of the bridge team to carry out the individual test. The tests will be conducted in different environments depending on practicality and their nature. Some of the tests will be conducted in simulators or by some kind of simulation. Simulations are chosen for tests that are either safety critical or where simulations are deemed more suitable to obtain usable results. The IMO e-Navigation strategy implementation plan states that "the human factors and ergonomics should be core to the system design to ensure optimum integration including the Human Machine Interface (HMI), presentation and scope of information avoiding overload, assurance of integrity and adequate training‖. The EfficienSea e-Navigation project is taking a similar approach to development and tests and methodology described in the Japanese proposal for IMO sub-committee NAV56 - Usability assessment methodology for navigational equipment (NAV56/8/9) has been taken into consideration.
Services / functions chosen
During the brainstorming and simulation sessions with navigators and experts on navigation a large number of possible e-Navigation services and functionalities were identified. The EfficienSea e-Navigation project has developed a number of these services and will continue development of further services during the next year. The first services / functions developed are:
- METOC (Meteorological and Oceanographic data on route)
- Maritime Safety Information (MSI)
- Route Exchange
o Exchange of Intended Route
o Route Suggestion See description of each of these services below.
16
The development have included and the coming tests will include consideration of the six (6) basic ways to visually portray e-Navigation information (concluded by the IALA – e-Navigation Information Portrayal Working Group). These are:
1) alpha-numeric (e.g., text and numbers)
2) graphic (e.g., time-series graph)
3) point, line, or polygon (e.g., vector data)
4) symbol (or icon)
5) geo-spatial (e.g., map or chart)
6) image (photograph or film)
a) still (a photographic of a floating AtoN)
b) video (simulated voyage)
METOC (Meteorological and Oceanographic data on route)
The METOC service is divided into:
1) METOC forecasts and warnings, including Meteorological and Oceanographic data on route 2) METOC sensor information, including real time Meteorological and Oceanographic data from sensors
METOC forecasts and warnings
METOC forecasts and warnings include all meteorological and oceanographic information that can be forecasted, such as current, wind, waves, swell, sea level, seawater density, visibility, temperature, etc. The service is an alternative to weather forecasts and warnings broadcasted today via NAVTEX, coast radio stations, webpages, etc. The information is linked directly to the specific vessels position and planned route and is presented graphically on vessels navigation display. The general functionality of METOC forecast and warning service is as follows:
The vessel creates their route on the ECDIS and requests METOC data along this route. The request is transferred to a METOC application in the e-Navigation shore server. In the METOC application the forecast information, i.e. regular METOC forecast fields, are transformed into the requested information and is transmitted back to the vessel.
Presently, oceanographic forecasts for the Baltic Sea are produced four times a day. They reach 54 hours ahead counted from its epoch.
Following information is available at present:
VTS area – The Sound
- Current
- Water level
- Wind
- Waves
- Density
Confined waters
- Current
- Water level
- Wind
- Waves
- Density
Deep sea – entire Baltic Sea
- Wind
- Waves
The calculation method for the uncertainty estimate is yet to be decided.
17
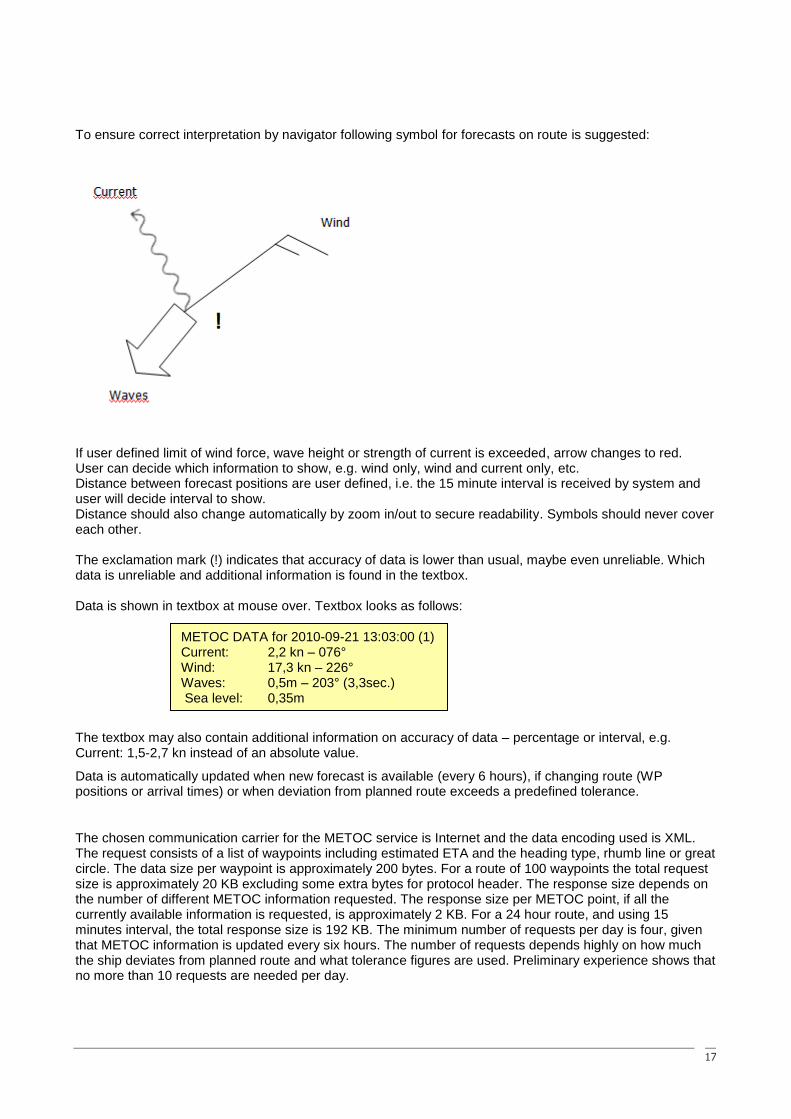
To ensure correct interpretation by navigator following symbol for forecasts on route is suggested:
If user defined limit of wind force, wave height or strength of current is exceeded, arrow changes to red. User can decide which information to show, e.g. wind only, wind and current only, etc. Distance between forecast positions are user defined, i.e. the 15 minute interval is received by system and user will decide interval to show. Distance should also change automatically by zoom in/out to secure readability. Symbols should never cover each other. The exclamation mark (!) indicates that accuracy of data is lower than usual, maybe even unreliable. Which data is unreliable and additional information is found in the textbox. Data is shown in textbox at mouse over. Textbox looks as follows:
The textbox may also contain additional information on accuracy of data – percentage or interval, e.g. Current: 1,5-2,7 kn instead of an absolute value.
Data is automatically updated when new forecast is available (every 6 hours), if changing route (WP positions or arrival times) or when deviation from planned route exceeds a predefined tolerance.
The chosen communication carrier for the METOC service is Internet and the data encoding used is XML. The request consists of a list of waypoints including estimated ETA and the heading type, rhumb line or great circle. The data size per waypoint is approximately 200 bytes. For a route of 100 waypoints the total request size is approximately 20 KB excluding some extra bytes for protocol header. The response size depends on the number of different METOC information requested. The response size per METOC point, if all the currently available information is requested, is approximately 2 KB. For a 24 hour route, and using 15 minutes interval, the total response size is 192 KB. The minimum number of requests per day is four, given that METOC information is updated every six hours. The number of requests depends highly on how much the ship deviates from planned route and what tolerance figures are used. Preliminary experience shows that no more than 10 requests are needed per day.
METOC DATA for 2010-09-21 13:03:00 (1) Current: 2,2 kn – 076° Wind: 17,3 kn – 226° Waves: 0,5m – 203° (3,3sec.) Sea level: 0,35m
18
Estimated data size up/down per day: 200 KB / 1920 KB
The data sizes are highly dependent on used routes, and the number of updates. The above estimate is considered to be quite worst case.
XML is not very efficient in regard to data size. In the used XML Schema, the data consists of approximately 70 percent markup. An alternative to XML could be a binary format. Preliminary results show that data sizes would be around 20 percent of the XML size. Another option is to compress the XML. Experiences with compression shows, that on average the request and response size are only 13 and 8 percent of the original, respectively. This gives the revised estimate.
Estimated data size up/down per day: 26 KB / 154 KB
METOC sensor information
Real time meteorological and oceanographic data from sensors are shown on navigation display. Available data from sensors are: wind speed and direction, current speed and direction, water level, water density and sea temperature. By introducing algorithms accurate current data will also be available on vessels route or anywhere else on request. The EfficienSea e-Navigation project have not yet introduced this service.
19
Maritime Safety Information (MSI)
Definition: Maritime Safety Information (MSI) – navigational and meteorological warnings, meteorological forecasts and other urgent safety-related messages. MSI is today promulgated in text or voice via SafetyNET, NAVTEX, coast radio stations and is often accessible on the internet. Several navigation equipment developers are working on systems taking existing messages from NAVTEX broadcasts and transferring them into geo-referenced warnings for presentation on navigation displays. There are several limitations in this approach and an alternative way to be considered are drafting and broadcasting warnings for geographical presentation from the beginning. Value is thereby added and additional information for presentation such as symbols and safe passing distances, together with information on precision and reliability may be given. According to the Joint IHO/IMO/WMO Manual on Maritime Safety Information (MSI), messages today should contain the following:
Preamble
- Message series identifier (e.g. Danish Navigational warning 247/10)
- General area (e.g. The Sound)
- Locality (e.g. Drogden)
- Chart number (e.g. Danish 133 (INT 1332)) May refer to an ENC, cell numbers may be quoted, e.g. ENC: US3AK7RM
Warning
- Key subject (description of hazard, warning text)
- Geographical position (DD-MM.mmmN DDD-MM.mmmE – number of decimals must be considered)
- Amplifying remarks (e.g. extra details to assist mariners in recognizing and assessing its effect on their navigation).
Postscript
- Cancellations details (date/time)
In addition the following information should be considered included in the messages:
- Position (3 decimals if precision allows) - Symbol to be used for presentation on chart display, - Attach file or picture - Precision of data - No-go area - Depth above hazard - Text message and additional information - Short text for ENC presentation - Vessel relevance - Area relevance
The chosen communication carrier for the MSI service is Internet and the data encoding used is XML. A request consists only of the index of the last received message. The request size is approximately 200 bytes, and using an update interval of 10 minutes, the total daily request data size is 30 KB. The size of the response depends on the amount of information in each MSI. Preliminary experience shows that each message is up to 2 KB. An empty response (no new messages) is approximately 200 bytes. Taking as example 20 MSI messages per day (including updates to existing messages), the daily response size is 70 KB. Experience shows that compressing the XML will limit request and response sizes to 20 and 15 percent, respectively. This gives Estimated data size up/down per day: 6 KB / 11 KB
20
MSI may in the future be broadcasted or transmitted via any available communication method; NAVTEX, satellite, GSM (mobile), VHF-data, AIS, etc. Presentation of MSI should use internationally agreed chart symbols to ease the navigator‘s interpretation. It should be possible to assess the information and possible danger by a single look at the screen. To avoid overload of information an intelligent filter must be introduced, i.e. MSI messages not relevant for a specific vessel should not be shown, e.g. messages far from vessels position and intended route, a wreck with a depth of 100 meters on board a vessel with a draught of 6 meters and a firing exercise on Tuesday when passing the area on Monday. Following way of presentation is used in the test phase:
Suggestion of how the MSI symbol might look like, here compared to the S-52 standard symbol ―new object‖.
Example 1.
Example 2.
Additional information can be seen by click on symbol or mouse-over.
IMO‘s identified User needs Reference to IMO NAV 55/WP.5 appendix table 3 C.
21
Screenshot of the EfficienSea ee-INS – METOC information and MSI messages.
Route exchange
The Route exchange concept may be divided into two:
1) Exchange of intended route - Vessels intended route is broadcasted/transmitted to other vessels and to shore authorities, e.g. VTS Centers.
2) Route suggestion - Vessels receive route suggestions from VTS Centers, SAR Authorities, etc.
Exchange of intended route
In some cases it can be valuable to see other ships intended routes (but being cautious to the fact that a ship might not necessarily follow its own planned route). Vessels Intended route is transmitted to other vessels and to shore based users. Other vessels‘ routes are shown on display if navigator wants the information or if system deems it necessary for the safe navigation of the vessel. The number of transmitted waypoints is determined by the technical solution (according to guidance document on AIS Application-Specific Messages SN.1/Circ.289, section 13, the maximum number of waypoints are 16 and information on leg speed and ETA are not included). Information on which steering mode vessel is operated in may be added (hand mode, autopilot heading, track-keeping etc). To avoid cluttering the screen in congested waters the exchange of intended route service should be turned off by default and the way to show other ships intended track would be to click on their AIS or radar target icons. All intended routes are shown if button Show all intended routes are activated (button in top menu).
22
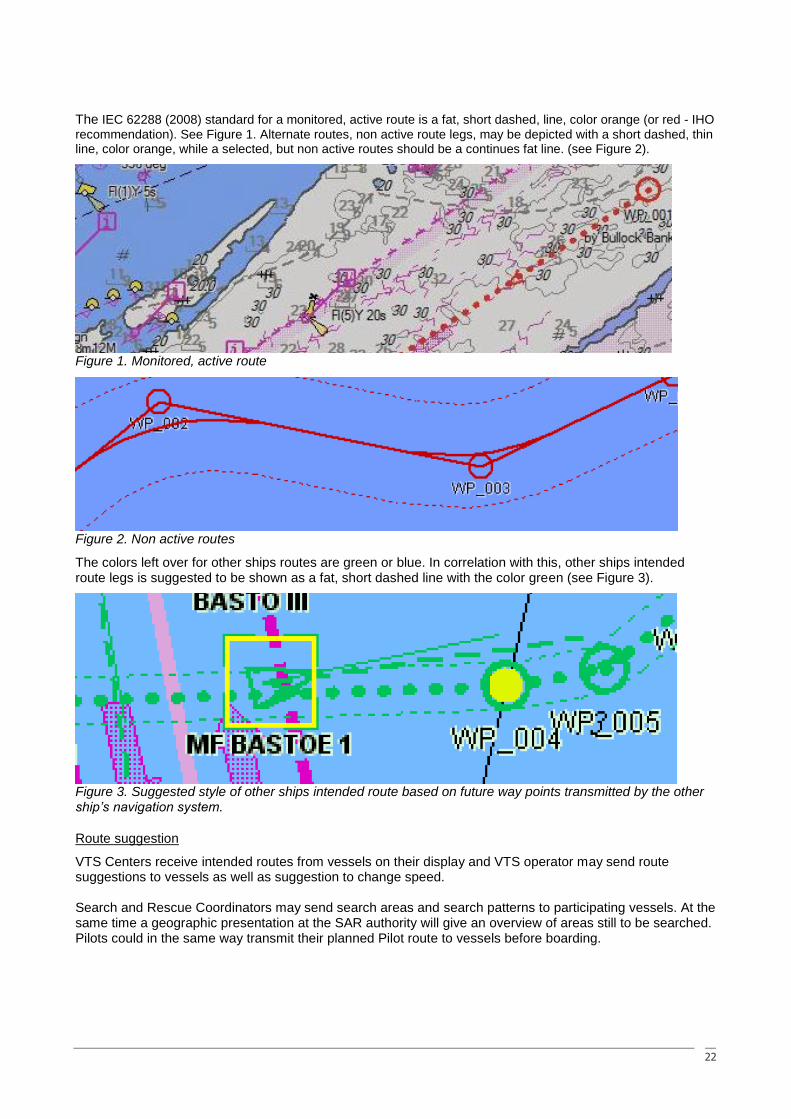
The IEC 62288 (2008) standard for a monitored, active route is a fat, short dashed, line, color orange (or red - IHO
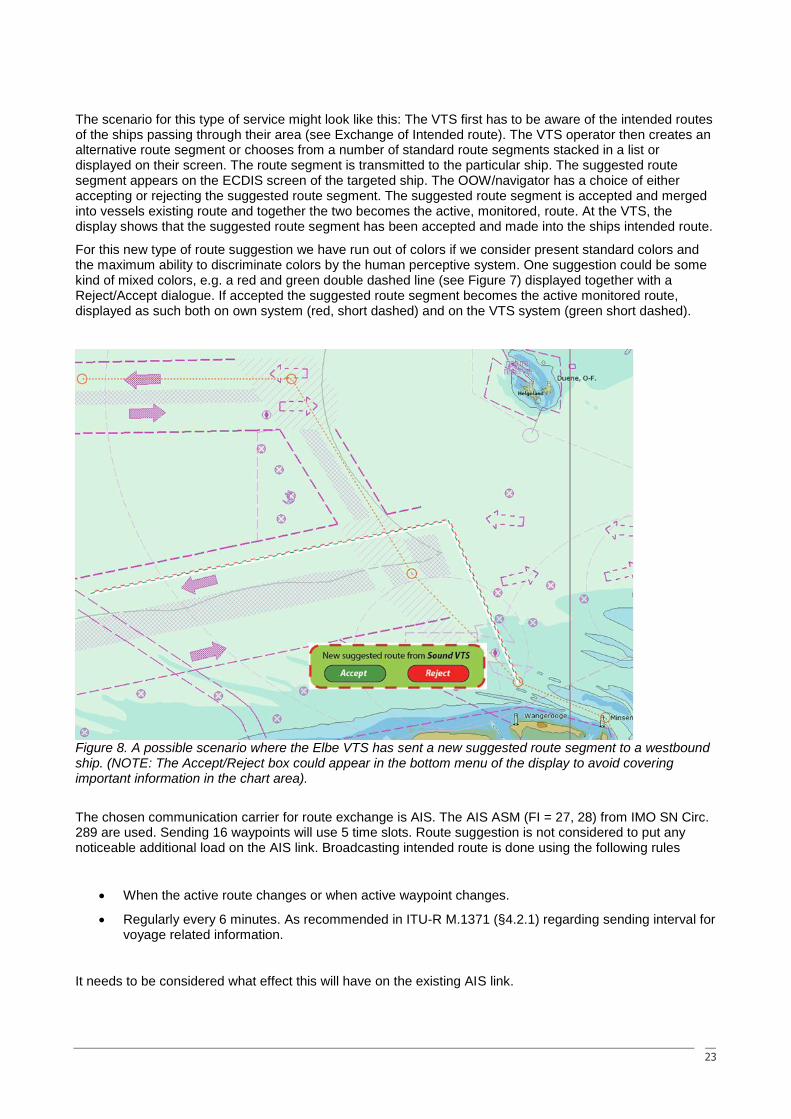
recommendation). See Figure 1. Alternate routes, non active route legs, may be depicted with a short dashed, thin line, color orange, while a selected, but non active routes should be a continues fat line. (see Figure 2).
Figure 1. Monitored, active route
Figure 2. Non active routes
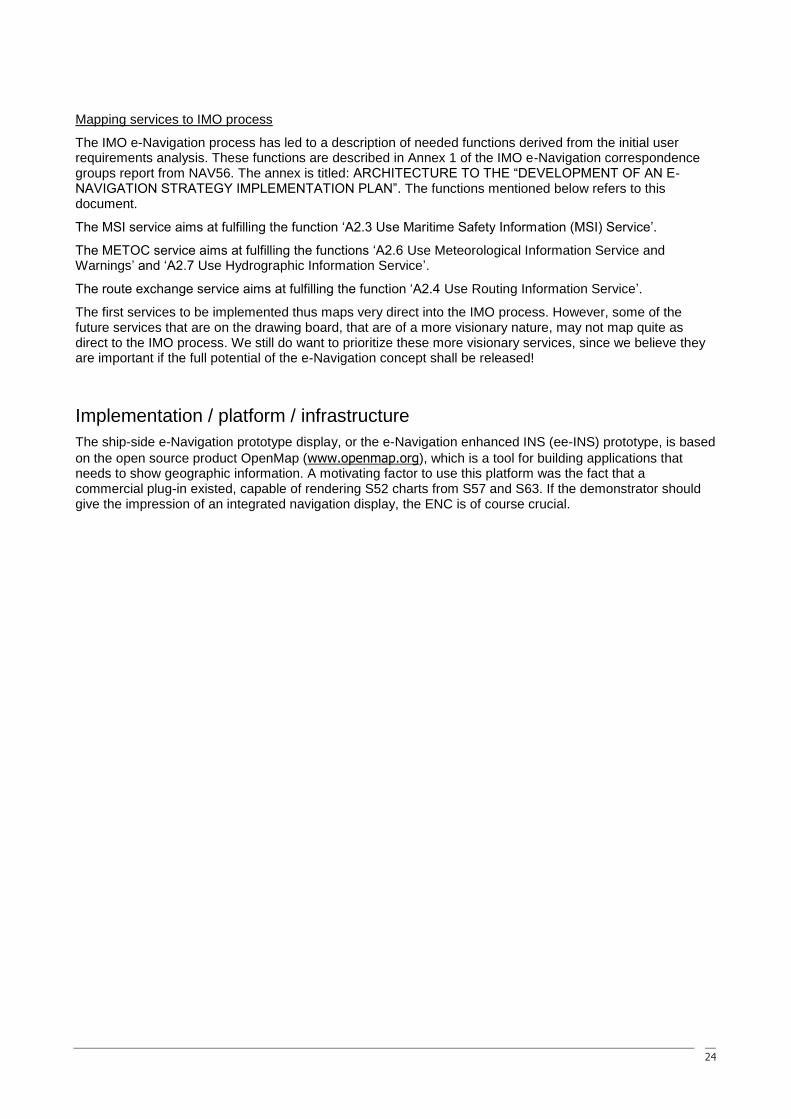
The colors left over for other ships routes are green or blue. In correlation with this, other ships intended route legs is suggested to be shown as a fat, short dashed line with the color green (see Figure 3).
Figure 3. Suggested style of other ships intended route based on future way points transmitted by the other ship‘s navigation system.
Route suggestion
VTS Centers receive intended routes from vessels on their display and VTS operator may send route suggestions to vessels as well as suggestion to change speed. Search and Rescue Coordinators may send search areas and search patterns to participating vessels. At the same time a geographic presentation at the SAR authority will give an overview of areas still to be searched. Pilots could in the same way transmit their planned Pilot route to vessels before boarding.
23
The scenario for this type of service might look like this: The VTS first has to be aware of the intended routes of the ships passing through their area (see Exchange of Intended route). The VTS operator then creates an alternative route segment or chooses from a number of standard route segments stacked in a list or displayed on their screen. The route segment is transmitted to the particular ship. The suggested route segment appears on the ECDIS screen of the targeted ship. The OOW/navigator has a choice of either accepting or rejecting the suggested route segment. The suggested route segment is accepted and merged into vessels existing route and together the two becomes the active, monitored, route. At the VTS, the display shows that the suggested route segment has been accepted and made into the ships intended route.
For this new type of route suggestion we have run out of colors if we consider present standard colors and the maximum ability to discriminate colors by the human perceptive system. One suggestion could be some kind of mixed colors, e.g. a red and green double dashed line (see Figure 7) displayed together with a Reject/Accept dialogue. If accepted the suggested route segment becomes the active monitored route, displayed as such both on own system (red, short dashed) and on the VTS system (green short dashed).
Figure 8. A possible scenario where the Elbe VTS has sent a new suggested route segment to a westbound ship. (NOTE: The Accept/Reject box could appear in the bottom menu of the display to avoid covering important information in the chart area).
The chosen communication carrier for route exchange is AIS. The AIS ASM (FI = 27, 28) from IMO SN Circ. 289 are used. Sending 16 waypoints will use 5 time slots. Route suggestion is not considered to put any noticeable additional load on the AIS link. Broadcasting intended route is done using the following rules
When the active route changes or when active waypoint changes.
Regularly every 6 minutes. As recommended in ITU-R M.1371 (§4.2.1) regarding sending interval for voyage related information.
It needs to be considered what effect this will have on the existing AIS link.
24
Mapping services to IMO process
The IMO e-Navigation process has led to a description of needed functions derived from the initial user requirements analysis. These functions are described in Annex 1 of the IMO e-Navigation correspondence groups report from NAV56. The annex is titled: ARCHITECTURE TO THE ―DEVELOPMENT OF AN E-NAVIGATION STRATEGY IMPLEMENTATION PLAN‖. The functions mentioned below refers to this document.
The MSI service aims at fulfilling the function ‗A2.3 Use Maritime Safety Information (MSI) Service‘.
The METOC service aims at fulfilling the functions ‗A2.6 Use Meteorological Information Service and Warnings‘ and ‗A2.7 Use Hydrographic Information Service‘.
The route exchange service aims at fulfilling the function ‗A2.4 Use Routing Information Service‘.
The first services to be implemented thus maps very direct into the IMO process. However, some of the future services that are on the drawing board, that are of a more visionary nature, may not map quite as direct to the IMO process. We still do want to prioritize these more visionary services, since we believe they are important if the full potential of the e-Navigation concept shall be released!
Implementation / platform / infrastructure
The ship-side e-Navigation prototype display, or the e-Navigation enhanced INS (ee-INS) prototype, is based
on the open source product OpenMap (www.openmap.org), which is a tool for building applications that needs to show geographic information. A motivating factor to use this platform was the fact that a commercial plug-in existed, capable of rendering S52 charts from S57 and S63. If the demonstrator should give the impression of an integrated navigation display, the ENC is of course crucial.
25
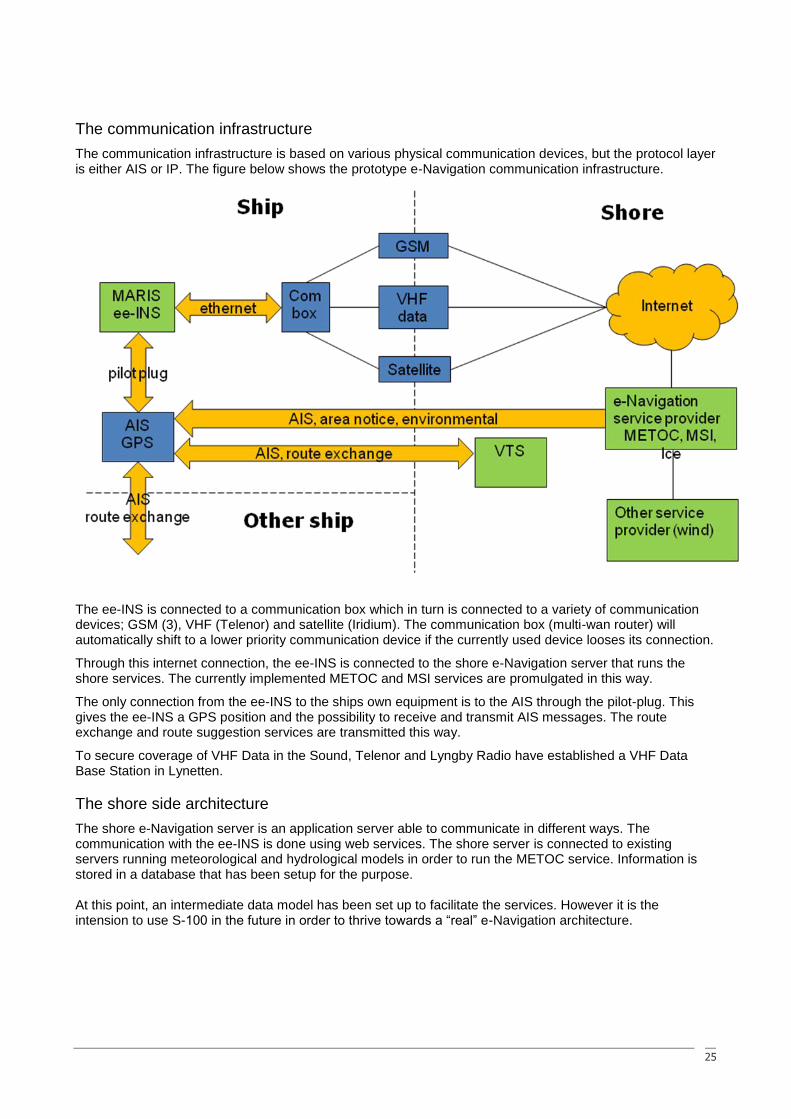
The communication infrastructure
The communication infrastructure is based on various physical communication devices, but the protocol layer is either AIS or IP. The figure below shows the prototype e-Navigation communication infrastructure.
The ee-INS is connected to a communication box which in turn is connected to a variety of communication devices; GSM (3), VHF (Telenor) and satellite (Iridium). The communication box (multi-wan router) will automatically shift to a lower priority communication device if the currently used device looses its connection.
Through this internet connection, the ee-INS is connected to the shore e-Navigation server that runs the shore services. The currently implemented METOC and MSI services are promulgated in this way.
The only connection from the ee-INS to the ships own equipment is to the AIS through the pilot-plug. This gives the ee-INS a GPS position and the possibility to receive and transmit AIS messages. The route exchange and route suggestion services are transmitted this way.
To secure coverage of VHF Data in the Sound, Telenor and Lyngby Radio have established a VHF Data Base Station in Lynetten.
The shore side architecture
The shore e-Navigation server is an application server able to communicate in different ways. The communication with the ee-INS is done using web services. The shore server is connected to existing servers running meteorological and hydrological models in order to run the METOC service. Information is stored in a database that has been setup for the purpose. At this point, an intermediate data model has been set up to facilitate the services. However it is the intension to use S-100 in the future in order to thrive towards a ―real‖ e-Navigation architecture.
26
The test bed
The test bed comprises the entire Baltic Sea from the Skaw to the Bay of Bothnia and Bay of Finland. Like the IMO Correspondence Group on e-Navigation has found it necessary to introduce e-Navigation service levels, it has become evident during the EfficienSea e-Navigation projects work that not all services will be needed in all areas, nor will they be possible to provide. For now, three different e-Navigation levels have been identified. These have been named:
- Level 1 – VTS: Area within a Vessel Traffic Service (VTS) zone which is often difficult to navigate due to traffic density and natural conditions. All services are necessary and must be available.
- Level 2 – Confined waters:
Area as above but without established VTS centre. Area may be easier to navigate but vessels still need many of the available e-Navigation services.
- Level 3 – Deep Sea:
Area with limited amount of available data, e.g. no detailed information on current and water level. Some services are however still necessary.
The test bed is divided into these areas during the test phase. The project will thereby gain experience on e-Navigation levels / service areas and will be able to describe standard service levels in greater detail. It is the idea that the e-Navigation services are provided by different service providers in the different areas. If the necessary services are not available in an area this should be dealt with in GAP analysis. The test equipment (the e-Navigation enhanced INS, ee-INS) will be installed on a number of different vessels representing the different vessel types in the area, i.e. tankers, ferries, tugboats, buoy tenders and High Speed Crafts (a total of 12-14). To complete the list the Danish Pilots have joined in on the project and will make use of the ee-INS when piloting vessels through Danish waters.
Sound VTS will be equipped with a test VTS system developed by VisSim.
The way ahead
Above is described EfficienSea e-Navigation project background, used methodology, developed services, communication architecture and the test bed.
During 2011 the EfficienSea project will continue the live tests and iterations of developed services and continue the development, including:
Integration of the SSPA anti-collision tool into the ee-INS
Development and implementation of No-go areas
Other Application-Specific messages
Ice information
Bathymetry of anchoring areas
Integration of Dynamic risk index into ee-INS
Experiments with architecture / infrastructure
Incorporation of S-100 standard
Reports on tests and lessons learned will be produced and published as we gain experience on possible e-Navigation services and architecture.
27
Portable Pilot Unit – a trendsetter for e- Navigation and an essential part of Vessel Traffic Management in Ports?
Maarten Betlem Dutch Pilot Association
In the last decade we have seen the development of the so called portable pilot units all around the world. With some minor mutual differences in outcome and performances, the technology of the units is based on GNSS, AIS, ENC and specific navigation software and with the introduction of the last generation PPU‘s , a mobile broadband connection, which gives entrance to a wide range of relevant helpful data.
Within the E.C. research project IPPA, in the late nineties the basic requirements and specifications of the units were captured, without hindering the introducing of specific (local) applications. In the following EC project MarNIS, further steps in specific PPU applications were developed and tested under the same conditions.
Because the PPU is an additional instrument in the support of the decision making process onboard, besides the ships sensors, it‘s a relative simple procedure to add new specific (local) applications to the PPU if the value of the extra information by doing so is recognized by the competent authority and pilot organization. The legal aspects of using the PPU within international waters is an issue which still needs a profound investigation.
Outcome of the MarNIS PPU research.
A state of the art inventory was made of the presently uses PPU‘s like the QPS Qastor/ AD Max, Marimatech, Maris, Raven and others.
Main Component of the developed prototype PPU in MarNIS was a GPS/IMU with L1 and L2, with a RTK augmentation for 3D positioning - Weight of the GPS/IMU unit 2.2 kilo. Specifications: Position Horizontal – < 2 cm. Vertical - < 5 cm Velocity <0.03 m/s Roll and Pitch <0.025û True Heading 4m baseline - 0.025û Heave 5% of heave amplitude or 5cm.
The introduction of the GPS/IMU leads to a very accurate 3D position of the ship and it‘s relative motions. Condition to be fulfilled is the knowledge of the exact position of the main antenna of the PPU in relation to the ship dimensions.
Via the broadband link information is available of the computed prediction model of DUKC and its used parameters ashore, which is compared with the actual determined DUKC whilst underway.
Also via the link the following information was provided onboard:
Traffic Image of the VTS. (integrated radar/ais)
Actual water level used for the presentation of a Dynamic ENC.
Maritime Information Objects via Web Mapping Services indicating Wind, Current, Wave height and
significant period, etc.
Temporarily restricted or prohibited areas.
AtoN ‗s out of service.
Terminal Information.
The unit is extensively tested in the Port of Lisbon with a final demonstration in October 2008. Some of the above mentioned applications are within the list of the user needs on board of the e- Navigation strategy plan. The experience with the PPU and the determination of the pro‘s and con‘s of specific
28
applications in use specified by bridge teams and pilots should be used for the selection of specific applications and its implementation within e-Navigation.
The introduction of the PPU has influenced, in some areas the position and roll of VTS within Vessel Traffic Management. By using a state of the art PPU onboard, the VTS operator hasn‘t the lead in data anymore where the information and assistance to the individual ship is based on. The combination of information from the PPU and ship sensors has brought the ship, e. c. the bridge team in the most favorable position to execute the tactical management of the individual ship. A similar development could arise from the introduction of the e- Navigation concept.
Probably with these developments the future roll of VTS within Vessel Traffic Management will be much more focused on the organization part or strategic management of the overall traffic flow. Within Vessel Traffic Management, specific accurate (individual) frameworks must be used to manage the traffic flow. These frame works indicates the conditions and circumstances under which the individual ship has to participate. The roll of the VTS will be to monitor or the individual ship executed the passage on mainlines in accordance with the criteria set in the frame work, besides the overall supervision on behalf of the competent authority.
29
Abstract for ―e-Navigation Underway‖ conference, 31 Jan-2 Feb 2011
What can shore-side authorities bring to e-Navigation?
Dr Nick Ward, Research Director General Lighthouse Authorities of the UK & Ireland
e-Navigation has been conceived from the start as an integrated system, bringing together shipborne and shore-side elements. Many of the shipborne elements are already quite well defined: ECDIS, INS, ENCs, AIS etc. The shore-side aspects have received less attention, but will include resilient position-fixing, AIS networks, communications & SAR infrastructure, VTS, MSI, LRIT and many other components. In both the shipborne and the shore-side context e-Navigation can be seen as the framework that will bring all these separate, but inter-related components together into a harmonised system. A shared architecture, standard interfaces and data exchange formats, common data structure and communications protocols will all be needed to achieve this harmonisation.
This paper looks at some examples of shore-side e-Navigation applications and how they can be integrated as components of e-Navigation, how they match up with the user requirements identified and where they fit into the gap analysis now underway.
Plans will be outlined for the demonstration of these applications in a test-bed, involving shore-side providers, manufacturers and end-users, aimed at developing and proving the harmonised standards to be adopted.
30
High Speed Maritime Mesh Network System for e-Navigation
Pankaj Sharma, Jaya Shankar, Lim Wei Lih, Tie Lok Tiing, Win Htun Htun, Robert Hsieh & Ang Chee Wei Institute for Infocomm Research, Singapore-138632
Email: [email protected]
Limitations of existing maritime safety and security systems that depend heavily on Radiocommunication are described. Present piece of research envisages the development of a high speed maritime communication system using radios placed on board ships as relays to form a mesh network. The results of performance of the system tested in Singapore Straits & Trondheim Fjord (Norway) are presented. Recommendations of the
studies are also covered in paper.
Keywords: e-navigation, high speed maritime mesh network, ping loss, packet loss, RSSI, LOS, Fresnel‘s zone.
Introduction
e-Navigation is the collection, integration and display of maritime information onboard and ashore by electronic means to enhance berth-to-berth navigation and related services, safety and security at sea and protection of the marine environment [1]. e-Navigation is a concept developed under the auspices of the UN's International Maritime Organization (IMO) to bring about increased safety and security in commercial shipping through better organization of data on ships and on shore, and better data exchange and communication between the two. The concept was launched when maritime authorities from seven nations requested its inclusion in the work undertaken in IMO's NAV and COMSAR sub-committees. Following this, working groups in sub-committees and a correspondence group [2] and also the International Hydrographic Organization (IHO) and the International Association of Marine Aids (IALA), have undertaken the work on an e-Navigation strategy implementation plan meant for adoption in 2012.
A high speed and cost effective maritime wireless communication link is essential to the success of e-navigation concept. Besides this special demand, new requirement for enhanced bandwidth is also coming from shipping crews. More crew are demanding for Internet access to stay connected to their families and friends. Although satellite communication can provide broadband wireless access to the ships, speeds are limited and costs involved are quite prohibitive. The Satcom is generally used for maritime communication, but the data rate is very limited and the cost of service is very expensive.
Present piece of research envisages the development of a high speed maritime communication system using radios placed on board ships as relays to form a mesh network. The mesh network will address new bandwidth demands for ships travelling in dense traffic lanes and also for the traffic lanes close to the shoreline.
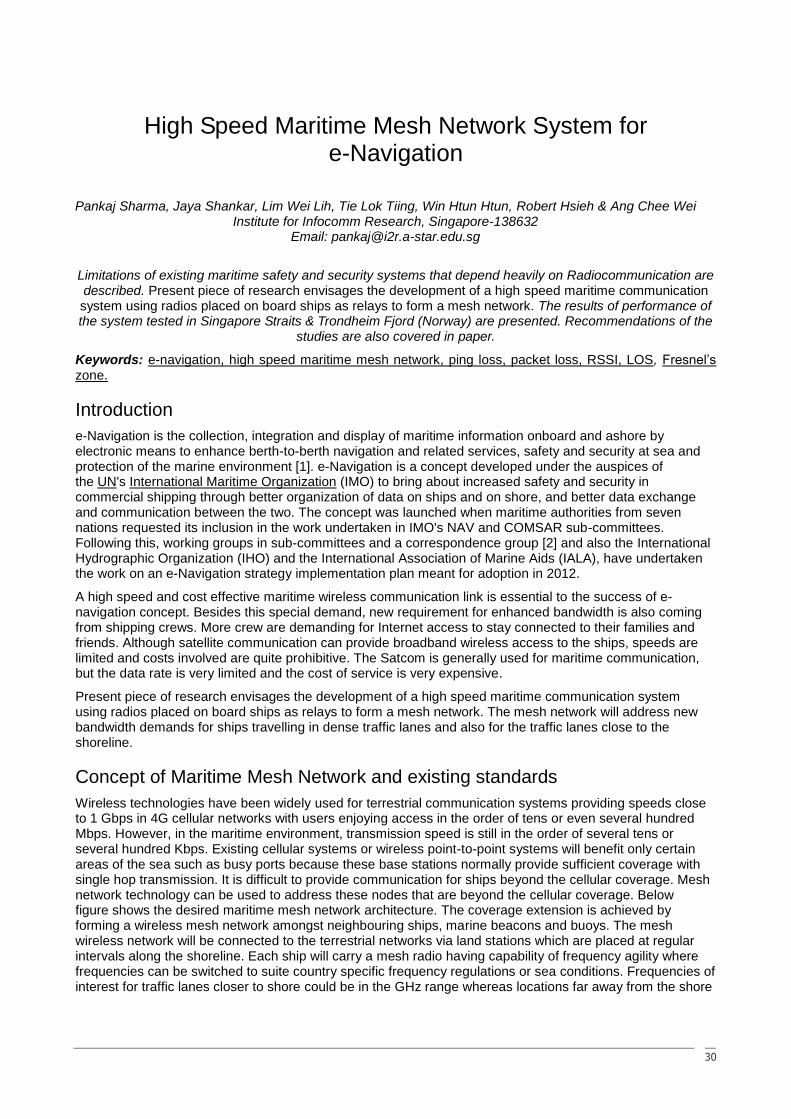
Concept of Maritime Mesh Network and existing standards
Wireless technologies have been widely used for terrestrial communication systems providing speeds close to 1 Gbps in 4G cellular networks with users enjoying access in the order of tens or even several hundred Mbps. However, in the maritime environment, transmission speed is still in the order of several tens or several hundred Kbps. Existing cellular systems or wireless point-to-point systems will benefit only certain areas of the sea such as busy ports because these base stations normally provide sufficient coverage with single hop transmission. It is difficult to provide communication for ships beyond the cellular coverage. Mesh network technology can be used to address these nodes that are beyond the cellular coverage. Below figure shows the desired maritime mesh network architecture. The coverage extension is achieved by forming a wireless mesh network amongst neighbouring ships, marine beacons and buoys. The mesh wireless network will be connected to the terrestrial networks via land stations which are placed at regular intervals along the shoreline. Each ship will carry a mesh radio having capability of frequency agility where frequencies can be switched to suite country specific frequency regulations or sea conditions. Frequencies of interest for traffic lanes closer to shore could be in the GHz range whereas locations far away from the shore
31
could be based on UHF or VHF bands.
Maritime Mesh Network
Multi-hop wireless network technologies have been researched on for decades and have some practical deployments in certain field of applications like rural & urban terrestrial communication. Currently in IEEE, there are several standards that addresse mesh networking technology. However, application of these standards for direct use in maritime environment is not straight forward. The IEEE 802.11s [3], which is a mesh network amendment to the IEEE 802.11 Standard, uses the basic CSMA/CA technology for channel access. The aforesaid technology is suitable for networks with short communication range up to several hundred meters but not suitable for maritime mesh communication networks covering distances of several tens of kilometres. Analysis of ship traffic movement data obtained from the Maritime Port Authority of Singapore revealed that for the development of a well connected mesh network in a maritime environment (above figure) the transmission range among ships should be at least 18 kilometres. Therefore, the mesh networking technology based on 802.11s is not suitable for the maritime communication environment unless some amendments are made. The IEEE 802.16 has also defined a mesh network standard for the wireless metropolitan access network (MAN). Typical communication range of wireless MAN may vary from a few kilometres to about 50 kilometres. Unlike IEEE 802.11s, the mesh technology proposed in the IEEE 802.16-2004 Standard [4] uses Time Division Multiple Access (TDMA) as a basic channel access method at the MAC layer. Channel time used for data transmission is reserved before use. Both 802.11s and 802.16 standards employ Orthogonal Frequency Division Multiple Access (OFDMA) technology in the physical layer.
The IEEE 802.16-2004 mesh technology is currently considered as an obsolete standard due to the lack of interest from the cellular community. However, based on our field trials and simulation studies, it is found to be a suitable technology for maritime broadband communication.
Feasibility of over-the-horizon wireless communication in the maritime environment
Deploying wireless communication systems in marine environment has its own challenges [5-7]. The wireless channel responses are different from that of land because of ship‘s movements, ship‘s metallic surface, reflective properties of the sea water and the state of ships location in the maritime environment. Hence studies on the signal variations due to ship rocking, pitching & yawing were undertaken. The recommendations for improving the reception of signal have also been framed.
Signal variation due to ship rocking
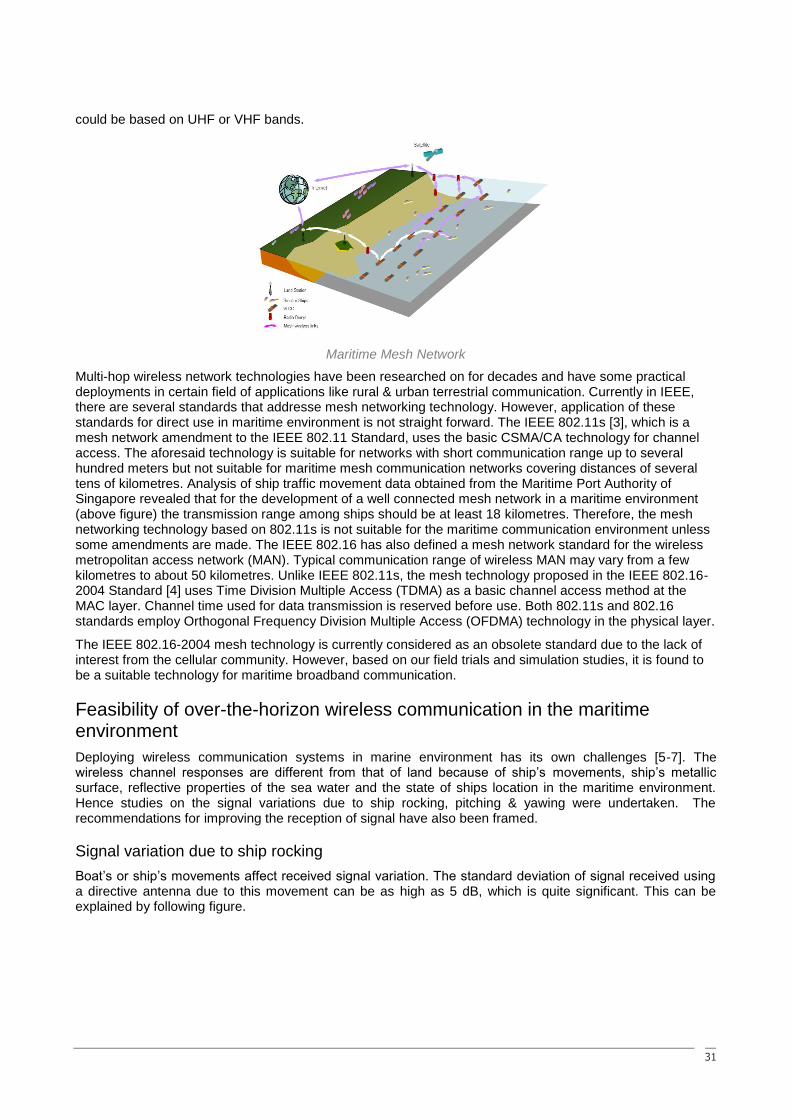
Boat‘s or ship‘s movements affect received signal variation. The standard deviation of signal received using a directive antenna due to this movement can be as high as 5 dB, which is quite significant. This can be explained by following figure.
32
Illustration of ship‘s movement affecting received signal
Assume the transmitter is on the shore and the receiver on a ship. If the ship is perfectly stationary, the receiver will have a constant signal strength received because its antenna‘s alignment with the transmitter‘s antenna remains the same. Both antennae are pointing into A. However, when the ship starts rocking, the Tx antenna is pointing to A while Rx antenna is pointing to B. Thus the antenna alignment between Tx and Rx is disrupted which changes the received signal strength.
An example of the effect of the ship‘s movement due to waves on the received signal is depicted in the following figure. In this measurement, the ship carrying the received antenna is positioned 500 m away from the transmitter. Transmitter is on the shore. The received signal varies significantly as the ship is rocked by the wave. Depending on the radiation pattern of antenna used, the variation can be as high as 10 dB. An ideal mesh maritime system should include methods to reduce the losses due to the rocking and misalignment of the antenna beams.
-60
-55
-50
-45
-40
-20 -10 0 10 20
Time (s)
Rela
tive A
mp
litu
de (
dB
m)
Received signal variation due to ship‘s rocking
Data Transmission with Broadband Wireless Communication Device
The detailed study was also conducted on the wireless broadband access in maritime environment. The mesh radio with certain enhancements is developed to handle the propagation challenges observed. To counter the effects of reflections from sea surface and nearby ships, sectorized antennae with azimuth of 90
o
and elevation of 8o are used. To mitigate the rocking problem, a specially designed antenna having three
antenna elements pointing to the same 90o azimuth and tilt of 0
o, +5
o and -5
o has been used. Only one of
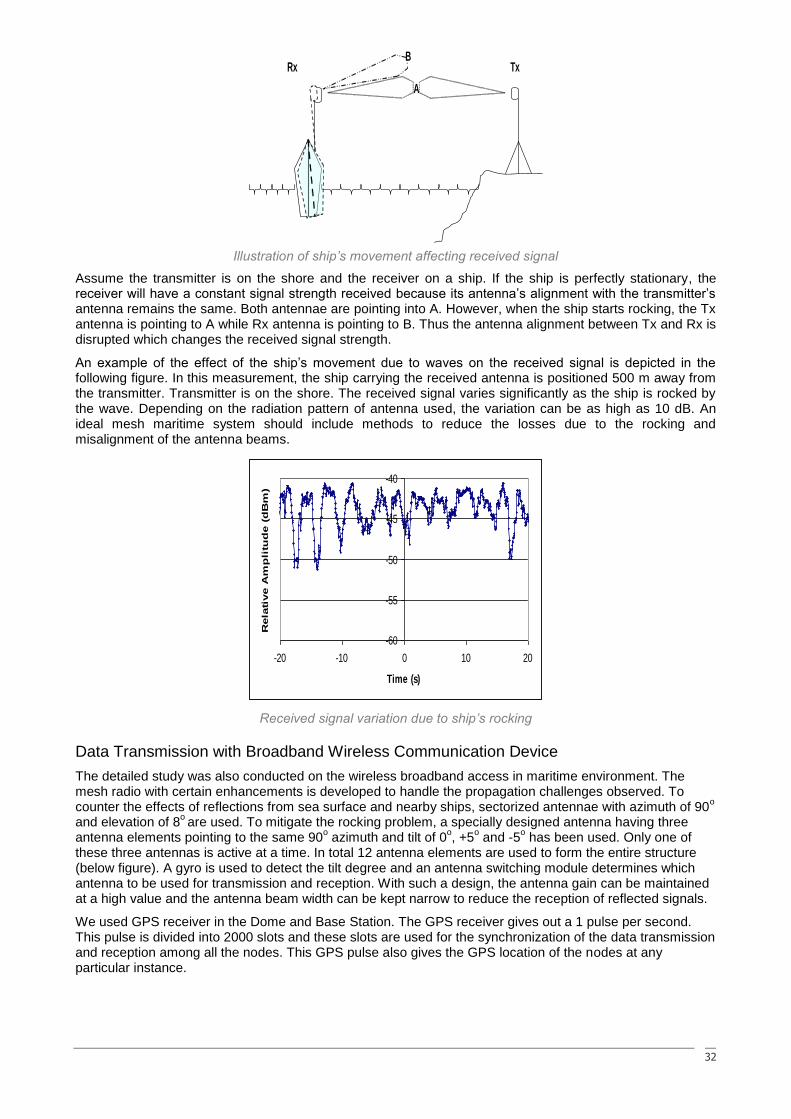
these three antennas is active at a time. In total 12 antenna elements are used to form the entire structure (below figure). A gyro is used to detect the tilt degree and an antenna switching module determines which antenna to be used for transmission and reception. With such a design, the antenna gain can be maintained at a high value and the antenna beam width can be kept narrow to reduce the reception of reflected signals.
We used GPS receiver in the Dome and Base Station. The GPS receiver gives out a 1 pulse per second. This pulse is divided into 2000 slots and these slots are used for the synchronization of the data transmission and reception among all the nodes. This GPS pulse also gives the GPS location of the nodes at any particular instance.
Tx Rx
A
B
33
A snapshot of internal view of node for Ship
Tests & Measurement Results
With the mesh devices, a number of field tests were carried out in maritime environment. The first set of tests was carried out at Singapore Straits and the second set of tests was carried out at Trondheim Fjord, Norway.
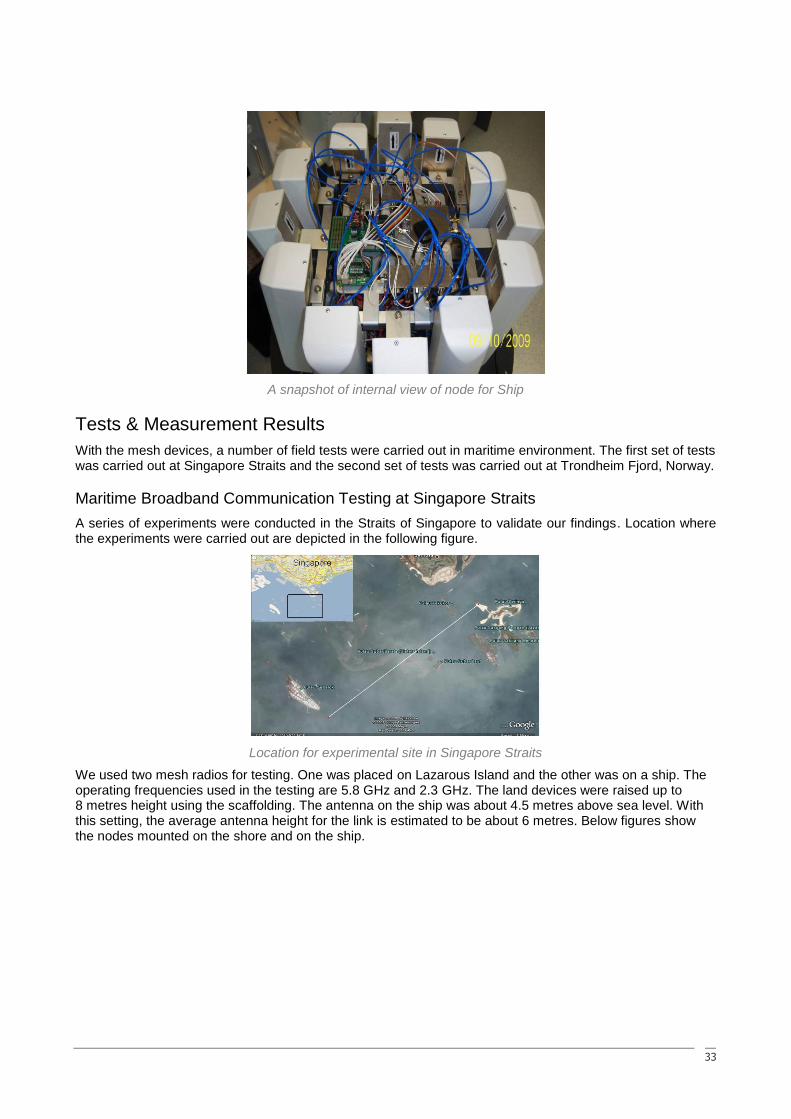
Maritime Broadband Communication Testing at Singapore Straits
A series of experiments were conducted in the Straits of Singapore to validate our findings. Location where the experiments were carried out are depicted in the following figure.
Location for experimental site in Singapore Straits
We used two mesh radios for testing. One was placed on Lazarous Island and the other was on a ship. The operating frequencies used in the testing are 5.8 GHz and 2.3 GHz. The land devices were raised up to 8 metres height using the scaffolding. The antenna on the ship was about 4.5 metres above sea level. With this setting, the average antenna height for the link is estimated to be about 6 metres. Below figures show the nodes mounted on the shore and on the ship.
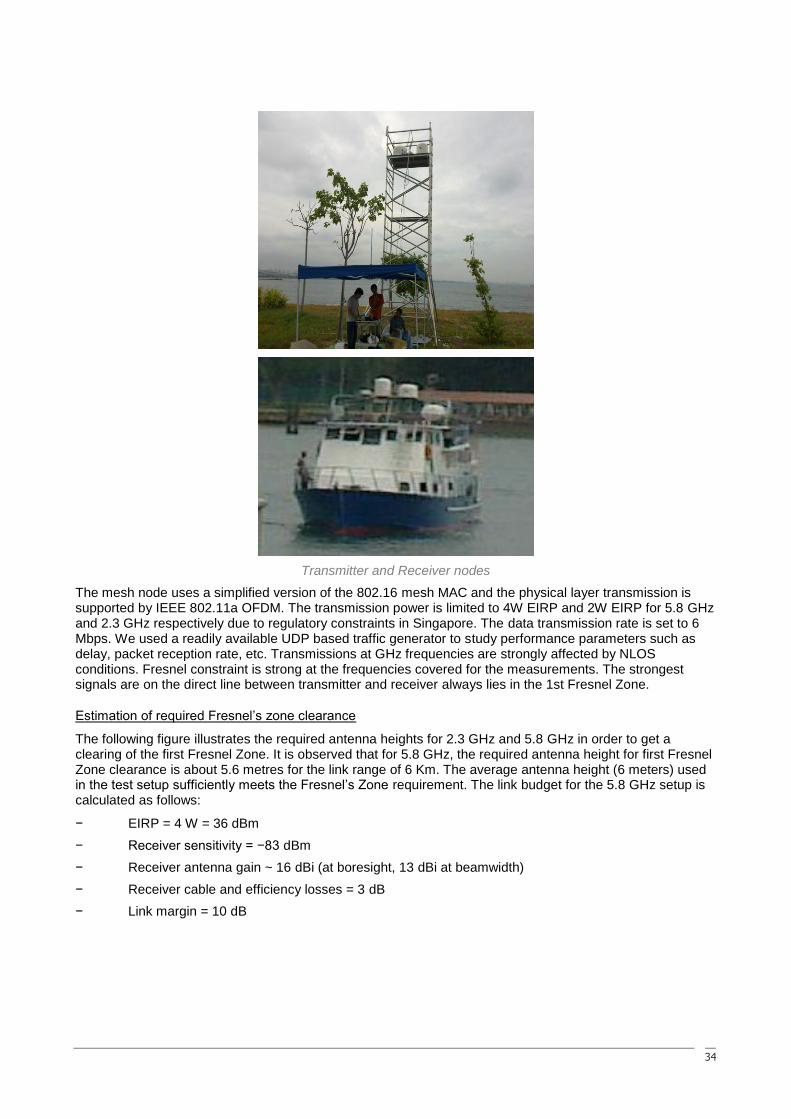
34
Transmitter and Receiver nodes
The mesh node uses a simplified version of the 802.16 mesh MAC and the physical layer transmission is supported by IEEE 802.11a OFDM. The transmission power is limited to 4W EIRP and 2W EIRP for 5.8 GHz and 2.3 GHz respectively due to regulatory constraints in Singapore. The data transmission rate is set to 6 Mbps. We used a readily available UDP based traffic generator to study performance parameters such as delay, packet reception rate, etc. Transmissions at GHz frequencies are strongly affected by NLOS conditions. Fresnel constraint is strong at the frequencies covered for the measurements. The strongest signals are on the direct line between transmitter and receiver always lies in the 1st Fresnel Zone.
Estimation of required Fresnel‘s zone clearance
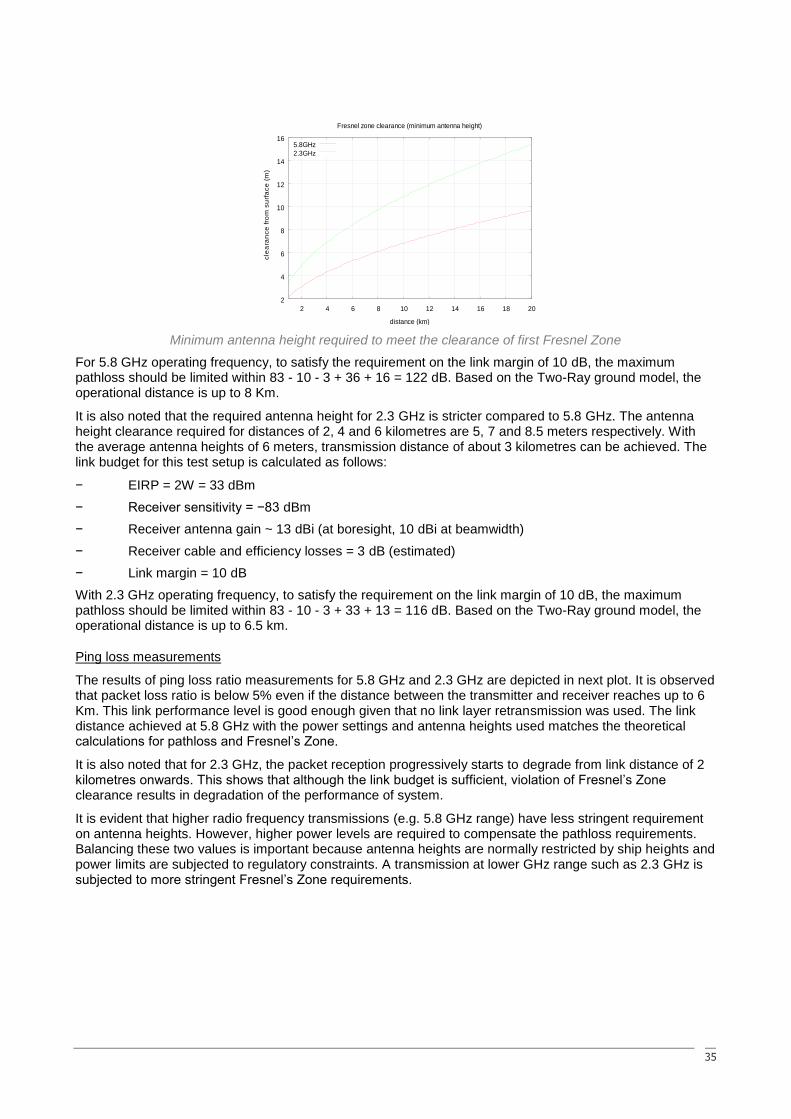
The following figure illustrates the required antenna heights for 2.3 GHz and 5.8 GHz in order to get a clearing of the first Fresnel Zone. It is observed that for 5.8 GHz, the required antenna height for first Fresnel Zone clearance is about 5.6 metres for the link range of 6 Km. The average antenna height (6 meters) used in the test setup sufficiently meets the Fresnel‘s Zone requirement. The link budget for the 5.8 GHz setup is calculated as follows:
− EIRP = 4 W = 36 dBm
− Receiver sensitivity = −83 dBm
− Receiver antenna gain ~ 16 dBi (at boresight, 13 dBi at beamwidth)
− Receiver cable and efficiency losses = 3 dB
− Link margin = 10 dB
35
2
4
6
8
10
12
14
16
2 4 6 8 10 12 14 16 18 20
cle
ara
nce
fro
m s
urf
ace
(m
)
distance (km)
Fresnel zone clearance (minimum antenna height)
5.8GHz
2.3GHz
Minimum antenna height required to meet the clearance of first Fresnel Zone
For 5.8 GHz operating frequency, to satisfy the requirement on the link margin of 10 dB, the maximum pathloss should be limited within 83 - 10 - 3 + 36 + 16 = 122 dB. Based on the Two-Ray ground model, the operational distance is up to 8 Km.
It is also noted that the required antenna height for 2.3 GHz is stricter compared to 5.8 GHz. The antenna height clearance required for distances of 2, 4 and 6 kilometres are 5, 7 and 8.5 meters respectively. With the average antenna heights of 6 meters, transmission distance of about 3 kilometres can be achieved. The link budget for this test setup is calculated as follows:
− EIRP = 2W = 33 dBm
− Receiver sensitivity = −83 dBm
− Receiver antenna gain ~ 13 dBi (at boresight, 10 dBi at beamwidth)
− Receiver cable and efficiency losses = 3 dB (estimated)
− Link margin = 10 dB
With 2.3 GHz operating frequency, to satisfy the requirement on the link margin of 10 dB, the maximum pathloss should be limited within 83 - 10 - 3 + 33 + 13 = 116 dB. Based on the Two-Ray ground model, the operational distance is up to 6.5 km.
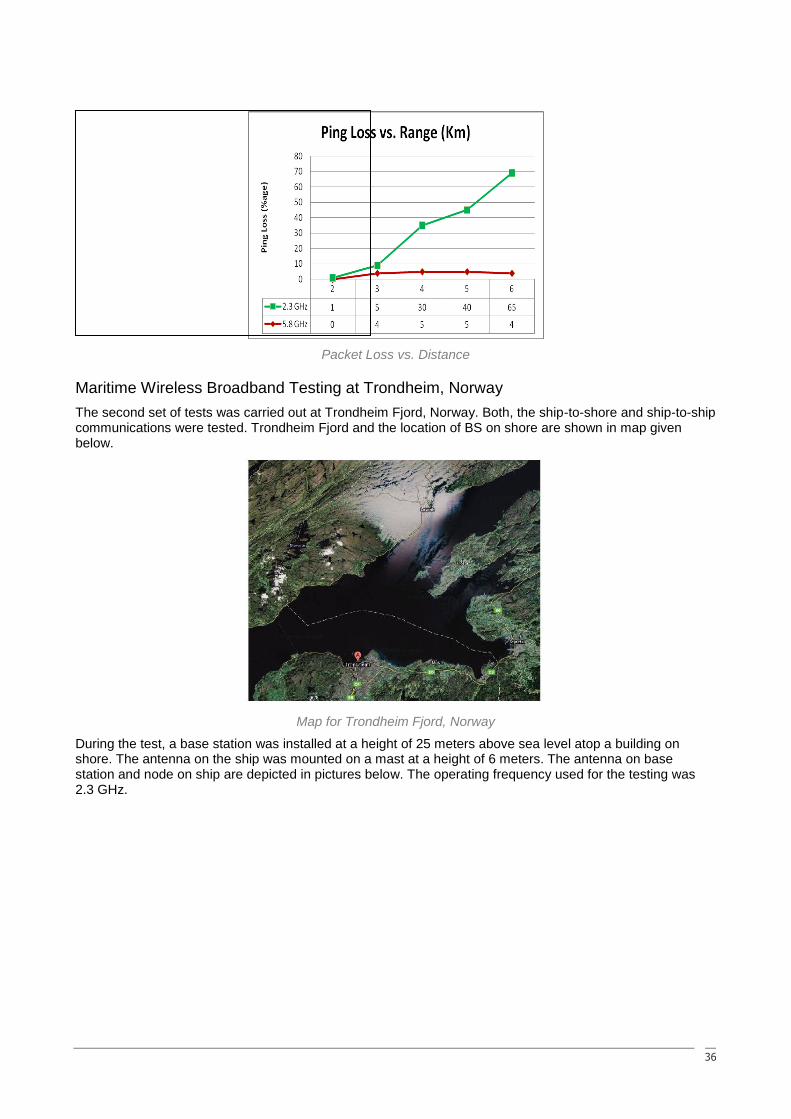
Ping loss measurements
The results of ping loss ratio measurements for 5.8 GHz and 2.3 GHz are depicted in next plot. It is observed that packet loss ratio is below 5% even if the distance between the transmitter and receiver reaches up to 6 Km. This link performance level is good enough given that no link layer retransmission was used. The link distance achieved at 5.8 GHz with the power settings and antenna heights used matches the theoretical calculations for pathloss and Fresnel‘s Zone.
It is also noted that for 2.3 GHz, the packet reception progressively starts to degrade from link distance of 2 kilometres onwards. This shows that although the link budget is sufficient, violation of Fresnel‘s Zone clearance results in degradation of the performance of system.
It is evident that higher radio frequency transmissions (e.g. 5.8 GHz range) have less stringent requirement on antenna heights. However, higher power levels are required to compensate the pathloss requirements. Balancing these two values is important because antenna heights are normally restricted by ship heights and power limits are subjected to regulatory constraints. A transmission at lower GHz range such as 2.3 GHz is subjected to more stringent Fresnel‘s Zone requirements.
36
Packet Loss vs. Distance
Maritime Wireless Broadband Testing at Trondheim, Norway
The second set of tests was carried out at Trondheim Fjord, Norway. Both, the ship-to-shore and ship-to-ship communications were tested. Trondheim Fjord and the location of BS on shore are shown in map given below.
Map for Trondheim Fjord, Norway
During the test, a base station was installed at a height of 25 meters above sea level atop a building on shore. The antenna on the ship was mounted on a mast at a height of 6 meters. The antenna on base station and node on ship are depicted in pictures below. The operating frequency used for the testing was 2.3 GHz.
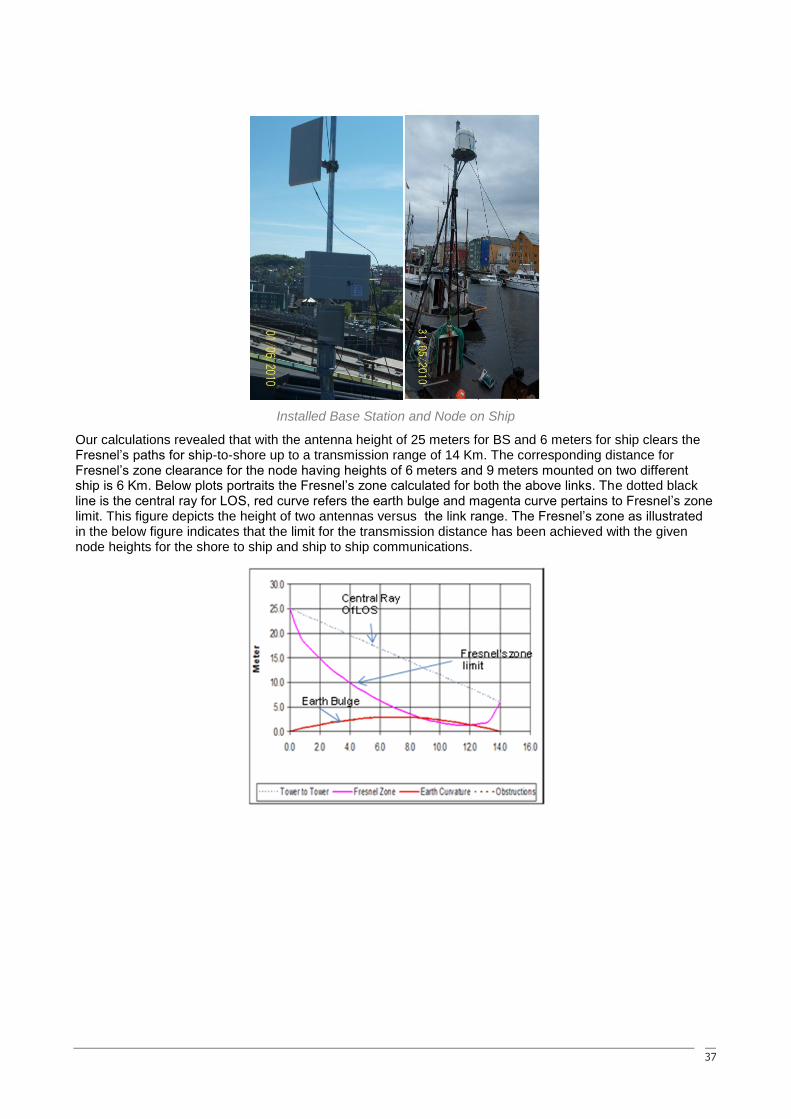
37
Installed Base Station and Node on Ship
Our calculations revealed that with the antenna height of 25 meters for BS and 6 meters for ship clears the Fresnel‘s paths for ship-to-shore up to a transmission range of 14 Km. The corresponding distance for Fresnel‘s zone clearance for the node having heights of 6 meters and 9 meters mounted on two different ship is 6 Km. Below plots portraits the Fresnel‘s zone calculated for both the above links. The dotted black line is the central ray for LOS, red curve refers the earth bulge and magenta curve pertains to Fresnel‘s zone limit. This figure depicts the height of two antennas versus the link range. The Fresnel‘s zone as illustrated in the below figure indicates that the limit for the transmission distance has been achieved with the given node heights for the shore to ship and ship to ship communications.
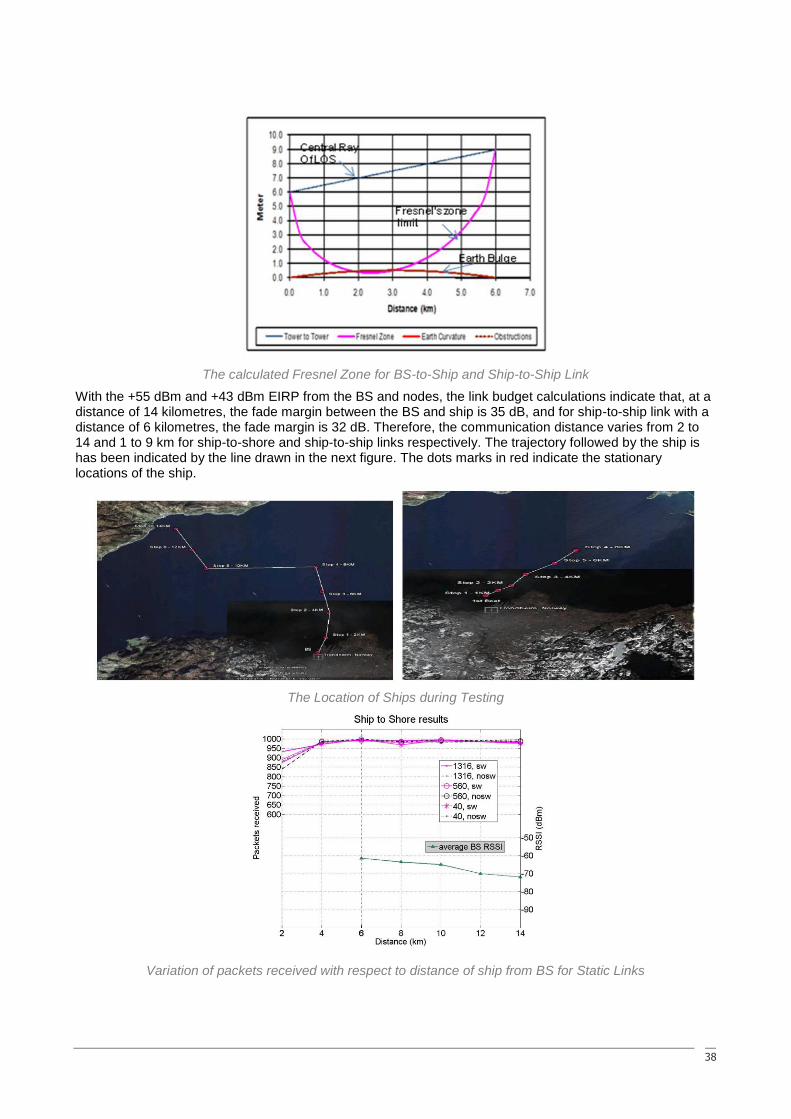
38
The calculated Fresnel Zone for BS-to-Ship and Ship-to-Ship Link
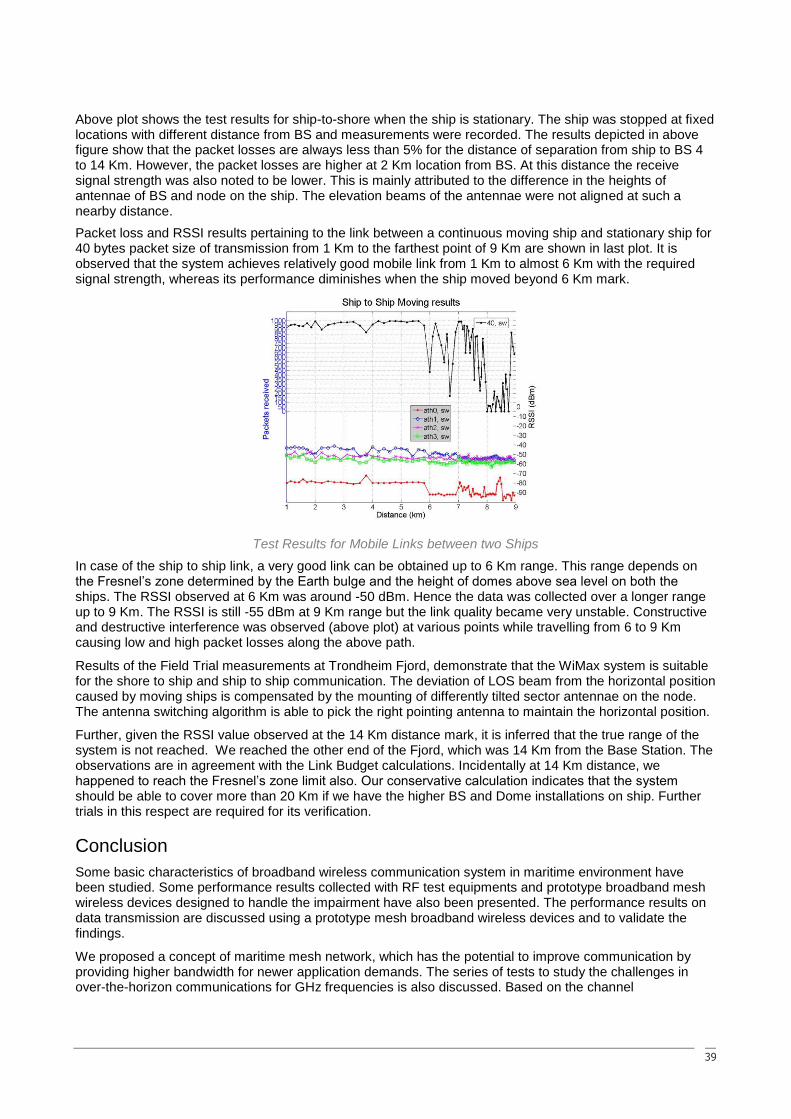
With the +55 dBm and +43 dBm EIRP from the BS and nodes, the link budget calculations indicate that, at a distance of 14 kilometres, the fade margin between the BS and ship is 35 dB, and for ship-to-ship link with a distance of 6 kilometres, the fade margin is 32 dB. Therefore, the communication distance varies from 2 to 14 and 1 to 9 km for ship-to-shore and ship-to-ship links respectively. The trajectory followed by the ship is has been indicated by the line drawn in the next figure. The dots marks in red indicate the stationary locations of the ship.
The Location of Ships during Testing
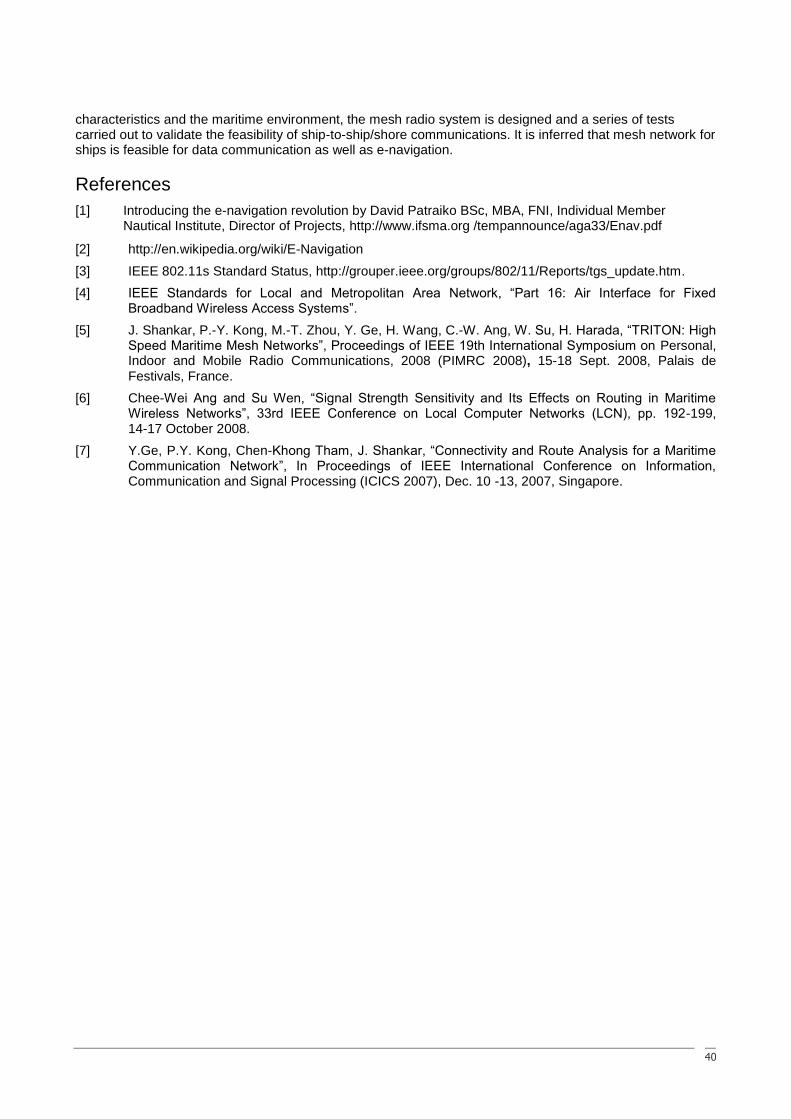
Variation of packets received with respect to distance of ship from BS for Static Links
39
Above plot shows the test results for ship-to-shore when the ship is stationary. The ship was stopped at fixed locations with different distance from BS and measurements were recorded. The results depicted in above figure show that the packet losses are always less than 5% for the distance of separation from ship to BS 4 to 14 Km. However, the packet losses are higher at 2 Km location from BS. At this distance the receive signal strength was also noted to be lower. This is mainly attributed to the difference in the heights of antennae of BS and node on the ship. The elevation beams of the antennae were not aligned at such a nearby distance.
Packet loss and RSSI results pertaining to the link between a continuous moving ship and stationary ship for 40 bytes packet size of transmission from 1 Km to the farthest point of 9 Km are shown in last plot. It is observed that the system achieves relatively good mobile link from 1 Km to almost 6 Km with the required signal strength, whereas its performance diminishes when the ship moved beyond 6 Km mark.
Test Results for Mobile Links between two Ships
In case of the ship to ship link, a very good link can be obtained up to 6 Km range. This range depends on the Fresnel‘s zone determined by the Earth bulge and the height of domes above sea level on both the ships. The RSSI observed at 6 Km was around -50 dBm. Hence the data was collected over a longer range up to 9 Km. The RSSI is still -55 dBm at 9 Km range but the link quality became very unstable. Constructive and destructive interference was observed (above plot) at various points while travelling from 6 to 9 Km causing low and high packet losses along the above path.
Results of the Field Trial measurements at Trondheim Fjord, demonstrate that the WiMax system is suitable for the shore to ship and ship to ship communication. The deviation of LOS beam from the horizontal position caused by moving ships is compensated by the mounting of differently tilted sector antennae on the node. The antenna switching algorithm is able to pick the right pointing antenna to maintain the horizontal position.
Further, given the RSSI value observed at the 14 Km distance mark, it is inferred that the true range of the system is not reached. We reached the other end of the Fjord, which was 14 Km from the Base Station. The observations are in agreement with the Link Budget calculations. Incidentally at 14 Km distance, we happened to reach the Fresnel‘s zone limit also. Our conservative calculation indicates that the system should be able to cover more than 20 Km if we have the higher BS and Dome installations on ship. Further trials in this respect are required for its verification.
Conclusion
Some basic characteristics of broadband wireless communication system in maritime environment have been studied. Some performance results collected with RF test equipments and prototype broadband mesh wireless devices designed to handle the impairment have also been presented. The performance results on data transmission are discussed using a prototype mesh broadband wireless devices and to validate the findings.
We proposed a concept of maritime mesh network, which has the potential to improve communication by providing higher bandwidth for newer application demands. The series of tests to study the challenges in over-the-horizon communications for GHz frequencies is also discussed. Based on the channel
40
characteristics and the maritime environment, the mesh radio system is designed and a series of tests carried out to validate the feasibility of ship-to-ship/shore communications. It is inferred that mesh network for ships is feasible for data communication as well as e-navigation.
References
[1] Introducing the e-navigation revolution by David Patraiko BSc, MBA, FNI, Individual Member Nautical Institute, Director of Projects, http://www.ifsma.org /tempannounce/aga33/Enav.pdf
[2] http://en.wikipedia.org/wiki/E-Navigation
[3] IEEE 802.11s Standard Status, http://grouper.ieee.org/groups/802/11/Reports/tgs_update.htm.
[4] IEEE Standards for Local and Metropolitan Area Network, ―Part 16: Air Interface for Fixed Broadband Wireless Access Systems‖.
[5] J. Shankar, P.-Y. Kong, M.-T. Zhou, Y. Ge, H. Wang, C.-W. Ang, W. Su, H. Harada, ―TRITON: High Speed Maritime Mesh Networks‖, Proceedings of IEEE 19th International Symposium on Personal, Indoor and Mobile Radio Communications, 2008 (PIMRC 2008), 15-18 Sept. 2008, Palais de Festivals, France.
[6] Chee-Wei Ang and Su Wen, ―Signal Strength Sensitivity and Its Effects on Routing in Maritime Wireless Networks‖, 33rd IEEE Conference on Local Computer Networks (LCN), pp. 192-199, 14-17 October 2008.
[7] Y.Ge, P.Y. Kong, Chen-Khong Tham, J. Shankar, ―Connectivity and Route Analysis for a Maritime Communication Network‖, In Proceedings of IEEE International Conference on Information, Communication and Signal Processing (ICICS 2007), Dec. 10 -13, 2007, Singapore.
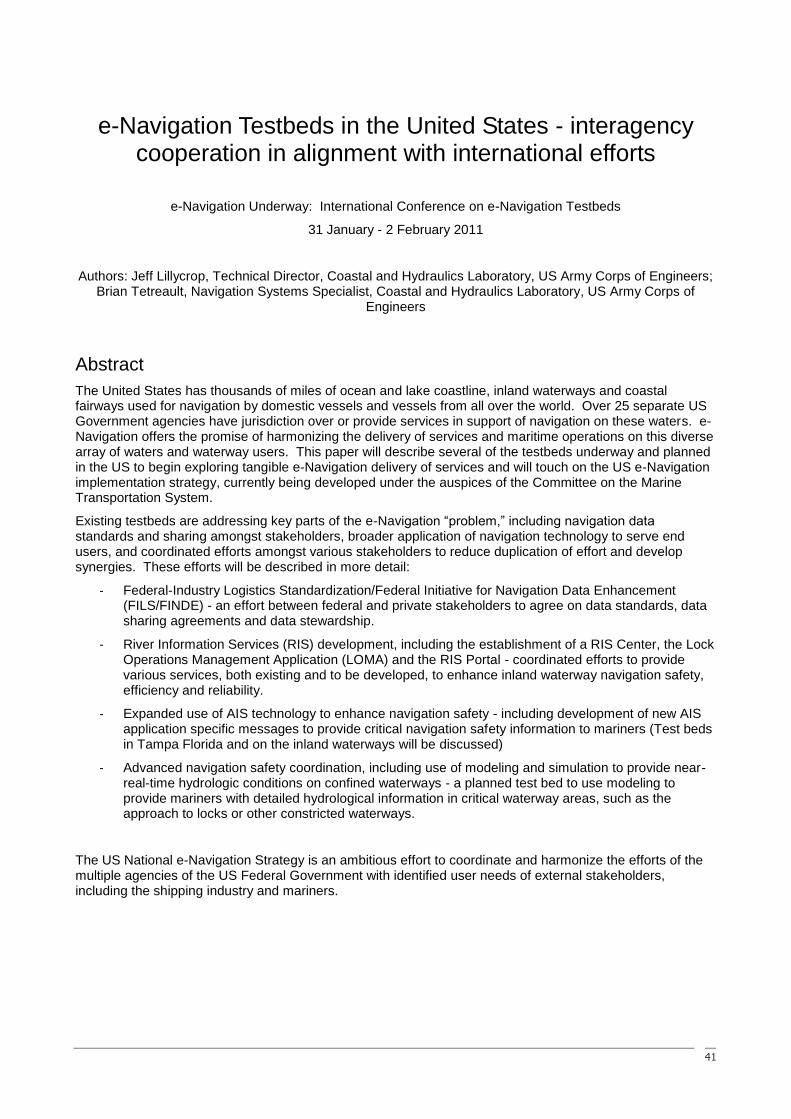
41
e-Navigation Testbeds in the United States - interagency cooperation in alignment with international efforts
e-Navigation Underway: International Conference on e-Navigation Testbeds
31 January - 2 February 2011
Authors: Jeff Lillycrop, Technical Director, Coastal and Hydraulics Laboratory, US Army Corps of Engineers; Brian Tetreault, Navigation Systems Specialist, Coastal and Hydraulics Laboratory, US Army Corps of
Engineers
Abstract
The United States has thousands of miles of ocean and lake coastline, inland waterways and coastal fairways used for navigation by domestic vessels and vessels from all over the world. Over 25 separate US Government agencies have jurisdiction over or provide services in support of navigation on these waters. e-Navigation offers the promise of harmonizing the delivery of services and maritime operations on this diverse array of waters and waterway users. This paper will describe several of the testbeds underway and planned in the US to begin exploring tangible e-Navigation delivery of services and will touch on the US e-Navigation implementation strategy, currently being developed under the auspices of the Committee on the Marine Transportation System.
Existing testbeds are addressing key parts of the e-Navigation ―problem,‖ including navigation data standards and sharing amongst stakeholders, broader application of navigation technology to serve end users, and coordinated efforts amongst various stakeholders to reduce duplication of effort and develop synergies. These efforts will be described in more detail:
- Federal-Industry Logistics Standardization/Federal Initiative for Navigation Data Enhancement (FILS/FINDE) - an effort between federal and private stakeholders to agree on data standards, data sharing agreements and data stewardship.
- River Information Services (RIS) development, including the establishment of a RIS Center, the Lock Operations Management Application (LOMA) and the RIS Portal - coordinated efforts to provide various services, both existing and to be developed, to enhance inland waterway navigation safety, efficiency and reliability.
- Expanded use of AIS technology to enhance navigation safety - including development of new AIS application specific messages to provide critical navigation safety information to mariners (Test beds in Tampa Florida and on the inland waterways will be discussed)
- Advanced navigation safety coordination, including use of modeling and simulation to provide near-real-time hydrologic conditions on confined waterways - a planned test bed to use modeling to provide mariners with detailed hydrological information in critical waterway areas, such as the approach to locks or other constricted waterways.
The US National e-Navigation Strategy is an ambitious effort to coordinate and harmonize the efforts of the multiple agencies of the US Federal Government with identified user needs of external stakeholders, including the shipping industry and mariners.
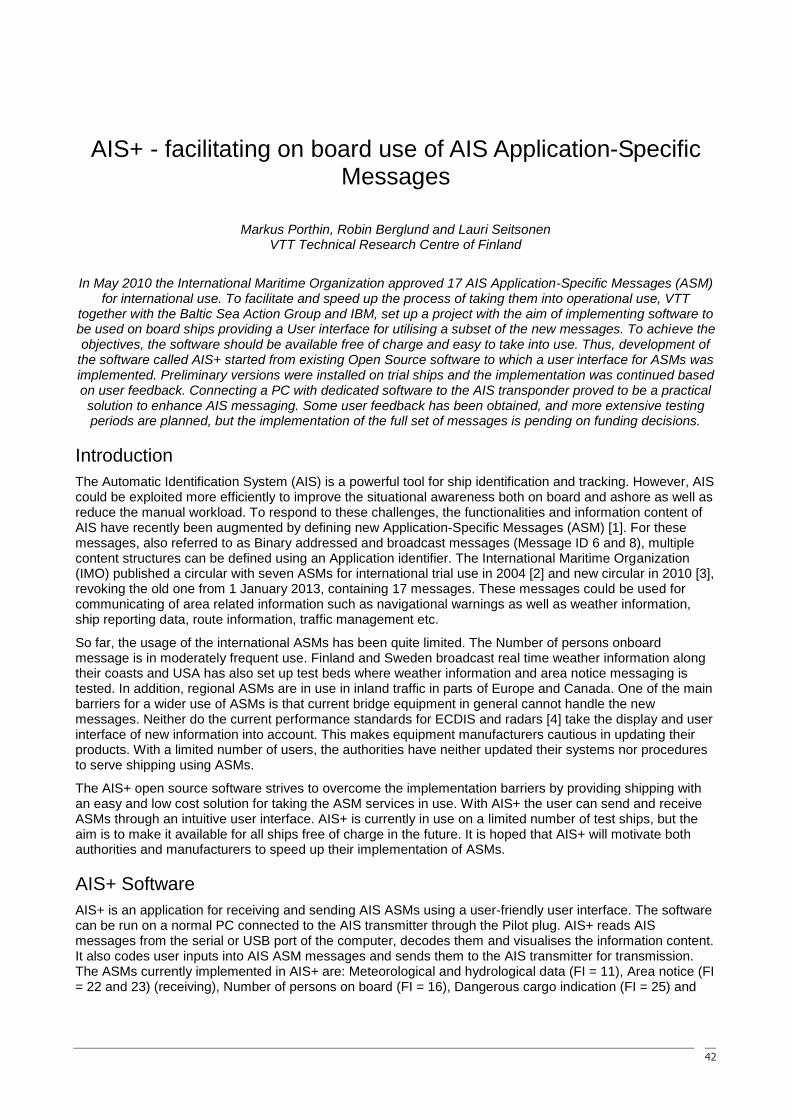
42
AIS+ - facilitating on board use of AIS Application-Specific Messages
Markus Porthin, Robin Berglund and Lauri Seitsonen VTT Technical Research Centre of Finland
In May 2010 the International Maritime Organization approved 17 AIS Application-Specific Messages (ASM) for international use. To facilitate and speed up the process of taking them into operational use, VTT
together with the Baltic Sea Action Group and IBM, set up a project with the aim of implementing software to be used on board ships providing a User interface for utilising a subset of the new messages. To achieve the objectives, the software should be available free of charge and easy to take into use. Thus, development of
the software called AIS+ started from existing Open Source software to which a user interface for ASMs was implemented. Preliminary versions were installed on trial ships and the implementation was continued based on user feedback. Connecting a PC with dedicated software to the AIS transponder proved to be a practical solution to enhance AIS messaging. Some user feedback has been obtained, and more extensive testing periods are planned, but the implementation of the full set of messages is pending on funding decisions.
Introduction
The Automatic Identification System (AIS) is a powerful tool for ship identification and tracking. However, AIS could be exploited more efficiently to improve the situational awareness both on board and ashore as well as reduce the manual workload. To respond to these challenges, the functionalities and information content of AIS have recently been augmented by defining new Application-Specific Messages (ASM) [1]. For these messages, also referred to as Binary addressed and broadcast messages (Message ID 6 and 8), multiple content structures can be defined using an Application identifier. The International Maritime Organization (IMO) published a circular with seven ASMs for international trial use in 2004 [2] and new circular in 2010 [3], revoking the old one from 1 January 2013, containing 17 messages. These messages could be used for communicating of area related information such as navigational warnings as well as weather information, ship reporting data, route information, traffic management etc.
So far, the usage of the international ASMs has been quite limited. The Number of persons onboard message is in moderately frequent use. Finland and Sweden broadcast real time weather information along their coasts and USA has also set up test beds where weather information and area notice messaging is tested. In addition, regional ASMs are in use in inland traffic in parts of Europe and Canada. One of the main barriers for a wider use of ASMs is that current bridge equipment in general cannot handle the new messages. Neither do the current performance standards for ECDIS and radars [4] take the display and user interface of new information into account. This makes equipment manufacturers cautious in updating their products. With a limited number of users, the authorities have neither updated their systems nor procedures to serve shipping using ASMs.
The AIS+ open source software strives to overcome the implementation barriers by providing shipping with an easy and low cost solution for taking the ASM services in use. With AIS+ the user can send and receive ASMs through an intuitive user interface. AIS+ is currently in use on a limited number of test ships, but the aim is to make it available for all ships free of charge in the future. It is hoped that AIS+ will motivate both authorities and manufacturers to speed up their implementation of ASMs.
AIS+ Software
AIS+ is an application for receiving and sending AIS ASMs using a user-friendly user interface. The software can be run on a normal PC connected to the AIS transmitter through the Pilot plug. AIS+ reads AIS messages from the serial or USB port of the computer, decodes them and visualises the information content. It also codes user inputs into AIS ASM messages and sends them to the AIS transmitter for transmission. The ASMs currently implemented in AIS+ are: Meteorological and hydrological data (FI = 11), Area notice (FI = 22 and 23) (receiving), Number of persons on board (FI = 16), Dangerous cargo indication (FI = 25) and
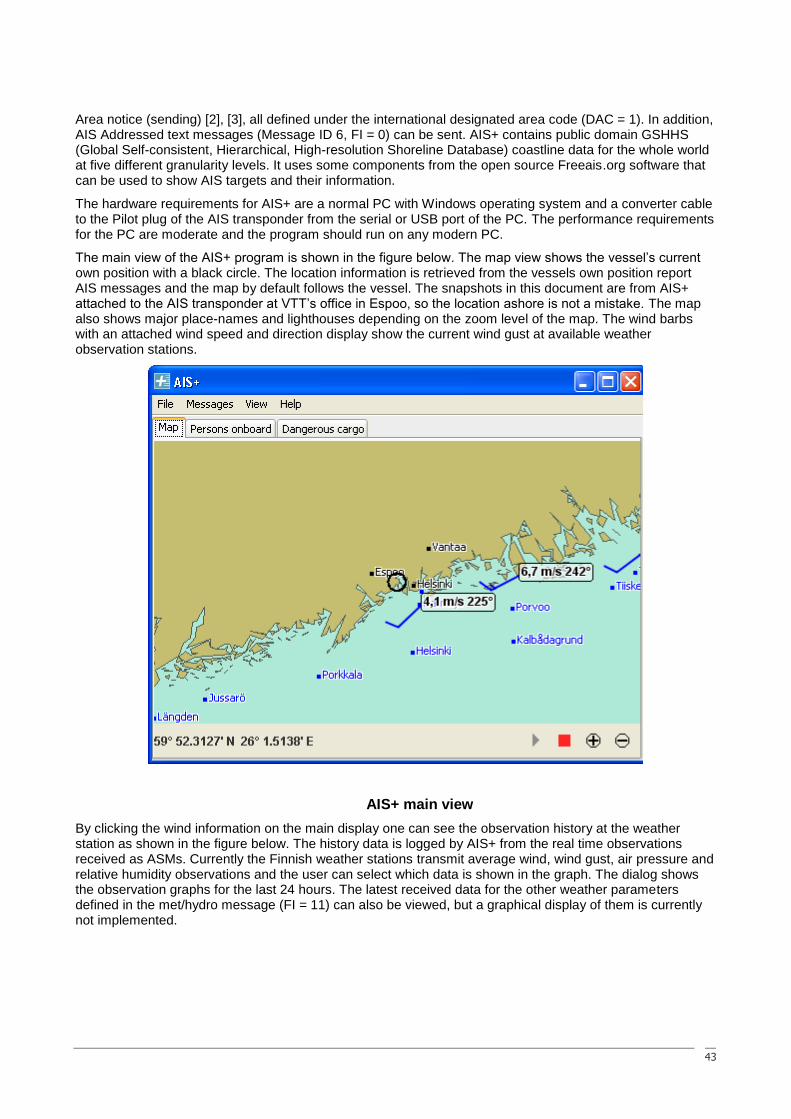
43
Area notice (sending) [2], [3], all defined under the international designated area code (DAC = 1). In addition, AIS Addressed text messages (Message ID 6, FI = 0) can be sent. AIS+ contains public domain GSHHS (Global Self-consistent, Hierarchical, High-resolution Shoreline Database) coastline data for the whole world at five different granularity levels. It uses some components from the open source Freeais.org software that can be used to show AIS targets and their information.
The hardware requirements for AIS+ are a normal PC with Windows operating system and a converter cable to the Pilot plug of the AIS transponder from the serial or USB port of the PC. The performance requirements for the PC are moderate and the program should run on any modern PC.
The main view of the AIS+ program is shown in the figure below. The map view shows the vessel‘s current own position with a black circle. The location information is retrieved from the vessels own position report AIS messages and the map by default follows the vessel. The snapshots in this document are from AIS+ attached to the AIS transponder at VTT‘s office in Espoo, so the location ashore is not a mistake. The map also shows major place-names and lighthouses depending on the zoom level of the map. The wind barbs with an attached wind speed and direction display show the current wind gust at available weather observation stations.
AIS+ main view
By clicking the wind information on the main display one can see the observation history at the weather station as shown in the figure below. The history data is logged by AIS+ from the real time observations received as ASMs. Currently the Finnish weather stations transmit average wind, wind gust, air pressure and relative humidity observations and the user can select which data is shown in the graph. The dialog shows the observation graphs for the last 24 hours. The latest received data for the other weather parameters defined in the met/hydro message (FI = 11) can also be viewed, but a graphical display of them is currently not implemented.
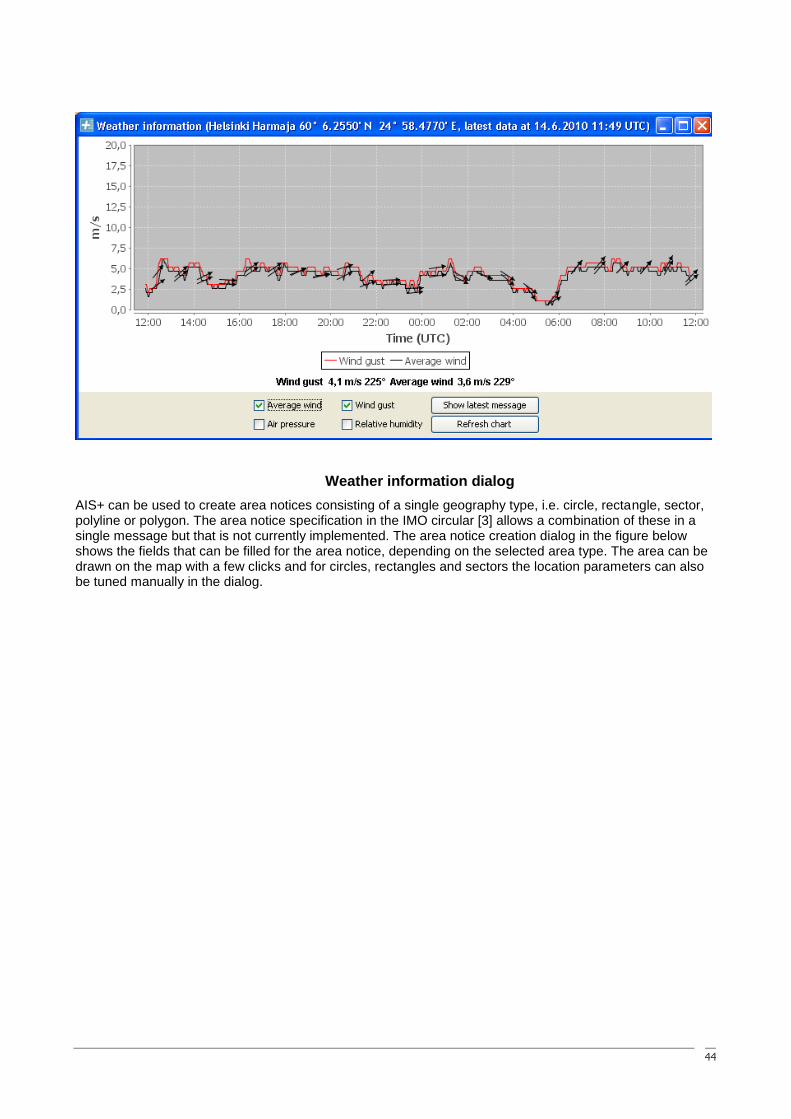
44
Weather information dialog
AIS+ can be used to create area notices consisting of a single geography type, i.e. circle, rectangle, sector, polyline or polygon. The area notice specification in the IMO circular [3] allows a combination of these in a single message but that is not currently implemented. The area notice creation dialog in the figure below shows the fields that can be filled for the area notice, depending on the selected area type. The area can be drawn on the map with a few clicks and for circles, rectangles and sectors the location parameters can also be tuned manually in the dialog.
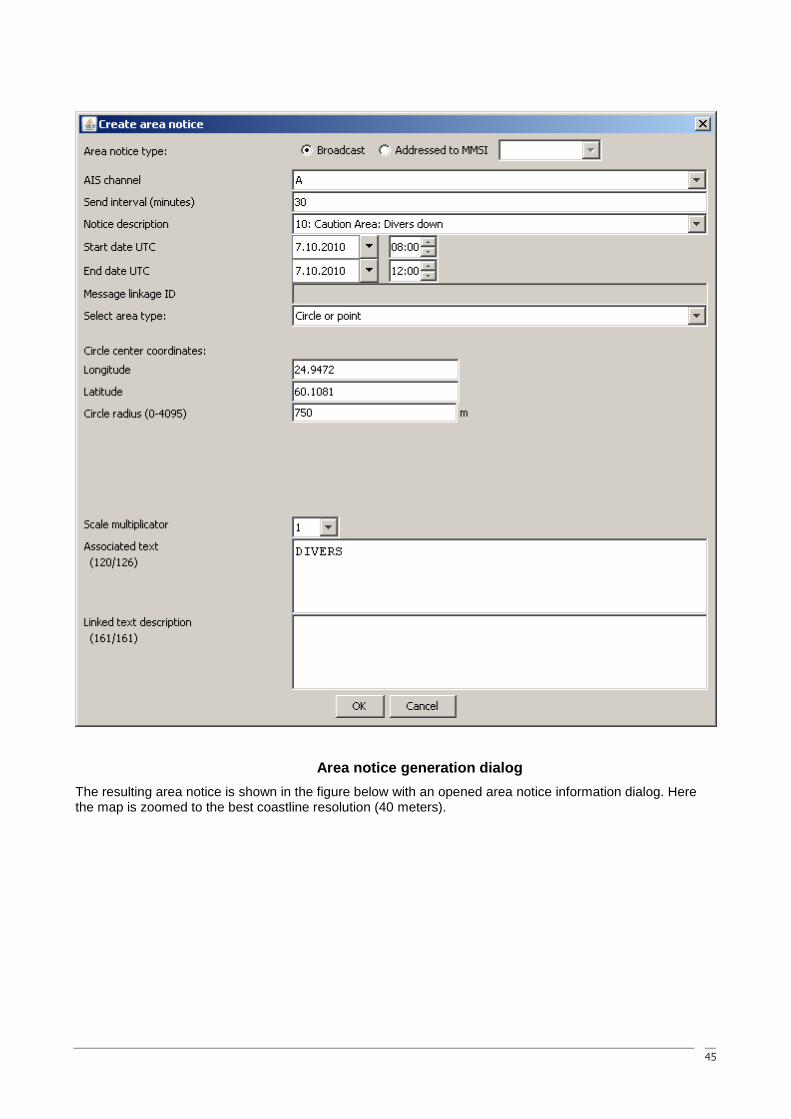
45
Area notice generation dialog
The resulting area notice is shown in the figure below with an opened area notice information dialog. Here the map is zoomed to the best coastline resolution (40 meters).
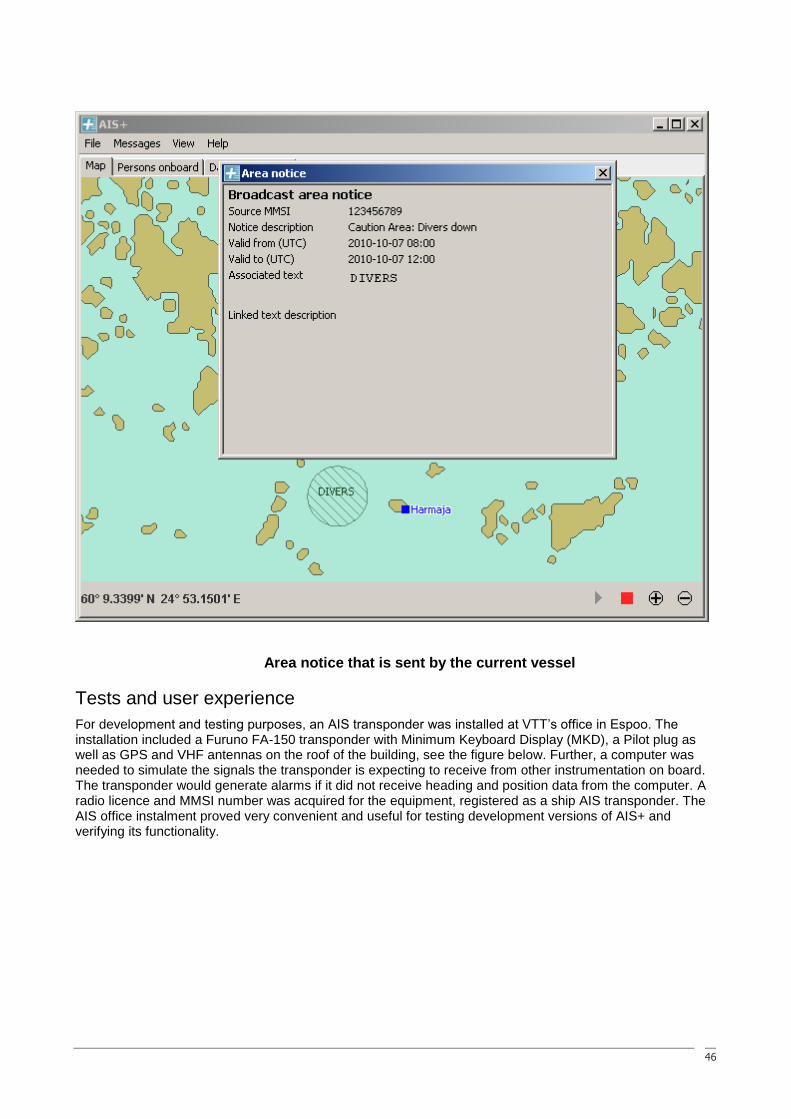
46
Area notice that is sent by the current vessel
Tests and user experience
For development and testing purposes, an AIS transponder was installed at VTT‘s office in Espoo. The installation included a Furuno FA-150 transponder with Minimum Keyboard Display (MKD), a Pilot plug as well as GPS and VHF antennas on the roof of the building, see the figure below. Further, a computer was needed to simulate the signals the transponder is expecting to receive from other instrumentation on board. The transponder would generate alarms if it did not receive heading and position data from the computer. A radio licence and MMSI number was acquired for the equipment, registered as a ship AIS transponder. The AIS office instalment proved very convenient and useful for testing development versions of AIS+ and verifying its functionality.
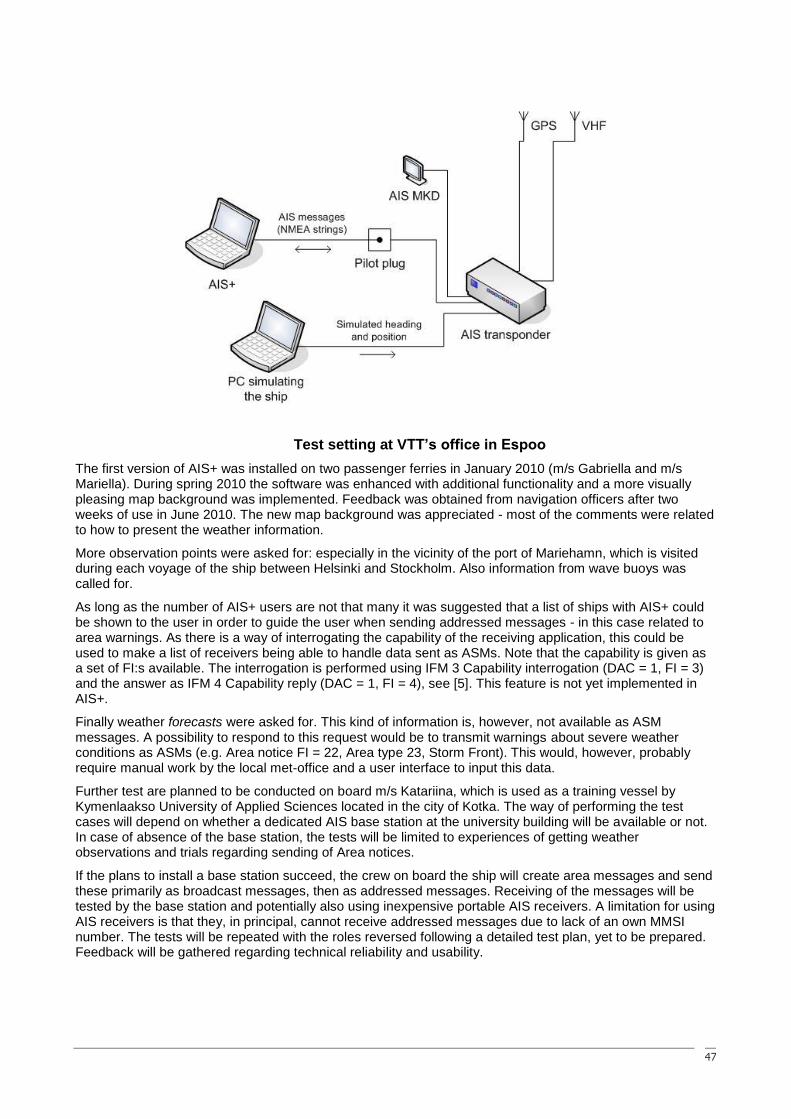
47
Test setting at VTT’s office in Espoo
The first version of AIS+ was installed on two passenger ferries in January 2010 (m/s Gabriella and m/s Mariella). During spring 2010 the software was enhanced with additional functionality and a more visually pleasing map background was implemented. Feedback was obtained from navigation officers after two weeks of use in June 2010. The new map background was appreciated - most of the comments were related to how to present the weather information.
More observation points were asked for: especially in the vicinity of the port of Mariehamn, which is visited during each voyage of the ship between Helsinki and Stockholm. Also information from wave buoys was called for.
As long as the number of AIS+ users are not that many it was suggested that a list of ships with AIS+ could be shown to the user in order to guide the user when sending addressed messages - in this case related to area warnings. As there is a way of interrogating the capability of the receiving application, this could be used to make a list of receivers being able to handle data sent as ASMs. Note that the capability is given as a set of FI:s available. The interrogation is performed using IFM 3 Capability interrogation (DAC = 1, FI = 3) and the answer as IFM 4 Capability reply (DAC = 1, FI = 4), see [5]. This feature is not yet implemented in AIS+.
Finally weather forecasts were asked for. This kind of information is, however, not available as ASM messages. A possibility to respond to this request would be to transmit warnings about severe weather conditions as ASMs (e.g. Area notice FI = 22, Area type 23, Storm Front). This would, however, probably require manual work by the local met-office and a user interface to input this data.
Further test are planned to be conducted on board m/s Katariina, which is used as a training vessel by Kymenlaakso University of Applied Sciences located in the city of Kotka. The way of performing the test cases will depend on whether a dedicated AIS base station at the university building will be available or not. In case of absence of the base station, the tests will be limited to experiences of getting weather observations and trials regarding sending of Area notices.
If the plans to install a base station succeed, the crew on board the ship will create area messages and send these primarily as broadcast messages, then as addressed messages. Receiving of the messages will be tested by the base station and potentially also using inexpensive portable AIS receivers. A limitation for using AIS receivers is that they, in principal, cannot receive addressed messages due to lack of an own MMSI number. The tests will be repeated with the roles reversed following a detailed test plan, yet to be prepared. Feedback will be gathered regarding technical reliability and usability.
48
Conclusions and future development
Connecting a PC with dedicated AIS+ software to the AIS transponder has proved to be a practical solution to enhance AIS messaging. It provides a low-cost and convenient option for ships to take new features of AIS, such as ASMs, into use at an early stage. It is fairly straight-forward to further expand the features of AIS+ using the existing platform, if needed. The PC keyboard also facilitates data input, compared to the MKD and ECDIS user interfaces.
The users have found AIS+ easy to use. However, to motivate the ships to utilise ASMs, there must be enough services available. Only when the ship crews find ASMs to truly make their work easier, will the use increase. Hopefully the authorities will realise the potential of ASMs in making the communication with ships more efficient, upgrading the services provided to ships and contributing to safer seafaring. Concrete examples would be to upgrade the shore side capabilities to support ship reporting using ASMs as well as sending navigational warnings and current weather information using ASMs.
The focus on further efforts will be to encourage authorities to provide services through AIS ASM. This will be accomplished through limited trials showing both the technical capabilities and the user processes to utilise this communication means for the services and warnings. Also issues like how to handle multiple Presentation Interfaces (e.g. an ECDIS and AIS+) connected to an AIS transponder should be investigated and resolved.
The set of implemented ASMs in AIS+ is still very limited. This set will be enhanced depending on funding and user requests. Also ideas to enhance AIS+ to be used as a User Interface to input all Voyage related data to the AIS transponder, will be considered.
VTT has also plans to use AIS+ as a test bench for development of portrayal guidelines for ASM information.
The AIS+ development can be followed on the web page www.aisplus.vtt.fi.
Acknowledgements
The AIS+ software development has been funded by VTT and the Baltic Sea Action Group. Other contributors are IBM, the Finnish Meteorological Institute and the Finnish Transport Agency. The test AIS transponder and its installation at VTT office were granted by Furuno Finland Oy.
References
[1] Porthin, M., Zetterberg, R. and Sonninen, S. "AIS Binary Messages – Developments in the Baltic and progress in IMO", 17th Conference of the International Association of Marine Aids to Navigation and Lighthouse Authorities (IALA-AISM), Cape Town, South Africa, 2010. Available at http://www.aisplus.vtt.fi/.
[2] Guidance on the application of AIS binary messages, IMO, SN/Circ.236, 2004.
[3] Guidance on the use of AIS Application-Specific Messages, IMO, SN.1/Circ.289, 2010.
[4] Performance standards for the presentation of navigation-related information on shipborne navigational displays, IMO, Resolution MSC.191(79), 2004.
[5] Technical characteristics for an automatic identification system using time division multiple access in the VHF maritime mobile band, Recommendation ITU-R M.1371-4, 2010.
49
Testing of AIS Application-Specific Messages to Improve U.S. Coast Guard VTS Operations
CDR William Burns, USCG Headquarters, Washington, DC USA Dr. Gregory Johnson, Alion Science and Technology, New London, CT USA
Irene Gonin, USCG Research and Development Center, New London, CT USA Dr. Lee Alexander, University of New Hampshire, Durham, New Hampshire USA
Abstract
The United States Coast Guard (USCG) Vessel Traffic Service (VTS) is using Automatic Identification System (AIS) Application-Specific Messages (ASM) to benefit mariners and VTS operators. This paper describes the message development, implementation process, uses, results from operational testing, future goals, and implications of AIS ASMs at USCG VTSs.
Introduction
The Automatic Identification System (AIS) is an autonomous and continuous broadcast system that exchanges maritime safety/security information between participating vessels and shore stations. In addition to providing a means for maritime administrations to effectively track the movement of vessels in coastal and inland waters, AIS can be a means to transmit information to ships in port or underway that contributes to safety-of-navigation and protection of the environment. This includes meteorological and hydrographic data, carriage of dangerous cargos, safety and security zones, status of locks and aids-to-navigation, and other port/waterway safety information. As far back as 10 years ago, specific content was defined in locations of small closed communities. For instance, the Saint Lawrence Seaway and United States Coast Guard (USCG) Vessel Traffic Service (VTS) Saint Mary‘s River, Sault Saint Marie, Michigan are still broadcasting metrological and hydrological, vessel/lock scheduling, and Seaway specific information following ITU-R Recommendation 1371-1.
The International Maritime Organization (IMO) has had a major role in guiding the development of AIS internationally. In May 2004, IMO issued Safety of Navigation Circular (SN/Circ. 236), ―Guidance on the Application of AIS Binary Messages‖ [1] in which seven messages were specified and were to be used for a trial period of four (4) years with no change. In addition, four (4) additional system-related messages related to the operation of the system were identified in Recommendation ITU-R M.1371-2. More recently (on 2 June 2010) IMO issued two ASM related circulars: SN.1/Circ.290, ―Guidance for the Presentation and Display of AIS Application-Specific Messages Information‖ [2] and SN.1/Circ.289, ―Guidance on the Use of AIS Application-specific Messages‖ [3]. The last circular will revoke SN/Circ.236 on 1 January 2013.
While AIS is a highly effective means of providing information to a VTS Center about vessel position and identification, it can also be used as a VTS tool for communication by utilizing the transmit capability which includes both broadcasts to all users within range and addressed messages to specific users. The current AIS specification, ITU-1371-4 [4] defines 27 different AIS messages shown in Table 1. Some of these message types can be grouped into categories applicable to AIS transmit: message types 16, 20, 22, and 23 can be considered telecommands that can be used by a VTS for channel management; message types 12, 13, and 14 can be used for safety-related text messages; and message types 6, 7, 8, 21, 25, and 26 are all application-specific messages that can be used for information transfer. The messages listed in bold have been used in the testing discussed in this report. In the United States, it is intended when information is transmitted from shore-side AIS base stations that Application-Specific Messages (ASMs) be used as part of an expanded VTS provided by the USCG.
Table 1: AIS message types (those in bold are part of this testing).
ID# AIS Message Description ID# AIS Message Description
1,2,3 Position Reports – autonomous, assigned, or interrogated 17 Binary Message – DGNSS Correction
4 Base Station Report – UTC/date, position, slot nr. 18,19 Class B Reports – position & extended
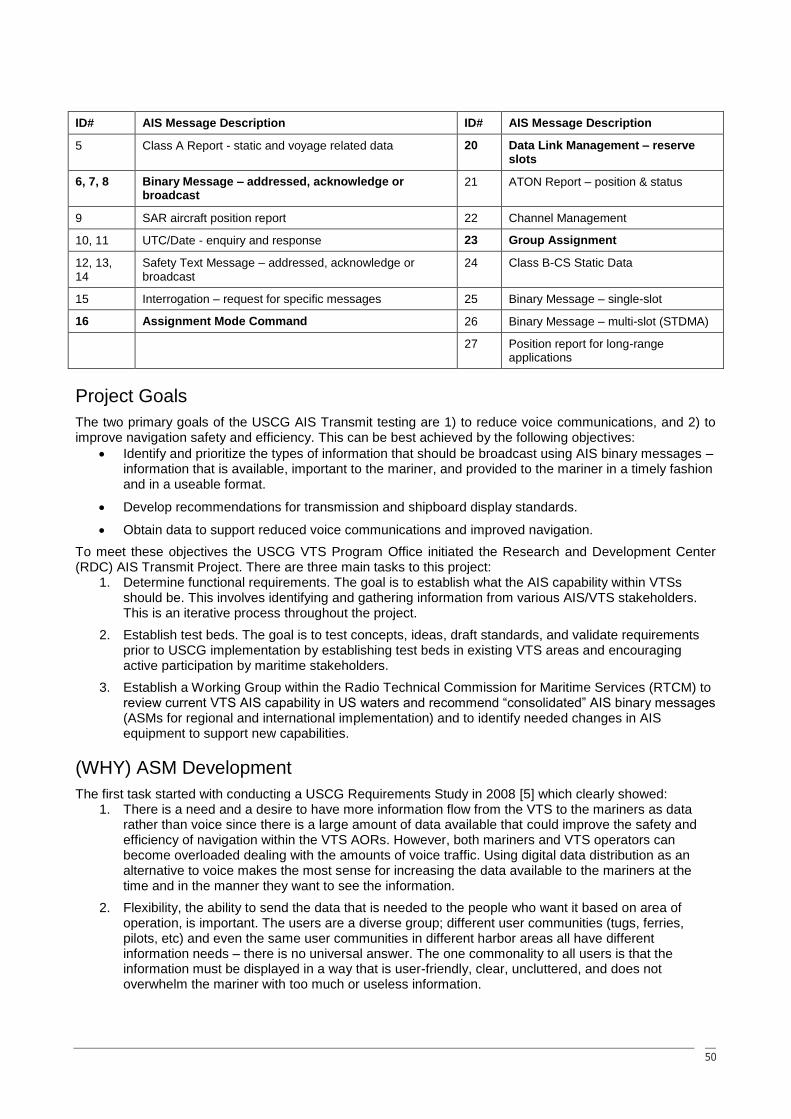
50
ID# AIS Message Description ID# AIS Message Description
5 Class A Report - static and voyage related data 20 Data Link Management – reserve slots
6, 7, 8 Binary Message – addressed, acknowledge or broadcast
21 ATON Report – position & status
9 SAR aircraft position report 22 Channel Management
10, 11 UTC/Date - enquiry and response 23 Group Assignment
12, 13, 14
Safety Text Message – addressed, acknowledge or broadcast
24 Class B-CS Static Data
15 Interrogation – request for specific messages 25 Binary Message – single-slot
16 Assignment Mode Command 26 Binary Message – multi-slot (STDMA)
27 Position report for long-range applications
Project Goals
The two primary goals of the USCG AIS Transmit testing are 1) to reduce voice communications, and 2) to improve navigation safety and efficiency. This can be best achieved by the following objectives:
Identify and prioritize the types of information that should be broadcast using AIS binary messages – information that is available, important to the mariner, and provided to the mariner in a timely fashion and in a useable format.
Develop recommendations for transmission and shipboard display standards.
Obtain data to support reduced voice communications and improved navigation.
To meet these objectives the USCG VTS Program Office initiated the Research and Development Center (RDC) AIS Transmit Project. There are three main tasks to this project:
1. Determine functional requirements. The goal is to establish what the AIS capability within VTSs should be. This involves identifying and gathering information from various AIS/VTS stakeholders. This is an iterative process throughout the project.
2. Establish test beds. The goal is to test concepts, ideas, draft standards, and validate requirements prior to USCG implementation by establishing test beds in existing VTS areas and encouraging active participation by maritime stakeholders.
3. Establish a Working Group within the Radio Technical Commission for Maritime Services (RTCM) to review current VTS AIS capability in US waters and recommend ―consolidated‖ AIS binary messages (ASMs for regional and international implementation) and to identify needed changes in AIS equipment to support new capabilities.
(WHY) ASM Development
The first task started with conducting a USCG Requirements Study in 2008 [5] which clearly showed: 1. There is a need and a desire to have more information flow from the VTS to the mariners as data
rather than voice since there is a large amount of data available that could improve the safety and efficiency of navigation within the VTS AORs. However, both mariners and VTS operators can become overloaded dealing with the amounts of voice traffic. Using digital data distribution as an alternative to voice makes the most sense for increasing the data available to the mariners at the time and in the manner they want to see the information.
2. Flexibility, the ability to send the data that is needed to the people who want it based on area of operation, is important. The users are a diverse group; different user communities (tugs, ferries, pilots, etc) and even the same user communities in different harbor areas all have different information needs – there is no universal answer. The one commonality to all users is that the information must be displayed in a way that is user-friendly, clear, uncluttered, and does not overwhelm the mariner with too much or useless information.
51
3. The user needs could not be met with the existing messages types contained in SN/Circ. 236.
4. The most important information types were derived from responses from each user community. These are listed in Table 2, grouped under the three eventual project recommended messages.
Table 2: Data Desired by Users and VTSs.
Environmental Data Area Notice Waterways Management Information
Tides (now and predicted) AtoN outages / changes Lock order
Water levels Ice advisories Bridge openings/closings
Water current velocity (speed and direction)
Dredge locations / information Procession order for narrow channels
Visibility / fog Security zone locations / information
Air and water temperature Restricted operation areas due to low visibility or security
Emergency Messages
Wind speed and direction Location and information on marine events / regattas
Precipitation Anchorage management
These conclusions drove design considerations for the development and testing of ASMs. Phase I of the project focused on the development and testing an Environmental Message (EM) ASM to transmit environmental data (tides, currents, etc). Phase II added an Area Notice (AN) ASM as well as support for demonstrations in Stellwagen Bank and the Columbia River. Phase III added a Waterways Management Message (WMM) ASM and telecommands.
This approach led to the development of the following three messages; the first two messages (EM and AN) are currently included in the new circular SN.1/Circ.289.
Environmental Message (EM)
The Environmental Message accommodates a wide variety of environmental data from throughout the U.S., including: current flow, water level, water temperature, visibility, and air gap. The message has the ability to provide both real-time and forecast data. The goal was to accommodate the information transfer requirements of all of the stakeholders: National Oceanic and Atmospheric Administration (NOAA) Physical Oceanographic Real-Time System (PORTS), the NOAA National Data Buoy Center (NDBC), and the U.S. Army Corps of Engineers (USACE). In order to maximize flexibility, this message can be used to transmit from 1 to 8 sensor reports (a 1 sensor report uses 1 slot while a message with 8 sensor reports requires 5 slots). These sensor reports can be data from one location or from multiple locations. In addition, the data does not need to be sent at the same update rate allowing data that changes more rapidly to be sent more often than slowly changing data. Static data such as sensor position can be sent even less frequently. The flexible message structure allows a message to be created that transmits just the data elements that are available rather than having to always transmit the same data elements; even if most of them are null data. This flexibility in data composition of the message was not possible with the original met-hydro message in SN/Circ. 236.
Area Notice (AN)
The purpose of the AN is to transmit information that pertains to a region or area; for example, a security zone, an area of fog or dredging operations. The areas that are being defined can be circles, rectangles, polygons, or sectors. The AN can also be defined by the union of multiple subareas in order to create larger, more complex areas. The AN can also be defined as a simple point or series of points (polyline). The series of points can be used to create a closed area of arbitrary shape or to define a line.
The intent with an AN is to broadcast dynamic information (i.e. information that is time dependent). These messages are to be used for a specific time period and will automatically timeout at the end of the period. If the AN must be in place longer, then a new AN must be transmitted with a new start and end time. An AN should only be used to convey pertinent time-critical navigation safety information to mariners or authorities, and not as a means to convey information already provided by official nautical charts or publications. This
52
type of message was not included in the original SN/Circ. 236.
Waterways Management Message (WMM)
The WMM can be used to facilitate vessel traffic movement in confined waters. More ―directive‖ than advisory, this message can be broadcast (e.g., information for all ships or a group of ships) or addressed (e.g., information/direction to a single ship). Examples include: lock, gate, narrows, or single passage area. There are two sub-types of this message; 1) for providing a position/name of the waterway feature, and 2) for providing a list of vessels and their sequence order/times. Specific information for each vessel includes: sequence time, direction, and vessel Maritime Mobile Service Identity (MMSI). This type of message was not included in the original SN/Circ. 236; this message was not included in SN/Circ. 289 as it was not completed prior to the cut-off date.
(What) Test Bed Design and Implementation
Back end processes
Defining the ASM‘s is merely the beginning to implementing AIS transmit; processes need to be developed and put into place for message creation, routing, queuing, transmission and monitoring. As part of the AIS Transmit Project, the RDC developed back end processes to manage ASMs. ASMs either need to be created by the VTS operator or data must be retrieved from information providers (e.g. NOAA PORTS). The information and data then needs to be formatted into the ASM based upon standards. Once formatted, messages must be prioritized, geographically identified, and queued. As part of the queuing process, the Very High Frequency (VHF) Data Link (VDL) needs to be monitored. A result of this monitoring is feedback into the queuing process to adjust message output. Finally, messages are ready to be sent to the AIS base station or AIS Aid to Navigation (ATON) for transmission.
The test bed implementation of these processes is shown in the data flowchart in Figure 1 (left). The activities of each process are listed in blue text; the red text highlights data flow that can bypass the queuing process; the data exchange formats are listed in black text. Starting at the top of the flowchart, the data for EM ASMs reside in the NOAA PORTS database. The Fetcher/Formatter (FF) process requests the data from the PORTS database using Web Services every 3 minutes and receives the data in XML format. The response is error-checked and if valid the data is parsed and converted into the ASM (binary) format. This binary data is then sent to the Queue Manager (QM) along with various bits of metadata in a comma-separated value (CSV) format. The QM receives the sensor reports, assembles them into complete AIS messages, and puts them into a transmit queue using the queuing/prioritization rules that have been user-specified. The AIS Radio Interface (ARI) process checks the QM for messages to transmit on a 1-minute interval. The QM responds with only the messages that can be transmitted (based on VDL loading estimates) in the next minute. ARI packages the ASMs into NMEA sentences (!xxBBM) [7], connects to the AIS Base Station, sends the NMEA sentences, and records the acknowledgements (!BSABK).
While the EM ASMs are automatically created using data from the database, other ASMs (AN and WMM) require human interaction to create. This is also shown on the left side of the flowchart. For the project, Transview (TV32) is used as the Geographic Information System (GIS) to graphically create the Area Notices and/or Waterways Management Messages. Once the messages are created and tested on the GIS, TV32 passes them off to the VTS Info Manager (VIM). The VIM manages the repetition of the messages; sending them to the QM for transmission at the desired repeat interval. VIM can also be used to create and send telecommands (such as to change an AIS radio‘s transmission interval).
The data flow shown in Figure 1 (left) is what has been implemented in the various test beds. This was developed in order to test processes and evaluate effectiveness. We are now in the middle of a transition to a slightly different data flow architecture that allows for integration with the planned Nationwide AIS (NAIS) system implementation. This is shown in Figure 1 (right). One of the major changes is a shift to standardize the data exchange format throughout the system using the NMEA 4.0 tag block structure [7]. Additionally, some of the processes have been combined and some responsibilities transferred. In the new architecture NOAA will supply the PORTS data already assembled into complete AIS ASMs, encapsulated in a NMEA sentence (!xxBBM). This process is shown as a separate NOAA AIS XMT Filter block in the flowchart but will be transparent to the end-user (the orange dashed line indicates the boundary between NOAA and the users. Parts of the functionality of the FF, the QM, and the ARI are now consolidated in the new AIS
53
Transmit Message Queue (AISQ). AISQ will request data from NOAA at 3 minute intervals, receive the data as !xxBBM sentences, and then decode the sentences to parse the data for validation and to use some of the data to aid in the routing and prioritizations decisions. AISQ will then put the sentences into the appropriate transmit queues; adding TAG blocks to each sentence to specify the message‘s priority and the geographic area it should be transmitted. Each minute, the minute‘s worth of data will be pushed from the transmit queues to the ICAN DataSwitch (DS) for routing to the base stations. The DS will use the priority and geographic area Tag Blocks to ensure the sentences are routed to the correct AIS base stations and given the specified priority in routing.
Figure 1: Data Flow Diagrams: AIS transmit test bed (left), AIS transmit-NAIS integration (right)
GUI (for creation and display)
One of the project tasks includes encouraging commercial vendors to implement the support for the new messages within their Electronic Charting System (ECS) packages. Unfortunately, this has not been totally successful. To date there are no commercial software packages that implement the entire standard. ARINC‘s PilotMate software used in Tampa and LA/LB supports the EM specification but not the others. The EM decode and display capability was added specifically to support the Tampa Bay Pilots. Since the Tampa Bay Pilots are not interested or able to fund further development ARINC has no plans to further implement ASM binary message decodes. There are also several other commercial companies who have participated in the RTCM Working Group and have indicated they are in the process of implementing support (ICAN and Transas) though this capability has not been verified to date. Another company (Rose Point) has also recently indicated they have implemented the AN and EM specifications; but again, this has not been verified to date.
In order to enable the research and proof of concept development to continue in the absence of commercial ECS packages for ASM binary message decoding, government applications have been developed. Alion developed a simple EM Decoder that does a complete decode and text display of the EM data. This application runs in a pass-thru mode allowing it to run in parallel with other software that wants to use the AIS data stream – whether it originates from a serial or network connection. The other main software package is TransView, or TV32, which is a GIS software package developed and implemented by the Volpe National Transportation Systems Center to provide real-time display of vessel tracking and navigation information. TV32 provides full-featured creation as well as decoding and display of AIS EM, AN, and
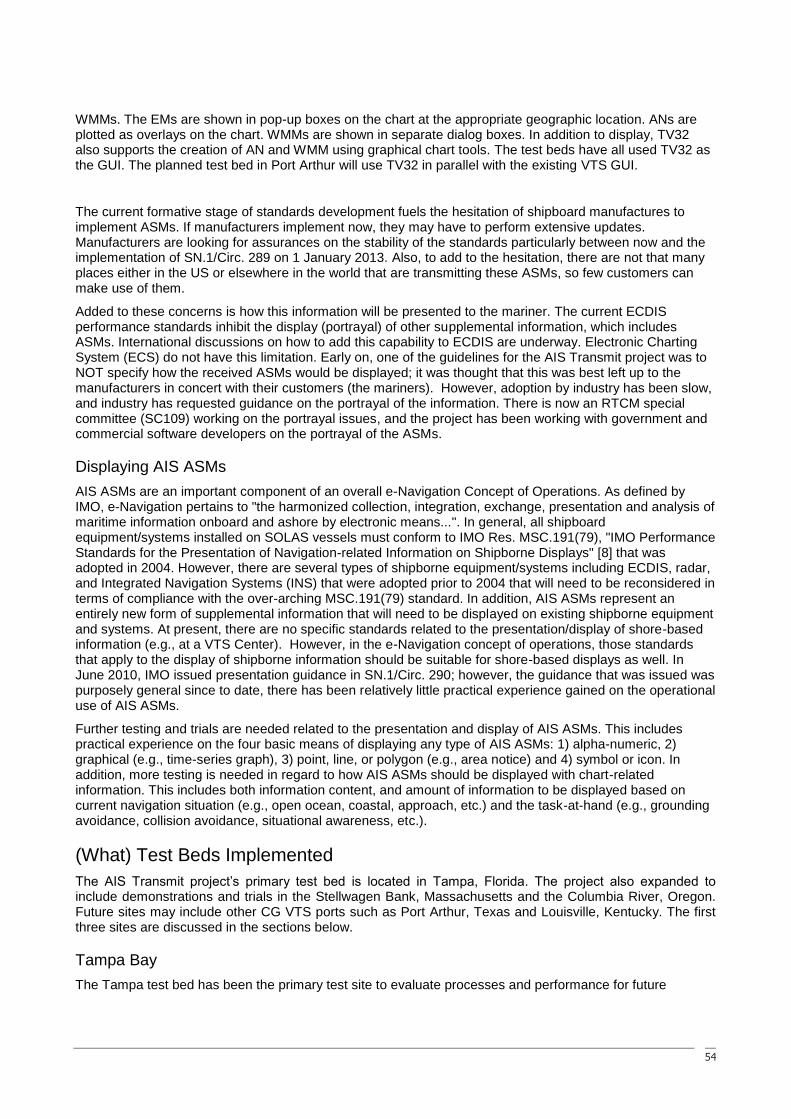
54
WMMs. The EMs are shown in pop-up boxes on the chart at the appropriate geographic location. ANs are plotted as overlays on the chart. WMMs are shown in separate dialog boxes. In addition to display, TV32 also supports the creation of AN and WMM using graphical chart tools. The test beds have all used TV32 as the GUI. The planned test bed in Port Arthur will use TV32 in parallel with the existing VTS GUI.
The current formative stage of standards development fuels the hesitation of shipboard manufactures to implement ASMs. If manufacturers implement now, they may have to perform extensive updates. Manufacturers are looking for assurances on the stability of the standards particularly between now and the implementation of SN.1/Circ. 289 on 1 January 2013. Also, to add to the hesitation, there are not that many places either in the US or elsewhere in the world that are transmitting these ASMs, so few customers can make use of them.
Added to these concerns is how this information will be presented to the mariner. The current ECDIS performance standards inhibit the display (portrayal) of other supplemental information, which includes ASMs. International discussions on how to add this capability to ECDIS are underway. Electronic Charting System (ECS) do not have this limitation. Early on, one of the guidelines for the AIS Transmit project was to NOT specify how the received ASMs would be displayed; it was thought that this was best left up to the manufacturers in concert with their customers (the mariners). However, adoption by industry has been slow, and industry has requested guidance on the portrayal of the information. There is now an RTCM special committee (SC109) working on the portrayal issues, and the project has been working with government and commercial software developers on the portrayal of the ASMs.
Displaying AIS ASMs
AIS ASMs are an important component of an overall e-Navigation Concept of Operations. As defined by IMO, e-Navigation pertains to "the harmonized collection, integration, exchange, presentation and analysis of maritime information onboard and ashore by electronic means...". In general, all shipboard equipment/systems installed on SOLAS vessels must conform to IMO Res. MSC.191(79), "IMO Performance Standards for the Presentation of Navigation-related Information on Shipborne Displays" [8] that was adopted in 2004. However, there are several types of shipborne equipment/systems including ECDIS, radar, and Integrated Navigation Systems (INS) that were adopted prior to 2004 that will need to be reconsidered in terms of compliance with the over-arching MSC.191(79) standard. In addition, AIS ASMs represent an entirely new form of supplemental information that will need to be displayed on existing shipborne equipment and systems. At present, there are no specific standards related to the presentation/display of shore-based information (e.g., at a VTS Center). However, in the e-Navigation concept of operations, those standards that apply to the display of shipborne information should be suitable for shore-based displays as well. In June 2010, IMO issued presentation guidance in SN.1/Circ. 290; however, the guidance that was issued was purposely general since to date, there has been relatively little practical experience gained on the operational use of AIS ASMs.
Further testing and trials are needed related to the presentation and display of AIS ASMs. This includes practical experience on the four basic means of displaying any type of AIS ASMs: 1) alpha-numeric, 2) graphical (e.g., time-series graph), 3) point, line, or polygon (e.g., area notice) and 4) symbol or icon. In addition, more testing is needed in regard to how AIS ASMs should be displayed with chart-related information. This includes both information content, and amount of information to be displayed based on current navigation situation (e.g., open ocean, coastal, approach, etc.) and the task-at-hand (e.g., grounding avoidance, collision avoidance, situational awareness, etc.).
(What) Test Beds Implemented
The AIS Transmit project‘s primary test bed is located in Tampa, Florida. The project also expanded to include demonstrations and trials in the Stellwagen Bank, Massachusetts and the Columbia River, Oregon. Future sites may include other CG VTS ports such as Port Arthur, Texas and Louisville, Kentucky. The first three sites are discussed in the sections below.
Tampa Bay
The Tampa test bed has been the primary test site to evaluate processes and performance for future
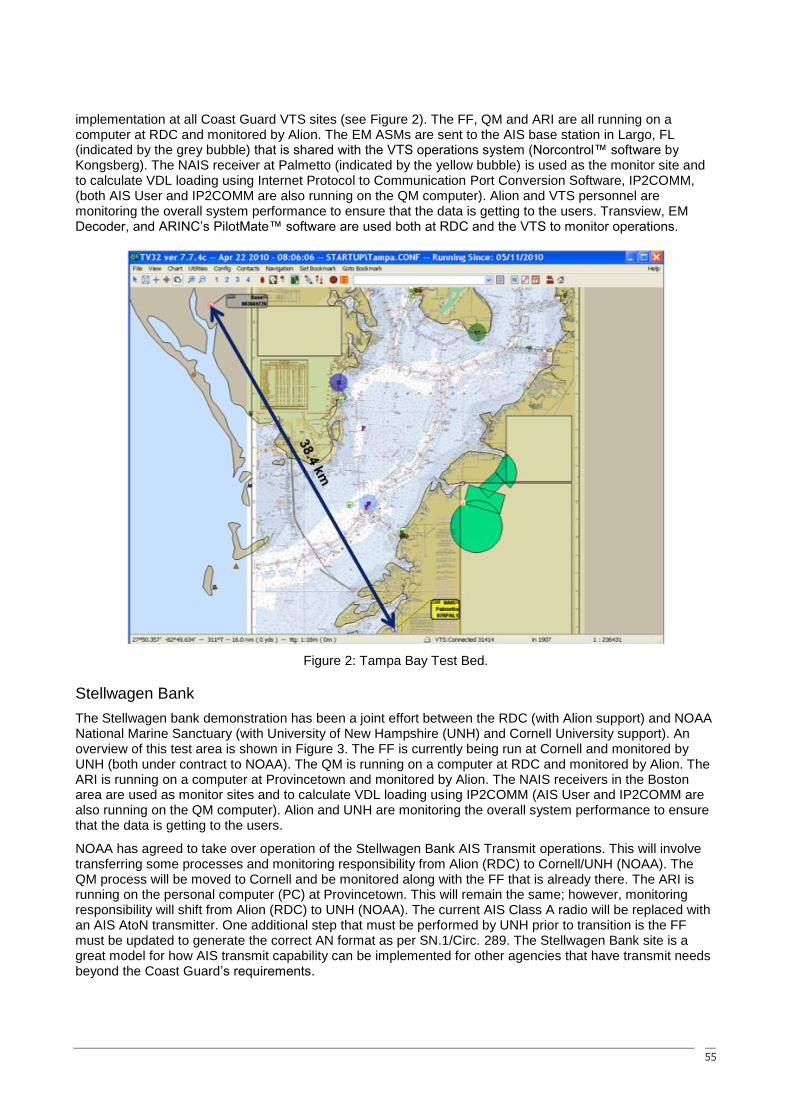
55
implementation at all Coast Guard VTS sites (see Figure 2). The FF, QM and ARI are all running on a computer at RDC and monitored by Alion. The EM ASMs are sent to the AIS base station in Largo, FL (indicated by the grey bubble) that is shared with the VTS operations system (Norcontrol™ software by Kongsberg). The NAIS receiver at Palmetto (indicated by the yellow bubble) is used as the monitor site and to calculate VDL loading using Internet Protocol to Communication Port Conversion Software, IP2COMM, (both AIS User and IP2COMM are also running on the QM computer). Alion and VTS personnel are monitoring the overall system performance to ensure that the data is getting to the users. Transview, EM Decoder, and ARINC‘s PilotMate™ software are used both at RDC and the VTS to monitor operations.
Figure 2: Tampa Bay Test Bed.
Stellwagen Bank
The Stellwagen bank demonstration has been a joint effort between the RDC (with Alion support) and NOAA National Marine Sanctuary (with University of New Hampshire (UNH) and Cornell University support). An overview of this test area is shown in Figure 3. The FF is currently being run at Cornell and monitored by UNH (both under contract to NOAA). The QM is running on a computer at RDC and monitored by Alion. The ARI is running on a computer at Provincetown and monitored by Alion. The NAIS receivers in the Boston area are used as monitor sites and to calculate VDL loading using IP2COMM (AIS User and IP2COMM are also running on the QM computer). Alion and UNH are monitoring the overall system performance to ensure that the data is getting to the users.
NOAA has agreed to take over operation of the Stellwagen Bank AIS Transmit operations. This will involve transferring some processes and monitoring responsibility from Alion (RDC) to Cornell/UNH (NOAA). The QM process will be moved to Cornell and be monitored along with the FF that is already there. The ARI is running on the personal computer (PC) at Provincetown. This will remain the same; however, monitoring responsibility will shift from Alion (RDC) to UNH (NOAA). The current AIS Class A radio will be replaced with an AIS AtoN transmitter. One additional step that must be performed by UNH prior to transition is the FF must be updated to generate the correct AN format as per SN.1/Circ. 289. The Stellwagen Bank site is a great model for how AIS transmit capability can be implemented for other agencies that have transmit needs beyond the Coast Guard‘s requirements.
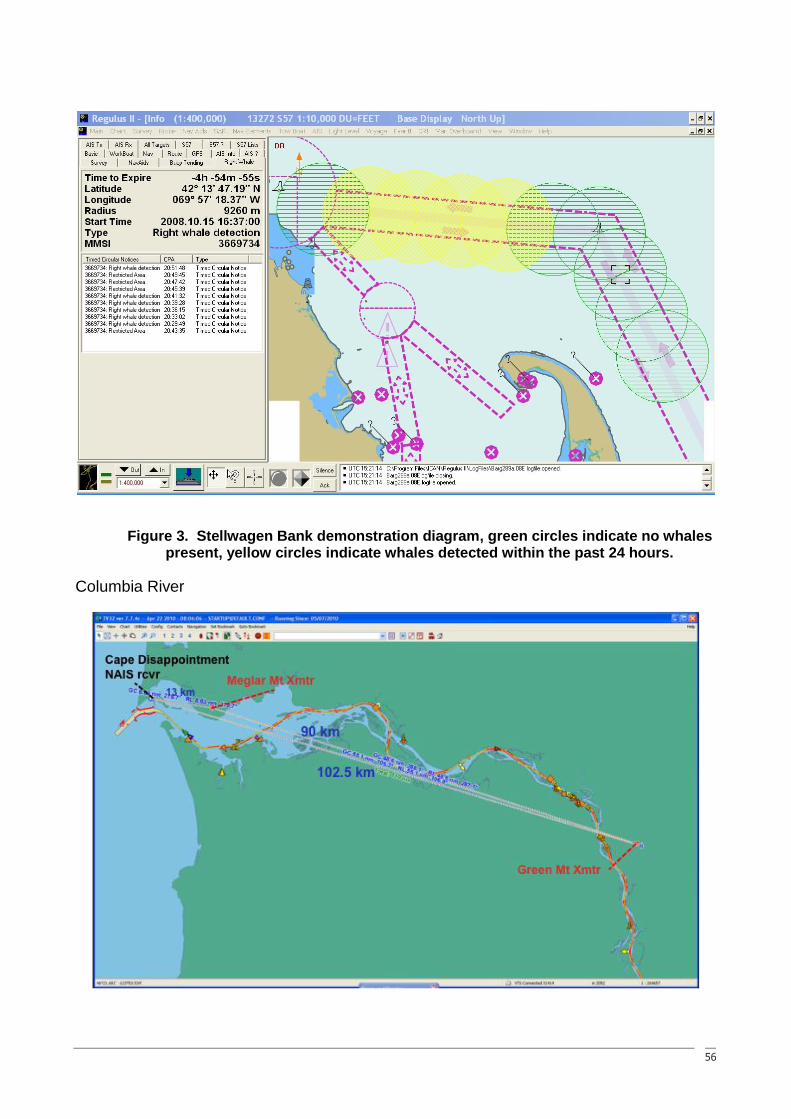
56
Figure 3. Stellwagen Bank demonstration diagram, green circles indicate no whales present, yellow circles indicate whales detected within the past 24 hours.
Columbia River

57
Figure 4. Columbia River demonstration system diagram.
The Columbia River Demonstration has been a joint effort between the RDC (with Alion support) and the Columbia River Pilots (COLRIP) with Volpe Center support. An overview of the test bed is shown in Figure 4. The AIS base stations (Green Mountain and Meglar Mountain) are operated/monitored for the COLRIP by the Volpe Center. The two base stations are operated in repeater mode so that all traffic received is retransmitted. The NAIS receiver at Cape Disappointment is used as the monitor site and to calculate VDL loading using IP2COMM (both AIS User and IP2COMM are also running on the same computer as the QM). Alion and Volpe are monitoring the overall system performance to ensure that the data is getting to the users. TV32 and EM Decoder software are used at RDC to monitor operations.
Originally, the FF, QM and ARI were all running on a computer at RDC and monitored by Alion. The Volpe Center has since taken over the AIS transmit operations in the Columbia River as part of their contracted support to the COLRIP. To enable this transition, the FF, QM, and ARI processes were moved to the COLRIP office and are now monitored by Volpe along with the TV32 installation that is there now. COLRIP and Volpe are responsible for monitoring system performance and VDL loading using data feeds from the two transmitter sites.
(HOW) Evaluation Factors and (HUMAN ELEMENT) Results
Lessons Learned
Some of the key lessons learned to date from the test bed relate to defining what is needed in order to implement AIS transmit. The following are the steps needed.
1. Define the message format to meet the information requirements. The ―payload‖ needs to be defined and standardized so software will understand the message.
2. Create the Message. This could be auto-created from database information (e.g. NOAA PORTS®) or it could be user-created (zones, ordering, etc). In either case the data then gets put into the binary ―payload.‖
3. Route the Message. This involved getting the message to the correct transmitter. For this to happen, there are numerous issues to be managed: Queue process, Rule-based prioritization, Routing to correct transmitter according to area (auto or user-specified), VDL loading monitoring, and Message format (binary for transmission, NMEA/IEC for radio interface, undefined for terrestrial network routing).
Conclusions
VTS Tampa has provided a good development environment for testing AIS binary messages. The environmental message proved to be a good first choice since it is automated and does not require any operator interaction to broadcast the message. This allowed all the software and interfaces to be developed and a user group to receive data without significant training or modifications to procedures at the VTS.
The Tampa Bay Pilots and VTS (USCG and Port Authority) have been very supportive and enthusiastic partners. The test bed is able to create and deliver binary message, which mariners can use aboard ship. This information provides the pilots with better situational awareness of met/hydro conditions in the port area and has been used for decision support (go/no-go decisions). Pilots preferred receiving the PORTS® data through the AIS broadcast vs. phone or Internet. The Tampa Pilots also preferred the text display of the data to a graphical display on their Portable Pilot Units (PPUs).
Part of the evaluation work done with the test beds has been to analyze the VDL loading data. This analysis and the resulting conclusions were documented in an internal report [9]; there is not sufficient space in this paper to repeat more than the conclusions from that report. First, broadcasting PORTS data via AIS every three minutes has very minimal impact to the VDL. It is equivalent to adding one vessel equipped with AIS to the VDL. Second, it is important to pay attention to potential bit-stuffing impacts and mitigations when designing messages, especially if it is desired to have single-slot messages. Third, in regards to the number of slots per message, there is a trade-off between efficiency (gained by using longer messages) vs. probability of receptions (decreases for long messages); the best ―value‖ seems to be to use 3-slot messages. Fourth, the message transmission technique should always be FATDMA not RATDMA as there is greatly increased probability of message delivery with FATDMA, especially on multi-slot messages. This is
58
especially important on base stations in repeat mode since they generate a huge number of transmissions. Fifth, the VDL monitoring location is important. The Competent Authority needs to consider the area and traffic density and maximum loading able to be tolerated in selecting the monitor location. This may need to be at the base station or at different receiver site. And finally, careful consideration and planning needs to be done when using Repeater Mode on a base station as it will increase traffic loading considerably – in the Columbia River many messages are transmitted 5 times!
Future goals, time-line, implications
The future work for the USCG AIS Transmit Project will focus on the following items:
Validate and qualify stakeholder information prioritization and grouping in light of SN.1/Circ.289, technical clarifications, and test bed results.
Define messages approved by the USCG for use in the US in harmonization with the Saint Lawrence Seaway Development Corporation and the Saint Lawrence Seaway Management Corporation. The goal is to limit approved messages to technical clarifications and to develop new messages for information not captured in the approved messages. This should help get manufacturers to start integrating these messages into their products.
Update TV32 to support approved messages.
Expand test beds to VTS Louisville, Kentucky and VTS Port Arthur, Texas.
Complete developmental message testing.
Develop Concept of Operations to define the roles and responsibilities for channel management, VDL load management, and ASM creation, queuing, packaging, transmitting, and monitoring.
Complete operational implementation through defined/accepted GUI.
Link transmission system into the US NAIS backbone.
References
[1] "Guidance on the Application of AIS Binary Messages," IMO, Maritime Safety Committee, London SN/Circ. 236, 28 May 2004.
[2] "Guidance for the Presentation and Display of AIS Application-Specific Messages Information," IMO, Maritime Safety Committee, London SN.1/Circ. 290, 2 June 2010.
[3] "Guidance on the Use of AIS Application-Specific Messages," IMO, Maritime Safety Committee, London SN.1/Circ. 289, 2 June 2010.
[4] "Technical Characteristics for an Automatic Identification System using Time Division Multiple Access in the VHF Maritime Mobile Band," International Telecommunications Union, Radiocommunication Sector ITU-R M.1371-4, April 2010.
[5] G. W. Johnson, et al., "Automatic Identification System Transmit: Functional Requirements Study," U.S. Coast Guard R&D Center, Groton, CT R&DC UDI # 978, 25 July 2008.
[6] AIS Binary (Application-Specific) Messages: International and Regional Use, RTCM 121xx.1, 2010.
[7] "NMEA 0183: Standard for Interfacing Marine Electronic Devices, Version 4.0," National Marine Electronics Association, Severna Park, MDNovember 2008.
[8] "Performance Standards for the Presentation of Navigation-Related information on Shipborne navigational Displays," IMO, Maritime Safety Committee, London MSC.191(79), 6 December 2004.
[9] G. W. Johnson, "AIS Transmit VDL Loading Summary Report," USCG Research & Development Center, New London, CT, Final Deliverable Six under contract GS-23F-0291P, Delivery Order HSCG32-09-F-R00017, 26 May 2010.
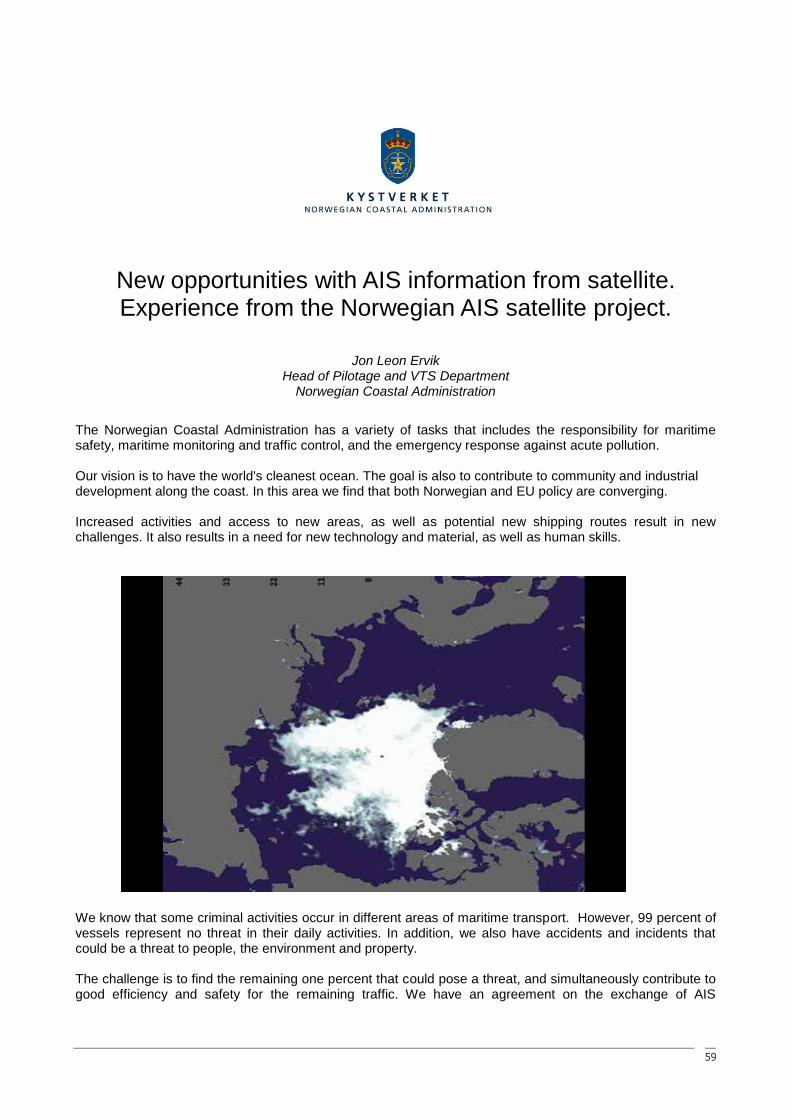
59
New opportunities with AIS information from satellite. Experience from the Norwegian AIS satellite project.
Jon Leon Ervik Head of Pilotage and VTS Department
Norwegian Coastal Administration
The Norwegian Coastal Administration has a variety of tasks that includes the responsibility for maritime safety, maritime monitoring and traffic control, and the emergency response against acute pollution. Our vision is to have the world's cleanest ocean. The goal is also to contribute to community and industrial development along the coast. In this area we find that both Norwegian and EU policy are converging. Increased activities and access to new areas, as well as potential new shipping routes result in new challenges. It also results in a need for new technology and material, as well as human skills.
We know that some criminal activities occur in different areas of maritime transport. However, 99 percent of vessels represent no threat in their daily activities. In addition, we also have accidents and incidents that could be a threat to people, the environment and property. The challenge is to find the remaining one percent that could pose a threat, and simultaneously contribute to good efficiency and safety for the remaining traffic. We have an agreement on the exchange of AIS
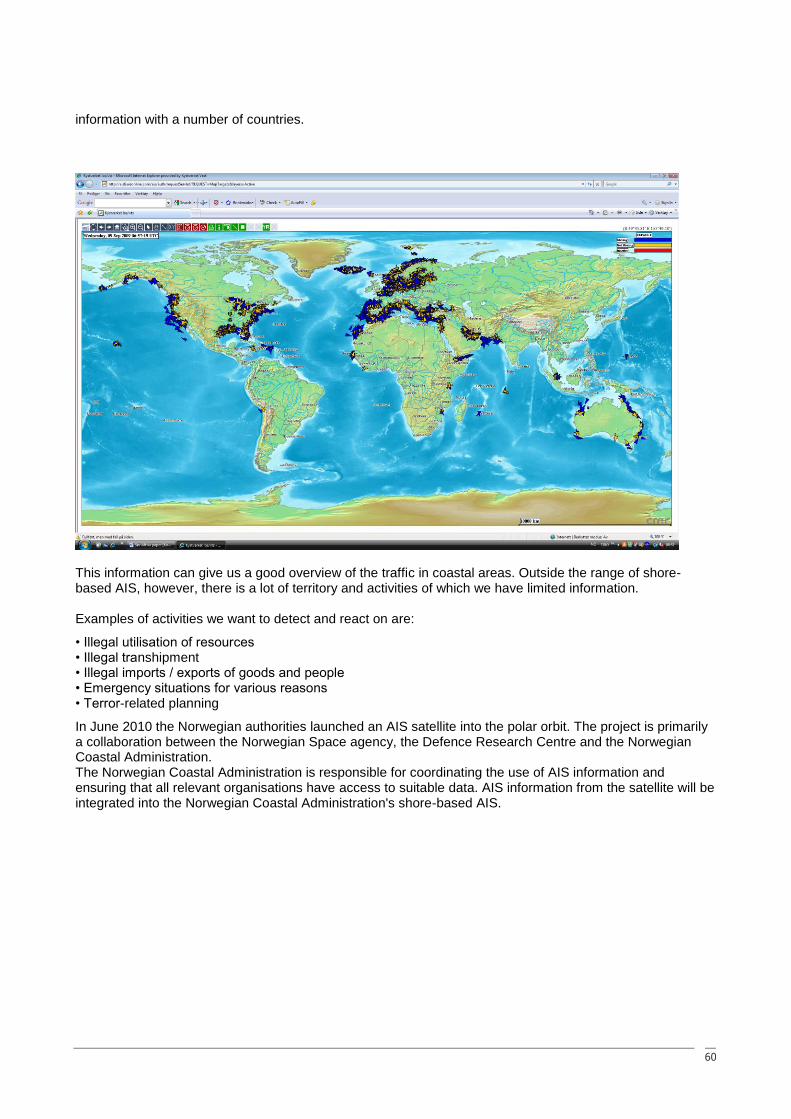
60
information with a number of countries.
This information can give us a good overview of the traffic in coastal areas. Outside the range of shore-based AIS, however, there is a lot of territory and activities of which we have limited information. Examples of activities we want to detect and react on are:
• Illegal utilisation of resources • Illegal transhipment • Illegal imports / exports of goods and people • Emergency situations for various reasons • Terror-related planning
In June 2010 the Norwegian authorities launched an AIS satellite into the polar orbit. The project is primarily a collaboration between the Norwegian Space agency, the Defence Research Centre and the Norwegian Coastal Administration. The Norwegian Coastal Administration is responsible for coordinating the use of AIS information and ensuring that all relevant organisations have access to suitable data. AIS information from the satellite will be integrated into the Norwegian Coastal Administration's shore-based AIS.
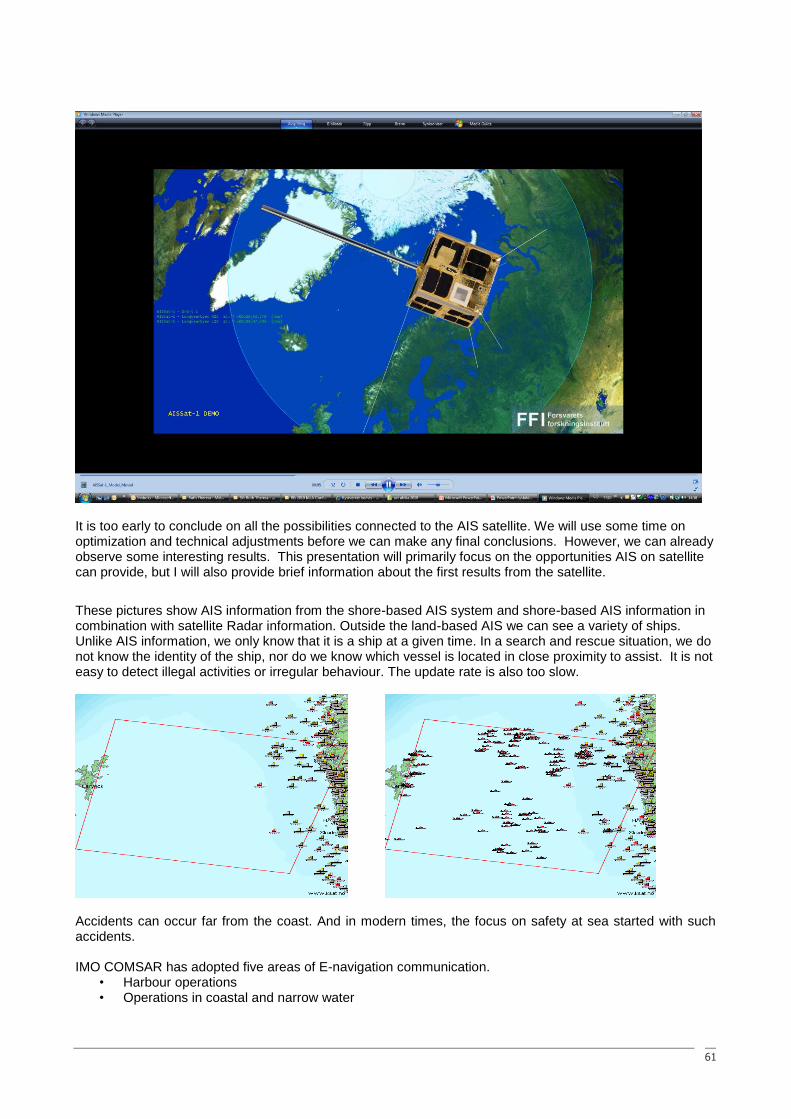
61
It is too early to conclude on all the possibilities connected to the AIS satellite. We will use some time on optimization and technical adjustments before we can make any final conclusions. However, we can already observe some interesting results. This presentation will primarily focus on the opportunities AIS on satellite can provide, but I will also provide brief information about the first results from the satellite.
These pictures show AIS information from the shore-based AIS system and shore-based AIS information in combination with satellite Radar information. Outside the land-based AIS we can see a variety of ships. Unlike AIS information, we only know that it is a ship at a given time. In a search and rescue situation, we do not know the identity of the ship, nor do we know which vessel is located in close proximity to assist. It is not easy to detect illegal activities or irregular behaviour. The update rate is also too slow.
Accidents can occur far from the coast. And in modern times, the focus on safety at sea started with such accidents. IMO COMSAR has adopted five areas of E-navigation communication.
• Harbour operations • Operations in coastal and narrow water
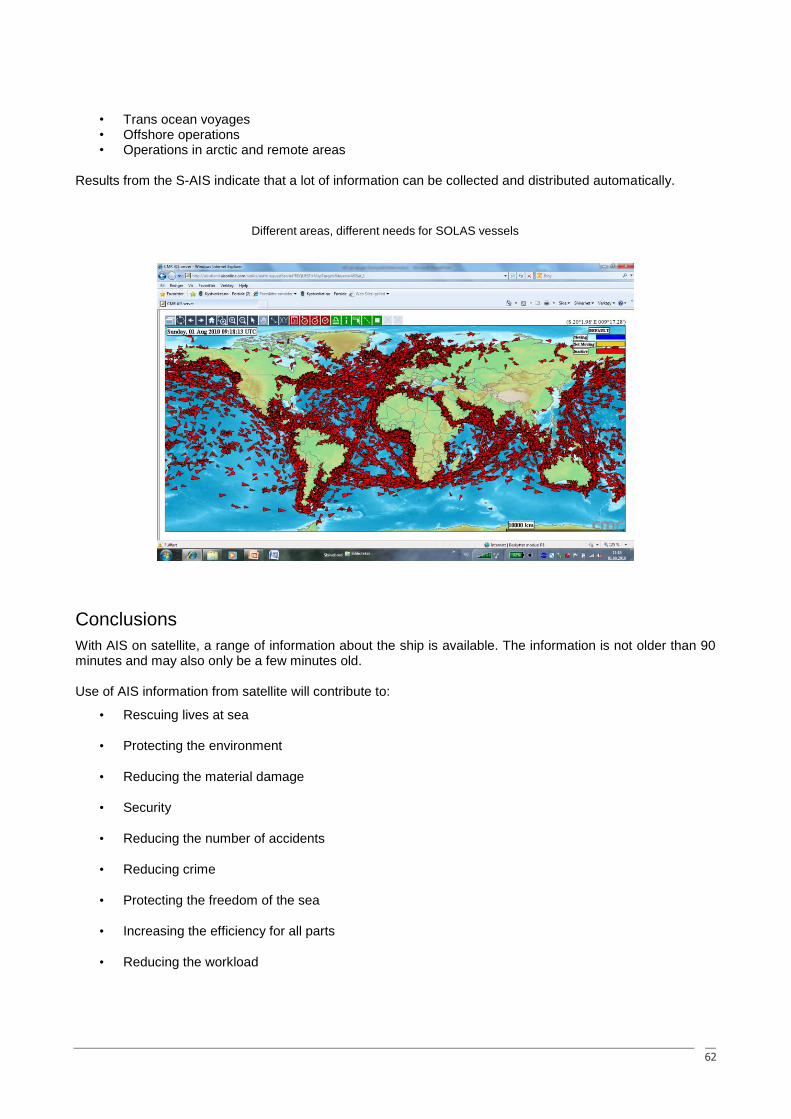
62
• Trans ocean voyages • Offshore operations • Operations in arctic and remote areas
Results from the S-AIS indicate that a lot of information can be collected and distributed automatically.
Different areas, different needs for SOLAS vessels
Conclusions
With AIS on satellite, a range of information about the ship is available. The information is not older than 90 minutes and may also only be a few minutes old. Use of AIS information from satellite will contribute to:
• Rescuing lives at sea
• Protecting the environment
• Reducing the material damage
• Security
• Reducing the number of accidents
• Reducing crime
• Protecting the freedom of the sea
• Increasing the efficiency for all parts
• Reducing the workload

63
And
The use of AIS information from satellite in a future e-navigation concept will reduce the need for manual operations, contribute to efficiency and reduce the need for reporting and communication between vessel and shore.
AIS on satellite, in combination with other information sources, will be an important contribution in many areas. AIS on satellite combined with the Single Window concept infrastructure will also be an important element in the European Union concept, e-maritime.
64
e-Navigation Test Bed Development in Estonia
Leo Käärmann ([email protected]), The Estonian Maritime Administration Aivar Usk ([email protected]), Cybernetica AS
Abstract — This paper presents an overview of the current status of e-Navigation test bed development in Estonia. Short introduction of the Estonian marine navigation safety infrastructure and e-Navigation service
enablers is provided, followed by outlining test bed development targets, applied technologies and preliminary results. Conclusions and recommendations disseminate the experience accumulated by the end
of the current phase, although the implementation continues.
Introduction
Estonia formally regained the independence in 1991, and as a result the marine navigation safety
infrastructure was handed over to the newly established Estonian Maritime Administration (EMA) by the
retreating Russian Navy in 1993. Since both the Baltic Sea and the Finnish Gulf with its shallow waters are
particularly sensitive to pollution resulting from marine accidents while carrying significant passenger and
(dangerous) cargo vessel traffic, creating an adequate marine visual aid to navigation (AtoN) and radio
communication infrastructure to replace the inherited degraded and failing equipment became an urgent
necessity. AtoN site and system modernization projects started almost immediately, with the first remotely
monitored AtoN sites deployed already in 1994. Development of a modern AtoN infrastructure continued with
conversion of critical sites to LED based navigation lights and implementation of a countrywide remote
control and monitoring system (RCMS) with data links based on public cell phone networks. In 2001
development of the Automatic Identification System (AIS) shore side infrastructure started, resulting in a
state of the art AIS/VHF network covering all critical waterways commissioned in July 2004. By November
2010, the Estonian List of Lights lists 420 lighted AtoN sites, 258 of them subjected to remote monitoring.
EMA operates 62% of all Estonian lighted AtoNs; 95% of these are remotely monitored while 90 buoy
stations are operational around the year, encountering severe icing and submersion conditions during harsh
winters. This infrastructure serves as a platform for deployment of the current and planned e-Navigation
services.
Enabling infrastructure for the e-Navigation services in Estonia
Efficient development and deployment of e-Navigation services in Estonia became possible due to the fact that several components of the enabling infrastructure were already in place, requiring considerably less effort compared to a ―green field‖ project approach:
Most of the critical AtoN sites (both fixed and floating) were already equipped with mature telematics equipment (TelFiCon – Telematics Field Controllers) and networked to a remote monitoring and control centre over a GSM/GPRS cellular phone network that provides sufficient coverage, availability and bandwidth;
An AtoN remote control and monitoring system software solution of a new generation - TeViNSA (Telematics for Visual Navigation Situational Awareness) - was already in development, open for inclusion of additional functionality;
A shore side infrastructure for AIS and VHF radio communications interlinking the AIS base stations over a reliable TCP/IP network with an operations (VTS) centre was already deployed (called VHF for VTS), allowing to add new functionality for utilization of AIS broadcasting and reception capabilities over the Finnish Gulf and northern waterways that present the main marine traffic safety challenges.
Due to the widespread use of a cost efficient GSM/GPRS based AtoN remote control and monitoring system, implementation of ―real‖ AIS AtoN equipment on floating aids was abandoned due to high cost and limited functional capabilities. Instead, synthetic AIS AtoN broadcasting based on status data received over the monitoring data link was implemented as the first e-Navigation service. Deployment of a synthetic AIS AtoN
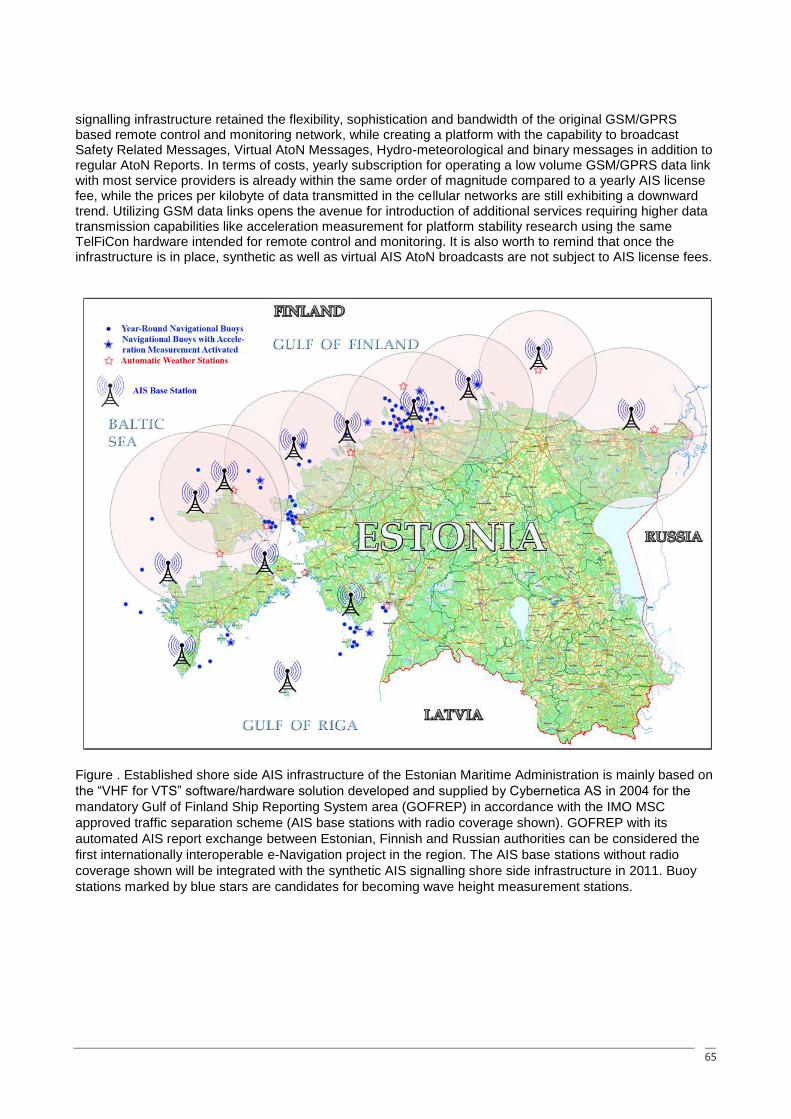
65
signalling infrastructure retained the flexibility, sophistication and bandwidth of the original GSM/GPRS based remote control and monitoring network, while creating a platform with the capability to broadcast Safety Related Messages, Virtual AtoN Messages, Hydro-meteorological and binary messages in addition to regular AtoN Reports. In terms of costs, yearly subscription for operating a low volume GSM/GPRS data link with most service providers is already within the same order of magnitude compared to a yearly AIS license fee, while the prices per kilobyte of data transmitted in the cellular networks are still exhibiting a downward trend. Utilizing GSM data links opens the avenue for introduction of additional services requiring higher data transmission capabilities like acceleration measurement for platform stability research using the same TelFiCon hardware intended for remote control and monitoring. It is also worth to remind that once the infrastructure is in place, synthetic as well as virtual AIS AtoN broadcasts are not subject to AIS license fees.
Figure . Established shore side AIS infrastructure of the Estonian Maritime Administration is mainly based on
the ―VHF for VTS‖ software/hardware solution developed and supplied by Cybernetica AS in 2004 for the
mandatory Gulf of Finland Ship Reporting System area (GOFREP) in accordance with the IMO MSC
approved traffic separation scheme (AIS base stations with radio coverage shown). GOFREP with its
automated AIS report exchange between Estonian, Finnish and Russian authorities can be considered the
first internationally interoperable e-Navigation project in the region. The AIS base stations without radio
coverage shown will be integrated with the synthetic AIS signalling shore side infrastructure in 2011. Buoy
stations marked by blue stars are candidates for becoming wave height measurement stations.
66
e-Navigation test bed development targets
The primary objective of the development of e-Navigation services is to increase marine navigation safety within the area of responsibility of the Estonian Maritime Administration through improvement of situational awareness of both the mariners and the authorities responsible for AtoN service provision. The initial task list consisted of the following activities, contributing to the e-Navigation work package of the EfficienSea project:
Design and deploy an AtoN remote monitoring centre utilizing GSM/GPRS communication with buoys for provision of synthetic AtoN AIS messages with AtoN operational status information
Establish relevant IT infrastructure for automated formatting, transmission, and broadcasting of synthetic AtoN AIS messages as an e-Navigation service
Develop sea state registration and analysis technology based on 3D acceleration measurements onboard navigational buoys
Development of technologies for harvesting of available regional hydrometeorological and forecast models data
Develop software application forming hydrometeorological binary messages for AIS broadcasting
Since e-Navigation is still a domain open for innovation and not yet fully standardized, new tasks can easily emerge in the process of service implementation. While the Universal Maritime Data Model (UMDM) is being developed, maritime information can be presented to the stakeholders by the means of existing standardized technologies like AIS messaging and the Internet.
Target outcome following a complete and successful implementation of test beds can be described as follows:
1. The mariners will be able to receive synthetic AIS AtoN Message 21 from the floating AtoN selected by the EMA either at a regular interval configured at the TeViNSA centre, or only in case of a failure (equipment malfunction or off-position). Full control over synthetic AIS AtoN message broadcasting at the operations centre guarantees that cluttering the radio ether with regular status reports of AtoN with rather low safety criticality in the conditions of the deficit of VDL time slots can be avoided; at the same time, broadcasting can be enabled for Message 21 with health flag alarm set as well as safety related addressed or broadcast messages 12 or 14 in case of AtoN failure. The later would be impossible in case of a complete failure of a ―real‖ AIS AtoN - for instance, in case of lost power. Radio broadcasting is managed by a smart AIS Router software component utilizing on AIS base station closest to the relevant buoy station.
2. The mariners will be able to receive AIS Message 8 with hydrometeorological information compiled from a shore side network of automatic marine weather stations.
3. The mariners will be able to receive AIS Message 8 with estimated wave heights calculated by a shore side server based on the acceleration information received from a selection of navigational buoys.
4. The authorities responsible for AtoN service provision will be able to receive information on floating AtoN dynamics (acceleration values from 3-axial g-sensor, heel angle statistics, excessive and critical heel angle warnings and collision alerts) in order to assess the quality of navigational light signal provision as well as platform stability and response to the wave, wind and current conditions.
5. The authorities responsible for AtoN service provision will be able to receive low-latency online positioning information with guidance for completion of AtoN related tasks like navigational buoy deployment and verification of sector light signal configuration.
6. The parties interested in proprietary buoy platform stability research will be able to conduct measurements with access to the buoy acceleration information over the web based TeViNSA user interface with access restrictions.
7. The parties interested in marine research will be able to access the information on significant wave heights estimated by a server side algorithm based on acceleration measurements onboard navigational buoys by region (buoy station) over a public website.
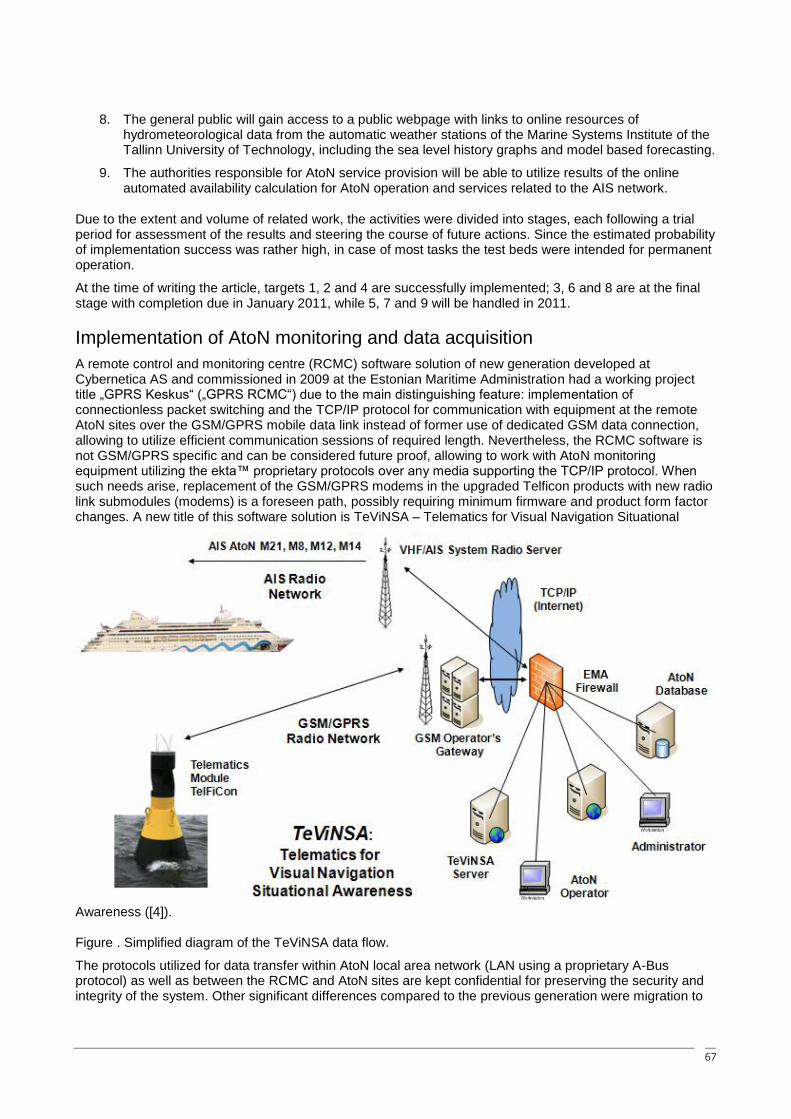
67
8. The general public will gain access to a public webpage with links to online resources of hydrometeorological data from the automatic weather stations of the Marine Systems Institute of the Tallinn University of Technology, including the sea level history graphs and model based forecasting.
9. The authorities responsible for AtoN service provision will be able to utilize results of the online automated availability calculation for AtoN operation and services related to the AIS network.
Due to the extent and volume of related work, the activities were divided into stages, each following a trial period for assessment of the results and steering the course of future actions. Since the estimated probability of implementation success was rather high, in case of most tasks the test beds were intended for permanent operation.
At the time of writing the article, targets 1, 2 and 4 are successfully implemented; 3, 6 and 8 are at the final stage with completion due in January 2011, while 5, 7 and 9 will be handled in 2011.
Implementation of AtoN monitoring and data acquisition
A remote control and monitoring centre (RCMC) software solution of new generation developed at Cybernetica AS and commissioned in 2009 at the Estonian Maritime Administration had a working project title „GPRS Keskus― („GPRS RCMC―) due to the main distinguishing feature: implementation of connectionless packet switching and the TCP/IP protocol for communication with equipment at the remote AtoN sites over the GSM/GPRS mobile data link instead of former use of dedicated GSM data connection, allowing to utilize efficient communication sessions of required length. Nevertheless, the RCMC software is not GSM/GPRS specific and can be considered future proof, allowing to work with AtoN monitoring equipment utilizing the ekta™ proprietary protocols over any media supporting the TCP/IP protocol. When such needs arise, replacement of the GSM/GPRS modems in the upgraded Telficon products with new radio link submodules (modems) is a foreseen path, possibly requiring minimum firmware and product form factor changes. A new title of this software solution is TeViNSA – Telematics for Visual Navigation Situational
Awareness ([4]).
Figure . Simplified diagram of the TeViNSA data flow.
The protocols utilized for data transfer within AtoN local area network (LAN using a proprietary A-Bus protocol) as well as between the RCMC and AtoN sites are kept confidential for preserving the security and integrity of the system. Other significant differences compared to the previous generation were migration to

68
the Linux operating system instead of MS Windows at the operations centre, a web-based multi-user interface instead of dedicated client software, utilization of the PostgreSQL database instead of Paradox (Borland), and introduction of support for new features of the TelFiCons: buoy heel angle measurement ([1]), Firmware-Over-the-Air upload capability (FOTA, [2]), excessive and critical heel angle alarms, etc.
Daily operation of the AtoN monitoring is performed using a set of HTML/JavaScript based webpages served to the users for AtoN population status display and equipment configuration upon logging on using a web browser. A simple structured table showing coloured blocks with AtoN numbers inside was chosen for the main situation status screen over a nautical chart based graphical display due to the interface efficiency - capability of providing a clear technical overview of AtoN operational situation, uncluttered by irrelevant details, and the speed of navigating between different screens. Nevertheless, an interface is provided for displaying the AtoNs with position monitoring information on the nautical chart background using external web mapping service (WMS). The user interface of RCMC software is currently provided in the Estonian language.
AtoN status monitoring is performed in the classical way, with pre-configured status reporting intervals and alarm messages triggered by a pre-defined condition (event). The buoys subject to synthetic AIS AtoN reporting are configured for reporting at a 3 minute interval, other AtoNs initiate regular communication sessions at longer time intervals depending on their mission profile. Data acquisition from onboard sensors (voltage, temperature, acceleration) is performed constantly at a pre-configured interval, but in case of a typical AtoN monitoring mission, acquired values are used for internal purposes like threshold checking and statistical parameter averaging.
Since the computational capabilities of the microprocessor used inside the TelFiCon units are not sufficient for in-situ wave parameter calculation, and implementation of a more powerful processor is not feasible due to power consumption limitations onboard navigational buoys, calculation of wave height is performed on the server side. In order to obtain the raw acceleration data from the three-axial solid state micromechanical acceleration sensor installed inside each TelFiCon module, a special mission scenario needs to be activated at the RCMC, resulting in continuous measurement, data buffering and transmission to the RCMC for a given time period. Although continuous acceleration measurement and transmission is possible, it can be recommended only for specific buoy platform research due to increased power consumption (and possibly, transmission costs depending on the contract details) during such activity. Optimal settings for sea state estimation will be researched during the next phase of the project, with the objective to activate the transmission of acceleration values to the RCMC only for a short time period within every M8 broadcasting interval (for instance, for 1 minute every 10 minutes). Sampling interval for scanning the outputs of the acceleration sensor as well as number of scans in every measurement session resulting in an acceleration data file on the server side are configurable at the RCMC within certain limitations.
Several calculations are performed by each TelFiCon constantly in the background: in addition to traditional GPS satellite signal based position monitoring, TelFiCons installed on floating aids are configured for collision detection, heel angle calculation and limit checking, alerting the RCMC upon detection of excessive acceleration or inclination. Two thresholds are foreseen for inclination checks: ―Excessive heel angle‖ for checking for the angles that pose serious impact on the visibility range of the light signal, and ―Critical heel angle‖ for checking for the angles most likely caused by the advancing ice pack in the process of submersion of the buoy. Results of an average heel angle calculation are sent to the RCMC with every situation report, therefore the reporting interval needs to be configured in accordance with the desirable amount of data points per day. During the initial stage, buoys that are not subject to synthetic AIS reporting were configured for 6 hour status reporting interval, with the ―Excessive heel angle‖ threshold set to 12º and the ―Critical heel angle‖ set to 45º. Initial results have already shown that while most buoys may play around at average heel angles of a few degrees, during heavy seas the heel angles can easily exceed the expectations, rendering the navigational light signal hard to recognize by mariners. Analysis of buoy dynamics and broadcasting of light signal failure warnings due to excessive heel angles are subjects to further research.
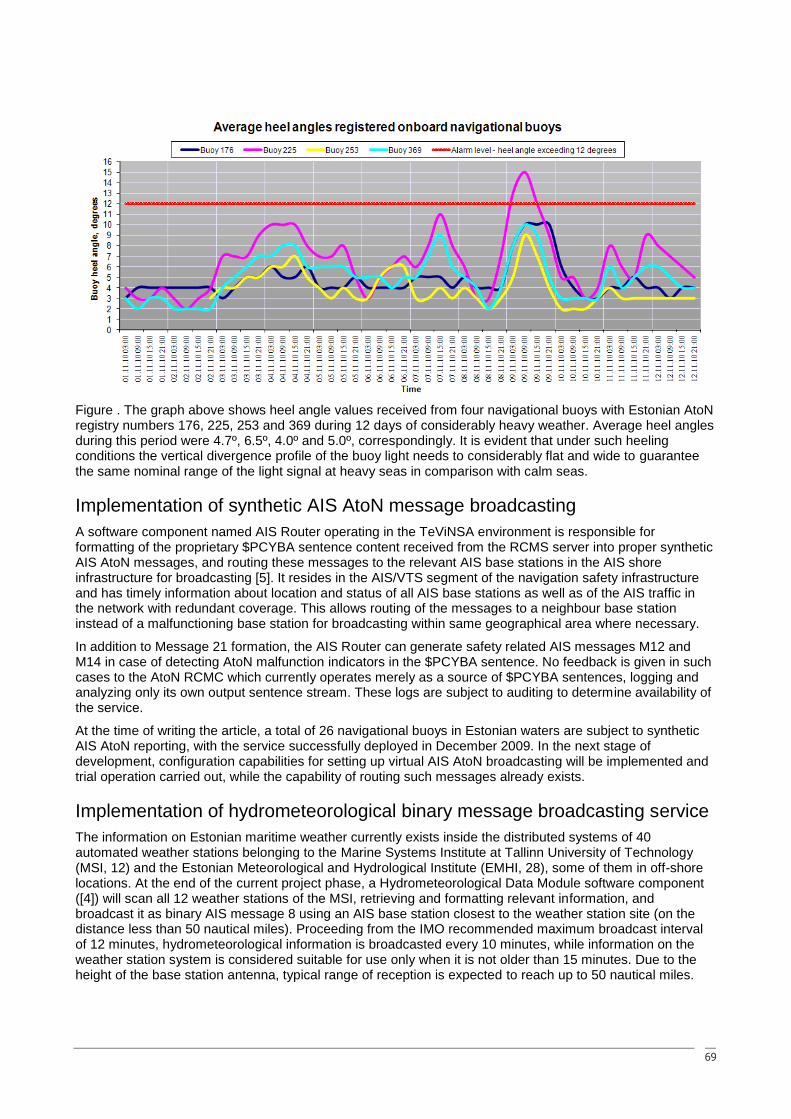
69
Figure . The graph above shows heel angle values received from four navigational buoys with Estonian AtoN registry numbers 176, 225, 253 and 369 during 12 days of considerably heavy weather. Average heel angles during this period were 4.7º, 6.5º, 4.0º and 5.0º, correspondingly. It is evident that under such heeling conditions the vertical divergence profile of the buoy light needs to considerably flat and wide to guarantee the same nominal range of the light signal at heavy seas in comparison with calm seas.
Implementation of synthetic AIS AtoN message broadcasting
A software component named AIS Router operating in the TeViNSA environment is responsible for formatting of the proprietary $PCYBA sentence content received from the RCMS server into proper synthetic AIS AtoN messages, and routing these messages to the relevant AIS base stations in the AIS shore infrastructure for broadcasting [5]. It resides in the AIS/VTS segment of the navigation safety infrastructure and has timely information about location and status of all AIS base stations as well as of the AIS traffic in the network with redundant coverage. This allows routing of the messages to a neighbour base station instead of a malfunctioning base station for broadcasting within same geographical area where necessary.
In addition to Message 21 formation, the AIS Router can generate safety related AIS messages M12 and M14 in case of detecting AtoN malfunction indicators in the $PCYBA sentence. No feedback is given in such cases to the AtoN RCMC which currently operates merely as a source of $PCYBA sentences, logging and analyzing only its own output sentence stream. These logs are subject to auditing to determine availability of the service.
At the time of writing the article, a total of 26 navigational buoys in Estonian waters are subject to synthetic AIS AtoN reporting, with the service successfully deployed in December 2009. In the next stage of development, configuration capabilities for setting up virtual AIS AtoN broadcasting will be implemented and trial operation carried out, while the capability of routing such messages already exists.
Implementation of hydrometeorological binary message broadcasting service
The information on Estonian maritime weather currently exists inside the distributed systems of 40 automated weather stations belonging to the Marine Systems Institute at Tallinn University of Technology (MSI, 12) and the Estonian Meteorological and Hydrological Institute (EMHI, 28), some of them in off-shore locations. At the end of the current project phase, a Hydrometeorological Data Module software component ([4]) will scan all 12 weather stations of the MSI, retrieving and formatting relevant information, and broadcast it as binary AIS message 8 using an AIS base station closest to the weather station site (on the distance less than 50 nautical miles). Proceeding from the IMO recommended maximum broadcast interval of 12 minutes, hydrometeorological information is broadcasted every 10 minutes, while information on the weather station system is considered suitable for use only when it is not older than 15 minutes. Due to the height of the base station antenna, typical range of reception is expected to reach up to 50 nautical miles.
70
This service starts with first 12 weather data sources in November 2010; information from the EMHI weather stations will be integrated in 2011. A single webpage at the EMA website will be created for access to online e-Navigation services.
Implementation of wave height estimation
In-situ wave height measurement by dedicated equipment is typically a rather expensive undertaking, specifically when performed continuously, with online data acquisition and presentation. While the satellite based measurement methods that are expected to reach maturity in coming years would be comfortable to use, they are typically integrating wave data over a large area, while repetition rate for measurements over the same area (satellite swath) may take days due to spiralling satellite orbits. An alternative for precise wave height measurement is using AtoN telematics equipment with moderate operational cost; it does not provide a high precision, but can be considered an improvement in situational awareness compared to having no wave height information at all.
The significant wave height information is calculated by a dedicated server on the shore side, based on three-axial acceleration data received from navigational buoys that are equipped with TelFiCon telematics modules and tasked with an acceleration measurement mission. The software application for this purpose is currently under development, due to trial deployment in January 2011. The wave height calculation station becomes a source of input information for the Hydrometeorological Data Module software component which will handle it similarly to marine weather stations, formatting the wave height information into AIS message 8 that is broadcasted with corresponding buoy coordinates shown as a location of a weather station.
Initial hypothesis at the time of beginning of the project was that significant wave height estimation with uncertainty of 0.25 m can be achieved in the range of wave heights of 0 to 2 m, and 0.75 m in the range of 2 to 5 m for the buoy platform for which the measurement process has been calibrated. Due to the ―cheap‖ measurement setup with non-gimballed sensor, raw acceleration data require a long trend analysis time and buoy specific filtering in order to avoid errors induced by buoy movement in all possible degrees of freedom.
Prior to making the decision to launch the actual AIS broadcasting of calculated wave heights, the values will be closely monitored during an observation period in the first quarter of 2011.
Remaining tasks
Verification of the wave height estimation algorithm is conducted in cooperation with the Marine Systems Institute at Tallinn University of Technology (MSI). A series of experiments for measuring of wave height with precise sensors deployed in the close vicinity of a buoy station Kuradimuna W located in the Gulf of Finland (59°41.730' 24°52.870'), 4.3 NM west of Keri Islet for obtaining reference data is currently underway. The algorithm implements trend analysis for data quality control, lowering the probability of broadcasting nonsensical information. Calibration tests for other types of buoy platforms will be scheduled in 2011, depending on the success rate of the current project stage.
Automated calculation of AtoN and AIS service availabilities has not yet been implemented and remains a development candidate for the next project phase.
Once the e-Navigation services are implemented, a survey of professional navigators will be organized to receive feedback from the primary users. Initial random feedback on implementing regular AIS AtoN broadcasts has been hesitant: some navigators fear that the AIS bandwidth is wasted in dense vessel traffic situations, and the bridge system displays become cluttered with information of moderate safety criticality.
71
Conclusions and recommendations
Deployment of e-Navigation services in Estonia results in the following improvements to maritime safety:
1. Situational awareness of the mariners is increased due to direct and effortless access to AtoN status data and weather reports received by the means of AIS messages and displayed on the bridge systems.
2. A comprehensive e-Navigation service webpage at the EMA website facilitates voyage planning through the Estonian waters, and enables access to historic hydrometeorological data for maritime domain research.
3. The authorities responsible for AtoN service provision obtain improved awareness of the AtoN light signalling situation, specifically related to occurrence and frequency of excessive and critical buoy heel angles and timely notifications for ice buoy submersion.
4. The authorities responsible for AtoN service provision obtain input for assessment of buoy platform stability and sufficiency of the light source for the station, as well as statistical data for navigational risk assessment.
The work is still in progress, but the already fielded test bed services are not intended merely for trials during the time period of the EfficienSea project - they are here to stay. Based on the accumulated experiences, the following recommendations can be offered for consideration by stakeholders involved in planning the implementation of e-Navigation services:
1. Utilization of a shore side infrastructure for synthetic and virtual AIS AtoN broadcasting may be a more efficient way for the authorities already managing a significant population of remotely monitored AtoN, instead of deployment of a fleet of navigation marks equipped with ―real‖ AIS AtoN equipment.
2. To guarantee the quality of AtoN light signalling service using navigational buoys, it is recommended to conduct assessment of buoy platform stability and corresponding sufficiency of the vertical divergence profile of the light sources used for provision of nominal range in the dominating sea states.
3. It may be worth to study the feasibility of introducing simple voice message synthesizers for converting certain AIS messages into audible messages at the bridge for improvement of the efficiency of information delivery.
4. It may be beneficial to create an index of e-Navigation webpages of marine administrations at IMO and IALA websites to promote access to maritime safety information and e-Navigation services by country (region).
References
[1] Moorits, Erkki; Usk, Aivar. A Numerically Efficient Method for Calculation of the Angle of Heel of a Navigational Buoy. 12th Biennial Baltic Electronics Conference (BEC2010), Tallinn, Estonia. October 4-6, 2010. IEEE Catalogue number CFP10BEC-CDR.
[2] Moorits, Erkki; Jervan, Gert. Low Resource Demanding FOTA Method for Remote AtoN Site Equipment. OCEANS 2010 MTS/IEEE Seattle, Seattle, Washington, USA September 20-23, 2010. IEEE, 2010.
[3] Telematics for Visual Navigation Situational Awareness: TeViNSA. Document number: M-9-59, Cybernetica AS, 2010.
[4] „Hydrometeorological Data Module for AIS AtoN Router―, Owner's manual, ver. 1.0, Document number: Y-399-44, Cybernetica AS, 2010.
[5] ―AIS Router - a module for routing AtoN-specific AIS messages M8, M12, M14, and M21―, Document number: Y-399-28, Cybernetica AS, 2009
72
Test bed for evaluation of methods for decision support in collision avoidance
Erland Wilske, SSPA Sweden AB Oscar Lexell, SSPA Sweden AB
Abstract:
Collision between ships represents one of the highest risks for human- and ecological consequences. It is therefore of great importance to continuously seek improvements in methods to support target detection, assess of situation and decision for avoidance manoeuvres. The main functions and principles for ARPA (Automatic Radar Plotting Aid) has been basically the same since the introduction in the eighties. The use of ARPA has contributed to increased situation awareness and supported the decision process for collisions avoidance. However, the introduction of GNSS, AIS, ECDIS, LCD/LED displays, and computer capacity have created and enabled further improvements and new functions for decision support in collision avoidance. A number of these potential improvements have been surveyed and selected for further analysis. A prototype have been developed where these functions can be tested and evaluated on a conceptual level. The prototype enables comparison and combination of traditional ARPA anti-collision navigation and the new functions. The functions comprise exchange of predicted manoeuvring data, exchange of intended route, and display of collision danger sector (CDS). Further, a method for integration of trial manoeuvre into the function for change of route has been implemented. The process of implementing these functions elucidates a large number of technical- as well as human factor issues. These issues have be analysed and discussed with experts in different fields, especially nautical officers working in different positions and ship types. The functions have been tested and evaluated by a group of nautical officers and pilots. The test group were enthusiastic to the new functions, especially exchange of route together with integrated trial manoeuvre have met positive response. These functions enables the navigator to detect , assess and in due time react on upcoming close quarter situations. The exchange of route information also enable officers on watch to communicate their intentions to all ships concerned in a traffic scenario, in a distinct and automated manner. Further finding is that, to have these functions in operation on the majority of ship in the intended way will have impact on and require technical development, integration and standardisation work on a number of systems, including AIS, Radar, ECDIS and autopilot/track-keepings system.
Introduction:
One of the general objectives in the EfficienSea project is to contribute to the realisation of e-Navigation by building trans-national professional networks bringing specialists together to develop the basic elements of the ICT (Information and communication technologies) solutions of e-Navigation.
The primary goal of WP4 (Work Package 4), titled e-Navigation, is hence to provide the world, and in particular the European community with a comprehensive best practice demonstration of the e-Navigation concept, in order to facilitate its further development and full scale implementation by preparing the maritime authorities for those major future investments.
This part of WP4 investigates new and enhanced functions and methods for decision support in collision avoidance.
Collision between ships represents one of the highest risks for human- and ecological consequences. It is therefore of great importance to continuously seek improvements in methods to support target detection, assess of situation and decision for avoidance manoeuvre.
The collision avoidance task is carried out primarily by help of radar and visual references. In the eighties it became compulsory on larger ships to be equipped with ARPA (Automatic Radar Plotting Aid). The ARPA contributed to reduce the workload of plotting targets and increased the situation awareness. Although the radar technology has improved throughout the years, the ARPA functionality has been basically the same. The last decades progress in development of GNSS, AIS, ECDIS, LCD/LED displays and computer capacity have created possibilities for improvement in functions and methods for decision support in collision
73
avoidance. In this project some of these new possibilities have been implemented into a prototype software and evaluated in different aspects.
Some hypothesis and visions for the future
When selecting the functions to implement and test in the prototype we have started from the following background and assumptions:
Ship should be equipped with ECDIS. This is the natural platform for many e-Navigation services and functions. IMO have set out the schedule for mandatory carriage of ECDIS (IMO MSC 86/26). This will assure that ECDIS will be used on most of the ships.
It is assumed that ships will use track-keeping mode to a higher extent during normal conditions. The user interface for making route change must then be easy to use as the change of heading on an autopilot.
The introduction of AIS has resulted in increased use of VHF voice communication (Baily 2008). There has been a long ongoing debate whether VHF voice communication for collision avoidance increase or decrease safety (e.g. Harding 2002, Stitt 2003). However, some organisations claim that VHF voice communication should not generally be used for collision avoidance (e.g. UK MCA note 324, 2006).
VHF is today the only practical way to inform and to be informed of own and other ships intentions in a meeting situation. The AIS text messages are also a possible method to contact other vessels but are not as widely used as the VHF radio.
The AIS destination information is widely used for assessment of how to act in meeting and overtaking situations.
VTS have the potential of improving their service with the knowledge of a ships intended route (Grundevik 2008).
There is an ongoing discussion if ships in future will be assigned to a dedicated route.
The ARPA function ―trial manoeuvre‖ is seldom used. The ability to simulate a planned manoeuvre is found to be a good support, but in most systems this function is too cumbersome and complicated to use.
Trails in the radar are a function that is appreciated among mariners and widely used. The trails can give early information if a target will become a close quarter or not. This is achieved without the need for selection of target for plotting and it is detected without bulky vectors in the display.
A meeting situation is assessed in the ARPA radar by toggling between true- and relative vectors. This results in a mode switching between the two different display modes. The true vector is to assess the traffic pattern (where ships are heading) and the relative vector is used to assess CPA and risk for collision.
It is common to use small passage distances in meeting situations. This increases the risk for accidents and makes it difficult to assess intensions.
A significant course or speed change in an evasive manoeuvre in accordance with COLREGs could sometimes be more dangerous than a small course or speed change. This can be in situation in limited navigable water and in dense traffic.
In most of collision accidents contributing factors are fatigue and/or officer has been distracted by other tasks. Usually only one man is on the bridge.
Many ships are using the same waypoints for their voyage plan. This cause sometimes close quarter situations. Some OOW are also reluctant to deviate from their planned route.
With the above background information and assumptions, the following visions and hypothesis are suggested:
74
ECDIS and track-keeping system should support the use of track-keeping mode during normal conditions including collision avoidance manoeuvres.
Ships exchange their intention by sending their intended route via AIS. This allows OOW to foresee a close quarter situation at an early stage.
Ships operating in close quarters, display their intensions by sending predicted position via AIS. This can be done by sending speed vector and turn rate (as in existing AIS position message) or to send position and heading calculated by a dynamic predictor. A dynamic predictor uses input from the ships manoeuvring devices and environmental data (e.g. wind, water depth, current) and feed this into a mathematical model of the ship to calculate future positions (Källström 1999).
The ―trial manoeuvre‖ should be integrated in the functions for route or course change. It shall be possible to evaluate the result of route/course change before executing the order.
It would be possible to use true vectors only and to combine these with so called CDS (Collision Danger Sector). The CDS is a graphical method of visualizing collision risk by combining true and relative vectors (Pedersen 2003 and 2006).
All targets (both radar and AIS targets) should be automatically tracked. By using appropriate target fusion algorithms, filtering and target symbols, targets are displayed based on their collision risk importance.
When introducing new functions and methods it is important that the infrastructure or environment for the function/methods support each other. If not, there is a risk that the benefits of the functions/methods are degraded or as an extreme, being counterproductive. It is vital that the above discussion and assumptions are kept in mind when evaluate the function suggested in the following sections.
Overview of functions in the prototype software
By taking the above stated background and visions into account, a number of functions were selected and implemented in prototype software. A summary of the functions are listed below. A more detailed description is found in subsections.
Basic ARPA features for assessment of collision risk by methods used in existing ARPA radar set.
Display of intended routes for own ship and target ships. The routes are exchanged to other ships via AIS. An update rate equal to static AIS messages is assumed.
Calculation of CPA and TCPA based on route information. These are referred to RCPA and RTCPA respectively.
Display of the point of RCPA. The point is displayed as a red circle (see figure 1).
Change of route. The command for initiation and execution/rejection of route change are a top level button. The function allows to add waypoints and to move existing waypoints.
Integration of trial manoeuvre into the function for change of route. RCPA/RTCPA and CPA/TCPA are continuously updated during change of route. This allows the OOW to assess the whole avoidance manoeuvre including return to original route or course. When OOW push the acceptance button the new intended route is sent via AIS to other ships (see figure 2).
Calculation and display of CDS (Collision Danger Sector) (see figure 3)
Display of curved vector based on rate of turn information.
Display of position based on dynamic predictor (see figure 7).
Possibility to replay scenarios generated by SSPA manoeuvring simulation software Portsim or real scenarios generated from recorded AIS data.
Functions to manually control own ship by setting speed and heading or to follow a changed route.
75
The prototype allows the user to test and evaluate the functions on a conceptual level. The purpose has been to get a rough overview on the pros and cons of the functions on an operational level and to some extent the impact on a system level.
Concept of exchange of intended route
The principal idea assumes that the ship normally sails in track keeping mode. The route is maintained and monitored in the ECDIS/radar. To accomplish the exchange of intended route to the surrounding traffic an appropriate part of the route (e.g. a number of waypoints) is transferred to the AIS transponder and sent on the AIS data link. In figure 1 an example of the display of intended routes is shown. Own ships route is shown in orange colour and the target ships routes are shown by yellow lines. For each target, CPA and TCPA is calculated based on assumption that ships will follow routes. These are denoted RCPA and RTCPA and should not be mixed with CPA/TCPA based on ARPA (see list of abbreviations for definition). The values of RCPA and RTCPA are shown beside the related target. The target position at RCPA is shown as a red circle. The part of the routes displayed in ECDIS/radar is suggested to be user defined based on time in analogy with target vectors on an ARPA. Two other methods discussed are fixed length in nautical miles or the entire route received by AIS.
There is an obvious risk that the visualisation of routes is making the radar or ECDIS display cluttered and it possibly suppress other vital information (e.g. weak radar echoes). It is therefore important to be able to filter the display of routes in order to just show routes implying a risk of collision. The filtering are based on defined RCPA and RTCPA. The filter limits are user defined.
In the prototype, the routes have been represented by waypoints. It is believed the frequency for sending route messages should be based on ships speed and limitation of range of receiving AIS data. The ITU-R M.1371 (§ 4.2.1) specifies that voyage related information should be send every 6 minutes, or when data has been amended, or on request. For two fast ships (30 knots) in a head-on meeting situation (relative speed 60 knots) a 6 minutes time interval represents a decrease of range of 6 nm. The present AIS message type for sending routes allows up to 16 waypoints to be sent. To send 16 waypoints will require five AIS time slots. There might be need to send waypoints in a more compact format than the present standard. The route information should also preferably contain information of turn radius at waypoints.
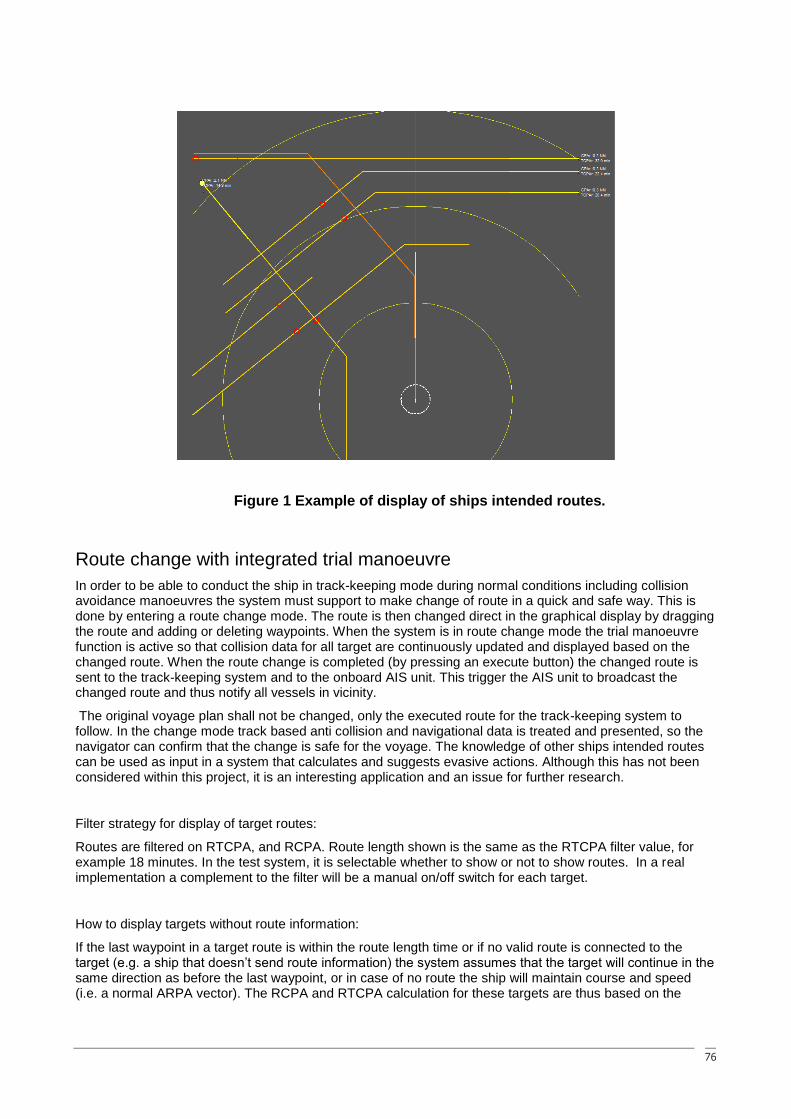
76
Figure 1 Example of display of ships intended routes.
Route change with integrated trial manoeuvre
In order to be able to conduct the ship in track-keeping mode during normal conditions including collision avoidance manoeuvres the system must support to make change of route in a quick and safe way. This is done by entering a route change mode. The route is then changed direct in the graphical display by dragging the route and adding or deleting waypoints. When the system is in route change mode the trial manoeuvre function is active so that collision data for all target are continuously updated and displayed based on the changed route. When the route change is completed (by pressing an execute button) the changed route is sent to the track-keeping system and to the onboard AIS unit. This trigger the AIS unit to broadcast the changed route and thus notify all vessels in vicinity.
The original voyage plan shall not be changed, only the executed route for the track-keeping system to follow. In the change mode track based anti collision and navigational data is treated and presented, so the navigator can confirm that the change is safe for the voyage. The knowledge of other ships intended routes can be used as input in a system that calculates and suggests evasive actions. Although this has not been considered within this project, it is an interesting application and an issue for further research.
Filter strategy for display of target routes:
Routes are filtered on RTCPA, and RCPA. Route length shown is the same as the RTCPA filter value, for example 18 minutes. In the test system, it is selectable whether to show or not to show routes. In a real implementation a complement to the filter will be a manual on/off switch for each target.
How to display targets without route information:
If the last waypoint in a target route is within the route length time or if no valid route is connected to the target (e.g. a ship that doesn‘t send route information) the system assumes that the target will continue in the same direction as before the last waypoint, or in case of no route the ship will maintain course and speed (i.e. a normal ARPA vector). The RCPA and RTCPA calculation for these targets are thus based on the
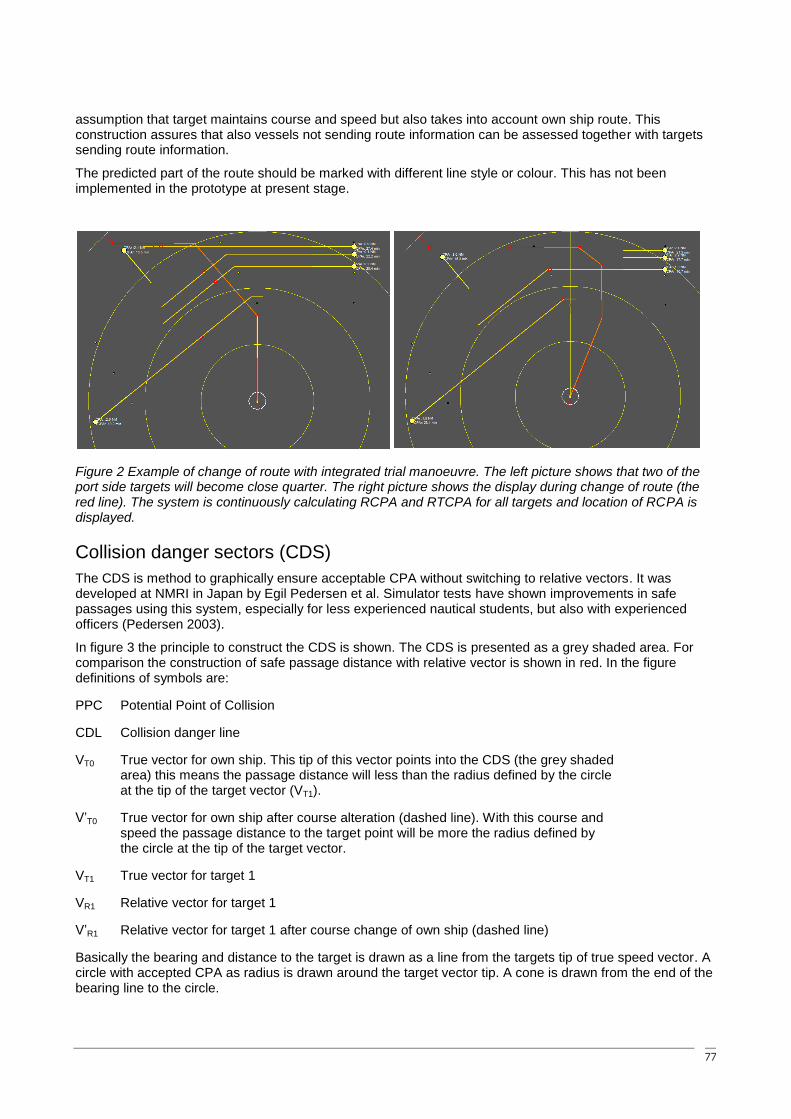
77
assumption that target maintains course and speed but also takes into account own ship route. This construction assures that also vessels not sending route information can be assessed together with targets sending route information.
The predicted part of the route should be marked with different line style or colour. This has not been implemented in the prototype at present stage.
Figure 2 Example of change of route with integrated trial manoeuvre. The left picture shows that two of the port side targets will become close quarter. The right picture shows the display during change of route (the red line). The system is continuously calculating RCPA and RTCPA for all targets and location of RCPA is displayed.
Collision danger sectors (CDS)
The CDS is method to graphically ensure acceptable CPA without switching to relative vectors. It was developed at NMRI in Japan by Egil Pedersen et al. Simulator tests have shown improvements in safe passages using this system, especially for less experienced nautical students, but also with experienced officers (Pedersen 2003).
In figure 3 the principle to construct the CDS is shown. The CDS is presented as a grey shaded area. For comparison the construction of safe passage distance with relative vector is shown in red. In the figure definitions of symbols are:
PPC Potential Point of Collision
CDL Collision danger line
VT0 True vector for own ship. This tip of this vector points into the CDS (the grey shaded area) this means the passage distance will less than the radius defined by the circle at the tip of the target vector (VT1).
V‘T0 True vector for own ship after course alteration (dashed line). With this course and speed the passage distance to the target point will be more the radius defined by the circle at the tip of the target vector.
VT1 True vector for target 1
VR1 Relative vector for target 1
V‘R1 Relative vector for target 1 after course change of own ship (dashed line)
Basically the bearing and distance to the target is drawn as a line from the targets tip of true speed vector. A circle with accepted CPA as radius is drawn around the target vector tip. A cone is drawn from the end of the bearing line to the circle.
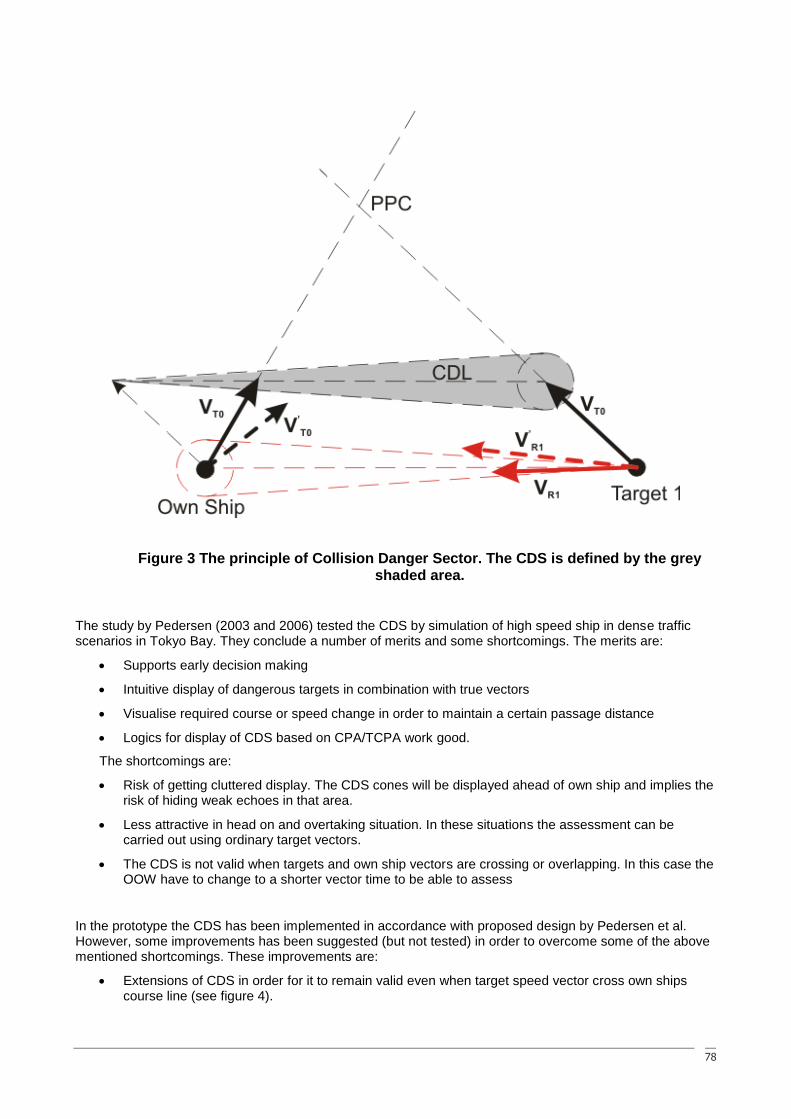
78
Figure 3 The principle of Collision Danger Sector. The CDS is defined by the grey shaded area.
The study by Pedersen (2003 and 2006) tested the CDS by simulation of high speed ship in dense traffic scenarios in Tokyo Bay. They conclude a number of merits and some shortcomings. The merits are:
Supports early decision making
Intuitive display of dangerous targets in combination with true vectors
Visualise required course or speed change in order to maintain a certain passage distance
Logics for display of CDS based on CPA/TCPA work good.
The shortcomings are:
Risk of getting cluttered display. The CDS cones will be displayed ahead of own ship and implies the risk of hiding weak echoes in that area.
Less attractive in head on and overtaking situation. In these situations the assessment can be carried out using ordinary target vectors.
The CDS is not valid when targets and own ship vectors are crossing or overlapping. In this case the OOW have to change to a shorter vector time to be able to assess
In the prototype the CDS has been implemented in accordance with proposed design by Pedersen et al. However, some improvements has been suggested (but not tested) in order to overcome some of the above mentioned shortcomings. These improvements are:
Extensions of CDS in order for it to remain valid even when target speed vector cross own ships course line (see figure 4).
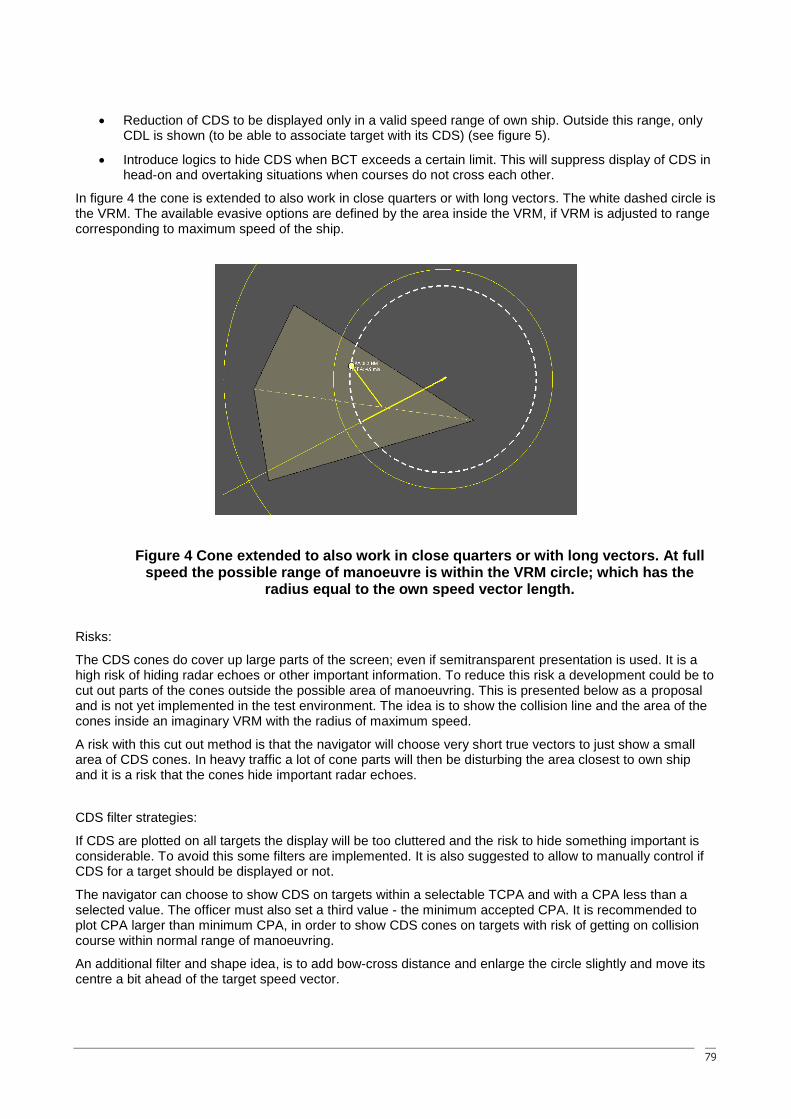
79
Reduction of CDS to be displayed only in a valid speed range of own ship. Outside this range, only CDL is shown (to be able to associate target with its CDS) (see figure 5).
Introduce logics to hide CDS when BCT exceeds a certain limit. This will suppress display of CDS in head-on and overtaking situations when courses do not cross each other.
In figure 4 the cone is extended to also work in close quarters or with long vectors. The white dashed circle is the VRM. The available evasive options are defined by the area inside the VRM, if VRM is adjusted to range corresponding to maximum speed of the ship.
Figure 4 Cone extended to also work in close quarters or with long vectors. At full speed the possible range of manoeuvre is within the VRM circle; which has the
radius equal to the own speed vector length.
Risks:
The CDS cones do cover up large parts of the screen; even if semitransparent presentation is used. It is a high risk of hiding radar echoes or other important information. To reduce this risk a development could be to cut out parts of the cones outside the possible area of manoeuvring. This is presented below as a proposal and is not yet implemented in the test environment. The idea is to show the collision line and the area of the cones inside an imaginary VRM with the radius of maximum speed.
A risk with this cut out method is that the navigator will choose very short true vectors to just show a small area of CDS cones. In heavy traffic a lot of cone parts will then be disturbing the area closest to own ship and it is a risk that the cones hide important radar echoes.
CDS filter strategies:
If CDS are plotted on all targets the display will be too cluttered and the risk to hide something important is considerable. To avoid this some filters are implemented. It is also suggested to allow to manually control if CDS for a target should be displayed or not.
The navigator can choose to show CDS on targets within a selectable TCPA and with a CPA less than a selected value. The officer must also set a third value - the minimum accepted CPA. It is recommended to plot CPA larger than minimum CPA, in order to show CDS cones on targets with risk of getting on collision course within normal range of manoeuvring.
An additional filter and shape idea, is to add bow-cross distance and enlarge the circle slightly and move its centre a bit ahead of the target speed vector.
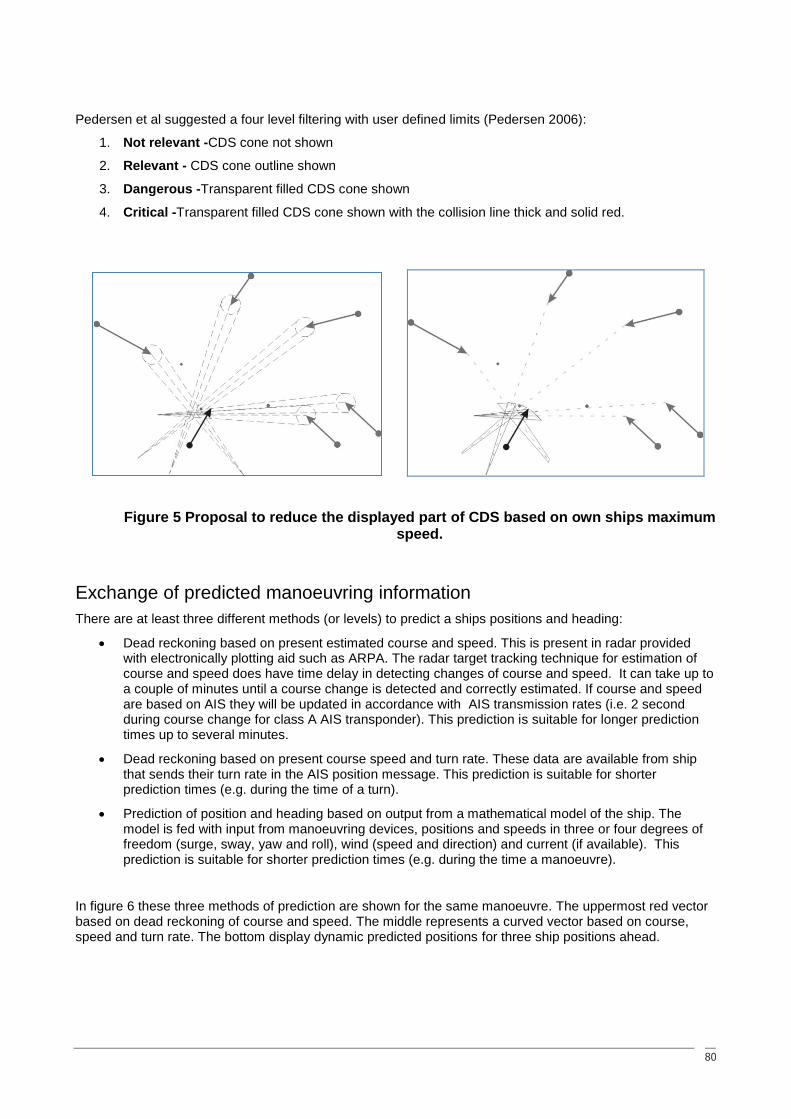
80
Pedersen et al suggested a four level filtering with user defined limits (Pedersen 2006):
1. Not relevant -CDS cone not shown
2. Relevant - CDS cone outline shown
3. Dangerous -Transparent filled CDS cone shown
4. Critical -Transparent filled CDS cone shown with the collision line thick and solid red.
Figure 5 Proposal to reduce the displayed part of CDS based on own ships maximum speed.
Exchange of predicted manoeuvring information
There are at least three different methods (or levels) to predict a ships positions and heading:
Dead reckoning based on present estimated course and speed. This is present in radar provided with electronically plotting aid such as ARPA. The radar target tracking technique for estimation of course and speed does have time delay in detecting changes of course and speed. It can take up to a couple of minutes until a course change is detected and correctly estimated. If course and speed are based on AIS they will be updated in accordance with AIS transmission rates (i.e. 2 second during course change for class A AIS transponder). This prediction is suitable for longer prediction times up to several minutes.
Dead reckoning based on present course speed and turn rate. These data are available from ship that sends their turn rate in the AIS position message. This prediction is suitable for shorter prediction times (e.g. during the time of a turn).
Prediction of position and heading based on output from a mathematical model of the ship. The model is fed with input from manoeuvring devices, positions and speeds in three or four degrees of freedom (surge, sway, yaw and roll), wind (speed and direction) and current (if available). This prediction is suitable for shorter prediction times (e.g. during the time a manoeuvre).
In figure 6 these three methods of prediction are shown for the same manoeuvre. The uppermost red vector based on dead reckoning of course and speed. The middle represents a curved vector based on course, speed and turn rate. The bottom display dynamic predicted positions for three ship positions ahead.
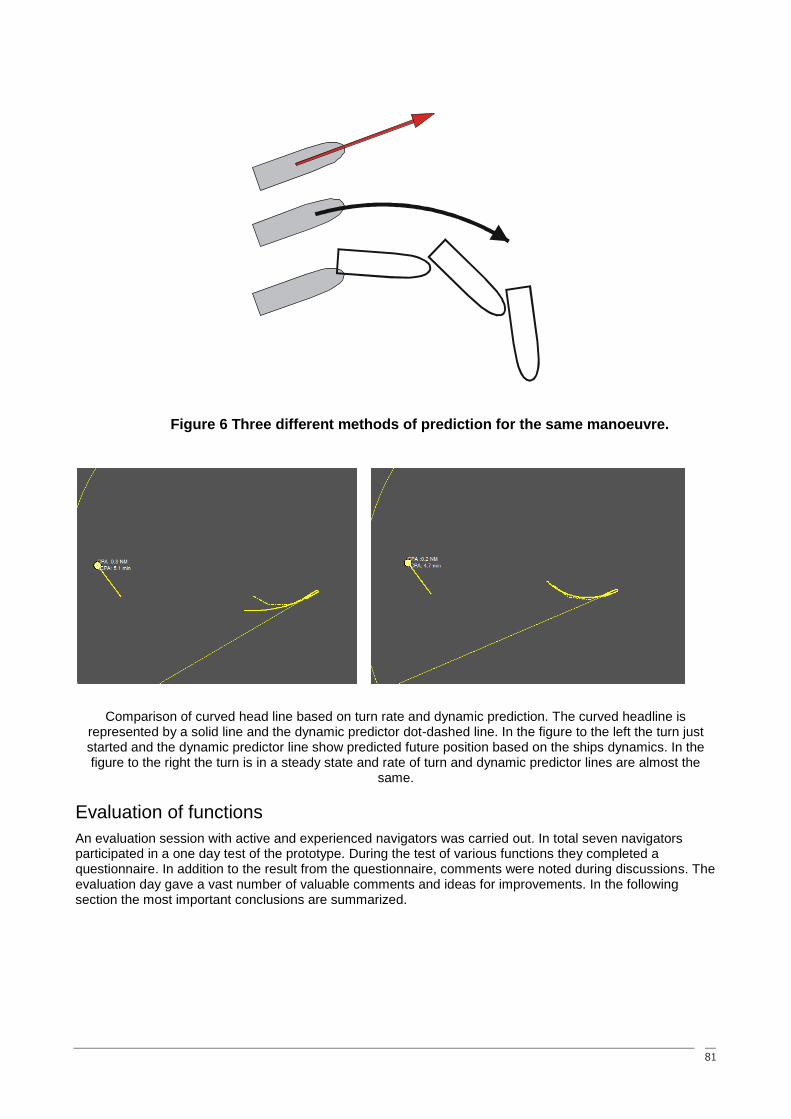
81
Figure 6 Three different methods of prediction for the same manoeuvre.
Comparison of curved head line based on turn rate and dynamic prediction. The curved headline is represented by a solid line and the dynamic predictor dot-dashed line. In the figure to the left the turn just started and the dynamic predictor line show predicted future position based on the ships dynamics. In the figure to the right the turn is in a steady state and rate of turn and dynamic predictor lines are almost the
same.
Evaluation of functions
An evaluation session with active and experienced navigators was carried out. In total seven navigators participated in a one day test of the prototype. During the test of various functions they completed a questionnaire. In addition to the result from the questionnaire, comments were noted during discussions. The evaluation day gave a vast number of valuable comments and ideas for improvements. In the following section the most important conclusions are summarized.
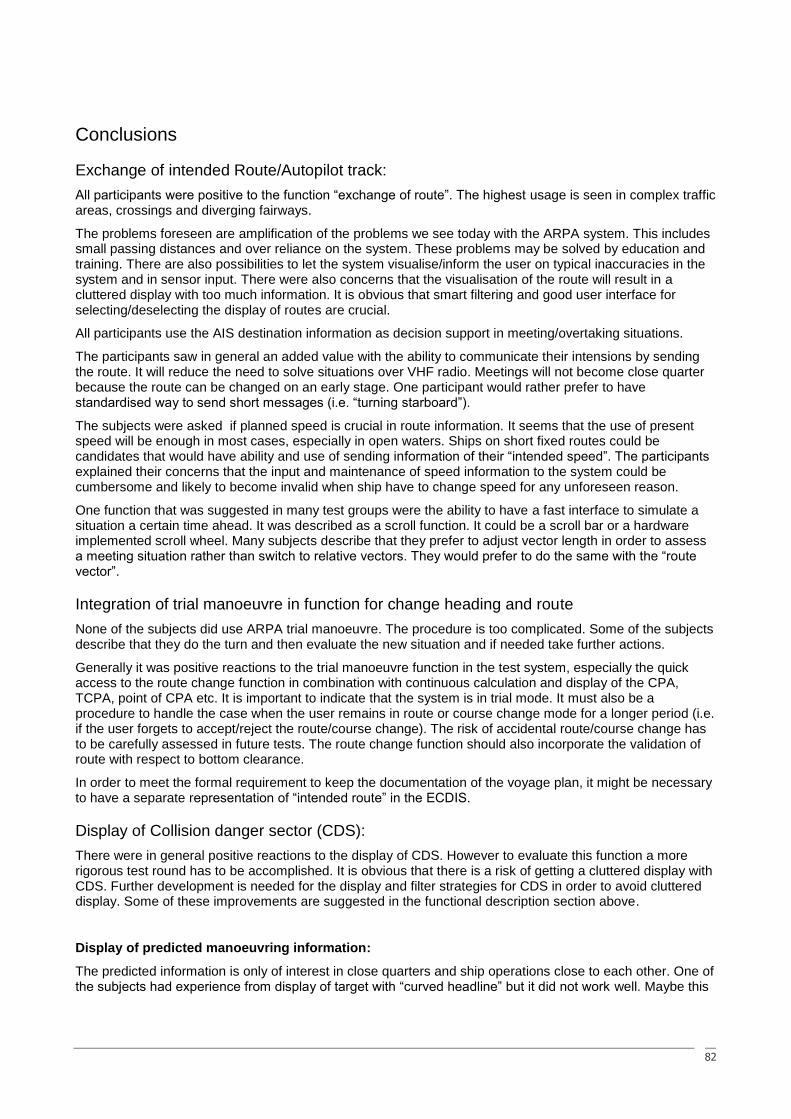
82
Conclusions
Exchange of intended Route/Autopilot track:
All participants were positive to the function ―exchange of route‖. The highest usage is seen in complex traffic areas, crossings and diverging fairways.
The problems foreseen are amplification of the problems we see today with the ARPA system. This includes small passing distances and over reliance on the system. These problems may be solved by education and training. There are also possibilities to let the system visualise/inform the user on typical inaccuracies in the system and in sensor input. There were also concerns that the visualisation of the route will result in a cluttered display with too much information. It is obvious that smart filtering and good user interface for selecting/deselecting the display of routes are crucial.
All participants use the AIS destination information as decision support in meeting/overtaking situations.
The participants saw in general an added value with the ability to communicate their intensions by sending the route. It will reduce the need to solve situations over VHF radio. Meetings will not become close quarter because the route can be changed on an early stage. One participant would rather prefer to have standardised way to send short messages (i.e. ―turning starboard‖).
The subjects were asked if planned speed is crucial in route information. It seems that the use of present speed will be enough in most cases, especially in open waters. Ships on short fixed routes could be candidates that would have ability and use of sending information of their ―intended speed‖. The participants explained their concerns that the input and maintenance of speed information to the system could be cumbersome and likely to become invalid when ship have to change speed for any unforeseen reason.
One function that was suggested in many test groups were the ability to have a fast interface to simulate a situation a certain time ahead. It was described as a scroll function. It could be a scroll bar or a hardware implemented scroll wheel. Many subjects describe that they prefer to adjust vector length in order to assess a meeting situation rather than switch to relative vectors. They would prefer to do the same with the ―route vector‖.
Integration of trial manoeuvre in function for change heading and route
None of the subjects did use ARPA trial manoeuvre. The procedure is too complicated. Some of the subjects describe that they do the turn and then evaluate the new situation and if needed take further actions.
Generally it was positive reactions to the trial manoeuvre function in the test system, especially the quick access to the route change function in combination with continuous calculation and display of the CPA, TCPA, point of CPA etc. It is important to indicate that the system is in trial mode. It must also be a procedure to handle the case when the user remains in route or course change mode for a longer period (i.e. if the user forgets to accept/reject the route/course change). The risk of accidental route/course change has to be carefully assessed in future tests. The route change function should also incorporate the validation of route with respect to bottom clearance.
In order to meet the formal requirement to keep the documentation of the voyage plan, it might be necessary to have a separate representation of ―intended route‖ in the ECDIS.
Display of Collision danger sector (CDS):
There were in general positive reactions to the display of CDS. However to evaluate this function a more rigorous test round has to be accomplished. It is obvious that there is a risk of getting a cluttered display with CDS. Further development is needed for the display and filter strategies for CDS in order to avoid cluttered display. Some of these improvements are suggested in the functional description section above.
Display of predicted manoeuvring information:
The predicted information is only of interest in close quarters and ship operations close to each other. One of the subjects had experience from display of target with ―curved headline‖ but it did not work well. Maybe this
83
is due to the fact that the ship is just sending ―turning port‖ or ―turning starboard‖. This is the most common way to send AIS data. Just a few ships send their real turn rate. Some of the subjects believe exchange of dynamic prediction can be useful but not in relation to impact regarding requirement on the system.
References
1 Bailey, N., Ellis, N., Sampson, H.; 2008; Training and Technology Onboard Ship: How seafarers learned to use the shipboard Automatic Identification System (AIS); ISBN: 1-900174-34-0
2 Fukuto J, Minami M, Niwa Y; 2009, Feasibility study on navigational intentions exchange support system by using simulations system; MARSIM 2009, INTERNATIONAL CONFERENCE ON MARINE SIMULATION AND SHIP MANEUVERABILITY, Panama
3 Grundevik P, Hüffmeier J, Wilske E; 2008; SSPA report 4005 3946-1, BaSSy – Decision support tool for VTS operators
4 Harding S. J.; 2002, The `ALVA CAPE' and the Automatic Identi®cation System:The Use of VHF in Collision Avoidance at Sea; THE JOURNAL OF NAVIGATION, 55.
5 Källström C G, Ottosson P, Raggl K J; 1999; Predictors for ship manoeuvring;12th Ship Control Systems Symposium SCSS, The Hague, The Netherlands, October 19-21
6 IMO SN.1/Circ.289; 2010; GUIDANCE ON THE USE OF AIS APPLICATION-SPECIFIC MESSAGES
7 Pedersen E, Fukuto J; 2003; APPLICATION OF A VISUALIZATION-BASED COLLISIONAVOIDANCE SUPPORT SYSTEM FOR SAFE NAVIGATION OF LARGE-SIZE HIGH SPEED CRAFT IN CONGESTED WATERWAYS; MARSIM 2003, INTERNATIONAL CONFERENCE ON MARINE SIMULATION AND SHIP MANEUVERABILITY, KANAZAWA, JAPAN
8 Pedersen E, Shimizu E; 2006; Prediction and Evaluation of Collision Risk to Multiple Targets on Electronic Nautical Chart Systems; ISIS 2006 International Symposium Information on Ships, Hamburg.
9 Recommendation ITU-R M.1371, Technical characteristics for an automatic identification system using time division multiple access in the VHF maritime mobile band, International Telecommunications Union.
10 Stitt I. P. A.; 2003; The Use of VHF in Collision Avoidance at Sea; THE JOURNAL OF NAVIGATION, 56.
11 UK MCA, United Kingdom Maritime Coastguard Agency; 2006; Marine guidance note 324 Radio: Operational Guidance on the Use Of VHF Radio and Automatic Identification Systems (AIS) at Sea
List of abbreviation and definition of terms
AIS Automatic Identification System. Transponder system for exchange of ship data such as identification, position, course, and speed via VHF data link.
ARPA Automatic Radar and Plotting Aid. Computerized functions allowing for tracking of radar objects and by the information obtained by the tracking,
84
calculate course, speed, CPA and TCPA, thereby assessing if there is a danger of collision. ARPA also include functionally for simulations of own ship course and speed alternation for planning of manoeuvres and collision avoidance. In order to provide true course and speed of tracked target the system need input from speed sensor and compass sensor.
BCR Bow Cross Range, is the range at which target will cross own ship's bow.
BCT Bow Cross Time, is the estimated time at which target will cross own ship's bow. If BCR is negative, BCR readout should be displayed as *.*. (When BCT is negative, BCT is x.x.)
Course-up
See Head-up.
CPA Closest Point of Approach. Closest distance between two ships in a meeting situation.
CDS Collision Danger Sector. Method to graphically display danger of collision with consideration of a specified acceptable CPA.
EBL Electronic bearing line. Tools for measuring bearings in radar and electronic charts.
ECDIS Electronic Cart and Display System. An IMO certified system using Electronic Nautical Chart (ENC).
GPS Global Positioning System. The Global Positioning System is a space-based global navigation satellite system (GNSS) that provides location and time information. GPS was created and realized by the U.S. Department of Defence.
GNSS Global Navigation Satellite Systems. This is the standard generic term for satellite navigation systems that provide autonomous geo-spatial positioning with global coverage.
Head-up In the maritime context is a display mode for radars or electronic charts head-up is when the display is azimuth oriented so ship heading is upward on the display. For electronic chart displays this mode requires input from a compass while radar no input is needed. Head-up is not to be confused with the same term head-up display (HUD), which is a technique for projecting information on the windscreen.
In North-up mode, the display is azimuth stabilized so north is upward on the display. For the radar this mode requires input from a compass while for the electronic chart displays no compass input is needed.
In Course-up mode, the display is azimuth stabilized so intended course is upward on the display. This mode maintains an egocentric view while eliminates cluttered display due to turns and yawing that can occur in head-up mode. For both radar and electronic chart display, this mode requires input from a compass.
IMO International Maritime Organization. United Nation‘s
organization for international cooperation in maritime matters
Intended route In this context the intended route is meant to be the intension on how
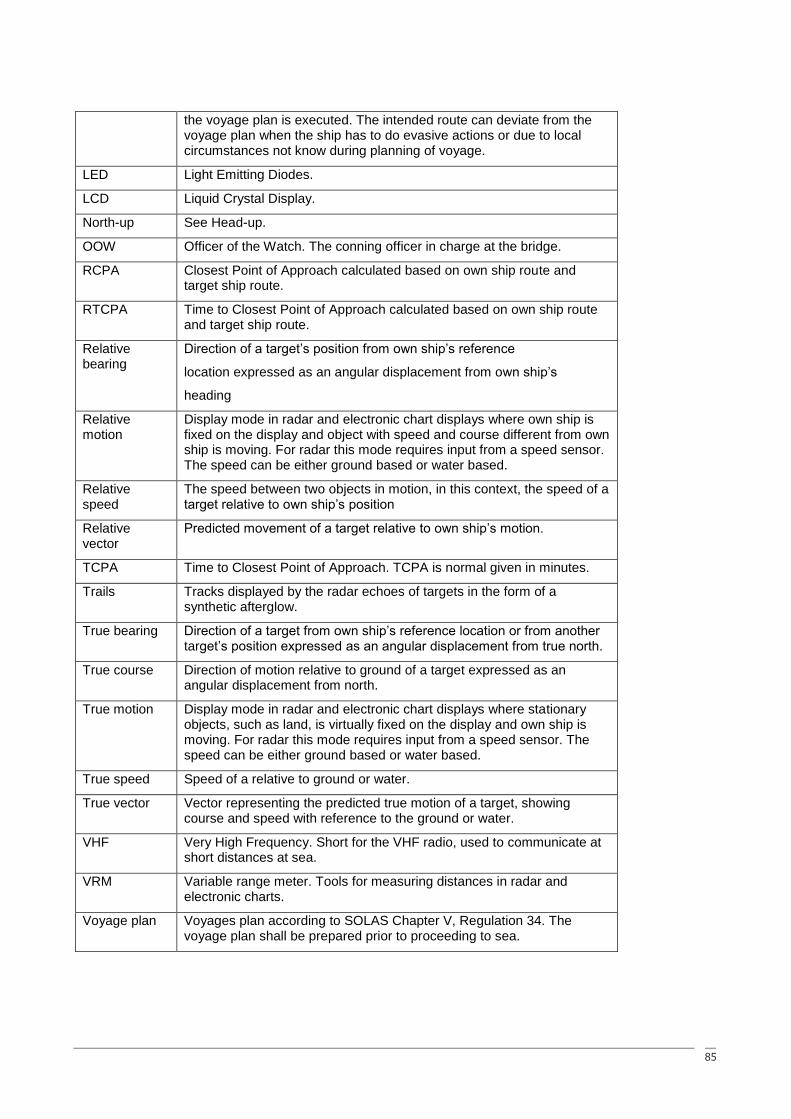
85
the voyage plan is executed. The intended route can deviate from the voyage plan when the ship has to do evasive actions or due to local circumstances not know during planning of voyage.
LED Light Emitting Diodes.
LCD Liquid Crystal Display.
North-up See Head-up.
OOW Officer of the Watch. The conning officer in charge at the bridge.
RCPA Closest Point of Approach calculated based on own ship route and target ship route.
RTCPA Time to Closest Point of Approach calculated based on own ship route and target ship route.
Relative bearing
Direction of a target‘s position from own ship‘s reference
location expressed as an angular displacement from own ship‘s
heading
Relative motion
Display mode in radar and electronic chart displays where own ship is fixed on the display and object with speed and course different from own ship is moving. For radar this mode requires input from a speed sensor. The speed can be either ground based or water based.
Relative speed
The speed between two objects in motion, in this context, the speed of a target relative to own ship‘s position
Relative vector
Predicted movement of a target relative to own ship‘s motion.
TCPA Time to Closest Point of Approach. TCPA is normal given in minutes.
Trails Tracks displayed by the radar echoes of targets in the form of a synthetic afterglow.
True bearing Direction of a target from own ship‘s reference location or from another target‘s position expressed as an angular displacement from true north.
True course Direction of motion relative to ground of a target expressed as an angular displacement from north.
True motion Display mode in radar and electronic chart displays where stationary objects, such as land, is virtually fixed on the display and own ship is moving. For radar this mode requires input from a speed sensor. The speed can be either ground based or water based.
True speed Speed of a relative to ground or water.
True vector Vector representing the predicted true motion of a target, showing course and speed with reference to the ground or water.
VHF Very High Frequency. Short for the VHF radio, used to communicate at short distances at sea.
VRM Variable range meter. Tools for measuring distances in radar and electronic charts.
Voyage plan Voyages plan according to SOLAS Chapter V, Regulation 34. The voyage plan shall be prepared prior to proceeding to sea.
86
Making the Phantom Real: A Case of Applied Maritime Human Factors
Author Name(s): Erik Styhr Petersen 1), Kjeld Dittmann 2), Margareta Lützhöft 3)
1) Lyngsø Marine A/S, Denmark, [email protected]
2) Lyngsø Marine A/S, Denmark, [email protected]
3) Chalmers Technical University, Sweden, [email protected]
Abstract
‗Everybody is talking about the weather; but nobody is doing anything about it‘.
The quote is attributed to the Danish lay philosopher and cartoonist Robert Storm Petersen (1892-1949), and is probably meant to signify that humans are often talk-ing about things they really cannot do anything about. Arguably, something similar could be said for the appli-cation of human factors in the maritime industry: ‗Many talk about Maritime Human Factors, but few are doing anything about it‘ – at least, there are no accounts in literature of a systematic, industrial application of hu-man factors in the commercial domain of shipping.
This is worrying in the perspective of safety, effective-ness and efficiency at sea, since these elements, even by definition, are intimately linked to human factors. In a word, there is a potential, under-exploited benefit in maritime human factors at large. In the present case, the concern is focused on the electronic information systems that can be found on-board any vessel afloat, installed in wheel houses and engine control rooms, partly due to international rules and regulations, and partly to optimize crew size and crew composition, the latter with the aim of remaining or increasing competi-tiveness. There is however good room for improvement, but with little market demand and no strict rule re-quirements for human factors engineering in the mari-time domain, the initiative remains with individual or-ganizations, or even with individuals.
The lack of human factors application in the maritime equipment industry may well be rooted in a correspond-ing lack of appreciation of human factors as a general discipline; perhaps in combination with a lack of opera-tional knowledge about how electronic, computer-based systems are designed for usability. With no case stories being told, and without clearly visible usability champi-ons, there might even be no inducement for change in the maritime equipment industry.
This presentation is intended to mitigate on some of these issues, first and foremost by telling the story of the user centred design process that was applied during the recent development of a new product line, which spans navigation and automation systems and applications, including radar, ECDIS, conning, alarm systems, re-mote control and automation. In this way, it is demon-strated that the design for good usability is indeed pos-sible in the maritime industry, given the will to under-take the investment, combined with the determination to overcome the associated barriers – because acquiring the necessary knowledge, creating an effective, opera-tional team with the necessary skills, and in general keeping the faith during the process is not without chal-lenges. Some of these are caused by the epistemologi-cally determined working differences between human factors and engineering, while others are caused by the iterative nature of human factors development, which contrasts to traditional software development methods.
In terms of conclusion, the paper raises the central issue of change: It is suggested that if maritime human fac-tors are to have a more widespread impact, Engineering needs to appreciate that the relevant social sciences are more than common sense, while Human Factors scien-tists must learn to appreciate the heuristic nature of Engineering.