Embed Size (px)
Citation preview
E N V I R P N M E N T 20023t W ~~~D E P A R T M E N T
_ it P A P E R S PAPER NO.69
TOWARD ENVIRONMENTALLY AND SOCIALLY SUSTAINABLE DEVELOPMENT
CLIMATE CHANGE SERIES
Transportation andCO2 Emissilons:Flexing the LinkA Path for theWVorld Bank
Lee SchipperCUIine Marie-Lilliu
International Energy Agency, Paris, August 1998
Septenmber 1999
Environmentally and Socially Sustainable Development The World Bank
ESSD
Pub
lic D
iscl
osur
e A
utho
rized
Pub
lic D
iscl
osur
e A
utho
rized
Pub
lic D
iscl
osur
e A
utho
rized
Pub
lic D
iscl
osur
e A
utho
rized

muTHE WORLD BANK ENVIRONMENT DEPARTMENTand THE TRANSPORT, WATER, AND URBAN UNIT
Transportationand CO2 Emissions:Flexing the LinkA Path for theWVorld Bank
September 1999
Papers in this series are not formal publications of the World Bank. They are circulated to encourage thought and discussion. The use andcitation of this paper should take this into account. The views expressed are those of the authors and should not be attributed to the WorldBank. Copies are available from the Environment Anchor,The World Bank, Room MC-5-128.

Contents
FOREWORD VII
ExEcuTrvE SuMMARY ix
ACRONYMS AND DEFINITIONS XI
Chapter 1Trends in Energy Use and CO 2 Emissions 1
Global trends in energy use and CO2 emissions 1Trends in carbon emnissions from energy use in IEA countries 5
Chapter 2Challenges Facing GHG Restraint in Transportation 13
Driving factors 13Facing carbon emissions from transport 15
Previous oil-saving and transport pollution control programs 16
Chapter 3Approach-Tools and Methods: How We Hook Solutions to Problems 19
Flexing the link-Analytical approaches to transport trends 19Flexing the link-Approaches to the policy challenge 22Relationship to Bank policy and operations 24
Role of global overlays 24Connection to Bank practices 24
Chapter 4Tools for Flexing the Link - Better Practices 27
Better policies 27Better practices: Technologies 28Better tools for carrying out integrated policies 29Interaction of policies and components of emissions 32Expanding the knowledge base-Better analytical tools 35
Climate Change Series iii
ransporation and CO2 Emiions: Fleang the Link--A Path for the Wxdd Bank
Top-down macro approaches 35
Using a bottom-up approach to measure costs and benefits 38
Feedbacks/bouncebacks 39
Improving the knowledge base - Concrete steps in client countries 40
Chapter 5Designing a Transportation/CO 2 Strategy for the Bank 43
Overriding issues facing any transport CO2 strategy 43
Issues facing development of a strategy in each region, country, or project 46Time frame and timing 46Policy framework and the interaction matrix 47
First steps in a cooperative country assessment 49
Chapter 6Conclusions 53
Annex ITrans,portation Activity, Energy Use, and Emissions in IEA Countries -A Brief Review 55
Velhide ownership and use trends 55
Economic forces and vehide fuel use 59
Annex 2Technologies -Vehicles and Fuels: The Potential Is There, but What DoesIt Cost? 63
REFERENCES 67
BoxEs1 Considering CO2 Reduction as a Collective Good 4
2 Decomposition of changes in CO2 emissions fErom travel or freight 11
3 Steps in a Transport GHG Mitigaticn Assessment-What We Need to Know 51
FIGURE.S
1 (a & b): Share of CO2 emissions (M:t C02), 1980 and 1994 1
2 Relative changes in CO2 emissions in 1980 and 1994 2
3 Growth in CO2 emissions in transport sector and total economy from 1980 to 1994 2
4 CO2 per capita, 1994 3
5 CO2 emissions per unit of GDP and GDP, 1994 36 Per capita GDP and per capita CO2 emissions from transportation, 1971-1995 67 Total carbon emissions per capita by major end use 7
iv Environment Departrnenr Papers
Contents
FIGURES (continued)8 Per capita GDP and per capita carbon emissions from travel sector in some IEA countries, 1970-
1994 89 Per capita GDP and per capita carbon emissions from freight transport in some IEA countries,
1970-1994 810 Breakdown of transport emissions per unit of GDP, 1973 and 1993/94 911 Car ownership and GDP 14
A.1 Automobile ownership and GDP 56A.2 Car use and per capita GDP 56A.3 Per capita domestic travel in OECD countries 57A.4 Carbon emissions from passenger travel 57A.5 Domestic freight and industrial GDP in industrialized countries, 1970-1993 57A.6 Breakdown of transport emissions per unit of GDP, 1973 and 1993/94 58A.7 Test fuel consumption per horsepower ratio 58
A.8 Evolution of car power 58A.9 Car fuel prices and fuel use in 1993 59A.10 Truck freight energy intensities in seven industrialized countries 60A11 On-road automobile fuel intensity in OECD countries 60A.12 Changes in CO2 emissions from travel, 1973-93/5 61A.13 Changes in carbon emissions for freight 1973-1992 61
Tables1 Key trends in population, economic activity and CO2 emissions, 1971 and 1994 5
2a Changes in carbon emissions from travel, 1973-1995, Laspeyres Decomposition, 1990 ModalStructure, 1973=100 9
2b Changes in carbon emissions from freight, 1973-1994, Laspeyres Decomposition, 1990 ModalStructure 10
3a Interaction matrix: Which policies affect which components of travel related emissions? 333b (continued) The interaction matrix for travel: Estimating the potential for changes that might
occur relative to A base case 344 Interaction matrix: Which policies affect which components of freight emissions? 355 Interaction matrix: Who cares about each policy? 366 Some potential strategies: Role of the World Bank and other actors 50
Climate Change Series v

Foreword
This paper will address the issue of reducing projects usually have secondary benefits incarbon dioxide (CO2) emissions from energy efficiency and local pollution reduction.transportation. We will focus on how the WorldBank, through its analytical capabilities, lending It is clear that transport is a key link betweenpractices, and policy influence, could contribute small isolated communities or societies andto significant mitigation in client countries and industrial economies, by permitting exchange ofelsewhere. We will not cover the entire range of goods over distance and enabling socio-culturalgreenhouse gas (GHG) emissions but rather interchange (Braudel 1992). Effectivefocus on CO2 emissions arising from transportation is also a key element in keepingtransportation in developing countries (DCs). markets competitive and raising choices forWe will use many examples from member both producers and consumers. Transport hascountries of the Organization for Economic Co- historically been instrumental in allowingoperation and Development (OECD) to people access to goods, services, and activities,illustrate important relationships often difficult and enhancing their opportunities forto quantify in other regions because of data and exchange, and hence economic growth. Formeasurement problems. We will suggest some most observers, therefore, transport has givenoptions for GHG restraint as illustrations but society an enormous surplus. There is,not provide a full list by any means. Rather, we nevertheless, widespread concem over the costswill discuss the more generic advantages - and of extemalities from transportation, whichchallenges - of these options, particularly as indude safety, air, water, and noise pollution,seen from the perspective of the World Bank. competition for urban space, balance of
payments problems, and risks associated withThe goal of this study is to develop the first importation of oil as the main transport fuel.steps of a World Bank strategy for restraining How to intemalize these costs, and how suchGHG emissions from transportation. With changes would affect vehicles, transportationfunding provided by the Global Environment activity, and the transportation infrastructure isFacility, the Bank's Global Overlay Program is to now the subject of considerable worldwidebe extended to include the transportation sector debate.in the identification of climate changeexternalities in Bank Economic and Sector Work The emnission of greenhouse gases, of which(ESW). While few developing country policy- CO2 is the most significant, is arguably of lessmakers are immediately concemed about immediate impact in monetary terms. Unlikerestraining their own emissions, many have congestion, noise, or air pollution, CO2come to realize that the costs of climate change emissions are not perceived as a problem thatmay well be significant for lower-income, affects a localized area or even presentprincipally agricultural economies. They also generations enough to provoke major changesrecognize that climate change mitigation in transportation or fuel use. Nevertheless, CO2
Climate Change Series vii
knspotation and CO2 Emissions: Eeangthe link-A Pathfor theVWid Bank
emissions from travel and freight have This paper begins with a brief review of globalincreased in most industrialized countries faster trends in CO2 emissions, with a more detailedthan population, and in many cases as rapidly analysis of emissions in Intemational Energyas gross domestic product (GDP). Indeed, in Agency (TEA) countries provided in an annex.virtually all regions of the world, C02 emissions Next, approaches and tools available to the Bankfrom transport are rising relative to total as part of the Global Overlays approach areemissions. Policy-makers in the major oil delineated. These tools come under the headingconsurning countries are attempting to of"better practices" (Technology"better practice"understand and address this phenomenon, options are reviewed in Annex 2). The papereven though it still may not be a high-priority concludes by outlining a series of steps towardsissue for policy makers in developing countries designing a strategy for the Bank in its(DCs) and the economies in transition (E[Ts). transportation sector work with client countries.
viii Environment Department Papers
Executive Summary
Transportation is one of the most rapidly rising and more rapid development and marketing ofsources of greenhouse gas (GHG) emissions, low-CO2 vehicles (including two and threeoften increasing faster than Gross Domestic wheelers in urban areas), and to developProduct (GDP) in developing countries (DCs). movement pattems that create access withoutPublic and private authorities in these countries an excessive demand for kilometers.tend to place a low priority on the externalitiesassociated with GHG damages, and are more The World Bank plays a key role in lending forimmediately concerned by those damages transportation in many DCs and Economies inassociated with safety, congestion or air Transition (EI. These projects, in the processpollution. This is largely because present of raising overall welfare and mobility, raisegenerations are exposed directly to these GHG emissions as well. A number of changesexternalities at the local level, while policies in policy, as well as expansion of efforts intoaimed specifically at reducing or restraining new areas, couldGHG enmssions contain elements of politicaland economic uncertainty or have few rewards Reduce GHG emission increases implcit infrom a national perspective, as the December1997 negotiations in Kyoto revealed. Given this many Bank transport projects
u7ncerotiaity, the strate option .Gisetoi Lead to greater restraint or abatement in itsuncertainty, the strategic option is to align chn conreinitiatives to restrain GHG emissions within clent countriesoverall transport reform.Vigorous research and f Encourage the international vehicle andmarketing of new less fuel-intensive vehicles, fuel efforts by helgreape theand carbon taxes favoring low-carbon fuels can innovation efforts by helping shape theachieve significant restraint; stabilization or market for low-carbon motorized vehicleseven reductions in emissions from transport in the rapidly growing DCs and thecould occur by the second or third decades of restuctured Ells.the next century.
The Bank can achieve these objectives byFor DCs, with significantly more rapid growth undertaking a strategic plan that contains thein vehicle stocks and utilization, the real policy following elements:challenge is to reform transportation policiesand customs now, in order to eliminate obvious * Help establish a policy framework in whichand hidden subsidies and make users pays full client country authorities and stakeholderssocial costs while boosting overall social can evaluate and debate the options forwelfare. Even in rapidly growing countries, it improving the environmental performancewill take decades for policies, technologies, and of transportaltemative fuels to halt the rise in emissions * Encourage policies that allow cost recoveryand ultimately to reduce emissions. The most and price externalities into transportationattractive option for DCs is to encourage wider costs (fuels, road use, and so forth)
Climate Change Series ix
17±nsportation and CO2 Emissions: Mexng the link:-A Path for the Wrld Bank
Accelerate development and share Economic and Sector Work, and to identifydeployment of low-CO2 cars and tru.cks, as GHG-reduction friendly options that couldwell as"clean"two- and three-wheeled then be financed through the Globalaltemative vehicles Environment Facility (GEF), the proposedFinance development of infrastructure that Prototype Carbon Fund, or the Cleansupports innovative and financially viable Development Mechanism of the Kyoto Protocol.collective transport systems (for exarnple The ASIF methodology described in this paperthe system in Curitiba, Brazil reduces offers an analytical framework that is in lineautomobile use in a town with the highest with these objectives. By decomposing trends incar ownership in the country) emissions into transportation Activity, modalLink CO2 emission reduction efforts to Shares, the energy Intensities of each mode andmajor initiatives to reduce air pollution, the Fuel mix of each mode with its GHGcongestion, and other severe local problems emissions characteristics, the key componentscreated by rapidly growing volumes of of change in transportation activity aretraffic analyzed. For example, interventions in I and FAssume a proactive role, working directly (technologies and utilization) have the largestwith vehicle suppliers, technology promise for restraint, while policies that affectdevelopers, and client country policy- A and S through broader transport reform willmakers to broker agreements among these also restrain emissions.stakeholders to develop new markets withlow-emissions transportation options To achieve meaningful results, the Bank mustProvide Technical Assistance (and in- look beyond individual project planningcountry capacity building) for basic towards a strategy where sequential projectspassenger and goods movement sunreys, and policy planning is viewed in a longer-termfuel-use and emissions testing of new and perspective. Policy actions must be few but dearexisting vehides, as well as land-use in nature and strong in impact to reduce thedevelopment models. risks of having no impact or perverse outcomes.
Taking this longer-term perspective ensures anhe Gi'obal Overlay Program represents an active Bank role during a significantly long
excellent opportunity for Bank initiatives to period of development (one to two decades).embrace a full range of low GHG options. The Such an approach is required if low-GHGP rogram's objective is to integrate global vehicles and systems are to be developed andciimate change externalities into Bank successfully implemented.
x Envirorunent Department Papers
Acronyms and Definitions
IEA assessments, and there are other substancesThe Intemational Energy Agency, whose which in the atmosphere can increase theparticipating countries are: Australia, total warming effect. In this study, we referAustria, Belgium, Canada, Denmark, principally to CO2 emissions and countFinland, France, Germany, Greece, Hungary, them as carbon that is bumt as fossil fuels.Ireland, Italy, Japan, Luxembourg, the Further, we count available carbon, sinceNetherlands, New Zealand, Norway, only careful measurements determine howPortugal, Spain, Sweden, Switzerland, much carbon in fossil fuel combustion isTurkey, the United Kingdom, the United fully oxidized to carbon dioxide.States.
Energy Use and Carbon EmissionsOECD This study considers emissions arising from
The Organization for Economic Co- final energy uses in transportationoperation and Development, whose including the average emissions associatedcountries include those of the IEA as well with generating a unit of electricity in aas Iceland, Poland, the Czech Republic, country. We generally count carbon, ratherRepublic of Korea and Mexico. than C02, since we do not know exactly
how much carbon that is combusted reallyDC winds up as CO2
Developing CountriesFull Fuel Cycle Analysis
EIT We do not consider emnissions associatedEconomies in Transition, which includes with the fuel cycle of making othercountries of the Commonwealth of transportation fuels. These are muchIndependent States (CIS), and countries of smaller than those associated withCentral and Eastern Europe, including for production of electricity from fossil fuels.this discussion those that have joined the However, the differences in full fuel-cycleOECD or IEA. emissions from transport fuels must be
carefully considered in the future asGHG altematives are offered that may indeed
Greenhouse gases. As defined by the IPCC release fewer GHG in vehicles while being(IPCC 1990), these include a variety of associated with greater GHG emissions ingases that increase the atmosphere's ability preparation, of the converse. Diesel fuel, forto trap infrared radiation and thus warm up. example, releases more carbon per unit ofThe most important of these is carbon- energy contained (and holds more energy/dioxide (CO2), but methane (CH4), nitrous liter) than gasoline, but has much smalleroxide (N20) are also counted in many carbon releases associated with its
Climate Change Series xi
lansportation and CO2 Emissions: Fledng the ink -A Path for the V\bild Bank
production. So-called renewable ethanol * Avoidance connotes growth in a particularfrom corn, as produced in the United States activity that by design or accident is notfor blending with gasoline in gasohol, associated with increasingly higher GHGrepresents at best a 10 percent decline in emissions. Development of a transportationnet carbon emissions per unit of eneigy system based only partly on automobiles,compared with gasoline, and possibly even with low-CO2 fuels (relative to gasolinean increase (Delucchi 1997). This is because and diesel fuels) and high access of peopleof the fuels used to harvest and process the to each other and goods to markets withethanol, release so much carbon. In each relatively low distances involved is thecountry full fuel cycle analysis must be 'ideal system', but such a system does notapplied to truly see the GHG implications exist today.of alternative fuels. * Restraint in GHG emissions means active
policies designed to increase the size of theGHG Reduction wedge between growth in GDP and growth
in emiussions. In some IEA countries thisThree hinportant concepts are associated with cu mean a dcie In t oute (oiecoul mean a declin in th absolute (or perthe genieral goal of GHG eissions reduction. capita) level of emissions. In developingAll are relative concepts. countries this in practice means increasing
Abatement means quasi-permanent the gap between economic growthabsolute reduction, particularly in the short (measured by GDP) and emissions growth.or long term. Abatement might occur if In EITs, restraint could well mean fallingthere is a rapid switch in fuel to one with emissions and rising economic activity aslower emissions per unit of energy, rapid the least efficient power plants, factories,enough to outweigh overall increases in the and most CO2 intensive fuels (coal andsize of the economic system or the output lignite) are simply abandoned.or activity for which that fuel us used,
xii Environment Department Papers
Trends in Energy Useand CO2 Emissions
The following sections present a brief global and the Middle East. Indeed, in the OECD,overview, followed by detailed analysis of emissions from energy-related sources othertrends in IEA countries. Similarities between than transport in the early 1990s were barelyIEA countries' transport sectors and those of higher, or even lower, than they had been inhigh income DCs suggest many of the forces 1973. Normalized per unit of GDP, emissions inthat affect transport trends in IEA countries are every major IEA country for all sectors butimportant for DCs. These trends reveal many transportation fell significantly. In other words,important variables and forces that must be all sectors of the economies of IEA countriesunderstood, if transport policy and Bank actionis to affect the future of transportation and Figure 1. Share of C02 Emissions (Mt C02),resulting GHG emissions in non-IEA countries. 1980 and 1994The section concludes with a description of the 1980ASIF methodology, which is a useful analytical A3id=. 2% Ladk,A, w. 3%
framework for analyzing past changes in MW Gut 2%emissions and essential for confronting ECEup 5%
possibilities for the future.
In this section, we principally refer to Carbon F,n' USSR 1%
Dioxide (CO2 ) as the major gas listed under the OEMC s7%definition of Greenhouse Gases (GHG).
Asm udIahs CNl 5%
Global trends in energy use andCO2 emissions
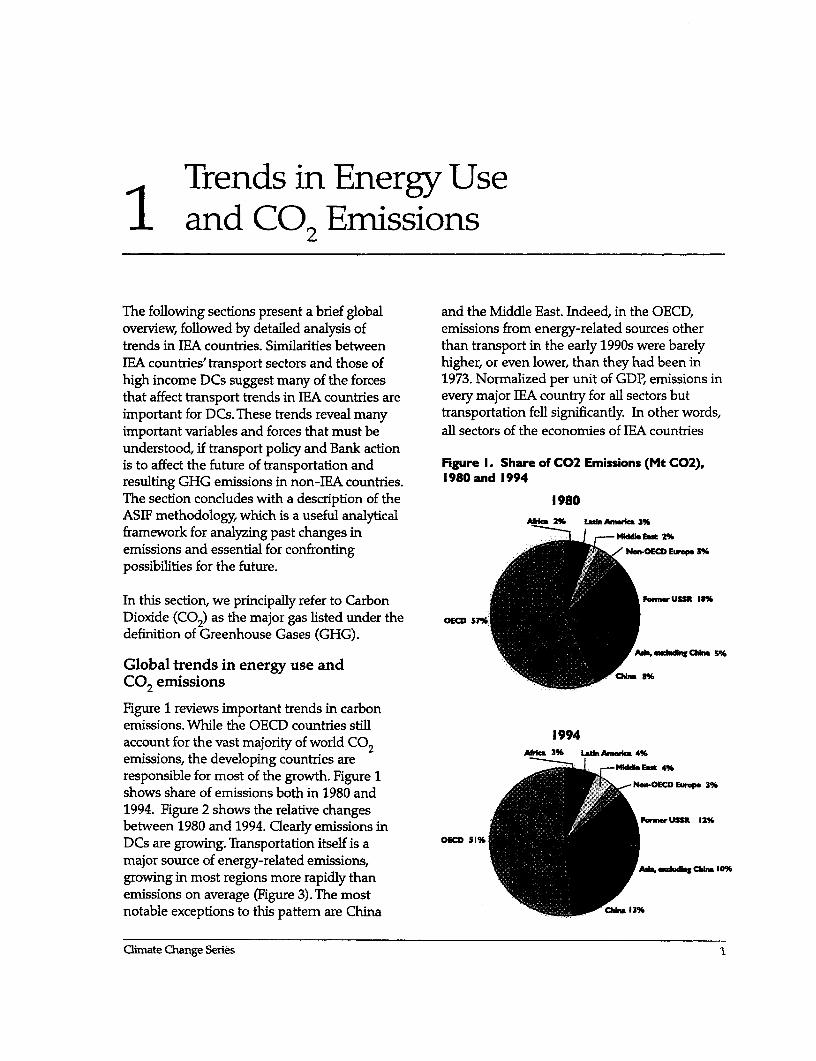
Figure 1 reviews important trends in carbonemissions. While the OECD countries stillaccount for the vast majority of world CO2 1994emissions, the developing countries are Mkh,Af 4%
responsible for most of the growth. Figure 1 Non-OECD Ewap 3%
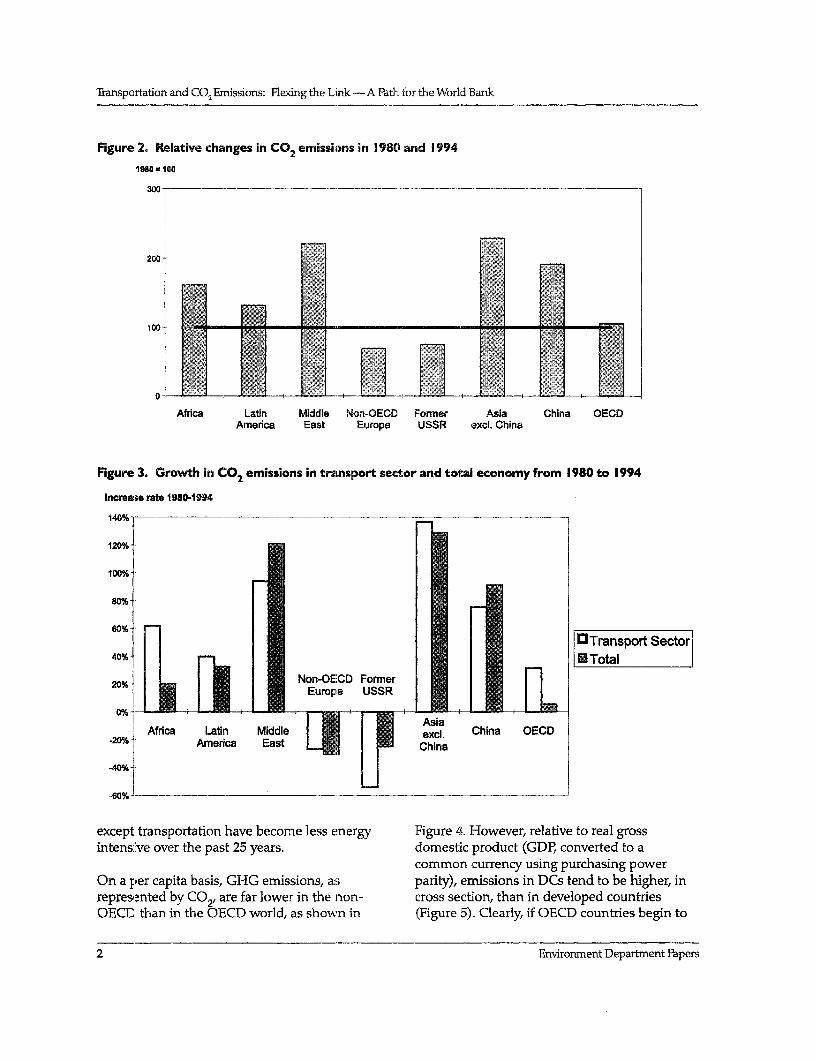
shows share of emissions both in 1980 and1994. Figure 2 shows the relative changes Fm S i_between 1980 and 1994. Clearly emissions in F 512
DCs are growing. Transportation itself is a OSCO 51%
major source of energy-related emissions, A" ^o_ g wa 10%
growing in most regions more rapidly thanemissions on average (Figure 3). The most 13%
notable exceptions to this pattern are China Ching 13%
Climate Change Series 1
Transportation and CO2 Emissions: Flexing the Link-A Pa*. for the World Bank
Figure 2. Relative changes in CO2 emissions in 198UI and 19941980 - 100
300-
Africa Latin Middle Non-OECD Former Asia China OECDAmenca East Europe USSR excl. China
Figure 3. Growth in C02 emissions in transport sector and total economy from 1980 to 1994
Increase rate 1980-1994
140%
120%.-
100%-I
80%- .
60%--lTransport Sector
40%- H Total
Non-OECD Former20%-- ~~~Europe USSR
0%-Asia
Afrca Latin Middle excd. China OECD20% America East China
-40%
except transportation have become less energy Figure 4. However, relative to real grossintensive over the past 25 years. domestic product (GDP, converted to a
common currency using purchasing powerOn a per capita basis, GHG emissions, a-; parity), emissions in DCs tend to be higher, inrepresented by C02, are far lower in the non- cross section, than in developed countriesOECD, than in the OECD world, as shown in (Figure 5). Clearly, if OECD countries begin to
2 Environment Departrnent Papers
Tlends in Energy Use and CO2 Enissions
Figure 4. CO2 per capita, 1994
12
10 D Rest of EconomyI 8 Transport
I~~~~~~~~~~~~~~~~~~~~~. 0
restrain their emissions, while developing emissions from the DCs will overtake thosecountries-whose economies are growing more from the OECD within a fairly short timerapidly than those of the OECD-do not, total period. Politically, however, GHG mitigation in
Figure 5. CO2 emissions per unit of GDP and GDP, 1994
0.9 * Transportation Sector* c-b- * Others Sectors of the Economy
0.8M Asia Exkudit ChinaI 0.7 a Foarw USSR
RX 0.6
O 1L 0.5 11 OECD
0.5 * osc0.4
'o 8~~~~ Afrlea
0.3
0.2o 0.2 + * Middb Eaat * OECD
Asia exdudhi Cl
0.1 * Non-OECD EuropeAMca ~Mdde Eas a LaUn Amerdca
Chh"'o USSR * Laln Amirka0 * Non-OECD Eumpe
0 2000 4000 6000 8000 10000 12000 14000 16000 18000
Per Capita GDP (590 PPP USS)
Climate Change Series
Tlansportation and CO2 Emissions: Flexing the Link-A Path for the World Bank
DCs has a negative connotation today because relationship between per capita GDP and perit is perceived as a denial of the basic righlt to capita CO2 emissions from transportation forgrowth in human services and economic various world regions. Unlike those fromactivities. The key to changing this percelption stationary uses of fuel, emissions fromis both to link GHG mitigation to policy transportation grew strongly, pausing in all butinitiatives in other sectors with goals that are a few countries only briefly after each of theperceived to be of far greater immediate two oil shocks of the 1970s. This coupling is inrelevance than GHG mitigation, and to tiy to part a reflection of the constancy of emissionsuncouple, or at least'flex,"the heretofore rigid per unit of energy for transportation, which islink between economic growth and GHC1 almost entirely based on oil products with littleemissions, as IEA countries have done outside variation in CO emitted per unit of energytheir transportation sectors. The transportation contained. 2sector provides many opportunities for the
former, and many challenges for the latter. Figure 5 showed emissions from transport and
Table 1. summarizes key trends in populalion, from other sectors in cross section. What iseconomic activity (real GDP), primary energy striking from these two figures is how theuse, arnd CO2 emissions. The latter two aie emissions per unit of real GDP fal as incomebased on submissions to the IEA by memrber increases for non-transport sectors, but seem tocountries and other authorities, with emissions remain constant for transport. We shall referfrom energy tabulated according to IPCC: constantly to this apparent constant orpractice. inflexible link.
The challenges from the transport sector are The goal of CO2 mitigation, of course, is to"flex'hinted at in Figure 6, which shows the this link. To do that, however, we have to
Box 1Considering CO2 reduction as a collective good
CO2 emissions reduction has the characteristics of a"collective good"- that is, the benefits are transnational and arenon-iexcludable (that is, they accrue to everyone, even to those not restraining emissions). The problem of"free-riding," therefore, is integrally bound up in the CO2 emissions reduction problematique. With most of the presentindustrial-age carbon emitted by the wealthy c ountries, the rest of the world does not feel an obligation to moderatethis burden. Ironically, the consequence, in terms of climate change, might hurt the agriculturally oriented develop-ing economies of the South more than the indiustrial economies of the North.
Determining how emissions can be reduced or restrained in all economies through techniques and policies that arelow in cost to the growing economies is a necessary component of any CO2 reduction strategy. In doing so, however,developing economies may find that through the larger process of economic reform and growth, their economiesbecome far less energy-intensive (in terms of energy use per unit of activity) than today. Similarly, through struc-tural reforms in particularly energy-intensive sectors, such as electricity, industry, and transport, these economiesmight reduce energy- and carbon-intensity. In short, they may find unique development paths that lead to overallless energy- and carbon-intensive development pattems, at a given level of real income, than is (or was) the case forthe older economies of the North, which developed when carbon emissions were not a concem.1
Ironically, gradual but large success in restraining carbon emissions in northem countries could lead to somewhatlower prices for fossil fuels than otherwise because of the restraint in world-wide demand growth that would follow.All else equal, this would stimulate demand for the same fuels in DCs. At the same time, improvements in energyefficiency forged by the North as part of its restraint strategy would be available to the South for free. While we donot argue here that lack of world agreements on a global strategy to restrain emissions means actions must halt, itmust be acknowledged that the picture of participation is complicated.
4 Environment Department Papers
Trends in Energy Use and CO2 Emissions
Table 1. Key trends in population, economic activity and CO2 emissions, 1971 and 1994, exceptChina 1980 and 1994
go PPP Mt of k C02 per Unit ofYear Million P US$ Mtoe C02 kg C02 oer capita GDP (90 PPP US$)
Total Transport Total Transport
Africa 1971 370 1560 76 251 677 157 0.43 0.101994 694 1526 221 684 984 164 0.65 0.11
LatinAmerica 1971 235 5043 143 391 1,665 511 0.33 0.101994 379 6917 308 770 2,029 710 0.29 0.10
Middle East 1971 67 4370 54 147 2,195 377 0.50 0.091994 151 3548 297 823 5,435 1,136 1.53 0.32
Non-OECD 1971 89 4762 178 606 6,785 737 1.43 0.15Europe 1994 103 5128 202 638 6,168 510 1.20 0.10
Former USSR 1971 245 4891 768 2,433 9,909 1,065 2.03 0.221994 294 3373 936 2,488 8,450 545 2.51 0.16
Asia ex China 1971 1095 977 171 551 503 105 0.52 0.111994 1772 2181 709 2,050 1,156 216 0.53 0.10
China 1980 981 1755 413 1,481 1,510 84 0.86 0.051994 1190 3247 791 2,835 2,380 122 0.73 0.04
OECD 1971 813 10644 3,249 9,116 11,211 2,245 1.05 0.211994 992 16148 4,521 10,968 11,046 3,036 0.68 0.19
Source: International Energy Agency, Energy Balances of Member Countries, Energy Balances of Non-Member Countries, and IEASecretariat calculations.
understand the apparent inflexibility. We do the predominant reasons for the dedine inthis by examining more closely some countries emissions, relative to GDP, were lower energyof the IEA, for which data allow finer analysis. intensities, that is, the amount of energy used
per unit of activity. In the IEA, these lowerTrends in carbon emissions from energy intensities were particularly apparent foruse in IEA countries 2 manufacturing (branch by branch, lower energy
input to either material or per-sub-sector GDP),Schipper and others (1997) reviewed trends in space heating in homes and other buildingsemissions from energy end-uses in nearly a (energy per square meter of space-heated),dozen IEA countries. The analysis indicates that electric appliances, and for some countries, the
Climate Change Series 5
Transportation and CO2 Emissions: Flexing the Linkl-A Path for the World Bank
Figure 6. Per capita GDP and per capita CO2 emissions from transportation, 1971-1995
Per caipita C02 Emissions from Transport sector(kg C02)
6-
-- AfricaLatin America
5 - - Middle EastNon-OECD Europe
X Former USSR4! 'Asia Excluding China
4 + ChinaAustralia + NZ
-"-Japan3 -0-US + canada
--*OECD Europe IF
2-
0 5000 10000 15000 20000 25000Per capita GDP C90 PPP USS)
freighit sector (energy per ton-kilometer of occupant), and the travel sector (more cars pergoods moved). Only in the United States and person, and more car usage relative to otherCanada did energy intensities for travel--- modes).energy per passenger kilometer-faDlsignificantly. Overall, the intensity declines in IEA countries
were quanititatively more important than theStructural changes within sectors-that is, structure changes when all sectors are takenchanges in the underlying composition of together; consequently, emissions per unit ofactivity within the sector-also contributed to GDP fell. Changes in the mix of raw fuels usedsome reductions emissions in some sectors for to produce energy in IEA countries acted tocertain countries; for example, changes vithin reduce CO2 emissions in some countries,the manufacturing sectors of West Germany, particularly where coal and oil yielaed tothe Urnited States, or Japan, or the overall natural gas. In other countries, however, wheredecline of manufacturing in the United coal-based electricity increased its share in finalKingdom, led to some restraint in GHG energy use, fuel mix changes actually increasedemissions. However, structural changes equally CO2 emissions. In the electricity sector itself,enhanced emissions in some sectors in many increased use of hydro, nuclear, natural gas, andcountiies, notably the residential and buildings renewables in a few cases, and overallsectors< (more space and more appliances per improvements in generation efficiency reduced
6 Environment Department Papers
Trends in Energy Use and CO2 Emissions
the emissions associated with a kWh of uses more in the non-IEA countries. The oneelectricity used in every economy. common element of increase is transport.
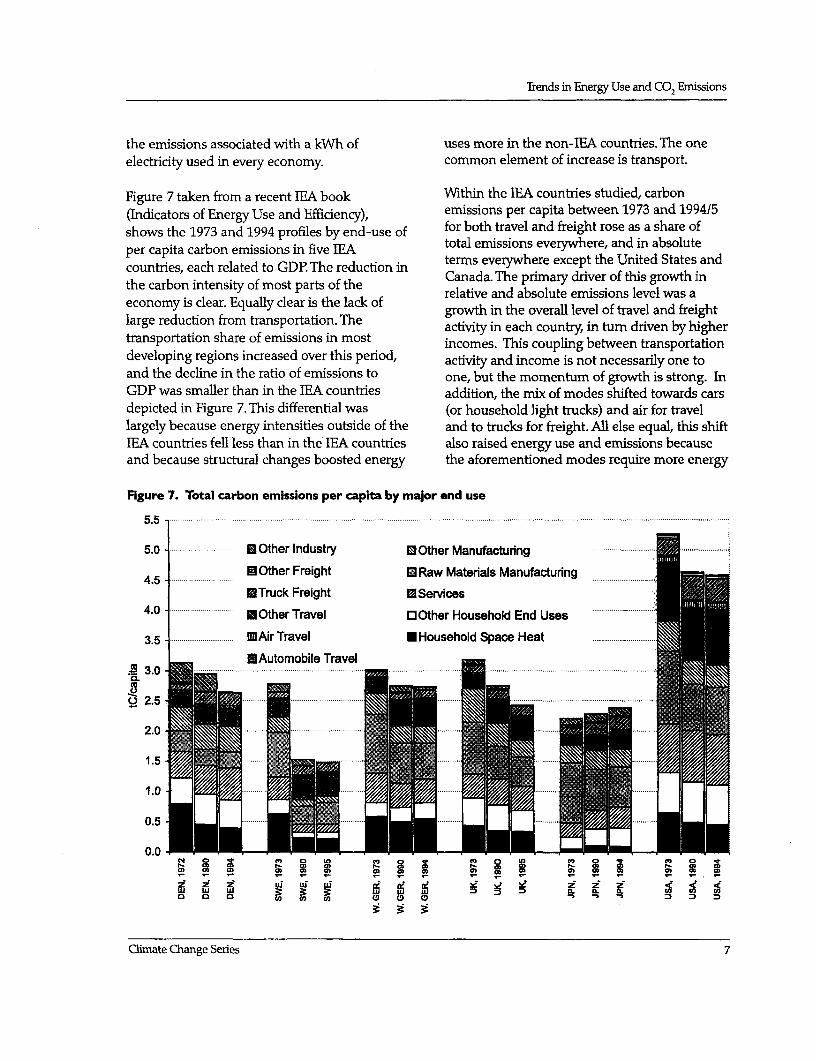
Figure 7 taken from a recent IEA book Within the IEA countries studied, carbon(Indicators of Energy Use and Efficiency), emissions per capita between 1973 and 1994/5shows the 1973 and 1994 profiles by end-use of for both travel and freight rose as a share ofper capita carbon emissions in five TEA total emissions everywhere, and in absolutecountries, each related to GDP. The reduction in terms everywhere except the United States andthe carbon intensity of most parts of the Canada. The primary driver of this growth in
relative and absolute emissions level was alargeon reductisn clear. Equal eartis The lackofgrowth in the overall level of travel and freightlarge reduchon from transportation. The activity in each country, in tur driven by highertransportation share of emnissions in most incomes. This coupling between transportationdeveloping regions increased over this period, activity and income is not necessarily one toand the decline in the ratio of emissions to one, but the momentum of growth is strong. InGDP was smaller than in the IEA countries addition, the mix of modes shifted towards carsdepicted in Figure 7. This differential was (or household light trucks) and air for travellargely because energy intensities outside of the and to trucks for freight. All else equal, this shiftIEA countries fell less than in the IEA countries also raised energy use and emissions becauseand because structural changes boosted energy the aforementioned modes require more energy
Figure 7. Total carbon emissions per capita by major end use
5.5 .
5.0 . --- .. . Other Industry MOther Manufacturing - -.-
4.5 ............. Other Freight llRaw Materials Manufacturing4 Truck Freight IServices
4.0 ---- M Other Travel 0 Other Household End Uses
3.5 DllAir Travel * Household Space Heat
UlAutomobile Travel.S 3.0 n=.
p2.0 E . ..........
1.0
0 .5 ...... .. ..........
0.0Climate 0 L O 0~~-. a~ m r..~ m a, F_. - -S
N 0 ~~~~~ o~~C 0 U ! Sr- a ,T I S i
2! 2~~ 2! LLi LLi Ne ~~~e 2! 2! 4o o 0 a~~~~~~~~ w 0 0~~~ld 0 ) : a. a. a
Chimate Change Series7
lTnsportation and CO2 Emissions: Fleong the Link-A Path for the World Bank
Figure 8. Per capita GDP and per capita carbon emissions from travel sector in some IEA countries,1970-1994
+ U.S. x U.K.
1tO00 oFrance * * , * ** W.Germany
t 00 A Denmark_ Sweden
S AJapan3 aitmo Netherlandsw £00
jLI
4.00 -- + -- * +
o~~~~~~~~~ ~~A A200 A~* 0 4VC OeQ
0 I I I~~~~~~~~~~~~~~~~~~~~~~~~~~~~~~ p *
O - i i - i I7500 10000 12500 15000 17500 20000 22500
Per capfta GDP (90 USS)
Figure 9. Per capita GDP and per capita carbon emissions from freight transport in some IEAcountries, 1970-1994
5w*U.S.
450 xU.K.o France Freight *.
400 * W.GermanyA Denmark
w 350 + Sweden0 A Japan
_ NetherlandsI= 250a
200 A *&A AA I, A
CL ~~AA& AAAAAAA A $ A150 AA A AALA AAg ,'O O
100 ,, ** 4'iA. XX X Ct<tl @ + -°*
50
07500 10000 12500 15D00 17500 20D00 22500
Per capita GDP (C0 PPP USS)
8 Envirornent Department Papers
Trends in Energy Use and CO2 Enissions
Figure 10. Breakdown of transport emissions per unit of GDP, 1973 and 1993/94
zi 100.0CO Q Other Freighta. 90.0
ETruck Freight0 80.0
2 00 0 Other Travel
k 60.0- . k . i *~~~~~~~~~~~~~~~~~~~~~~111AirTravelIL60.0-ao3 50.0 . Automobile Travel
c 40.0c
=, 30.0
* 10.0W0.
0.0 - I~(V I . I
o° °! 0) a) 0) a')
LU Li LU LU £0mW 0A c CD (9 i. i0.; c
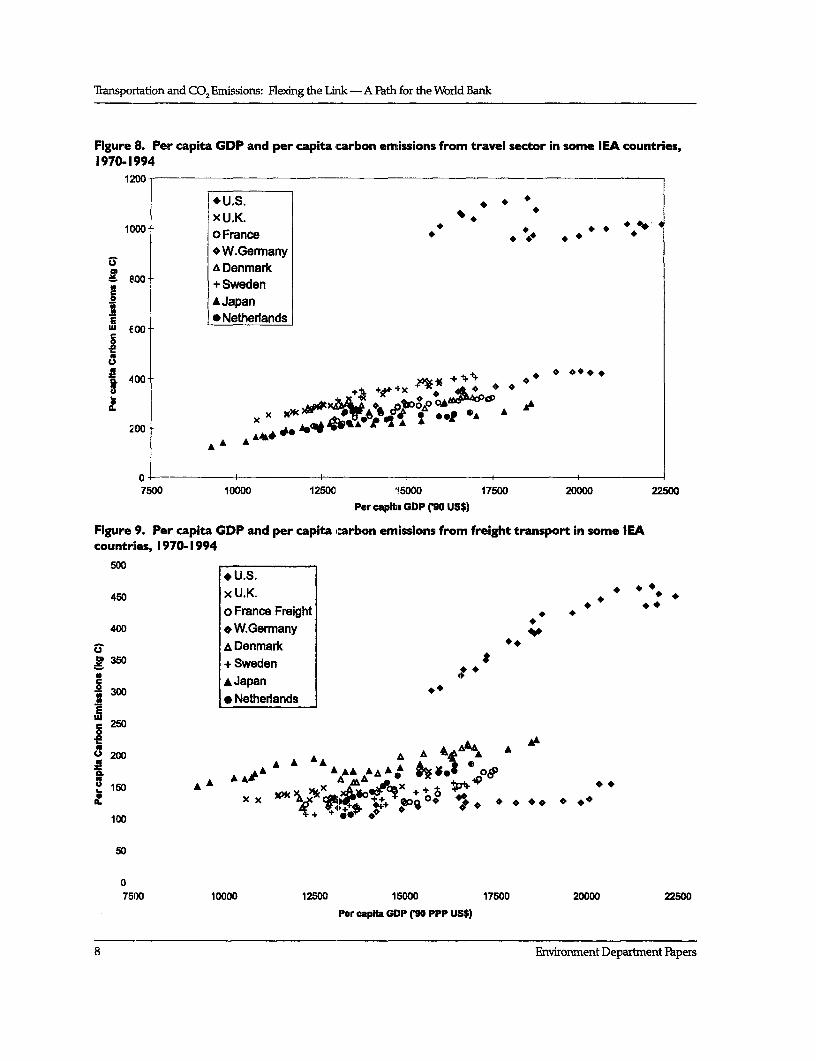
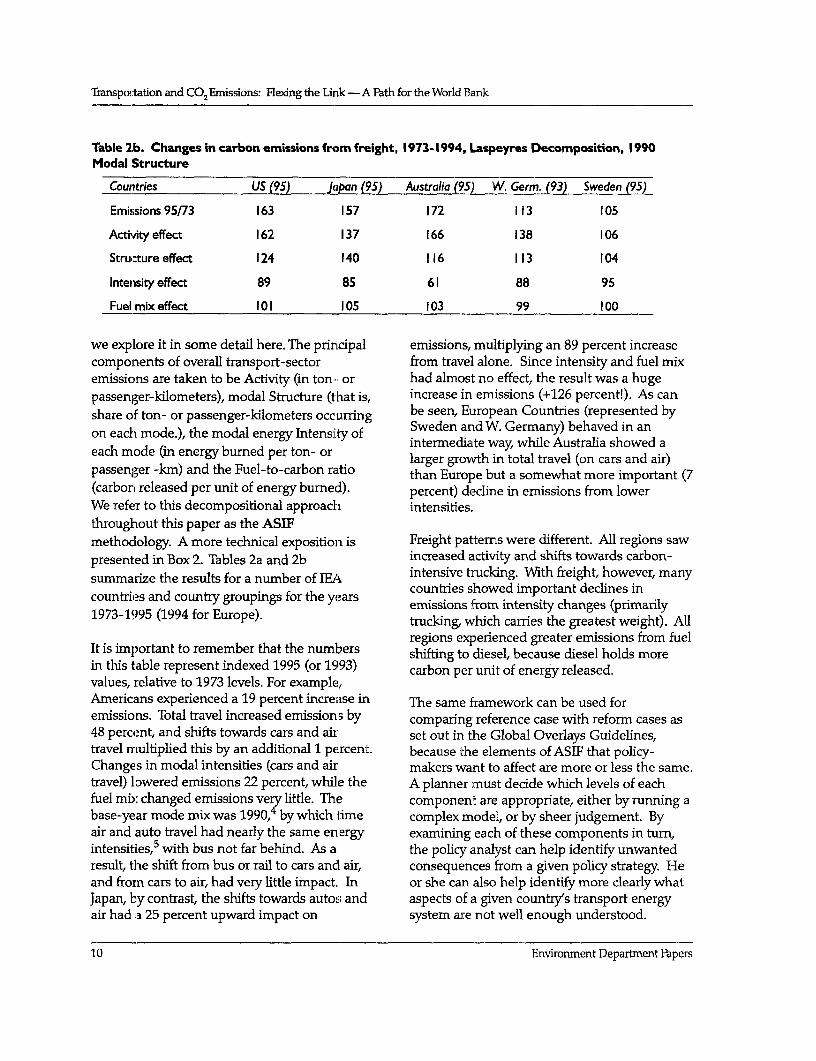
(and release more carbon) per passenger or The above analysis expresses in words a moreton-kilometer. Finally, while there were some detailed analysis conducted by Lawrencereductions in specific intensities in many Berkeley National Laboratory, using an indexcountries-for trucking and air travel in most decomposition of the multiplicative factorscountries and for car travel only the United underlying changes in CO2 emissions fromStates and Canada-these intensity reductions both freight and travel. (Schipper, Steiner,
Duerr, An, and Stroem 1992; Schipper andwere too weak to reduce, and could therefore others 1996; Scholl, Schipper and Kiang 1996;only restrain, the emissions caused by activity Schipper, Scholl and Price 1997) Thisgrowth and structural shifts. When all these decomposition framework is useful not only forchanges are counted, per capita emissions from analyzing past changes in emissions but alsofreight are higher in every country in the 1990s for confronting possibilities for the future.3 Itthan in the 1970s, and per capita emissions are forms the basis of our proposed analyticalrising everywhere, as shown in Figures 8 and 9. methodology for the Bank and, for that reason,
Table 2a. Changes in carbon emissions from travel, 1973-1995, Laspeyres Decomposition,1990 Modal Structure, 1973 = 100Countries US (95) Japan (95) Australia (95) W. Germ. (93) Sweden (95)
Emissions 95/73 119 226 174 158 136
Activity effect 148 189 190 ISO 124
Structure effect 101 125 161 104 101
Intensityeffect 78 97 93 100 110
Fuelmixeffect 100 101 99 99 99
Climate Change Series 9
Transportation and CO2Emissions: Flexing the Link-A Path for the World Bank
Table 2b. Changes in carbon emissions from freight, 1973-1994, Laspeyres Decomposition, 1990Modal Structure
Countries US (95) Jlpan (95) Australia (95) W. Germ. (93) Sweden (95)
Emissions95/73 163 157 172 113 105
ActrP4ty effect 162 137 166 138 106
Structureeffect 124 140 116 113 104
Intensity effect 89 85 61 88 95
Fuel mix effect 101 105 103 99 100
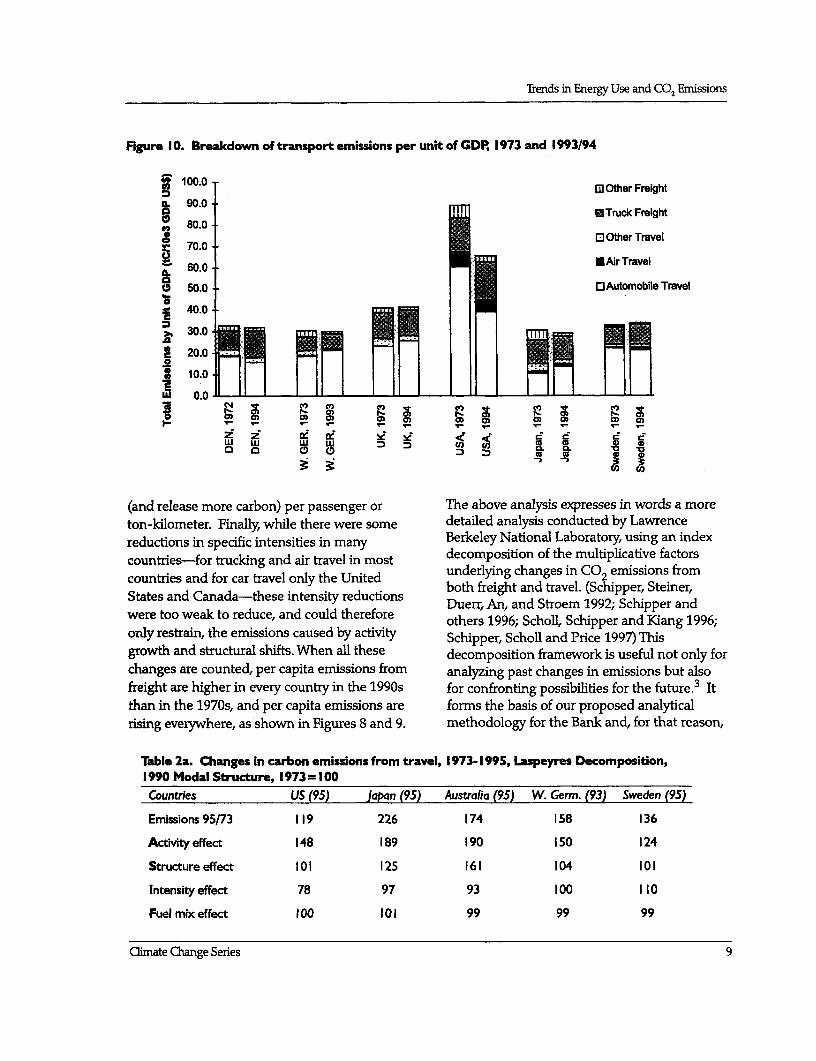
we explore it in some detail here. The prirncipal emissions, multiplying an 89 percent increasecomponents of overall transport-sector from travel alone. Since intensity and fuel mixemissions are taken to be Activity (in ton- or had almost no effect, the result was a hugepassenger-kilometers), modal Structure (that is, increase in emissions (+126 percent!). As canshare of ton- or passenger-kilometers occurring be seen, European Countries (represented byon each mode.), the modal energy Intensi[ty of Sweden and W. Germany) behaved in an
each moe ieerybuepro rintermediate way, while Australia showed aeach mode (in energy burned per ton- or larger growth in total travel (on cars and air)passenger -kmn) and the Fuel-to-carbon ratio than Europe but a somewhat more important (7(carbor released per unit of energy burned). percent) decline in emissions from lowerWe refer to this decompositional approach intensities.throughout this paper as the ASIFmethoclology. A more technical exposition is Freight pattems were different. All regions sawpresented in Box 2. Tables 2a and 2b increased activity and shifts towards carbon-summarize the results for a number of IE intensive trucking. With freight, however, many
countries showed important declines incountries and country groupings for the years emissions frow insty canges (im1973-1995 (199 for Europe).emissions from intensity changes (primarily1973-19395 (1994 for Europe). trucking, which carries the greatest weight). All
regions experienced greater emissions from fuelIt is important to remember that the numbers shifting to diesel, because diesel holds morein this table represent indexed 1995 (or 1993) carbon per unit of energy released.values, relative to 1973 levels. For example,Americans experienced a 19 percent increase in The same framework can be used foremissions. Total travel increased emissions by comparing reference case with reform cases as48 percent, and shifts towards cars and air set out in the Global Overlays Guidelines,travel rrmultiplied this by an additional 1 percent. because the elements of ASIF that policy-Changes in modal intensities (cars and aiI makers want to affect are more or less the same.travel) lowered emissions 22 percent, while the A planner must decide which levels of eachfuel mix changed emissions very little. The component are appropriate, either by running abase-year mode mix was 1990,4 by which time complex model, or by sheer judgement. Byair and auto travel had nearly the same energy examining each of these components in tum,intensities,5 with bus not far behind. As a the policy analyst can help identify unwantedresult, th-te shift from bus or rail to cars and air, consequences from a given policy strategy. Heand from cars to air, had very little impact. In or she can also help identify more clearly whatJapan, by contrast, the shifts towards autos and aspects of a given country's transport energyair had a 25 percent upward impact on system are not well enough understood.
10 Environment Departnent Papers
Trends in Energy Use and CO2 Emissions
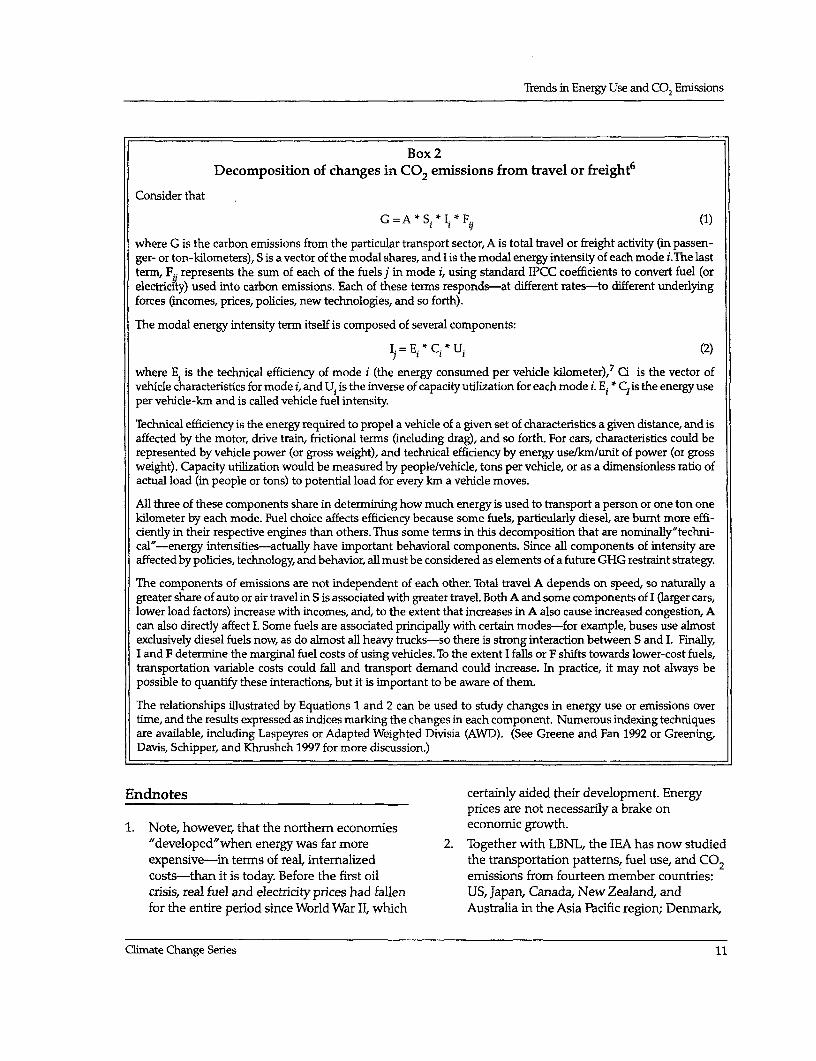
Box 2Decomposition of changes in CO2 emissions from travel or freight6
Consider that
G = A * Si * Ii* Fi. (1)
where G is the carbon emissions from the particular transport sector, A is total travel or freight activity (in passen-ger- or ton-kilometers), S is a vector of the modal shares, and I is the modal energy intensity of each mode i.The lastterm, FR represents the sum of each of the fuels j in mode i, using standard IPCC coefficients to convert fuel (orelectricity) used into carbon emissions. Each of these terms responds-at different rates-to different underlyingforces (incomes, prices, policies, new technologies, and so forth).
The modal energy intensity term itself is composed of several components:
I = E. * C.* U. (2)
where E. is the technical efficiency of mode i (the energy consumed per vehicle kilometer),7 a is the vector ofvehicle characteristics for mode i, and Ui is the inverse of capacity utilization for each mode i. Ei * Cl is the energy useper vehicle-km and is called vehicle fuel intensity.
Technical efficiency is the energy required to propel a vehicle of a given set of characteristics a given distance, and isaffected by the motor, drive train, frictional terms (including drag), and so forth. For cars, characteristics could berepresented by vehicle power (or gross weight), and technical efficiency by energy use/km/unit of power (or grossweight). Capacity utilization would be measured by people/vehicle, tons per vehicle, or as a dimensionless ratio ofactual load (in people or tons) to potential load for every km a vehicle moves.
All three of these components share in determining how much energy is used to transport a person or one ton onekilometer by each mode. Fuel choice affects efficiency because some fuels, particularly diesel, are burnt more effi-ciently in their respective engines than others. Thus some terms in this decomposition that are nominally'techni-cal"-energy intensities-actuaUly have important behavioral components. Since all components of intensity areaffected by policies, technology, and behavior, all must be considered as elements of a future GHG restraint strategy.
The components of emissions are not independent of each other. Total travel A depends on speed, so naturally agreater share of auto or air travel in S is associated with greater travel. Both A and some components of I (arger cars,lower load factors) increase with incomes, and, to the extent that increases in A also cause increased congestion, Acan also directly affect I. Some fuels are associated principally with certain modes-for example, buses use almostexclusively diesel fuels now, as do almost all heavy trucks-so there is strong interaction between S and I. Finally,I and F determine the marginal fuel costs of using vehicles. To the extent I falls or F shifts towards lower-cost fuels,transportation variable costs could fall and transport demand could increase. In practice, it may not always bepossible to quantify these interactions, but it is important to be aware of them.
The relationships illustrated by Equations 1 and 2 can be used to study changes in energy use or emissions overtime, and the results expressed as indices marking the changes in each component. Numerous indexing techniquesare available, including Laspeyres or Adapted Weighted Divisia (AWD). (See Greene and Fan 1992 or Greening,Davis, Schipper, and Khrushch 1997 for more discussion.)
Endnotes certainly aided their development. Energyprices are not necessarily a brake on
1. Note, however, that the northem economies economic growth."developed"when energy was far more 2. Together with LBNL, the IEA has now studiedexpensive-in terms of real, intemalized the transportation pattems, fuel use, and CO2costs-than it is today. Before the first oil emissions from fourteen member countries:crisis, real fuel and electricity prices had fallen US, Japan, Canada, New Zealand, andfor the entire period since World War II, which Australia in the Asia Pacific region; Denmark,
Climate Change Series 11
Transportation and CO2Emissions: Flexdng the link-A Path for the World Bank
Finland, France, W. Germany, Italy, the National Research Council, US NAS,Netherlands, Norway, Sweden, and the Washington DC (Feb. 27/28 1997).United Kingdom in Europe. 4. That is, the modal shares as of 1990 were used
3. Index decomposition is a useful technique for to project emissions both in 1973 and 1990.studying the influence of underlying 5. These energy intensities, however, are basedmultiplicative factors on a variable of policy on observed passenger occupancies. Theinterest. Indeed, a recent US National potential energy intensities of the two modesAcademy of Sciences Workshop considered are still quite different.the same methodology applied to popudation, 6. This summary is taken from Schipper andwater use, and other important quantitative others (1997).measures of resource use or pollution: othe uizo-gt"Wfiorkshop on the Decomposition of 7. More specifically, it is the utilization-weightedComplex Issues in Sustainable Development" average of the technical efficiencies of theBoard on Sustainable Development, US , different types of vehides used in mode i.
12 Envirorunent Department Papers
Challenges Facing GHGL Restraint in Transportation
Driving factors transportation context. This means that thesechoices-today's slowly-evolving transportation
This section examines attempts and causes for patterns-may be difficult to stop simplyhistorical restraints of transport use, primarily because of CO2 concerns. Natural limitsin IEA countries. Efforts to restrain transport (saturation of distance or time of travel,fuel use per se were weak and largely limited to potential saturation of the distance physicalthe effects of higher oil prices (or economic goods are sent around) or local constraintsstagnation) brought on by the oil crises. (congestion, parking problems, local pollution)Rmpingcal evidence suggests that with GDP may slow or reverse some of these trends.rising, the only way to adhieve a decline in CO2 Nevertheless, most national transport plans stillemissions is a combination of transportation foresee increases in personal and goodspolicy reforms in the near term, technological transportation with GDP without policychanges in the longer term, and consumer/ intervention.shipper responses to both forces. What isrequired is a more integrated transport/ It is significant that emissions from freight, inpollution & GHG reduction strategy that contrast to those from travel, show restraintattacks a broad front of transportation from lower energy intensities in roughly half ofextemaities. the countries studied. We speculate that this
Changes in the amount people (and goods) may be because structural effects on freighttravel are the dominant cause of rising demand are more intense and also becauseemissions. Technical factors (vehide and modal freight services, unlike private transportenergy intensities) led to some restraint of consumption, respond to business needs andemnissions in a few cases for cars and trucks but competition. Although the importance of fuelonly gave net reduction in per capita emissions costs to total freight costs, or to the total costs(for travel) in two major countries. Behavior and of products delivered is small, there is dearlysystem optimization factors (that is, modal always room for saving fuel at the margin,choices and utilization), as well as increases in subject to the constraints imposed by costs foractivity coupled to GDP, boosted overall equipment, labor, and maintenance.emissions.
The same is true for air travel, which showedThese developments are intimately related to uniform and deep reductions (50-60 percent) inthe nature of transportation-comfort, fuel use or emissions per passenger-km in allconvenience, speed. Distance as well as modal countries from both improved technology andchoice is related to individual and societal higher load factors. In this case, however, fuelchoices about housin& work and leisure accounted for as much as 20 percent oflocation. The same is true for freight. And the operating costs and even in 1997 remains achoices noted here are deeply-rooted in a source of cost pressure to airlines. Thus the
Climate Change Series 13
Transportation and CO2 Emissions: Flexing the Link -A aith for the World Bank
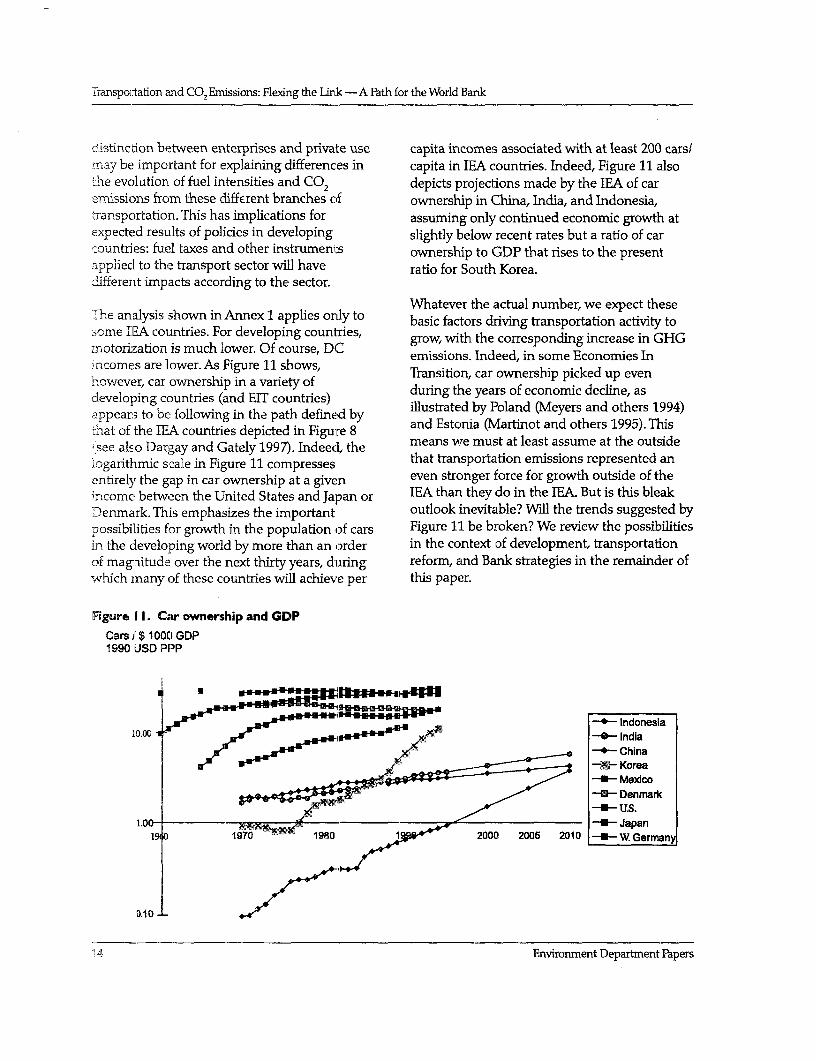
d-stinc tion between enterprises and private use capita incomes associated with at least 200 cars/may be important for explaining differences in capita in IEA countries. Indeed, Figure 11 alsothe evolution of fuel intensities and CO2 depicts projections made by the IEA of caremissions from these different branches of ownership in China, India, and Indonesia,transportation. This has implications for assuming only continued economic growth atexpected results of policies in developing slightly below recent rates but a ratio of carcountries: fuel taxes and other instrumenls ownership to GDP that rises to the presentappliecd to the transport sector will have ratio for South Korea.different impacts according to the sector.
Whatever the actual number, we expect theseI h.e analysis shown in Annex I applies only to basic factors driving transportation activity tosome BEA countries. For developing countries, grow, with the corresponding increase in GHGmotorization is much lower. Of course, DC emissions. Indeed, in some Economies Inincomes are lower. As Figure 11 shows, Transition, car ownership picked up evenhowever, car ownership in a variety of durin the ears of economic decline, asdeveloping countnes (and EIT countries) g yto~~~~ ~ be foloin intept eiey Illustrated by Poland (Meyers and others 1994)appears to be following in the path ctefinead by
r and Estonia (Martinot and others 1995). Thistnat of the IEA countries depicted in Figure 8sealD aanGae 1997. In e means we must at least assume at the outside
seg a so al in FGuel 11 copees that transportation emissions represented aniogarnthimic scale in Figure 11 compressesentirely the gap in car ownership at a given even stronger force for growth outside of theincome between the United States and Japan or IEA than they do in the IEA. But is this bleakDenmark. This emphasizes the important outlook inevitable? Will the trends suggested bypossibiLities for growth in the population of cars Figure 11 be broken? We review the possibilitiesin the cleveloping world by more than an order in the context of development, transportationof magnitude over the next thirty years, during reform, and Bank strategies in the remainder ofwhich many of these countries will achieve per this paper.
Figure I1. Car ownership and GDP
Cars J $ 1000 GDP1990 JSD PPP
-e- Indonesia10.00 -p- India
o Z e - Chinaf - Korea
U-Mexdco- Denrmark
-U.-S.1.00- -U-Japan
1 1970 1980 1 2000 2005 2010 LUW Gerrnan
E.10 D P
'A14 Environ}nent Department Fapers
Challenges Facing GHG Restraint in Transportation
Facing carbon emissions from transport port sector should be set in the context of devel-opments in the transport sector, and emissions
The couplings between emissions from travel or possibilities both linked to wider transport re-freight and GDP illustrated by Figures 8 and 9 formi(slchias changes in rrans, fee
ar dutn. In IE onre, fue prce hav form (such as chzanges in regulations, fees andpricing, emissions standards, and soforth) as well
proven to have limited impact on the strength as to emissions specific strategies related tofu-of this correlation. For the freight sector, part of els, fuel efficiency, vehicle type, and vehicle use.the reason for this limited impact isundoubtedly due to the relatively low amount CO2 policy in transport, therefore, must beof input-in monetary terms-of freight energy flexible, broad-based, and synergy-seeking.into the overall costs of production. For thetravel sector, changes in urban form and Other important lessons can be drawn fromdistributions of populations in metropolitan IEA experience. First, carbon emissionsareas are also an important contributor to the themselves have no natural limiting feedbackinflexibility of this link. In short, fuel prices may mechanisms as long as the prices for fuels orneed to rise significantly higher than the costs per km of using fuels remain roughlypopulations and govemments have a tolerance constant. By contrast, other changes infor in order for prices alone to begin to transport conditions or prices-safety,influence CO2 emissions. Consequently, a CO2 congestion, tolls, parking costs, vehidepolicy that is oriented to the transport sector acquisition, yearly registration, or use costs, andwill need to focus on transportation policy so forth-represent potentially importantreforms in the short-run, technological changes sources of feedback on the volume ofin the medium term, industrial and urban transportation or to authorities who controlplanning measures in the long-term, and policies and technologies.consumers'and producers'responses to all ofthese. Pricing, where politically feasible, should Second, and suggested somewhat by the abovebe used to support these other efforts. considerations, stand-alone transportation
strategies which seek to reduce CO2 areThe findings of Pearce and others (1996) probably less politically and socially feasiblesupport such a broad-based CO2 strategy, based than those which can be coupled with otheron finding linkages with other policy objectives transport policy goals, such as congestion orin the transport sector: noise reduction, or local air quality
improvement. Local authorities, for example,CO2 andfuel use represent a small ifluence on might be more successful enacting policiesoverall transport patterns, except during thefuel encouraging shifts to public transport as part ofcrisis years 1973-1985, when the fuel intensi- a congestion-reduction, rather than a C02-ties of vehicles fell and concerns overfuel prices reduction, package. CO2 reduction as a strategyaffected vehicle use and transport planning as needs to find synergies with other, more locallywell. Some of that decline in vehicle intensities pressing, policy needs.persisted into the early 1990s, but emissions arerising because transport activity is rising. Since Synergies, such as the modal shift exampleanother key transport trend, modal mix, acted above, frequently exist in the transport sector,almost universally to raise emissions this means but they do not always. Some policies designedthat the main technological ways of reducing to improve local air quality, for example, mayemissions, by changingfuels or making vehicles increase greenhouse gas emissions from cars.lessfuel intensive, have to be accentuated in strat- Oxidation catalysts, for example, reduce theegies thatfocus closely on carbon per se. Other amount of carbon monoxide and volatilestrategies aimed at GHG reduction in the trans- organic compounds released into the
Climate Change Series 15
Transportation and CO2 Emissions: Flexing the link -A Path for the World Bank
atmosphere, but at the cost of increased NOx, introducing new fuel systems that arewhich is both itself a greenhouse gas ancl a intrinsically lower in carbon (Sperling 1994;carbon dioxide precursor. Three-way catalysts, IPCC 1996; IEA 1997b; NAS 1997; Peake 1997).which also remove NOx, do so at the cost of That few of these have come to market may bereduced engine efficiency, resulting in an a function of the lack of economic demand (thatincrease in CO2 emissions per vehicle kilometer. is, low fuel prices) and the lack of time to seeSome policies may also backfire on themselves. developments from the 1990s come to fruition.For example, a policy to improve local air Recent announcements by Peugeot of theirquality (and reduce CO2 emissions) by allowing entry into the electric scooter market,traffic to move at free-flow speeds-through, acquisition by Daimler Benz of an importantsay, traffic management schemes or even interest in Ballard, which makes fuel cells, androadway capacity enhancement-may induce other developments are serious reason tomore traffic (Downs 1993) than might believe technologies may be there soon. Andotherwise have occurred. The CO2 and local the seriousness of some European countrypollutant emissions from the increased overall transport reform packages now on the marketactivity including the newly induced traffic may (Peake and Schipper [IEA 1997a]) suggests thatbe more significant than the intensity in some countries, transport pricing andreductions caused by the new free-flow traffic regulatory reform may be acceptable to a wideconditions. enough spectrum of govemments to permit
them to truly stimulate technologicalThe third lesson from the IEA experience is that development. There is a very real possibilitythe apparent rigidity of many of the curves that policy, behavior, technology, and possiblyshownr in the preceding section contains both a even lifestyles could change in ways that trulywamring and several points of optimism, de-couple growth in emissions from growth inparticularly for countries with presently lDw incomes for a long enough period to allow trulylevels of motorization. The waming is, as has low-CO2 vehicles and fuels to be developed. Onbeen rioted above, that the demand for this more optimistic note, therefore, we turn totranspDrtation services grows strongly with elements of a CO2 reduction policy agenda inincomes, particularly in high-income countries. general, and specific actions for the World Bank.This is because transportation is a deriveddemand; it is derived from the demand for Previous oil-saving and transportaccesslbility to goods and services (Gorham pollution control programs1996). This demand for goods and services itself Until 1973, the only concem limiting use of oilgrows with income, and the nature of the in developing countries was paying for imports.accessibility undergoes a structural shift, as After the price of imports skyrocketed andpopulations relocate from relatively dense, supplies were thought to be insecure, worriesurban centers to outlying areas (ECMT 1998b). about oil use multiplied, but few developing
countries took concerted action to restrainThe potential points for optimism stem fiom imports. Important exceptions were Brazil, withthe fac:t that the observed periods of high fuel its alcohol program, and Korea and Taiwan,prices and national concern over fuel saving which tried to develop integrated energywere rather short, and hardly allowed analysts policies with an eye to reducing dependence onto test either policies or technologies. There imported oil. Korea and Taiwan in particularmay indeed be many options for significant took measures to limit urban air pollution fromGHG restraint still available. Certainly, the cars and even promote somewhat moreliterature is replete with possibilities for both efficient vehicles, but these were exceptions ingreatly, improving fuel efficiencies and the developing world. By the 1990s, many of
16 Envirorunent Departrnent Papers
Challenges Facing GHG Restraint in Transportation
these concems faded and fuel prices for some without other compensating measures,products were often below market levels. Not unpriced congestion reduction amounts to ansurprisingly, vehicle ownership (as represented increase in roadway capacity, which Downsby figure 11 for cars) and transportation oil use (1993) shows will lead to an overall increase inincreased with economic activity. traffic using the facility, all else equal. In short,
the overall coupling between transport controlUrban air problems increased with greater use pollution programs has been weak or negative.of motor vehicles, however. The World Bank hasbeen involved in the study and promulgation of Only recently have analysts begun to tiesome air pollution control programs. These pollution control and CO2 together. In manyinclude promotion of the use of unleaded fuels cases, there are small but important synergiesand stricter air pollution controls in cities like between CO2 reduction and air pollutionMexico City (Eskeland 1994). None of these control strategies that either lead to reducedprograms had as its main purpose improvement traffic or lead to improved operating efficiencyof fuel economy of vehicles, reduction of fuel of vehicles (although the danger pointed out inuse, or restraint of CO2 emissions. In fact, the the previous section that these two strategiesfirst generation of controls on U.S. cars may work at countervailing efforts should beprobably led to a slight increase in fuel borne in mind). Eskeland and Devarajan (1996)consumption per km, although that effect argue that if a pollution control strategy usesdisappeared as technology improved. Most both pricing/taxation and regulations, a balancetransport pollution control measures are only could be obtained that both reduces use ofweakly linked to GHG reduction technologies vehicles and cleans them up, leading to loweror strategies because they do not reduce fuel total GHG emissions than if only a clean-up isuse explicitly through either technology or ordered but no taxes or other fees are appliedpricing and only tend to reduce vehicle use to raise the cost of using"unclean"vehicles.slightly. Indeed, Eskeland shows how the policy Pollution control per se can in a few cases raisein Mexico City "Hoy no circulan"prohibiting GHG emissions. For example, switching touse of a given car on one day (depending on Liquefied Petroleum Gas (LPG) vehicles, whichthe last digit of the license number) led to consume more fuel per km than gasoline oracquisition of extra vehicles and increased diesel vehicles; or switching to Compressedgasoline use (Eskeland and Feyzioglu 1995). Natural Gas vehicles, the fuel delivery systemIronically, it is possible that some transport for which is susceptible to methane leaks,control measures aimed at reducing congestion probably raises slightly GHG emissions, all elsealso increase total traffic by their success. being equal. The extent to which such increasesKeeping vehicles from penetrating the town are tolerated depends on the primary policycenter as a congestion control strategy might goal, and the nature of the altematives. A smallcause some vehicles to take longer routes to increase in GHG may be a reasonable price totheir destinations, for example. Similarly, pay for a big increase in local air quality.
Climate Change Series 17

Approach -Tools and Methods:3) How We Hook Solutions to Problems
This section introduces ways of quantifying Of particular importance are past andtransport flows, energy use, and resulting anticipated future rates of change of each ofemissions to identify solutions. It also discusses these components. Analysts should think aboutbriefly the policy landscape. Ways of actually the speed with which each of thesereducing carbon emissions-so-called"best components change, and the kinds of policiespractices"-need tools for evaluation. Finally an likely to influence that rate of change. This iseconomic framework is needed to begin to particularly important in developing countries,evaluate costs and benefits and, more where growth in the vehicle stock is far moreimportant, to estimate the changes in transport important than turnover as a source of newtrends that new policies and technologies might vehicles entering the vehicle stock.bring about.
A varies at a rate determined largely by income,Flexing the link-Analytical approaches but during periods of rapid acquisition of carsto transport trends (for example, W. Germany in the 1960s), A can
The analytical approach discussed here involves grow faster than incomes, propelled principallyunderstanding how equations 1 and 2 from the by car ownership. In many eastern Europeanend of chapter 1 (see Box 2) apply to the countries during this decade, in fact, carcountry or region of interest. Analysts should ownership expanded rapidly, even whiletry to understand how activity (A), structure incomes stagnated or even declined. During(S), intensity (I) and fuel choice (F) have varied periods cf rapid motorization, S also naturallyin the past, how they are changing at present, shifts rapidly towards cars but can shift bywhat the likely influences of incomes, prices, several percentage points back to colectivetechnologies, and policies (transport, industrial, transport during periods of higher fuel prices,planning and other policies) affect those doubts about fuel availability, or otherchanges, and how these components are likely constraining factors. The French press, forto change in the future. These are the example, reported about 20 percent more ridersingredients in scenarios that will be used in the on Paris commuter lines on 1 October 1997,Global Overlays methodology. when a pollution alert led the government to
put into effect an odd/even restriction onSmall changes in all of these over present driving in Paris.values could multiply to give a large overallchange in emissions. More specifically, shifts in The various components of I can cha.nge atS, combined with a significant decline in I and different ways. The stock of cars takes nearly 20shifts in F towards less carbon-intensive fuels, years to be completely replaced, while that forcombined with restraint in the likely growth in heavy trucks and buses can take longer, andA, could hold carbon emissions down to little aircraft last typically more then 30 years. Safetyor even no growth. or emissions regulations can accelerate stock
Climate Change Series 19
Transportation and CO2 Emissions: Flexing the Link-A Path for the World Bank
turnoirer by making it expensive, difficulit, or be"correct"in an environmental economicsillegal to use highly poLLuting, unsafe, or older framework. But it is very important to see if thisvehicles that generally have higher fuel is the case. If there are large subsidies, do theseconsuxmption per kilometer than newer ones. essentially promote travel and a kind of sprawlSudden fuel-price shocks also can speed this (Budapest system)? If automobile use isturnover. Changes in transport infrastructure underpriced, either because fuel taxes or otheralso affect I both in terms of how well facilities revenue do not really cover road building andare maintained (physical deterioration of road maintenance costs, or because there areand rail surfaces are generalLy associated with a significant extemalities ignored, financing ofloss of vehicle fuel efficiency) and in temis of other modes may be a losing cause unless thethe growth in traffic competing to use given client government agrees to deal directly withfacilities at particular levels of infrastructure automobile use.deployment. For aircraft acquisition, where fuelcosts play a large role in choices, this effect is Geographical distribution of transport activitystrong and even feeds back on producers to has an important impact on travel and freight.improve their technologies. With few How much of A and S occurs in cities, suburbs,exceptions, F cannot change more rapidl,y than or between cities? How much traffic is betweenthe stock of cars can change. cities or otherwise distant locations because of
the intrinsic location of certain resources? ThisA and S are affected by incomes, by the will affect valuation of different kinds ofmaterial content of the economy and distances externalities as well as the kinds of solutionsgoods travel between primary material that can be imposed or grown from technology.gathering (or importing), assembly, wholesale Danish and Swedish studies try to estimateand retail sites, and ultimate markets. Personal some of the extemalities split this way. If mosttravel depends in part on distances between of the activity and resulting emissions arisework, home, leisure, and services. All of these near or in cities, then transport policydistances depend on the spatial distribution of approaches may have a big impact on CO2. Ifeach kind of destination, which in turn is most CO2 is emitted in intercity traffic, whereinfluenced by the speed and cost of congestion, pollution, and noise are arguablytransportation as well as land, and structures. less significant, then there is less pressure toPut sirnply, in low income societies with little impose changes for these problems that wouldmotorized travel and unsophisticated freight also reduce C02 in many modes. The onlysystems, or societies where congestion or other exception is where roads are badly damaged orfactors makes movement of people or goods there are other externalities proportional toexpensive or slow, things are close together or road-use that require attention. Here imposingindivicdual radii of action (and market sizes) are road-user fees could have an important effectsmall. Where travel is cheap or rapid, markets . 8cover much wider areas, and so do people. All on traffic.of these dimensions are expanded by higherincomes. Vehicle fuel intensities (E*C are a question of
both technology and vehicle characteristics,The World Bank promotes increases in A by such as weight, engine size, horsepower, vehicLefinancing urban transport systems, roads, rail loading capacity, and so forth. In mostsysterms, ports, and airports. This even includes countries, new (and sometimes existing)bikeways (Lima, Peru Transport Rehabilitation). vehicles are taxed according to theseTo the extent that the faciLities and modes are characteristics in ways that indirectly affect fuelpriced correctly, modal mix and total travel will consumption. In the United States itself, fuel
20 Environment Department Papers
Approach-Tools and Methods: How We Hook Solutions to Problems
consumption is affected by the Corporate energy intensive bulbs and tubes whileAverage Fuel Efficiency Standards, by which the eliminating the more energy intensive onesU.S. Government assesses a fine to an from the market. Thus the Bank has to play anindividual car manufacturer by the amount its active role in helping client countries facemodels' sales-weighted test fuel consumption intemational suppliers of vehicles and othersold in a given year rises above a certain value equipment, suppliers with interests other than(currently about 28 MPG or 8.3 1/100 km). The GHG emissions reduction.Danish government has just imposed a yearly"green owner fee"on all cars in the stock U, the capacity utilization term, converts vehiclepurchased after mid 1997.9 Neither the US nor intensities to modal intensities. It has comeDanish approach specifies technologies or under scrutiny as an important policy element.affect car characteristics directly, but because In the United States, many cities and regionssmaller (that is, lighter, less powerful) cars tend have reserved some lanes of traffic during rushto use less fuel, these kinds of policies hours for vehides with two or three occupantsinevitably have some effect on car characteris- (or more). Alternately, such lanes are reservedtics and not simply on technological efficiency for buses, which increases effective capacity of aalone. While most of the pre-CAFE particular lane to move people. Some countriescharacteristics of the U.S. fleet (except fuel use have introduced off-peak rail fares to boostper km) have returned by the 1990s because of capacity, and some cities (Washington DC) havetechnological improvements made by U.S. and peak and off-peak pricing on metros as well.foreign car producers, it is not clear how Similarly, load factors (both the total load thatDenmark (or modest developing countries with can be carried and the actual utilization factor)neither car producers nor large car markets) will for trucking and rail have a great impact on thefare unless consumers begin to buy less modal intensity of these freight modes, muchpowerful cars. greater than the efficiencies of the vehicles
themselves within a given country. BetterThe Bank has begun to deal with vehicle capacity utilization reduces vehide movementintensities by assisting regions purchase new, for a given amount of people or goods moved,cleaner and more energy efficient buses reduces pollution, and generally improves(Budapest Urban Transport). But as more and carrier costs. Therefore, this component ofmore of the transport activity and resulting emissions reduction should be scrutinizedemissions are associated with private cars and carefully.trucks (or mini-buses), the Bank has to findways of influencing the fuel intensities of these A key to better capacity utilization is in part notmodes. Better maintenance and better traffic to overbuild or over-extend the system.control will have a small effect, but the real Between 1970 and 1994 the average CO2improvements are up to both vehide suppliers intensity of travel on a city bus in the Unitedand buyers. The Bank could influence the States almost doubled, largely becausemarket by working with govemment entities government aid flowed to cities to put morecontemplating fleet purchases (this includes buses on the streets, while little was done tobuses, locomotives, trucks, and aircraft). More discourage private car use. At the same time,appropriate might be assistance with continued growth of distant suburbs raised thegovernments to negotiate with providers of physical dependence of families on cars forvehicles to the private sector, much in the way day-to-day life, even if rapid rail helpedthat the International Institute for Energy establish the viability of the suburbsConservation worked with lighting suppliers in themselves. In financing large transportBangkok to get them to agree to supply less systems, the Bank should be sure that the
Climate Change Series 21
Tlansp ortation and CO2 Emnissions: Flexing the lAnk -- A Path for the World Bank
project will be run efficiently and effectively representatives, and feedback from local andonce the infrastructure and vehicles are in intemational interest organizations might putplace. Working with urban planners to the Bank in EL central position. One step inencourage that new h-ousing is coordinated breakinig or flexing the transport CO2-GDPwith existing or new transit lines is another key link, then is to consider the divergence ofto suc:cess here. Even a good bus or rail system interests that represent the main stakeholderswill lose riders to cars if housing and jobs are in transportation.not where the buses go. While planners cannotforce location on housing or jobs, poor Vehicle producers have been the principalplanning can isolate a potentially good target of policies aimed at saving fuel andtransport system from key destinations and reducing local/regional pollutants like CO,leave the system-both public and private NOx, in the past (or particulate matter (PM)transport-with low vehicle occupancy. For today), and reducing CO2 tomorrow. Indeed,freight, it is important to ask whether regulatory their incentives to make"clean"vehicles arisespolicies discourage filling up vehicles or largely from regulation or markets induced byreturning home with a load. regulation or pricing. Fuei producers,
principaly the multi-national oil companies,F, the carbon content of a given fuel, has not have been drawn into the policy debatevariecl much in the past. The Brazilian ethanol principally to provoke improvements inprogram is one example of a relatively low CO2 gasolinre and diesel fuels (Peake 1997), but insource of renewable fuels, but it is not clear some cases in opposition to various moves towhether that can be repeated elsewhere witth stimulate non-petroleum fuels, such as biomassreal costs comparable to the wholesale c osts of or electricity as well.gasoline or diesel. However, the Bank couldcarefRlly consider whether local conditicons, Vehicle produicers most active in the DCs today,costs, labor markets, and so forth, might make a and oil companies supplying most of the worldtruly renewable fuel profitable in a given region crude oil and products, are based in IEAor country. In any assessment of alternaiive countries, with few exceptions. Thusfuels, it is crucial to undertake a full fuel cycle technologies and ideas tend to flow from theanalysis of both the GHG emissions from developed world to the DCs. While retailingcombustion as well as those in the preparation and in some cases refining is often controlledof fuels to be sure that an alternative is truly by state oil companies in DCs, the multi-low in overall emissions (Sperling and Deluchi nationals, still have a dominant role in1993; Deluchi, private communication of results production, sales, and, most importantunderway, 1997). technological developments in both vehicles
and fuels. Both industries are keenly aware ofFlexing the link - Approaches to the the burgeoning markets represented by DCspolicy challenge (and EITs), and aware of the gaps in vehicle
The Bank may find that, in developing a loan or technology, fuel quality, road quality, and soassisting with policy, it is in a position to bring forth between North and South. Because ofvarious actors together to define common their central importance to both vehicles andinterests. It might serve as an impartial unmpire fuels around the world, both industries must beof sorts to help all sides weigh the advantages considered as partners in any attempt to changeor disadvantages of technologies and policies the path of GHG emissions by altering trendsvis-a-vis GHG emissions. Interactions with in vehicle ownership, vehicle use, fuel efficiency,vehicle and fuel providers, closer relations with or fuels them.selves.Yet until recently Worldvehicle and system users and their Bank activities relied principally on outside
22 Environment Department Papers
Approach-Tools and Methods: How We Hook Solutions to Problems
consultants for expertise on vehicle and fuel Europe, Japan and a few Asian countries, 1990sissues, and had little direct interaction with the in some countries in Eastem Europe andmain suppliers to study these actors' roles in the elsewhere), they have begun to regulate thepresent situation. The Bank could take a more vehicles beyond safety concems, or the qualityactive role at this stage. of fuels such as lead content. National
govemments act as intermediaries betweenIn particular countries where the Bank is active, vehicle or fuel producers and transportationlocal producers are also important (particularly system users or household consumers. LocalBrazil, India, and China.) Many of these govemments usually administer collectiveindustries operate in protected environments, transport systems, while other authorities runcontemporary holdovers of import-substitution ports, airports (and control air traffic), and sodevelopment strategies. In many cases forth. National govemments are the ones most(particularly for India and China) they represent closely associated with Bank activities, butimportant national symbols of economic increasingly transport policy must be carrieddevelopment-an indigenous automobile out by local governments, and Bank activity hasindustry is a sign both of self-reliance and a tended to focus on local problems related tocertain level of economic development. The transport system expansion (such as metros orBank should use its unique position vis-a-vis buses) and more recently vehide emissions (forthese countries, and their automotive example, Mexico City). To the extent that GHGindustries, to insure that they are as much problems are global and emissions ariseincluded in global discussions of technological everywhere, they require at least modest carbonadvances which may bring down vehicle carbon taxes on fuels. These have to be brokered withintensities as their OECD counterparts. national governments, most likely as means of
raising general revenue.Vehicle importers are important players inmany non-producer countries. National Individual and business consumer interests.fleetwide strategies must be devised with active These are the people who use the vehides oninput from importers, since many operate under the infrastructure, otherwise known as athe same commercial pressures and need to "commons."Their interests are diverse, but theiranticipate and respond to demand as vehicle enormous number is what gives transport itsmanufacturers in vehicle producing countries. unique character vis-a-vis environmentalFinally, the role of the informal sector in vehicle problems. By contrast, GHG emissions from thesupply in many DCs and EITs must be energy sector can be pinned down to aacknowledged. These represent a potential relatively small number of well-identifiedweak link in any GHG reduction strategy which power plants, refineries, coal beds, and so forth.may be devised, since the vehides the informal In countries where there is significant votersector provides to a country's vehicle stock are power, public interests are constrained by whatoutside of official mechanisms for control. The authorities can impose on the public. What mayextent of informal sector participation depends seem to be an economically"correct"policy mayon macro-economic factors out of the scope of be difficult to impose because of social/this paper. distributional constraints, as the Bank and
others have leamed by examining the storiesPublic and government actors. Public actors behind ending subsidies for energy and otherare involved in the definition and design of basic commodities.public transport infrastructure in all countries,and in many, are also responsible for delivering Special interests. Lobbies or political groupsit. They are also involved relatively recently composed of configurations of the above(1960s/70s for the United States, 1980s for groups appear regularly to favor or fight various
Climate Change Series 23
Transportation and CO2 Emissions: Flexing the Link -A Path for the World Bank
policies: Raising diesel prices even in "global"because they incorporate into Bankenvironmentally conscious countries of Europe procedures arn accounting for a benefit of aencounters the trucking and shipping lobby; project that accrues to the entire world, and notraising fuel taxes in the United States just a particular client country. As we will showencounters the consumer and highway-users briefly, the ASIF methodology presented abovelobbies; imposing carbon taxes has run into the provides a useful framework for carrying outenergy industry lobbies in IEA countries; the bottom-up analysis that is part of thedeveloping European Union goals for Global Overlay tool.automobile fuel economy improvements hasencountered a long series of difficulties with Connection to Bank practicesautomobile interests; plans for roads or How much influence can the World Bank have?infrastructure are always being proposed . Under present policies, the answer is little. Toregions and private interests that would benefit some extent present projects probably makegreatly from such development. Each of these existing transportation systems work withgroups has its point to make, often with slightly lower CO2 intensity, but this effect isjustification. No GHG strategy can ignore them, m
hoevrcoretth tes rpoedsemo more than offset by the gains in total activityhaper that Bank projects provide. Those gains often,paper. but not always, represent real welfare
improvements. To increase its influence,Th e g alof action so be to he..p however, the Bank must actively seek out truecement the above line up of interests, to reserves of"negacarbon,"that is, low carbonencourage better investments, better fuels, very efficient vehicles, and pattems oftechnology, better polcies, and more settlement and activity participation that lead toenlhghtened approaches as undertaken by each lower movement-but higher welfare-per unitof the interests named above. Working directly of GDP. Unfortunately, there is little the Bankwith si-akeholders in the chent country, as well can promote in the way of investments unlessas the intemational commercial interests that can promoties way pofinestmets nes, , ,, . ~~~~~~~both technologies and policies match thesupply the meat of the transport system, is an problems at hand.imporl:ant new role the Bank could play.
Relationship to Bank policy and All of these polcy initiatives presume we haveoperations found the'economically efficient'allocation ofoperations resources, the "best practice" solutions. HaveRole of global overlays we? Have we overlooked expanding what is
economically efficient through stepped up localThe recently initiated Global Overlays Program R&D, by reducing true market barriers oris designed to add an extra dimension to Bank failures, or by finding how Bank actions canEconomic and Sector Work (ESW) and the influence policy and markets by smoothingCountry Assistance Strategy (CAS), and thus some of the political difficulties a country orultimately to Bank lending policies. Global region faces? This is a particular challenge toOverlays represent"a new analytical tool for the Bank project leaders: use conservativeintegrating greenhouse gas (GHG) externalities technologies and existing relationships, or pushinto the Bank's economic and sector work." for development of both new technologies and(World Bank 1997,"Guidelines for Climate underlying market relationships.Change Global Overlays,"EnvironmentDepartment Paper no. 47), thus allowing the For achieving the goal of GHG reduction, wetask manager to estimate the GHG reduction need ways of measuring and valuing bothbenefits from proposed activities. They are externalities (not just from CO2) and the real
24 Environment Department Papers
Approach-Tools and Methods: How We Hook Solutions to Problems
costs of options. In order to develop best peak-load tariffs designed to discourage usepractices we need a much better view of how at beginnings and ends of long weekends ortechnology can change, how people can key holiday periods. Furthermore, the Dutchchange, how vehicle markets work, and so Minister of Transport has announced inter-forth. To see how people can change, we need city road pricing to be implemented shortlyto know about elasticities and preferences, after the tum of the century, because even thetechnology costs, R/D expectations, and so intercity roads in that country are congestedforth, to see where a small bit of influence at peak hours. Compared with France, thethrough policy formulation or lending could traffic volumes are higher but distanceshave a big influence on technology uptake and shorter. The French system probably spreadsbehavior. traffic rather than discouraging it.
9. This fee rises with a car's original test fuel use,
Endnotes replacing the previous weight-related yearlytax. Gradually the steepness of this rise couldincrease, encouraging car buyers to seek ever
8. There is still a case for congestion pricing in less fuel intensive cars.intercity traffic. The Autoroutes in France offer
Chimate Change Series 25

Tools for Flexing the4 Link -Better Practices
Because there are such great differences in speed, externalities. Indeed, one element offlexibility, and comfort between modes of transpor- "sustainable transport"may well be that systemtation, no mode can be classified as "best" simply users pay their full social costs without leavingbecause it may lead to lower GHG emissions. 7his any to future users. This is implicit in one of thesection suggests a range of "better"policy goals, goals of"Sustainable Transport," prepared bypolicy tools, technologies, and analytical approaches the Bank in 1996.to dealing with transportation problems and GHGemissions. These can be used to understand options In the Bank study, sustainability as the basis ofin both the objective technical sense, as well as in transport policy is defined as follows:the sense of consumer orfirm preferences as set out Economic sustainability ("efficientabove. In this sense, "better"means more economi- rEconsestoineedffncally efficient when externalities, including CO2. are Environmental sustainability (promoting
value. nmore livable settlements and reducing
Better policies adverse external effects* Social sustainability (reducing poverty).
"Best"policies may be hard to define andmeasure, because of the many objective There are difficult trade-offs among these threefunctions to be considered, including"welfare.' goals, but synergies as well. Certainly betterNevertheless, it is generally agreed that proper public transit, less air pollution and noise,pricing of the use of the transport reduced risks of accidents (particularly whereinfrastructure, the pricing of externalities, the vehicles hit walkers), and better provision of-matching of variable and fixed taxes to the non-motorized transport opportunities or cleanappropriate direct costs and externalities two- and three-wheeled transport advances allrepresent the elements of overarching"best" of these goals.transport policies.
Land-use planning and other elements ofHowever, many have begun to question this physical coordination that influenceassumption. The goal of public sector transport infrastructure belong to "better" overarchingpolicy was traditionally to provide for the policies, even though effective coordination isdemand for mobility by making infrastructure often difficult to bring off in practice (OECD/available, while the role of the vehicle industries ECMT 1995). Land-use planning to reduce theis to sell vehicles at a profit. But it is recognized overall need to travel, while maintaining accessthat providing these tools of transport without to goods, services, and activities is essential, buta framework that offers feedback to users when it is difficult to show at a global level the affectsproblems arise seems to lead to growth in of such planning policies on travel or freightactivity beyond all forecasts, with the associated movements, to a great degree because there are
Cimate Change Series 27
Transportation and CO2 Emnissions: Flexing the Link-A Pahi for the World Bank
so many confounding factors. Land-use policy, Improvements in technology are not onlyhowever, is probably an important long-term reserved for motorized vehicles. For urbaninfluence on the price-elasticity of demand for freight movements, improvements to bothcar-use, and as such, cannot and should not be traffic management and pavement technologiesignored (ECMT 1998b). and managernent can make non-motorized
movements in urban centers more viable. ForBetter practices: Technologies shipping, high technology"clipper' ships (that
is, high-tech sailboats) have also been revivedBroadLy,"better' technology practices can be as a potentially viable non-motorizeddivided into those that affect vehicles (C *E) technology (iansen 1996), as have the conceptand those that affect fuels (F). Annex 2 of dirigibles for long-distance air shipping ofdiscusses some of the alternatives for each. The buLky goods. More efficient designs of metros,literature shows that there are enormous buses, and rail cars (particularly engines) couldpotential reductions in the fuel intensity of a reduce energy use per unit of distance traveledgiven car (20-50 percent) or aircraft (20-40 for these vehicles as well. Technologicalpercent) (Greene 1996; IPCC 1996). The iprecise advances in motive delivery (how power isamouLt of savings depends on the starting converted to motion) can also be applied topoint, the price of fuel, the time frame for non-motorized land-modes, potentiallydeveloping the larger savings potentials, and increasing their relative attractiveness as anthe timing of the entry of such technologies on altemative to the car or truck.the market. The potential may be lower forlarger than smaller trucks because the former There are many uncertainties that affect the realare already relatively efficient, but there isstl estimates of how much GHG reduction amuch toreay belsatved 3 pericient). but there is stinparticular transport technology really offers.
Finally, there are rapid changes occurring both
These potential savings are not simply to technologies themselves, and to the twotheoretical; many automotive companies dominant markets for vehicles, namely thosetheoreticale-;vma aut omtivel compaues for cars and trucks. These changes alone favorarvouned inthe wor eld areati a ses larger and more powerful cars, on the oneiehnvolvgied thet developm entb them about,ahand, but smaller trucks that carry less freighttechnologies that may bring them about, as per unit of fuel on the other. Both changes raisediscussed in Annex 2. The cost uncertainbies of th enryueprui ftasotto
such deelopmet, howver, ae equaly rea, as the energy use per unit Of transportationisuche eventalo , however, are eallytlac, a services (I) even as technology (E) leads tois the eventual acceptance in the marketplace. reduced fiuel use. The key dilemma for anyMany companies are finding that those project team is how to make an honesttechncologies that help consumers get features evaluation of not only today's options, butthey want (which is not necessarily fuel tomorrow's as well. Folding into thisefficiency for its own sake)-such as turbo -direct uncertainty the rapid expansion in total activityinjection diesel in Japan-are easier and quicker (A) and in many cases the shifts away from(and, for the car companies, less controversial) to collective modes (S)-so often the focus ofbring to market than those which focus Bank Projects-makes it even harder tospecifically or exdusively on energy efficiency. evaluate the benefits of technological options.Car manufacturers may publicly state a desire toadvance technology in the service of fuel Given these uncertainties, the Bank should playefficiericy, or reducing carbon intensity, but in a stronger role in the evaluation ofprivate, they are worried about costs and rnarket technological measures and options foracceptamce, as business people should be. transport. This can happen directly, by building
28 Environment Departrnent Papers
Tools for Flexing the Link - Better Practices
in-house capability for its own analysis or Bank (World Bank 1996) itself have beenindirectly, by supporting development of testing increasingly aware of the need to address thefacilities, research and development, and behavioral choices of system users in varioussupporting exchanges and transfers of ways, instead of relying heavily ontechnologies, in client countries. In addition, infrastructure policy. Car technologies are athe Bank could play a strong role in identifying significant part of these behavioral choices.barriers to technology adoption, includingtechnical (fuel quality, road quality), An important issue, therefore, is how the Bankinstitutional (trade barriers, monopolies), should approach its technology policy. Should itpolitical, or market failures within a client push particular altematives or kinds ofcountry. vehicles? Or should it focus on generalized
research and development? Should it focus onAltemative fuels present a similar dilemma. As local technologies-that is, those that can beSperling and Delucchi (1993) show, there is a produced locally and optimized to localwide range in the estimated variable or life conditions-or should it focus on those whichcycle costs of different fuels. This variation reflect best practices intemationally?presents a critical problem for the Bank; thetrue costs and benefits of alternative fuels in the In"better"practice terms, technology holds outreal world are not well known. Experience with some promising technologies to reducelow-cost diesel, LPG or subsidized farm emissions. Nevertheless, at present, there areethanol mixes shows that low prices are an no miracle cures just over the horizon, noimportant component in bringing new fuels to technologies that promise to radically reducethe marketplace. Whether such low costs can GHG emissions. Dramatic action may beand should be sustained in the long-run is needed, and the Bank may be in a key positionunknown. There are no real examples of a long- to support the search for truly low-carbonterm effort to promote alternative fuels, save altematives to present vehicles and fuels inperhaps the sugar-ethanol program of Brazil, client countries and across national andwhich has played to mixed reviews. Even where corporate boundaries.alternative fuels are significant, it is oftendifficult to measure the real change in the Better tools for carrying outfleetwide carbon component of fuel. Much integrated policiesmore experience with alternative fuels is A full review of policy tools for transportationneeded, and the Bank could support reform is beyond the scope of this paper (seeexperiments in a variety of countries. Barde and Button 1990; CEC 1995a). However,
several important policy tools mnight effectivelyThe foregoing discussion highlights an influence near and med1ium-term emissions,important consideration for the Bank's overall by nencing te spef carbon-both by influencing the specific carbon-approach to transport policy, a consideration intensity of vehicles, and by influencing thewhich should allow the Bank itself, in addition extent to which these vehides are used.to its client countries, to undertake"better"practices. Individual transport system users Fuel taxation is one such policy. In the nearmatter, both in terms of how they use the term, higher fuel prices probably have asystem, and in termns of the vehicles they negligible effect on car or truck use (A, S, or U)choose. Until recently, much of the Bank's and perhaps an even smaller effect on the usetransport strategy has focused on infrastructure, of other modes of travel or freight, because ofthat is, the physical facilities for movement. the relatively low own- and cross-priceOutside observers (HEC 1996) as well as the elasticity. (Oum and others 1995) That this
Climate Change Series 29
Thansportation and CO2Einssions: Flexing the Link-A Pati for the World Bank
effect is"negligible," of course, is an aggregate threatening, and the risk of recession relativelyresult; location, income, family situation, life small, introducing a fuel tax might not onlycycle stage, and other influences can affect make sound environmental sense, but mightindividual or localized short-term responses to also be good economic policy.12 Whether fuelhigher fuel taxes. (Greening and others 1997). taxes slow the economy in the medium andIn the medium term, however, higher fuel long-term is the subject of some debate; to aprices do encourage car buyers to choose cars large degree, the ability of an economy to thrivewith better fuel economy than they otherwise in a period of high energy prices depends onwould have (such as reducing I). They may do the ability of its actors to access goods, services,this either by trading off that fuel-economy and participate in activities. This, in tum,against other features, or by demanding depends on the economy's ability to delivertechnological improvements from suppliers such access in a less energy-intensive manner.which allow them to enjoy the same set of carcharacteristics at lower specific consumption Taxing motor fuels because of health costs has alevels. Manufacturers, for their part, will potentially large impact on driving costs. Smallrespond to such consumer demand, if they and Kazimi (1995) indicate that health costs ofbelieve fuel prices will remain high enough for air pollution arising from the use of gasoline bylong enough to make it worth their while. automobiles in the Los Angeles region could beIHigher fuel prices may also discourage as high as 2 cents/km (3 cents/mile) or 60 cents/additional individual driving in the longer term, gallon at a fleet average of 20 miles/gallon (11.8by stimulating demand for structural changes 1/100 km). That rate is close to the wholesale(for example, lifestyle or urban planning price of gasoline (untaxed) in many countries.decisions) which are less car-intensive.10 Such health costs would fall as new technology
cleans the fleet in the region even more becauseMany governments are reluctant to consider tax the reduction in pollution would outweighmeasures to raise the price of fuel for any but modest growth in traffic over the comingrevenue purposes. The reasons are threefold. decade or more. (At the same time the costsFirst, it is often difficult to understand how car would rise if traffic increased because smoguse changes with changes in prices. Energy concentrations and frequencies would rise.) Aprices have almost unceasingly fallen over the recent internal report of Experts assembled bypast thirty years (while car and truck ownership ECMT gives similar figures for Europe: theand use has expanded), and the relatively brief marginal costs to health of an additional unit ofperiods of energy price increases have been too fuel emitted are currently large in manyshort to be able to glean long-term consumer locations (ECMT 1998a).and producer reactions from the experience.Second, political resistance is nearly ubiquitous. Health costs are perhaps the most dramaticThe magnitudes of fuel price changes required because they affect so many people beyondto give big changes in car use in the short run those who drive. World Bank reviews indicateare simply too large to be acceptable in most very high health costs from diesel and gasolinecountries."1 Third, many countries are worried fuels arising in cities such as Mexico City,about the macro-econornic effects of such a tax, Santiago, and elsewhere. These may be reducedparticularly the fear that it would slow GDP through new technology as well, but thegrowth. Indeed, part of the justification for a prospects of further traffic increases in citiesDanish gasoline tax in 1995, was specifically to such as Beijing suggest that the health costs ofslow the economy and keep it from air pollution from motor vehicles will remainoverheating. Thus, consideration of the timing high. It is likely that these two would yield highof a fuel tax is important. Where inflation is taxes per km of travel. In all cases, the tax on
30 Environment Department Papers
Tools for Flexing the Link - Better Practices
the fuel could have a rather significant effect on Carbon taxes, however small, could play athe use of vehicles. Indeed a recent Bank potentially imr portant role here, affecting indocument questions where such taxes should some way every component of ASIF. In theory,be imposed when alternatives are not available. a carbon tax is the most economically efficientYet there may be a chicken and egg problem: policy mechanism for reducing CO2 emissions,without the tax, drivers have no incentive to since it specifically internalizes the extemalswitch to cleaner fuels and refiners have no "bad"which is the policy goal; in practice, likeincentive to make deaner fuels. Regulation fuel taxes, the amount of the carbon taxcould clean up the fuels and vehides too necessary to change behavior significantly may(through retrofit, as in Mexico City). But a well be at politically unacceptable levels. Asignificant welfare loss remains if unimproved realistic carbon tax, therefore, likely would bevehicles continue to be driven at fuel prices that smaller even than the present total tax burdensdo not reflect the damage imposed. Thus a on fuel. Nevertheless, they might be quitecombination of regulation and taxes is required effective at providing differential price signalsto achieve an efficient solution (Eskeland and for different kinds of fuel, as experience inDevarajan 1996). Europe with diesel and unleaded fuel pricing
has shown. And taxes on all fossil fuels play an
Fuel taxation is one method of"variabilizing' important role in making carbon transparent inthe costs of driving, which is considered an any comparison of alternative fuels. By placingimportant step in effectively intemalizing the the equivalent tax on all fossil fuels,external costs due to transport (ECMT 1998a). govemments can assure themselves that theA second method involves charges for use altemative fuel is not cheaper because there is a
... issuch as road or parking pricing. carbon subsidy hidden in the fossil fuels usedPossible consumer responsesto faciities, to prepare the altemative. Carbon taxes on all
charges are substanally differento facltfuel fossil fuels, therefore, are an essential elementcharges, since changing vehicles or vehicle of any market-based altemative fuel strategy.technology does not affect consumption of the Vehicle ownership taxation has long been antaxed good. Road pricing is often associatedwith congestion pricing, that is, choosing locales shtument that steers characteristics of the, . ., , .,. ~~~~~vehicle fleet, characteristics which in turn affectto price and setting rates with the specific fuel consumption. As reviewed by Schipper andpolicy goal of reducing congestion. In principle, Eriksson (1995) or the OECD (OECD 1995),road pricing could apply per kilometer charges to these instruments tax engine size, power, or carroad use, either through periodic toll facilities, weight, parameters that affect both consumeror through electronic pricing methods; in choice and ultimately producer supply. Vehiclepractice, though, it is more often enacted via a taxation can apply at both acquisition andcordon around a pay-to-enter zone, such as a registration, the latter being a recurring tax oncentral business district. To the extent that road.. .. . .............. . the owner every year. Acquisition taxes havepricing is enacted as a congestion mitigation been used by some governments to control orpolicy-that is, to alleviate congestion in restrain rates of motorization. Such a use isparticular areas-it might have the perverse tricky and dangerous, since it might have theeffect of actually inducing more travel, as drivers perverse effect of retarding fleet tumover; cartake longer routes to avoid the toll cordon. In owners are reluctant to replace their agingcounties where value-of-time is lower vehicles with newer ones because of the tax(generally speaking, those with lower levels of burden they may have to bear. The result is anGDP per capita), this avoidance behavior is older (and usually dirtier and less fuel-efficient)probably more important than elsewhere. car fleet overall.
Climate Change Series 31
Transportation and CO2 Emissions: Flexing the Link -- A Path for the World Bank
Registration charges, however, are a potentially 1970s, there may not have been mucheffective way of influencing the vehicle dleet alternative. The relative importance of CAFE vs.mix, through differential pricing of different the higher prices of fuel from 1979-1985 willcars'registration fees depending on their green always be a subject of debate. One of the morecharacteristics. Many policy analysts, however, controversial aspects of the standards is thatare beginning to recognize the need to those for vans and light trucks are less stringentvariabilize as many of the costs associabted with that those for cars; as a result, buyers tendingcars as possible-that is, taxing use, not toward large cars, who are less demanding ofownership--(Eskeland and Devarajan 19936, fuel-efficiency as a characteristic, have tendedECMT 1998a). The reason is that up-front to switch to vehicles in the van and lighthousehold (and firm) capital costs becomne a category (for example, sport utility vehides).justification for use of the vehicle. ("I spent so This shift has caused the real average new carmuch money for the car, I might as well use it.") vehicle fuel economy to rise only very slowlySo while registration charges are potentially during the 1990s. Nevertheless, CAFE had aeffective, it may make more sense to transfer fundarnental effect on car manufacturers,these fees to a pay-as-you-drive basis. pushing them forward into deploying fuel
saving technology, rather than riding out theFinally, there is the possibility of regulaling short period of higher prices by simply sellingnew car fuel economy (C*E). Soft regulations smaller cars. Whether measured per household,or voluntary agreements (VAs), that is, non- per capita, per car, per kilometer, or per dollarbindin-g targets agreed to by manufacturers or of income, the average American householdimporters and govemments, were put in place owning a car used less automobile fuel in 1994in the mid 1970s in Sweden, Germany, and than in 1973.Japan. These were recently offered by theGerman car industry (a 20 percent fuel intensity Which of the above policies might bereduction, per press release in 1995),Volvo (a 25 appropriate for developing countries? Thepercent fuel intensity reduction, per press answer is all and none. Imposing higher carrelease 1996), the French carmakers (a t.Lrget of usage charges fuel prices, differentiated fuel125 grams of CO/km [Peake 1997]), and Fiat taxes or carbon taxes, may be politically difficult(Press release 1997). What is not clear is today. Imposing high purchase taxes seems towhether the VAs represent real efforts by be more politically acceptable, although, asmanufacturers or just validation of what they noted this solution does not match the tax toalreacy believe they can do. Not surprisi ngly, the extemality, places a greater share of carGerman producers andVolvo both say quietly costs in the fixed, rather than vanable, category,that they need support through fuel taxes to and may tend to discourage fleet turover.make sure consumers do not simpDly demand Ro omnue vno hsrltvlmargesur consumers. do not simply deri-iandacceptable policy, however, may be limited bylarger cars. the presence of a indigenous car industry. In
In the UnitE!d States, new car fuel economy has Europe, no car-producing countries imposeIeen regulated, on a fleet-wide average, since heavy vehicle purchase taxes, although somebeen ;regulated, on a fleet-wide average, since with assembly only manage to do this.1975, under the Corporate Average FuelEconomy program. 13 Debate has raged in the Interaction of policies and componentsUnited States ever since, both as to whet:her of emissionsthey aLre a good idea, and as to whether theyhave been effective. Given the unwillingness of The policies noted above affect differentthe U.S. Congress either to decontrol the price components of ASIF. The following tablesof crude oil or to impose new fuel taxes in the summarize some of the more important
32 Environment Departnent Papers
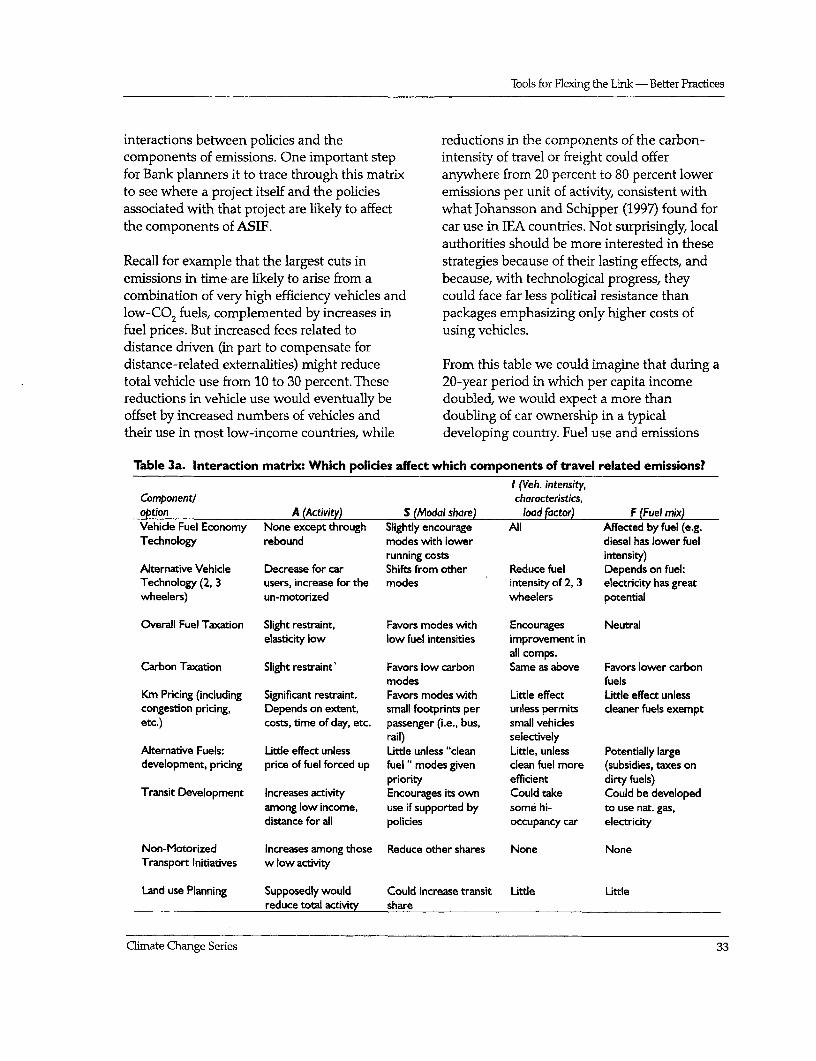
Tools for Flexing the Link - Better Practices
interactions between policies and the reductions in the components of the carbon-components of emissions. One important step intensity of travel or freight could offerfor Bank planners it to trace through this matrix anywhere from 20 percent to 80 percent lowerto see where a project itself and the policies emissions per unit of activity, consistent withassociated with that project are likely to affect what Johansson and Schipper (1997) found forthe components of ASIF. car use in IEA countries. Not surprisingly, local
authorities should be more interested in theseRecall for example that the largest cuts in strategies because of their lasting effects, andemissions in time are likely to arise from a because, with technological progress, theycombination of very high efficiency vehides and could face far less political resistance thanlow-CO2 fuels, complemented by increases in packages emphasizing only higher costs offuel prices. But increased fees related to using vehicles.distance driven (in part to compensate fordistance-related externalities) might reduce From this table we could imagine that during atotal vehicle use from 10 to 30 percent. These 20-year period in which per capita incomereductions in vehicle use would eventually be doubled, we would expect a more thanoffset by increased numbers of vehicles and doubling of car ownership in a typicaltheir use in most low-income countries, while developing country. Fuel use and emissions
Table 3a. Interaction matrix: Which policies affect which components of travel related emissions?I (Veh. intensity,
Component/ characteristics,option A (Activity) S (Modal share) load factor) F (Fuel mix)Vehicle Fuel Economy None except through Slightly encourage All Affected by fuel (e.g.Technology rebound modes with lower diesel has lower fuel
running costs intensity)Alternative Vehicle Decrease for car Shifts from other Reduce fuel Depends on fuel:Technology (2, 3 users, increase for the modes intensity of 2, 3 electricity has greatwheelers) un-motorized wheelers potential
Overall Fuel Taxation Slight restraint, Favors modes with Encourages Neutralelasticity low low fuel intensities improvement in
all comps.Carbon Taxation Slight restraint' Favors low carbon Same as above Favors lower carbon
modes fuelsKm Pricing (including Significant restraint. Favors modes with Little effect Little effect unlesscongestion pricing, Depends on extent, small footprints per unless permits cleaner fuels exemptetc.) costs, time of day, etc. passenger (i.e., bus, small vehicles
rail) selectivelyAlternative Fuels: Little effect unless Little unless "clean Little, unless Potentially largedevelopment, pricing price of fuel forced up fuel " modes given clean fuel more (subsidies, taxes on
priority efficient dirty fuels)Transit Development Increases activity Encourages its own Could take Could be developed
among low income, use if supported by some hi- to use nat. gas,distance for all policies occupancy car electricity
Non-Motorized Increases among those Reduce other shares None NoneTransport Initiatives w low activity
Land use Planning Supposedly would Could increase transit Little Littlereduce total activity share
Climate Change Series 33
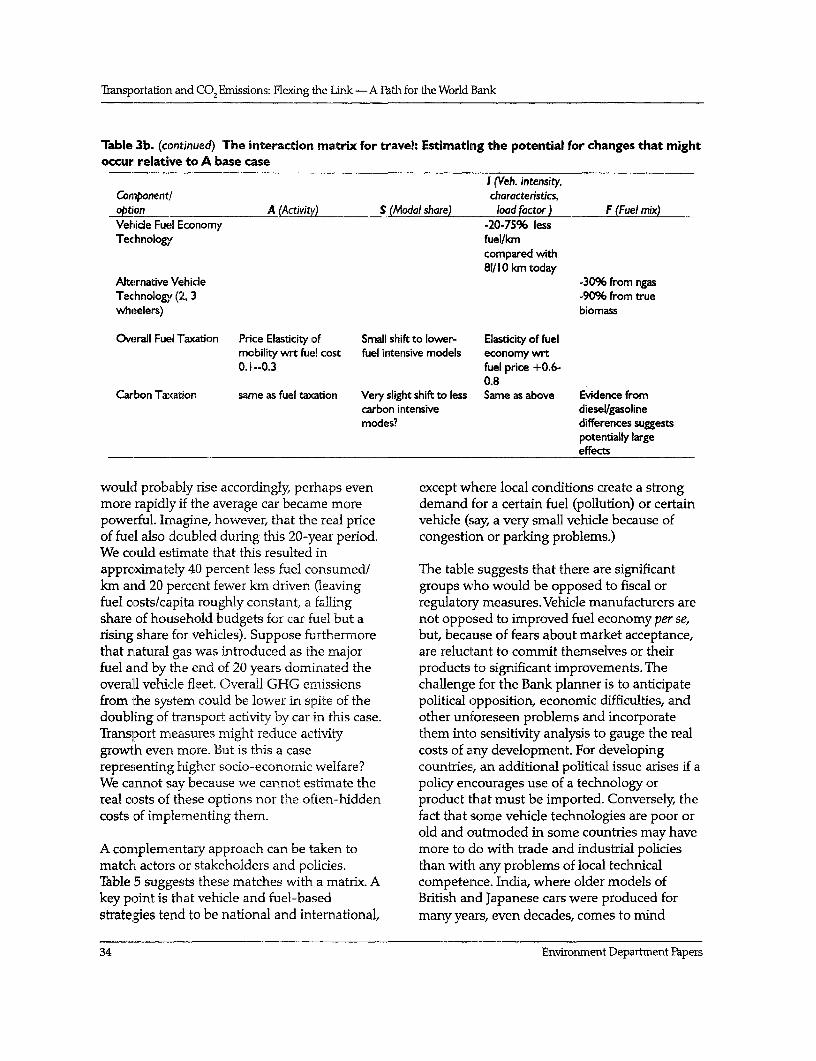
Transportation and CO2 Emissions: Flexing the Link -A Fath for the World Bank
Table 3b. (continued) The interaction matrix for travel: Estimating the potential for changes that mightoccur relative to A base case
I (Veh. intensity,Componentl characteristics,option A (Activity) S Modal share load factor ) F (Fuel mix)Vehicle Fuel Economy -20-75% lessTechnology fuel/km
compared with81/10 km today
Alternative Vehicle -30% from ngasTechnology (2, 3 -90% from truewheelers) biomass
Overall Fuel Taxation Price Elasticity of Small shift to lower- Elasticity of fuelmobility wrt fuel cost fuel intensive models economy wrt0.i--0.3 fuel price +0.6-
0.8Carbon Taxation same as fuel taxation Very slight shift to less Same as above Evidence from
carbon intensive diesel/gasolinemodes? differences suggests
potentially largeeffects
would probably rise accordingly, perhaps even except where local conditions create a strongmore rapidly if the average car became more demand for a certain fuel (pollution) or certainpowerful. Imagine, however, that the real price vehicle (say, a very small vehicle because ofof fuel also doubled during this 20-year period. congestion or parking problems.)We could estimate that this resulted inapproximately 40 percent less fuel consumed/ The table suggests that there are significantkm and 20 percent fewer km driven (leaving groups who would be opposed to fiscal orfuel costs/capita roughly constant, a falling regulatory measures. Vehicle manufacturers areshare of household budgets for car fuel but a not opposed to improved fuel economy per se,rising share for vehicles). Suppose furthermore but, because of fears about market acceptance,that natural gas was introduced as the major are reluctant to commit themselves or theirfuel and by the end of 20 years dominated the products to significant improvements. Theoverall vehicle fleet. Overall GHG emissions challenge for the Bank planner is to anticipatefrom the system could be lower in spite of the political opposition, economic difficulties, anddoubling of transport activity by car in this case. other unforeseen problems and incorporateTransport measures might reduce activity them into sensitivity analysis to gauge the realgrowth even more. But is this a case costs of any development. For developingrepresenting higher socio-econornic welfare? countries, an additional political issue arises if aWe cannot say because we cannot estimate the policy encourages use of a technology orreal costs of these options nor the often -hidden product that must be imported. Conversely, thecosts of implementing them. fact that some vehicle technologies are poor or
old and outmoded in some countries may haveA complementary approach can be taken to more to do with trade and industrial policiesmatch actors or stakeholders and policies. than with any problems of local technicalTable 5 suggests these matches with a matrix. A competence. India, where older models ofkey point is that vehicle and fuel-based British and Japanese cars were produced forstrategies tend to be national and international, many years, even decades, comes to mind
34 Envirornent Department Papers
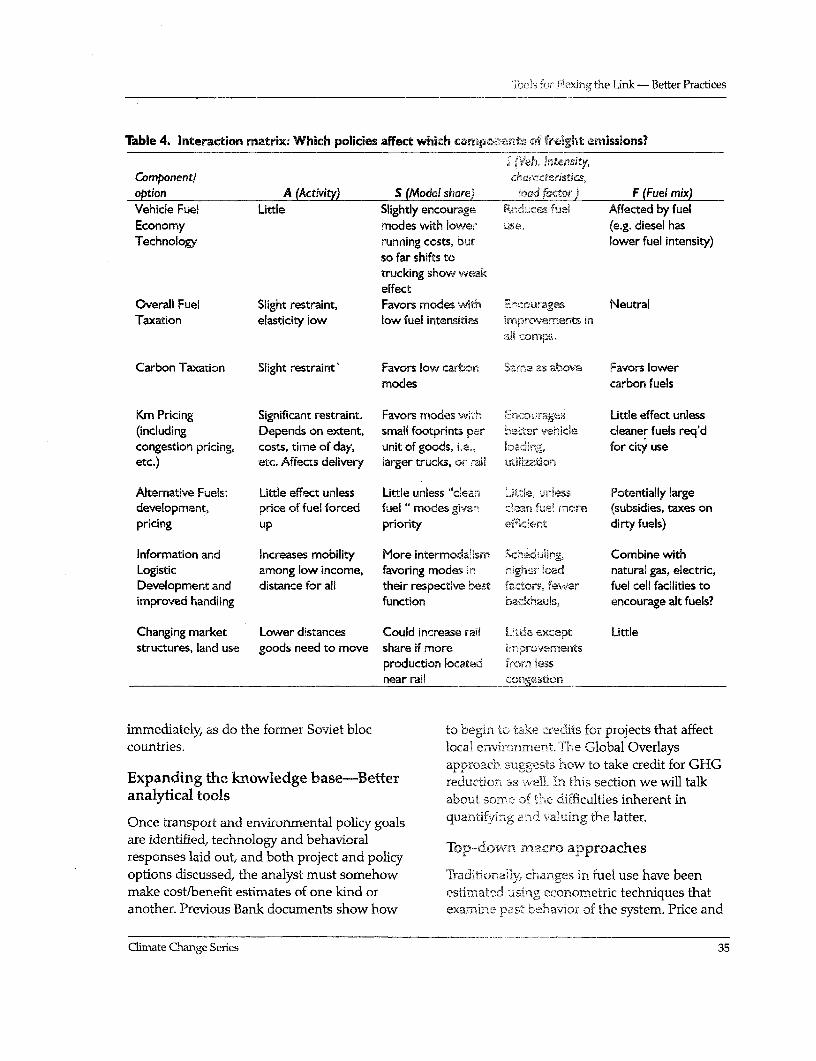
-dils for Pleindg the Link - Better Practices
Table 4. Interaction matrix: Which policies affect whih coo9 Of freight emissions?
2R ('IVeh. DIntensft;y
Componentl r-Jstifs,option A (Activity) S (Modal share; --_ ad fo'ctcr),3 F (Fuel mix)Vehicle Fuel Little Slightly encourage R idces Fuei Affected by fuelEconomy modes with lower use. (e.g. diesel hasTechnology running costs, but lower fuel intensity)
so far shifts totrucking show weakeffect
Overall Fuel Slight restraint, Favors modes with E.ncourages NeutralTaxation elasticity low low fuel intensities improvements in
a Vcompr.
Carbon Taxation Slight restraint' Favors low carbon Sa,me as above Favors lowermodes carbon fuels
Km Pricing Significant restraint. Favors modes with r-':.ncotura.-s Little effect unless(including Depends on extent, smail footprints per hecter vehicle cleaner fuels req'dcongestion pricing, costs, time of day, unit of goods, i.e., Hoadling, for city useetc.) etc. Affects delivery larger trucks, or: :al i iuid HionE
Alternative Fuels: Little effect unless Little unless "clean LThievia M-1ess Potentially largedevelopment, price of fuel forced fuel " modes giver . Ua 'L.2 more (subsidies, taxes onpricing up priority e , Ident dirty fuels)
Information and Increases mobility More intermodalism Sched, 3 tiign Combine withLogistic among low income, favoring modes in H,JgTrer load natural gas, electric,Development and distance for all their respective best factors, .veer fuel cell facilities toimproved handling function bavkhauls, encourage alt fuels?
Changing market Lower distances Could increase rail 3ttie except Littlestructures, land use goods need to move share if more rrnroiernents
production located fi<*aro 3ess
near rail -_ __n_esti_ _ _
immediately, as do the former Soviet bloc to begin to tak,e credits for projects that affectcountries. local enV4ironment. The Global Overlays
apprcacbo suegests how to take credit for GHGExpanding the knowledge base-Better reduction --s.v 1r. Tn this section we will talkanalytical tools about soDme 3'- 'E Le difficulties inherent in
Once transport and environmental policy goals quantifying a va raluing the latter.are identified, technology and behavioralresponses laid out, and both project and policyoptions discussed, the analyst must somehow Tradiro-na4y, changes in fuel use have beenmake cost/benefit estimates of one kind or estimated using econometric techniques thatanother. Previous Bank documents show how examine pas. behavior of the system. Price and
CliTnate Change Series 35
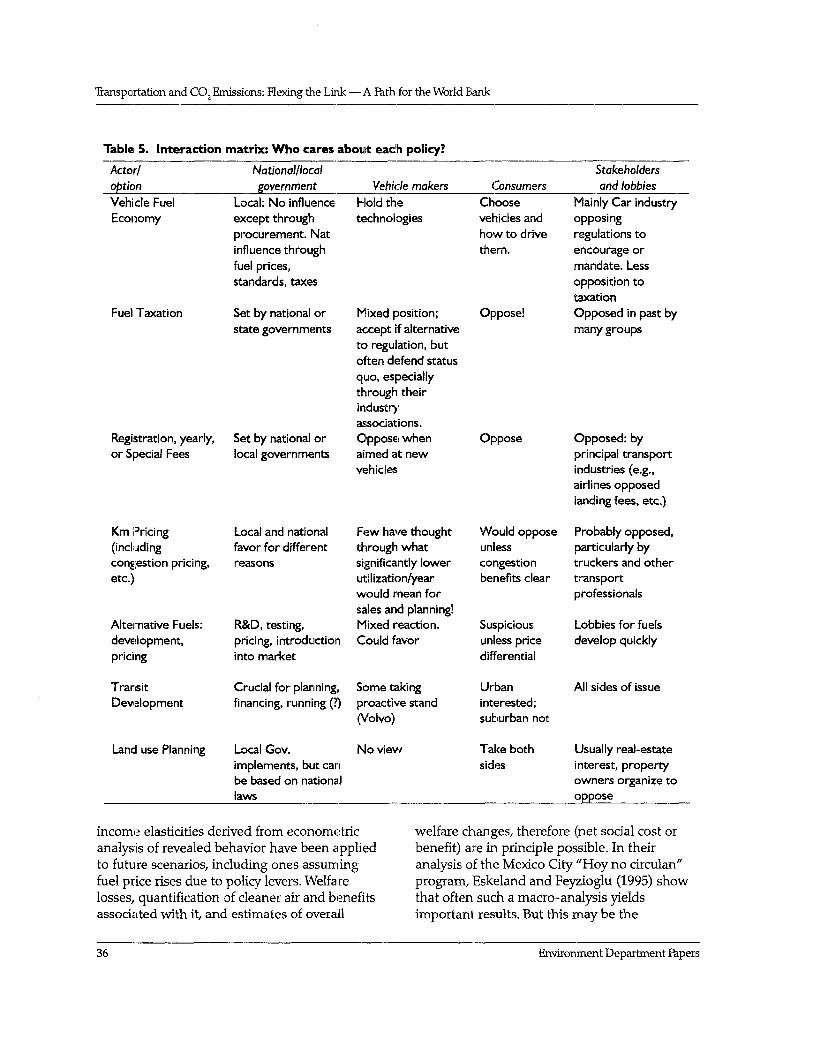
Transportation and CO Enmissions: Flexing the Link -A Path for the World Bank
Table 5. Interaction matrix: Who cares about each policy?
Actor/ National/local Stakeholdersoption govemment Vehicle makers Consumers and lobbiesVehicle Fuel Local: No influence Hold the Choose Mainly Car industryEconomy except through technologies vehicles and opposing
procurement. Nat how to drive regulations toinfluence through them. encourage orfuel prices, mandate. Lessstandards, taxes opposition to
taxationFuel Taxation Set by national or Mixed position; Oppose! Opposed in past by
state governments accept if alternative many groupsto regulation, butoften defend statusquo, especiallythrough theirindustryassociations.
Registration, yearly, Set by national or Oppose when Oppose Opposed: byor Special Fees local governments aimed at new principal transport
vehicles industries (e.g.,airlines opposedlanding fees, etc.)
Km Pricing Local and national Few havfe thought Would oppose Probably opposed,(including favor for different through what unless particularly bycongestion pricing, reasons significantly lower congestion truckers and otheretc.) utilization/year benefits clear transport
would mean for professionalssales and planning!
Alternative Fuels: R&D, testing, Mixed reaction. Suspicious Lobbies for fuelsdevelopment, pricing, introduction Could favor unless price develop quicklypricing into market differential
Trarisit Crucial for planning, Some taking Urban All sides of issueDevelopment financing, running (I') proactive stand interested;
(Volvo) suburban not
Lancl use Planning Local Gov. No view Take both Usually real-estateimplements, but car- sides interest, propertybe based on national owners organize tolaws oppose
income elasticities derived from econometric welfare changes, therefore (net social cost oranalysis of revealed behavior have been applied benefit) are in principle possible. In theirto future scenarios, including ones assuming analysis of the Mexico City "Hoy no circulan"fuel price rises due to policy levers. Welfare program, Eskeland and Feyzioglu (1995) showlosses, quantification of cleaner air and benefits that often such a macro-analysis yieldsassociated with it, and estimates of overall important results. But this may be the
36 Environment Department Papers
Tools for Flexing the Link - Better Practices
exception, not the rule. The macro tools are Moreover, it is important to try to understandimportant, indeed, but have their limits. how vehicle ownership, vehicle use, and fuel
consumption each varies among differentThese limitations are caused by inadequate classes of consumers. Each class imposesknowledge of the macro parameters that different levels of other costs (air pollution,describe the demand for transport services and noise, road wear, safety, or congestion) on otherfuel use, particularly in developing countries. drivers and on the environment. But obtainingAbove all, one cannot separate the ASIF each group's likely responses requires the kindcomponents and estimate how each might of survey work previously described. The
approach of Greening and others (1997), whichchange.sOne can taivell furie observed changes in car use in the Unitedelastcites from the relatvely accurate data on States observed during a period of sudden highaggregate fuel sales, but such data tell us little prices (1990/1) through quarterly householdabout transport problems. McRae (1994) surveys, established how different family typescomputed gasoline demand elasticities for a experienced different short-term responses tonumber of developing countries, but higher fuel prices. Similar information must beoverlooked the use of diesel in cars or the use gathered for operators of other modes, too.of gasoline in trucks and buses. Like Wheaton Otherwise, it is hard to anticipate the real(1982, see Schipper and others 1993), McRae short- and long-term reactions to imposition ofdid not measure the demand for transport new fuel or vehicle taxation schemes or otherservices and the consumption/km of different policies that significantly changes the costs ofvehicles. The reality is that these approaches owning and using vehicles. Conversely it isrepresented the best that could be done at the difficult to quantify the total environmentaltime with the limited data. benefits of pricing strategies if some of the
responses that may yield significantly fewerThe problem is further aggravated because the km-traveled cannot be quantified. This isrange of uncertainties one obtains for income particularly important for estimating how GHGand price elasticities of fuel use may be too abatement will affect traffic and how traffic
for transport planning purposes. At one control strategies wll affect fuel use and hencelarge . v .. GHG emissions. The interaction of the two
end of the uncertainty range (high income s m belasticities and low fuel price elasticities), there strategies may be as iinportant as each strategyelasticities lande welowfuepe lselastciaties) thee taken separately (COWI 1996; Eskeland and Xie
willbe lrge elfae loses ssocatedwith1998). Indeed, this may be the key to aimposing large taxes on fuels, and growth in the successful Gardci stratey fornumber of vehicles with income will soon erase transportaton and a key step i the Globalthe effects. At the other end of this uncertainty Orayaanayi ief tying non-GHrange, modest taxes could have an enormous measures to incidental GHG reducthons.effect on fuel use, distance traveled, or evenvehicle ownership. But no macro approach can The same problem of uncertainties plaguessay whether substitution or fuel-saving estimation of macro responses from the freightpossibilities exist unless they existed in the past system. In the IEA countries it appears that theand their effects were measured. Since part of GDP elasticities of domestic freight shipmentsthe thrust of the present effort is to explore an vary from 0.8-1.2, and that the ratio of domesticarea where few possibilities for GHG ton-km to GDP varies by a factor of threeabatement were thought to exist in the past, by depending on geography, raw materialsdefinition the macro approach to study the production and other factors. (Schipper, Schollfuture is inappropriate. and Price 1997). These results are not
Climate Change Series 37
Transportation and CO2Emissions: Flexdng the Link -A Path for the World Bank
inconsistent with those of Thompson, F:rasier commence to measure even as policies thatand Benson (World Bank 1994). But those affect how goods are moved are implemented.authors noted how poorly the parameters thatdescribe freight are known in developing The demand for transport services is probablycountries or even ElTs. more income elastic for in DCs and EITs than in
upper income countries. Demand for fuel isAggregate estimates for fuel price elasticities for elastic where substitutes exist (other modes,trucking are also fraught with difficulties more efficient technologies, or smaller vehicles).becatse of the problem of identifying trucking Over the longer run higher fuel prices meanfuel use (Schipper, Scholl, and Price 1997). The less fuel-intensive vehicles, and observedresulting elasticities appear to be small, as do behavior suggests that that response is morethe elasticities of trucking fuel intensity with important that a decline in vehicle use orrespect to fuel price. But estimating fuel mobility. That is, the long-run response tointensity elasticities with respect to prices for higher fuel prices results mostly in more fueltrucks is particularly tricky. Shifts in the mix of efficient (or smaller) cars and to a lesser extenttrucks over time-in response to the needs of in reduced driving (Johansson and Schipperchanging production mechanism-have 1997). But how can we use these generalboosted the importance of small trucks in many statements for building GHG abatementIEA countries. Consequently, even if capacity strategies? The answer is to expand the analysisutilization of a given size truck and relative to bottom-up techniques.levels among different truck types remain thesame, average modal intensity will increase, all Using a bottom-up approach to measureelse equal. Again, detailed surveys are required costs and benefitsto see how trucking fuel use really varies under Using these general results to formulate adifferent conditions, and as a function of: fuel strategy requires us to complement the meagerprice changes. survey data and macro elasticities with best
T'here is an interesting inverse correlation estimates of the impacts of technologies inThetweeisan truckinte ng f rinversed tucr ting emissions, and the impacts of differences inbetween trucking fuel prices and truckincg various prices on both vehicle use or mobilityenergy use/GDP (Schipper, Scholl and F'rice and fuel intensities as well. That is, one tries to1997; Schipper [IEA] 1997). The geographically compare changes in emissions from changes inlargest IEA countries have low trucking Fuel each of the components noted above in theprices and, because of geography, naturzal ASIF formulation shown. Knowing somethingresource endowments, and natural econoomies about cross price elasticities and how theyof scale for modal alternatives, relatively low affect modal shifts for travel is useful. Estimatesshares of trucking in overall freight, but they of the marginal costs of changing technologiesstill have high trucking volumes/GDP because permit a rough sense of responses in the idealthe overall volume of freight is large. The long world. The Budapest bus loan proposeddistances raise the relative importance of large, expenditures to provide more energy efficient,well-loaded trucks and thus lead to low values cleaner buses. Knowing how much the busesof fuel use/ton-km, too. Is this a reverse policy, are expected to run and how much lesswhere large countries, such as Australia, pollution they will emit permits a quantificationCanada, or the United States, simply kept road of air pollution reductions and energy saved.fuel taxes low? Even in IEA Countries, little isknown about the rationale behind policyr Even more useful is the approach of Eskelandformundation. For DCs and the EITs, the and Xie in attempting to estimate marginalsituation is much worse. Hence we must: abatement costs and the quantities that will
38 Environment Department Papers
Tools for Flexing the Link - Better Practices
change as well, in a program of pollution Finally, it is crucial to estimate the hidden costs.abatement or fuel saving. This leads to a curve Is enforcement of a required retrofit of pollutionof pollution or CO2 abatement. It is important control expensive? Would higher fuel taxesto include any feedback from either higher or promote significant black-market sales oflower variable costs to estimate both how untaxed fuel or cutting of taxed fuel withchanged technology and changed driving affect similar, untaxed fuel, such as when untaxed,overall emissions. It is also necessary to make at low cost kerosene is added to gasoline. Wouldleast a rough calculation welfare gains and improved fuel economy lead to more importedlosses. But the advantage of the bottom-up vehicles or vehicle components and lessapproach as a complement to the top down domestic production? These hidden costs mightmacro calculation is that the analyst or program lead to resistance to abatement strategies onmanager can identify the key elements of the part of important constituencies.change that lead to the greatest benefits,elements that might have to be monitoredcarefully. There seems little doubt that in lower income
countries, more efficient or lower cost transportHere a warning is necessary. Much of the stimulates the demand for transport. This leadsargument among govemments and between to an increase in welfare, but lower net restraintgovernments and NGOs in the COP-3 involved in CO 2 Wil variabilization of costs, by loweringhow and how much to value of the reduction of taxes on acquiring or owning vehicles, stimulateGHG emissions. A consensus on neither the greater vehide ownership but less use?extent of actual or projected damage existed, Johansson and Schipper (1997) found thatnor the willingness-to-pay of individuals, lower new-car taxes had a positive effect onbusinesses, or governments. There is somewhat ownership, while higher fuel prices had a smallmore consensus about the reality of the costs of negative effect on ownership but a modestother transport extemalities, such as local air effect on use. Since the analysis applied only toquality, pollution, and noise, but even this upper income countries, conclusions aboutconsensus is limited; representatives of these must be guarded when applied to low-transport industry, as well as some academics, income countries where a small reduction inregularly argue that such extemality costs are dnving costs could be a big bonus to incomes.small relative to the benefits provided bytransport, while some health scientists contend pofsgrete t o s authoritiesthethat the costs for health alone are large. What is possibilioy tt signiin ivementlifo bohGGrsran.n h fuel economy or decline in vehicle use greatlyimportant or both GHG restrat and the cuts into future road-fuel tax revenues, evenvaluation of other transportation extemalities is with the.bounceback"or"rebound'effect,to consider a range of costs and see where the hence it may be relatively easy to head off thisboundaries lie, that is, at what lower valuation problem by raising taxes. (Ihe converse is thedo GHG restraint benefits become truly idea of the Danish Government, namely toinsignificant, and similarly for other problems declare a new-car fuel economy path implying a(noise, safety, and so forth). If officials in a host certain average annual increase. Real fuel pricescountry are simply not willing to pay for rise at the same rate, so anyone buying a carreduced congestion, noise, dust, air pollution, with lower than the target fuel economy paystraffic fatalities, then it will be difficult for any more.)Bank manager to pursue any further theenvironmental aspects so important to a GHG It should be noted that financing of extensivestrategy. metro and bus systems, while increasing
Climate Change Series 39
Transpcrtation and CO2Ernissions: Flexing the Link-A Path for the World Bank
mobility at relatively low GHG emissions/km, of notoriously inaccurate aggregates to estimatecould also be a rebound stimulation by future energy demands. Without a clear picturepermilting people to live much farther from of energy-use patterns, it was hard to convincework than previously. This is not to say that authorities to lift subsidies and"get pricessuch systems do not increase welfare. Rather it right."Finally, the industrial surveys oftenis important to model both distance and modal revealed the inefficiencies of basic processeschoice and carbon intensity (that is, all terms in and showed the benefits of improving towardsthe ASIF formulation) where a new system is "best practices."likely to stimulate interactions amongst theterms. The same tools must be developed rapidly in
developing countries and EITs. These include:The rebound or bounceback effect is associatedwith an increase in economic welfare. If a * Household vehicle/fuel use, travel surveys, andhousehold's ranges of action are increased by time-use surveys such as the panelsbetter transportation without subsidies cr net supported by the Dutch Govemmentincreases in externalities, then everyone is through the Bureau of Statistics. Thesebetter off. When part of a rebound is stimulated cover both vehicles and people.either by under-pricing of externalities (or fuel), * Fleet activity andfuel use surveys, toone must anticipate the rebounds that will determine the condition of bus, truck, smalloccur and guLard against aggravating other boat fleets (for example ferries, barges, eventransport problems. Overall this effect is small fishing vessels which are not consideredin high-income countries of the IEA but could here), their fuel use/km, their typicalbe significant in low-income countries arLd utilizatiorn factors and passenger or ton-kmmust be studied carefully and anticipated. delivered. For example, Kenya Bus Services
was able to provide a very accurate recordImproving the knowledge base - of all of its buses to an energy survey thereConcrete steps in client countries in 1981 (Schipper and Meyers 1983).
Goods must be surveyed with commodityThe foregoing discussion assumes that an flow surveys attached to truck utilizationanalyst has at his/her disposal the same kinds surveys, such as the"TIUS"of the U.S.of data as are available to developed country Department of Commerce. These show howanalysts and policy-makers. For most of the and how far different goods move, as wellEITs and DCS, data is often either nonexistent as how different kinds of vehicles haulor inac:curate. Under this situation, how can we different kinds of goods.begin to measure what is best? * Geographic regions themselves need to be
surveyed to better pinpoint vehicle flows,Here the World Bank can look to its own record origin-destination patterns, local sources offor"best practices," Starting in the early 1980s, emissions arising because of poor trafficthe ESMAP program began a long and conditions or micro climate (still air, and socontinuing series of surveys of energy use in forth). For urban regions this is essential toindustry and households. These were finding both where traffic is tied up, who isconsidered essential to energy-related tying up traffic when, and estimating howindustrial development for energy conservation, different policy instruments might affectassistance projects related to rural and urban these traffic flows. Better understanding ofenergy systems, and ultimately to judge the how goods are distributed in detail allowsworthiness of large-scale fuel and power for better location of distribution facilitiessystern expansion. Not understanding energy so that competition for road space isdemar,d would have left planners to the mercy reduced.
40 Environment Department Papers
Tools for Flexing the Link - Better Practices
* Better assessment of the real emissions from from a single board showing the status of eachvehicles, either from remote sensing vehicle.(preferable) or other techniques applied inreal situations, or from spot roadside tests, Whatever the technology or survey instrument,or from yearly inspections. Bank experience with energy suggests that
* Testfacilities for measuringfuel consumption of funds used to support data gathering andand emissions from vehicles both in ideal sensing experiments could go along way toconditions and on the road. On-road both helping prove the systems and tomeasurements are particularly important convincing authorities and drivers alike that thebecause they reveal the impact of driver systems are fair and reliable. Assistance for in-behavior, traffic, and in lower-income depth travel surveys and the other instrumentscountries, road surface quality and fuel mentioned in the list above would pay back inquality as well. terms of far better information on both
problems and results.This information is not cheap, but it isbecoming cheaper rapidly. Without it, we Endnotescannot measure the economic and physicaldimensions of a transport system we seek to 10. It must be noted that very few countries havechange. Nor can we measure the impacts of achieved a significant, permanent, long-termpolicies or technologies. Both measurements change in fuel pricing that was not erased byare essential to estimating costs and benefits of inflation. Canada is one example, where fuelpolicies ex ante and to evaluating policies ex prices were raised from well below U.S. levelspost. in 1980 to above U.S. levels in 1981 and now
remain somewhere between U.S. levels andThere are many techniques that can be European ones. Data indicate that the fuelimplemented with Bank assistance. Among intensity of the Canadian fleet was higherthose readily available indude simple meters than that in the United States in the earlythat measure kilometers traveled, which were 1970s but lower today, suggestive of therequired on all diesel vehicles in Sweden, impact of changed prices (NRCAN 1997). ButFinland, and Norway until 1993. Annual safety Canada also followed the US CAFEinspections can be expanded to note annual regulations in law and through the sharing ofmileage and at least measure emissions under many auto manufacturing plants. The lack ofstandard conditions. Remote detection of speed possibility of observing how a given country'slimit violations is already used in Germany and car stock (and driving) changed is one reasonthe United Kingdom, while manned-radar why many are skeptical about the real powermeasurements are used in many other of changes in fuel prices, however.countries. Soon, road-pricing schemes that 11. Interestingly, the former West Germanycharge cars by where and when they travel will accepted a very large fuel tax increase ($0.70be relatively inexpensive. Like electronic tickets US/gallon in current 1991 prices) to financeto metro systems in some US cities, these the rebuilding of the former East Germany,schemes can preserve the anonymity of the and Canada implemented an increase ofdriver or car owner, who simply purchases an about $0.50 US/gallon in 1981 prices as partelectronic card worth so much against the fees of a significant compromise on provincial/charged to drive in congested or polluted areas. federal energy policies in the early 1980s.The fees are deducted electronically. The same Externalities related to fuel use were not thesystem could be adapted to a GSM to allow motivating factors in either case.traffic monitors to follow problems in real time, 12. Of course, such a tax cannot take the place ofmuch as large rail systems can be observed sound monetary policy, and the mechanisms
Climate Change Series 41
Tansportation and CO2 Enissions: Flexing the Lirk-A Path for the World Bank
of such policy must be in place to insure that CAFE was not thought to be binding, in thethe tax is not repealed during other parts of sense that Americans bought less fuelthe economic cycle. intensive cars than the standards called for,
13. The United States developed CAFE standards, but after 1982, from which time the real costwl'ich were essentially followed in Canada, as of fuel began to fall, CAFE was increasinglywell. These assessed a civil penalty to any binding on one or more manufacturers. Theirmainufacturer whose sales-weighted test fuel response was to set prices of cars such thateconomy in a model year exceeded the enough smaller, less fuel intensive cars werestandard, which itself began at 16 MPG in sold to obtain a sales-weighted average that1978 and rose to 28 MPG in the early 1980s, met the standard. Light trucks and vans werewhere it has remained. The penalty was subject to a different, more lenient standard.proportional to total number of cars sold That their share of new light duty vehicletimes the margin by which the limit wEas purchases has now approached 50% suggestsexceeded. Margins in one year could be consumers in the U.S. do want larger carscredited to overshooting in another. During today, particularly with fuel costs low.the period of higher fuel prices in the U.S.,
42 Environment Department Papers
Designing a Transportation/CO 2
C) Strategy for the Bank
There are several issues that ought to be central really examines the financial conditions, whichto any Bank strategy, and we develop them in at present do not include accounting forthis section. Following that, we discuss ways of reductions in externalities per se. The Globalrelating to national circumstances. We note that Overlays provide a convenient way forthe Bank cannot just insert a transport estimating the benefits of the project thatsystem-whether through a loan, help with accrue to all, not just the borrower/borrowingtechnology, advice, and so forth-in a country, country. The Borrower will benefit both fromcount up the repayments, and walk away. A the implementation of the loan (say, acarefully conceived transport/CO2 policy government borrowing for a transit system) butframework is needed. This is particularly true also from the reduction in transportationfor transit, land use planning, and other extemalities, yet does not necessarily reap thesesystems or strategies that interact dosely with benefits in direct financial terms. The analystlifestyles, and where unanticipated and often can measure what each of the first two actorsunintended reactions by drivers, travelers, or "sees"but also must make a number of trickyshippers can be expected unless policies check calculations to estimate both environmentalspurts in transportation activity. impacts per se and their valuation as well.
At the outset we noted that few developing Finally, the Bank Task manager has not only tocountries are concerned about GHG emissions, balance the first two perspectives using theparticularly local or regional authorities. Still, in analysis provided, but he/she also must balancesome cases, policies designed specifically to the political, bureaucratic, and institutional oraddress GHG reduction may offer gains for the even personal forces that certain characterizelocal/regional environment. Fuel taxes will any transaction involving millions of dollars,reduce local traffic somewhat. Biofuels, such as prestige, highly visible projects, and so forth. Inalcohol/gasoline blends could offer significant this process, it is very important for the Taskbenefits to local air pollution problems, as Manager to identify those aspects ofwould natural gas. Encouragement of local environmental improvement (including GHGproduction of clean two- or three-wheeled restraint) associated with the project and makevehicles, bicycles, clean buses, or small freight sure these are not only evident to all parties,vehicles, to meet transport needs and further but"sold and accepted"by all as a plus in theenvironmental goals would encourage national overall loan process. Otherwise, the real thrustand local govemments to develop of applying the Global Overlays is lost.comprehensive CO2. air pollution, andtransport policies. Overriding issues facing any transport
Actors in a Bank loan process of necessity have 2
different perspectives. The Borrower (the Bank) The data present herein suggest that inwants the loan repaid at minimum risk and countries with low motorized personal and
Climnate Change Series 43
Transportation and CO2 Emissions: Flexing the Link -A Path for the World Bank
goods mobility, growth in these activities alone available, but they are under development, bothwill swamp most attempts to reduce GH:G to bring down costs and to increase the netemissions from transport unless either low- reduction in CO2 as well. More likely, however,CO2 fuels or low-CO2 modes truly dominate there will be a significant lowering of the rate oftransportation. So far this has not happened increase in CO2 relative to the rate of increaseanywhere. Few countries have an incentive to in GDP (for a given set of fuel prices). In DCsadopt bold strategies like Singapore or Hlong this path has to be constructed carefully, so thatKong vis-a-vis congestion. Still, it is important there is not a big rebound effect arising fromto have in mind whether the goal is to cause significantly lower fuel costs, an effect thatminor changes in transportation activities (and could make other transport problems worse. Ifpossibly CO2 emissions) or indeed cause major this approach is successful, we will discover therestraint or even decline. It is crucial to path of restraint. Under this strategy, transportremerriber that CO2 is not a key issue for either growth continues but development istransportation, environment or energy policy in successively less C0 2-intensive, although CO2most DCs or EITs. Nevertheless, the Bank's emissions may continue to grow for a very longactions could affect CO2 emissions from time. Note, however, that such a strategy doestransport directly and indirectly. We can little to address other problems within theconceive of three different paths or strategies transport sector; congestion, pollution, roadthat are by no means exclusive, and mention a wear, noise, and other problems associated withfourth for consideration as well. transport may still continue to grow. Eventually,
this activity growth may also begin to push upThe first strategy is one of abatement, whereby CO2 emissions, in spite of the radicalpresent-day pattems of transport and enriissions reductions in specific CO2 emissions caused byare continually attacked and (hopefully) made the new technology.less C0 2-intensive little by little. This goal isaccomplished by chipping away, sometimes A third approach is to try to define a long-termpiecemreal, at all parts of the ASIF equation goal of far lower emissions per GDP than onethrough requiring marginal changes in the sees today in the OECD. Curitiba in Brazil, andactors, stimulated by price and administrative perhaps Singapore, are examples, but so far,policies. Each new strategy lowers emissions a have not been replicated elsewhere.Yet it isbit from where they would have been, but the worth setting sights on this avoidance pathsystem still keeps growing and so do emissions. whereby policies are established to build a low-These actions are each justified by modest CO2 transport system rather than just reducechanges in fuel and transport prices, revenue existing emissions from a high level. It isneeds, cost-effective incremental changes to arguable whether Singapore really succeeded invehicles or systems, and technological reducing overall car dependence, or whetherdevelopments whose pace exceeds the changes Curitiba will remain only half as car-intensiveoccurring in vehicles that are CO2 intensive. as other Brazilian cities. But in principle,The overall impact, however, is growth in GHG strategies that restrain car and truck ownershipemissiDns. and use in the name of sound transportation
reform would contribute greatly to vitality ofIf technologies permitted a radical reduction in low-CO2 modes. This is effectively theCO2 emissions, either by changing fuels or development that occurred in Denmark and thethrough greatly improved fuel efficiency, a Netherlands, at least for cars. If this buysresulting straitegy would actually allow for CO2 significant restraint, then one can expect thatelimination. Such technologies permitting such the next generation of vehicles, which could bea large reduction are not yet commercially far more fuel intensive than vehicles today, and
44 Envirorunent Department Papers
Designing aTransportation/CO2 Strategy for the Bank
the next generation of alternative fuels (which some extent OECD governments have a stakecould power yet again the entire vehicle fleet in in seeing that this option is pursued, even if itthirty years time) would each reduce emissions bodes ill for traditional supplies of vehicles,more. In other words, if A and S grow only half fuels, and much of the transportationas fast in a country (relative to GDP growth), as infrastructure.Thus the Bank should monitorthey did in most of W. Europe in the 1960s or developments in this regard.1970s, and if I is cut in half from present valuesand F is eventually cut by more than one half, In all of these goals it is assumed that CO2 perthen one can foresee a system that grows to se is irrelevant in most countries. But policiesavoid high CO2 emissions, by as much as a closely related to CO2 may be justified tofactor of 90 percent lower, per unit of GDP, than reduce oil imports and thereby"fix"CO2 bywe experience today in Europe. restraining transportation fuel use or
encouraging substitution of natural gas (whereAll of these approaches tend to follow the same available), with lower GHG emissions in mostparadigm of western style transportation cases. Similarly, policies designed to stimulatedevelopment, even if some (like Curitiba or production of local biomass fuels because theySingapore) appear radical to other make economic sense on their own could leadcommunities: reduce transport demand to significant lowering of emissions where thesesomewhat and try to use less carbon intensive are truly produces of biological processes andmodes, more energy efficiency vehicles, and not simply"refined biomass"such as U.S. corn-perhaps less carbon intensive fuels. based alcohol. Finally, fiscal measures affecting
vehicle ownership would likely put downwardA fourth approach, the hardest, is to ask pressure on vehicle fuel intensities (orwhether OECD patterns, which seem to serve encourage 2 or 3 wheelers instead of cars). Thisas a goal for transport planning might change. would also reduce fuel use. Note however thatCould this change be dramatic and rapid all of these policies have other justifications.enough so as to illuminate new ways of Other options must be integrated withproviding access on fewer kilometers? These transport policy reform, land use, or otherchanges could arise from a combination of sectoral reforms for which CO2 hardly appearstechnology and land use/lifestyles changes. as an important factor. Thus any Bank activityThere is serious research into these possibilities must somehow be related to either CO2examining both travel and freight and raising (because it affects either fuel or vehicles) orfundamental issues (FMS 1997; the ECN work; non-CO2 measures. In an integrated policy, theGerman Enquete Commission"Mobility and non-CO2 concerns may be boosted by C02-Climate"1995, and so forth), and on more justified strategies and vice versa, leading togeneral changes in lifestyles (Schipper 1996; synergies not present if specific policies orSchipper and others 1989). Car sharing, for technologies are considered each byexample, may eliminate some driving by themselves.spreading car ownership over many people;selective tolls on all but the cleanest or smallest Bank strategy will inevitably interact with thevehicles might eliminate many vehicles from private sector, the vehicle manufacturers andcommuting or city traffic in general. sellers. Volvo, for example, played a key role in
producing buses for Curitiba. They are nowIt is possible that continued experimentation in working with authorities in Bangalor, Indiaselect OECD countries or communities might both to establish production there and to growyield stable, low-CO2 transportation systems a bus system for that city (press release from(even when all the leakages are counted). To Volvo, March 1997).Vehicle manufacturers are
Cimate Change Series 45
Transportation and CO2 Emissions: Flexing the Linlk -A Path for the World Bank
always looking for other opportunities to Issues facing development of a strategyprovide buses in growing markets. More in each region, country, or projectimportant, the international vehiclemanufacturers see developing countries as ETmeframe and timinghuge potential markets for both cars and , At the outset it was noted that the time frameTherefDre they must be brought into any Bank for various measures can be from days tostrategy, since their goals inevitably wll collide decades; the most important GHG reductionwith any policies designed to slow the growth measures act through the replacement of thein motorized mobility. At the same time some stock of vehicles, which takes two to threemanufacturers have recognized that without decades. For developing countries, most of theoverall measures to rein in uncontrolled growth c i thin vehicle use, transportation in the very change in the stock iS through growth, soin veicleuse, ransortaion i theverystrategies affecting principally new vehidles willcountnres where they see future markets wi1 have a rapid downward effect on the averagebecome unsustainable. Therefore, partnerships emissions per unit of activity, even if the overallwith the private sector are needed now. path of emissions is still upward.
This point leads to a final, more sensitive issue. Is the client country interested in GHG at all? IsThe politics of transport can be sensitive. short-term abatement of emissions, medium-Consumer/household interests, public anl term restraint, or long term avoidance the goal?private transport unions, road boulders, road Does the client country want to develop a long-stoppe:rs, even lobbies for bicyclists can be term strategy for sustainable transport? Or ispowerful interest groups that sway decision the client interest much more narrowly definedmakers. The Bank must decide how to deal with to getting a project completed? If the latter isthese interests, which, for better or worse, do the case, the Bank probably cannot do much tohave the power to force trading best practices affect GHG emissions. This does not mean afor second best, and often for first worst. project should not be evaluated as to its GHG
impact, only that the real long-term impact willIn the final analysis, a Bank strategy has to almost invariably be upward if the projectcombire options (technologies, and so forth) contributes to increased traffic. By contrast, awith tools (policies, measurement, and so forth) strategy of purposeful replacement of vehiclesthat wcrk in a given country in a way that will and significant changes to the new vehiclesprovoke sure change. This is quantitatively and entering the stock could have a very profoundqualitatively different than a lending policy that long-term impact on emissions.simply seeks to provide loans to transport A key element that affects costs is the timingprojects for which environmental and transport cydes for capital replacement of equipment thatpolcy implcations are thought to be makes vehides (or components) or, in someacceptable. In other words, the Bank can lmited cases, retrofits possibilities of vehices.assume a reactive posture - do nothing unless Are there local manufacturers who have justtrouble signs arise - or a proactive stance, geared up for vehicle production, or are theywhich rneans acting to create reform, to open just now considering production? If the later,up options that both improve transport system intervention could change what is produced,performance at lower environmental cost and particularly vis-a-vis engines and exhaustabate, restrain, or avoid GHG emissions at the systems. Are local or international companiessame tijme. This is truly the essence of a"vrin - bringing in relatively modem vehiclewin" policy, but it can only be obtained from technologies? Or do old designs for knockdownthe proactive approach. vehicles, or even used vehicles, dominate the
46 Envirormnent Department Papers
Designing a TransportationlCO2 Strategy for the Bank
market? If the latter, timning may actually be Policy framework and the interaction matrixright for persuading car companies to retool for What is the scope of action called for? Overallcleaner, more efficient cars. But if they have just transport reform, GHG measures, or just atooled up for relatively new designs, they wlll minor transport project? Is there room to pushnot be willing to retool yet again, a transport project into a GHG abatement
Equally important for timing is the state of framework in a way that will not be costly to
existing cars and trucks. Are consumers and the (uninterested) client?truckers at a point where their demands for What work is already underway? What policiesvehicles are changing with time and withincomes. In this case it may be difficult to suort tha t work?W tlla pojec otheBan ischange the direction of motorization in the considerig interact with other developments short or long term. Or are there relatively few a way that will icrease or decrease GHG ordrivers, so that significant changes in vehicle transport probems. TheiBudapest urban
taxatio an teholge col star transport project shows marginal returns. Ofparticular worry is the 24 percent decline in
motorization in an entirely new direction? For both usage and capacity between 1987 andfuel use, the only significantvretrofits"of 1993. The real problem is probably burgeoningvehicles were aerodynamic spoilers seen on .o. .. . . .............. 1car ownership and relatively low cost car fuel bylarge trucks and some technologies added to European standards. This is not to say that theaircraft. Otherwise almost all fuel economy Bus Company and the environment wi notimprovement comes from new cars and trucks. benefit from new, clean, more energy efficientThis means that vehicle and fuel taxation buses. But for the project to have a majormeasures have to be phased in carefully except impact on transportation in Budapest, polcieswhere there may be overriding air pollution must also address automobile use, as thisconcerns justifying rapid change. dominates the personal transport scene there.
Similarly, have large cities with urban transport What is the private sector role? In Hungary, asproblems frozen development pattems (most of in other Eastern European countries, privateLatin America and Asia) or are there potentials importing of used cars skyrocketed afterfor significant new development following politcal reform began. These cars tended to bemodels of Curitiba or Singapore? A long-term old and more fuel intensive (but technologicalstrategy of replacement and refinement of more efficient) than the much smaller vehiclespattems of settlement and production, which is produced locally. Now, however, world carwhat most OECD countries face, will yield companies are producing and selling there tooresults only slowly. By contrast, a greenfield and the newer cars, while larger than thedevelopment (perhaps as both households and previously produced local product, are muchbusiness flee from over-congested megacities) cleaner from an air pollution point of view. Incould establish the viability of altemative this sense the private sector might be seen in amodes of access tied to significantly less CO2 negative role, although the new cars emit muchper unit of income than seems to be occurring deaner exhaust than the older ones. But thein the megacities of Latin America and Asia. private sector could assume a moreNeeded here are real data on new towns: are environmentally friendly role. Few realize thattheir transport pattems significantly less for Curitiba, Volvo worked intensively on bothtransport intensive because of co-location of the political side (that is, the policies necessaryplaces to live, to work, to shop, and to play or for success) and also invested in the busesare the transport levels of inhabitants and themselves, particularly those with threeworkers just as high as elsewhere? sections. In other words, when the private sector
Climate Change Series 47
Transportation and CO2 Emissions: Rexing the Lnk -A Path for the World Bank
has a stake in the success of low-CO 2 low pollution policies (such as in Singapore). Where roadtransportation, it becomes a very pro-active partner conditions between cities or even in cities areitself poor, cars are clearly less attractive than other
modes of transport. Where vehicle industriesOne wvay to entice private actors is to use are strong (Korea, Taiwan, Brazil, Mexico) orinnovative procurement, whereby local potentially strong and under developmentauthorities ask for tenders for a particuliar (Indonesia, China), political sentiment tovehicle with certain low-pollution properties. develop these industries for both domesticAnother way is simply to provide a prize for products and exports may be stronger than anydevelopment and marketing of"clean concerns for a balanced program of sustainabletechnologies,"for example two- or three - transport. Finally, economic growth itself cutswheelers, much as US utilities offered two ways. On the one hand Curitiba shows thatsignificant rewards to manufacturers of ia low- a low automobile society can be carved out of aenergy refrigerator, which was eventuallY rapidly growing and prospering region.developed by Whirlpool. This does not meanthat private producers will not respond to Vehicles, fuels, or entire systems? In consideringchanges in economic boundary conditions, only technological investment strategies, it isthat efforts to focus their attention from the important to distinguish between true"nega-beginning are likely to be rewarded both in the carbon"investments (for example, fuelrapidity of response as well as lower costs and substitution towards a lower carbon intensiveultimately popularity of the product. fuel) vs. energy efficiency investments (such as
swapping TDI diesel engines for cars, or addingGeographicalframework. Are the proposed a wind spoiler to a truck to reduce real fuelactions of national or only local significa;nce? costs, and so forth) vs. broader investmentsNational policies (fuel pricing, vehicle taxation, where energy efficiency is a by-product (such asalternative fuels) can be crucial to supporting developing a transit system) vs. really radicallocal initiatives. If local, do the proposed actions redesign (totally new car concepts, like theattack major transport problems in a megacity Daimler Benz Smart car). As noted earlier,or potentially permit smaller conurbations to many of these options have marginal costs thatavoid such problems? While work in Mexico can be estimated. The trouble is that they areCity or Santiago is important to improve the not necessarily options for Bank lending.quality of the air there, modest investments in Nevertheless, the Bank can affect how rapidlyother areas before the pollution situation is they appear on the market if the Bank can affectvirtually irreversible may have greater payoffs fuel or CO2 pricing strategies.by leading to avoidance than investments(beyond basic abatement to clean the air) in the For large-scale investments in vehicle systemsworst affected areas. National authoritie; may (metro, bus systems, aircraft) there are alwayshave to develop a kind of"triage"to decide how choices that have modest impacts on fuelto best use limited resources (both economic intensities) there may be much larger choicesand political) to affect change. affecting the performance, size and overall
impact of the system. As with district heating, itPresent situation. Other basic characteristics of may turn out that some branches or extensionsthe present situation of client countries or of a system simply do not pay because ofregions must be examined. VWhere motorization projected low utilization per unit of fixed oris very high it is unlikely that transit or variable cost invested.14 In any case, theindividual alternatives like two or three possible CO2 reduction from large-scalewheelers can beat back cars without serious transportation system choices is very hard to
48 Environment Department Fapers
Designing a TransportationlCO2 Strategy for the Bank
predict because the new system itself changes require both public and private support in manypattems in so many ways. This is again why countries, such as wide-scale manufacture ofintegrated policies are so important. clean two- or three-wheelers? The Bank would
not want to encourage a public-sector companyTable 6 examines a number of techi4iques/ do to such private sector work, but how to puttechnologies and supporting policies for the private sector into this business? Finally,possible relationships with Bank activity, other what about working with the largest OECD-actors, barriers, and so forth. The various based automobile companies to encourageoptions listed are by no means exclusive, them to produce new kinds of vehiclesalthough there is some overlap. primarily for LDC markets but with
applications in OECD countries? TheseConsider how present Bank activities affect the represent new modes of interaction betweencomponents in Table 6. Urging changes in fuel the World Bank (as a lender), borrowers, andpricing or introduction of road pricing has some authorities. In the final assessment, sucheffect on fuel economy, total travel, modal interaction may be the key step for the Worldchoice, and possibly altemative fuels Bank if its policies are to have any significantdevelopment as price signals indicate real costs impact on GHG emissions from transportationof both using fuels and releasing carbon. But in developing countries.the Bank has no present mode of affectingvehicle fuel intensities directly, and only affects First steps in a cooperative countryair pollution in countries with major Bank- assessmentrelated programs. The impact on freight fuel use The first Bank Energy Sector assessmentsand GHG emissions is weaker because the focused principally on supply-side issues withimportance of fuel pricing to freight activity is only minimal attention paid to the structureless strong, although tough regulations on and efficiency of energy use. Similarly, earlytrucking use could affect the numbers of assessments of carbon emissions focused ontrucking runs and therefore fuel use. Only in emissions by source, with little data on thetransit development does the Bank play a sectors or uses from which carbon emissionsstrong role at present, through financing. But resulted. Most transport assessments focus onhowever important price signals are to quantities that are important for road or transittransport reform, they may not be sufficient to planning (capacity, traffic flows, number ofbring forth both the technological responses passengers, aggregate emissions), but again,that would ease GHG problems (that is, among little on how transport services are actuallyvehicle manufacturers) and to clear up the linked to fuel and emissions.complex maze of existing regulations andconflicting political and economic interests that Box 3 outlines steps that the Bank could take inmay keep many GHG-intensive practices from cooperation with client countries to make achanging. Hence the need for a pro-active more accurate assessment of this link (see alsoinvolvement by the World Bank. Zegras and others 1995 IIEC). They reflect
experiences with exploring the householdAnother issue is that implied by the column sector. Sometimes a simple model suffices. Take"regional scope."Bank activity focuses on for example the"Lisa"model of VTT, Espoo,national or regional projects, such as a railway Finland, prepared for the Finnish Roadconnecting major regions or a transit system Authority. This model covers vehicles and veh.-within a region. What about smaller projects km by vehicle type, fuel, road type and locationwith only local public sector interest, like (such as, rural, urban), CO2, CO, NOx, and SOxbikeways? Or international ventures that would emissions, and so forth. The model can then be
Climate Change Series 49
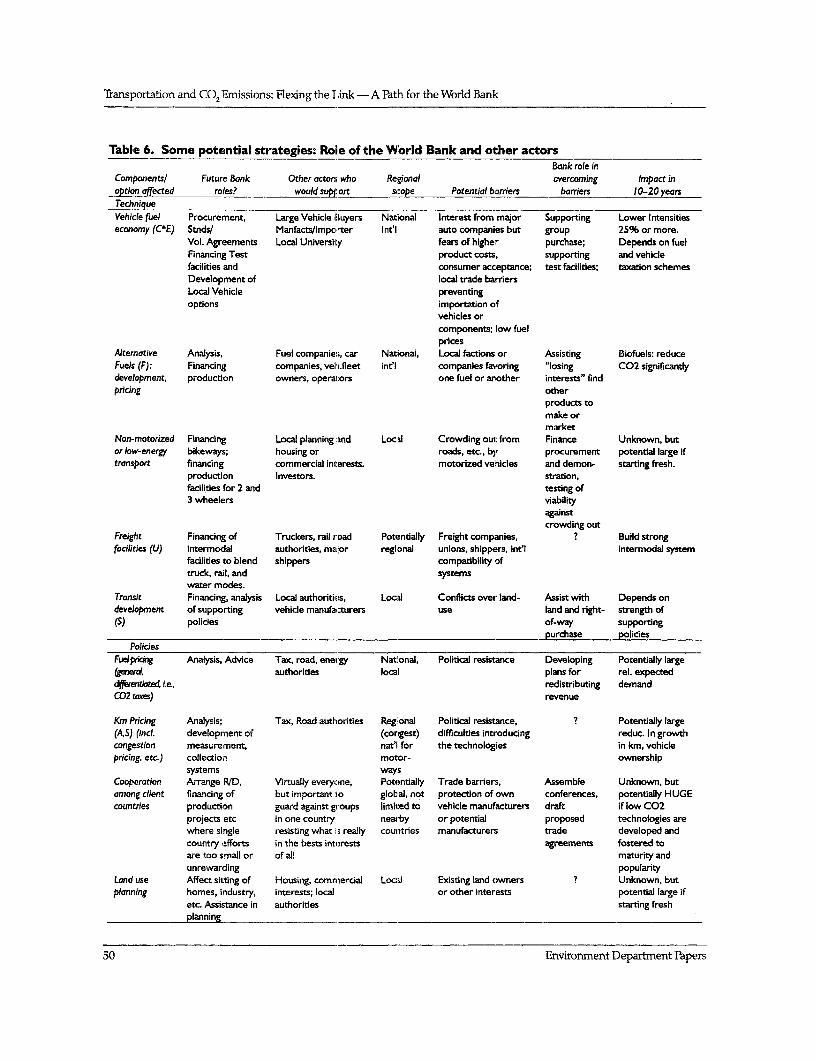
Transportation and CO2 Emissions: Flexing the Link - A Path for the World Bank
Table 6. Some potential strategies: Role of the World Bank and other actorsBank role in
Components/ Future Bank Other actor.s who Regional overcoming Impact inoption affeced roles? would support scope Potential barriers barriers 10-20 yearsTechniqueVehicle fuel Procurement, Large Vehicle BEuyers National Interest from major Supporting Lower Intensitiesecon Dmy (C*E.) Stnds/ Manfacts/lmporter Int'l auto companies but group 25% or more.
Vol. Agreements Local Universilty fears of higher purchase; Depends on fuelFinancing Test product costs, supporting and vehiclefacilities and consumer acceptance; test facilities; taxation schemesDevelopment of local trade barriersLocal Vehicle preventingoptions importation of
vehicles orcomponents; low fuelprices
AJternative Analysis, Fuel companies, car National, Local factions or Assisting Biofuels: reduceFuels (F): Financing companies, velh.fleet int'l, companies favoring "losing C02 significantlydeveiopment, production owners, operators one fuel or another interests" findpricing other
products tomake ormarket
Non-motorized Financing Local planning and Local Crowding out from Finance Unknown, butor lowv-energy bikeways; housing or roads, etc., by procurement potential large iftransport financing commercial interests. motorized vehides and demon. starting fresh.
production Investors. stration,facilities for 2 and testing of3 wheelers viability
againstcrowding out
Freight Financing of Truckers, rail road Potentially Freight companies, ? Build strongfacilities (U) intermodal authorities, major regional unions, shippers, int'l intermodal system
facilities to blend shippers compatibility oftruck, rail, and systemswater modes.
Trans;it Financing, analysis Local authorities, Local Conflicts over land- Assist with Depends ondevelopment of supporting vehicle manufacturers use land and right- strength of(S) policies of-way supporting
purchase policiesFolicies
FudlrWmg Analysis, Advice Tax, road, energy National, Political resistance Developing Potentially largegnerd, authorities local plans for rel. expecteddfferentkted. i.e, redistributing demandC02 axts) revenue
Km Pricing Analysis; Tax, Road authorities Regional Political resistance, ? Potentially large(AS) (ind development of (congest) difficulties introducing reduc. In growthcongestion measurement, nat'l for the technologies in kin, vehiclepricirg. etc.) collection motor- ownership
systems waysCooperation Arrange RID, Virtually everyone, Potentially Trade barriers, Assemble Unknown, butamong client financing of but important to global, not protection of own conferences, potentially HUGEcounmries production guard against groups limited to vehicle manufacturers draft if low C02
projects etc in one country nearby or potential proposed technologies arewhere single resisting what 's really coul tries manufacturers trade developed andcountry efforts in the bests interests agreements fostered toare too small or of all maturity andunrewarding popularity
Land use Affect sitting of Housing, commercial Local Existing land owners ? Unknown, butplanring homes, industry, interests; local or other interests potential large if
etc. Assistance in authorities starting freshplanning
50 Environment Department Papers
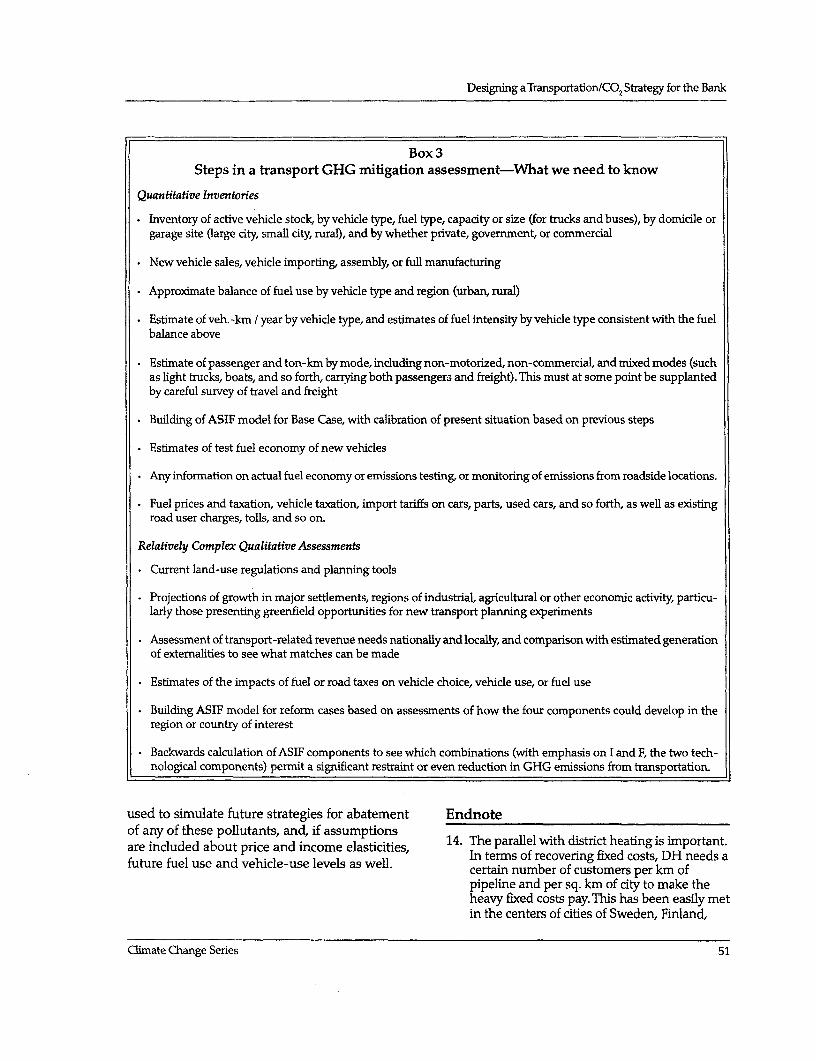
Designing aTransportation/CO2 Strategy for the Bank
Box3Steps in a transport GHG mitigation assessment-What we need to know
Quantitative Inventories
* Inventory of active vehicle stock, by vehicle type, fuel type, capacity or size (for trucks and buses), by domicile orgarage site (large city, small city, rural), and by whether private, government, or commercial
* New vehicle sales, vehicle importing, assembly, or full manufacturing
* Approximate balance of fuel use by vehicle type and region (urban, rural)
* Estimate of veh. -km / year by vehicle type, and estimates of fuel intensity by vehicle type consistent with the fuelbalance above
* Estimate of passenger and ton-km by mode, including non-motorized, non-commercial, and mixed modes (suchas light trucks, boats, and so forth, carrying both passengers and freight). This must at some point be supplantedby careful survey of travel and freight
* Building of ASIF model for Base Case, with calibration of present situation based on previous steps
* Estimates of test fuel economy of new vehicles
* Any information on actual fuel economy or emissions testing, or monitoring of emissions from roadside locations.
. Fuel prices and taxation, vehicle taxation, import tariffs on cars, parts, used cars, and so forth, as well as existingroad user charges, tolls, and so on.
Relatively Complex Qualitative Assessments
* Current land-use regulations and planning tools
. Projections of growth in major settlements, regions of industrial, agricultural or other economic activity, particu-larly those presenting greenfield opportunities for new transport planning experiments
* Assessment of transport-related revenue needs nationally and locally, and comparison with estimated generationof extemalities to see what matches can be made
* Estimates of the impacts of fuel or road taxes on vehicle choice, vehicle use, or fuel use
. Building ASIF model for reform cases based on assessments of how the four components could develop in theregion or country of interest
. Backwards calculation of ASIF components to see which combinations (with emphasis on I and F, the two tech-nological components) permit a significant restraint or even reduction in GHG emissions from transportation.
used to simulate future strategies for abatement Endnoteof any of these pollutants, and, if assumptionsare included about price and income elasticities, 14. The parallel with district heating is important.are i d a tia iIn terms of recovering fixed costs, DH needs afuture fuel use and vehicle-use levels as well. certain number of customers per km of
pipeline and per sq. km of city to make theheavy fixed costs pay. This has been easily metin the centers of cities of Sweden, Finland,
Climate Change Series 51
Transportation and CO2 Emissions: Flexing the Link-A Path for the World Bank
Denmark and much of E. Europe given the off the system which leads to fewer customerscalculations used by authorities, but harder to over which to spread fixed charges whichjustify elsewhere. A relatively high density of leads to more price increases. One fears thecustomers is also important to reduce the same experience in E. Europe today for publicdistribution losses (proportional to distance transport. As fares are raised and service cutheat is sent) relative to sales. And district back to reduce economic losses, many fearheating, like collective transit, faces bleak that more and more users will be driven toprospects when cost-recovery goals lead to their cars, cutting transit system viability evenrising variable charges which force customers more.
52 Environment Department Papers
6 Conclusions
Carbon emissions from transportation are (somewhat less mobility, purchases ofgrowing in all parts of the world, driven by somewhat more fuel efficient vehicles, modalincreased mobility, an increasing share of which switches, and so on) and a longer term reactionis provided by cars, trucks and aircraft. While Oess carbon-intensive vehicles and usethe emissions per unit of output of these modes patterns, possibly different patterns ofare still falling in many countries, the overall settlement.) The uncertainties lie more in termstrends are towards higher emissions. Growth of what is achievable in the near or mediumrates in developing countries are much higher term with only modest carbon taxes and athan in developed countries, both because of business as usual research effort.more rapid economic growth and becauseoverall mobility is so much lower in the Among the key analytical steps that projectdeveloping world. Thus the challenge to restrain planners should consider, the bottom-up ASIFemission in the Third World is formidable. methodology offers many useful benefits. In
addition to tracking present transport andWorld Bank policy can alter these trends, emission patterns into future scenarios, thecertainly by contributing to a slowing of the rate approach permits planners to identifyof growth, and in some cases by contributing to technologies, policies, actors, and Banka radical decline in the growth in emissions. In opportunities that truly affect the developmentsome countries this departure may begin at of each of these components.relative low levels of emissions per capita or perdollar of GNP, as has been demonstrated in Global Overlays can assist Bank planners insome developed countries and in some regions identifying the overall benefits of theseof the developing world as well. The key strategies in terms of carbon not released. Theapproach is to"grow"transportation in a way ASIF methodology fits the Overlays approach,that is less CO2 intensive in developing but the actual tabulation of data andeconomies than is the case in OECD countries. relationships is complex. Still, it is possible toThis growth can take place by promotion of foresee changes in these components,non-motorized modes, clean two- and three- particularly I and F, that would lead to lowerwheel modes, and very efficient cars, trucks and future emissions than otherwise. ASIF is aother vehicles. Supporting such growth from useful way of calculation the reduction inlow levels of emissions today are fuel and road emissions. However, GHG emissions are notuse charges (including carbon taxes) that reflect the only transportation problems at stake. Asocial costs of additional mobility. larger set of avoided costs from other measures
related to transportation reform that alsoIn aiming specifically at GHG emissions, it is restrain GHG emissions comprise a larger goalimportant that the cost of emitting carbon be for Bank planners. The exact proportion of eachraised. There will be a short term reaction benefit depends critically on local situations,
Cimate Change Series 53
Transportation and CO2Emissions: Flexing the [ink -A Path for theWorld Bank
because so many externalities and other and freight patterns seen in the OECD todayproblems of transportation are related to are laid down. From technology procurementlocation and temporal factors. While the CO2 and financing of new approaches to vehiclesproblem is a global one, the problems that (and their local manufacture) or truly lowmotivate local actors are certainly the growing carbon fuels to stronger leadership in the use ofhealth costs of air pollution, safety (including sound policy tools, as well as provision ofdangers to those using non-motorized technical tools (testing facilities, surveys, and sotransport), congestion, and noise. forth) there is an enormous gap to be filled if
developing countries are to restrain theNeve rtheless, the likely small size of the CO2 development of carbon-intensive transportationbenefit relative to other benefits of in a way that increases total welfare and well-infrastructure projects suggests that the Bank being. If the World Bank desires to have a majormust take a proactive role in developing low- impact on GHG emissions from transportation,CO2 transport systems. While intensive efforts it should take a pro-active role in theamong leading industrialized countries may development and deployment of truly lowresult in much lower emissions from vehicles, carbon vehides and fuels as well as policies thatexperience with other equipment suggests that support their success in the marketplace. Suchunless technologies and policies are tailored a strategy, if combined with strong transportnow to fit individual client needs (or regional reforms that restrain the unchecked growth inneeds), the likely wave of low-carbon transport mobility, could lead to significant reductions inmay not arrive in developing countries Until the growth of GHG emissions frommuch of the traditional infrastructure and travel transportation in the developing world.
54 Environment Department Papers
Annex 1
Transportation Activity, Energy Use, andEmissions in IEA Countries-A Brief Review
Transportation energy use in IEA statistics is policies and conditions may vary significantlydivided into four aggregates shaped by data from place to place. Unfortunately, it is veryavailability from fuel supplies: road, rail, water, difficult to separate the fuel used in traveland domestic air modes, as well as a residual within or near cities from that used betweenmode that may represent off-road vehicles, cities. This is unfortunate, since the scope ofspecial vehicles (like cranes), military, or other transportation problems in built-up regions isuses of transportation fuels. For the four main much different than on the open road. As a rulemodes, the analysis focuses on travel and of thumb, however, most rail energy (fuel orfreight separately. electricity) is for intercity travel, while most bus
energy is for urban or suburban travel, intercityCars, buses, and trucks account for 70-85 buses having only one third of the bus travelpercent of fuel used and emissions in most market or less in most IEA countries.countries. In a few IEA countries, vehicle energy Automobiles are principally used for short tripsintensities changed radically (UJnited States and in and around cities simply because mostCanada, for example; see TEA 1997 or Schipper automobiles are garaged in and around citiesand others 1997) or the energy intensity of and most use is in these short trips. In all wetrucking (energy consumed per ton-km hauled) estimate that in TEA countries, at most 20-30fell significantly (W. Germany, Norway, the percent of automobile fuel is for intercity traffic.United States in recent years). Where such By contrast, the majority of truck fuel is forchanges occurred, emissions showed some intercity trucking or uses on the periphery ofrestraint relative to vehicle activity or mobility. cities although as much as one third could beIn all countries, the fuel intensity of domestic used for distribution itself.airline travel fell 45-55 percent from 1973 to1993, but air travel is still only a small part of Vehicle ownership and use trendsthe emissions picture for most countries.Consequently, emissions tracked the output of Automobile ownership in IEA countries (figurebasic transportation services, passenger and A.1) has risen with income or GDP per capita,ton-km, which in turn tracked GDP. The although it is showing some saturation in thecoupling between each respective service and most motorized countries. Distance traveled perGDP, or the relative importance of one or the vehicle (vehicle-km, or v-km) is rising onlyother service, varies significantly among slowly (and tends to fall as vehicle ownershipcountries, but within a country there were few increases), but distance traveled per capita on alldeviations. This explains why the curves in modes (figure A2) is rising more rapidly becausefigure 1 in the text appear so rigid for so many of increasing car ownership. Because the numbercountries. of people per car has fallen, travel in cars (in
passenger-km) has not risen as fast as totalRegional distribution within a country of traffic vehicle-km. This means that energy use and CO2and fuel use is important because transport emissions rise faster than travel, all else equal.
Climate Change Series 55
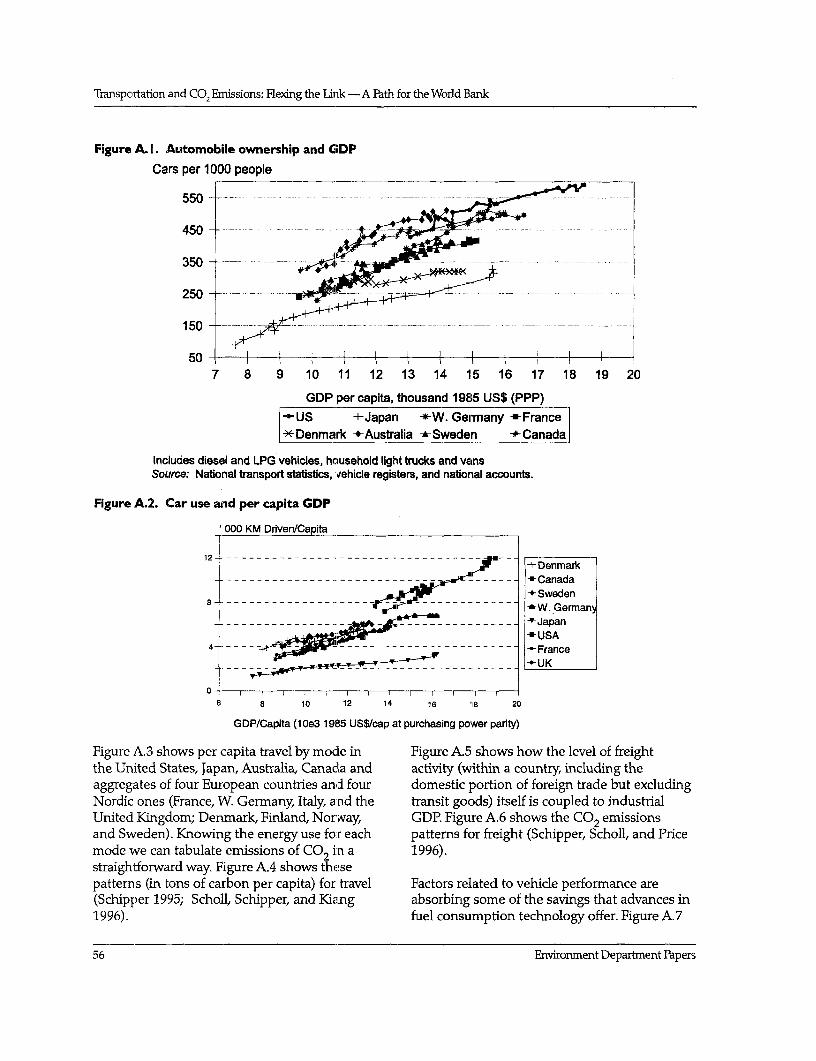
Transpcrtation and CO2 Emissions: Flexing the Lik -A Path for the World Bank
Figure A. I. Automobile ownership and GDP
Cars per 1000 people
550 __
450
350 --- - -- ---- - - - -- -
250-_._.
150 - _
50-7 8 9 10 11 12 13 14 15 16 17 18 19 20
GDP per capita, thousand 1985 US$ (PPP)
|u --US +Japan -*-W. Germany -France*?Denmark +Australia -*-Sweden -- Canada
Includes diesel and LPG vehicles, hcusehold light trucks and vansSource: National transport statistics, vehicle registers, and national accounts.
Figure A.2. Car use and per capita GDP
'000 KM Drven/Capita
12 - - - - - - - - - - - - - - - - - - - - - - - - - - - - - - - - - - -- _Denmark
---- --- ---- ------- -- -Canada+ Sweden
8-*~~~~~~~~~~~~-W. German~_- - - - -- - - -- - - - - --- _- - - - - -_-_ -- - Japan
- USA4-- _____ -- _---------------------- - France
-UK
0 - I I l l I I I
6 8 10 12 14 16 18 20
GDP/Capita (1 Oe3 1985 US$tcap at purchasing power parity)
Figure .A.3 shows per capita travel by mocde in Figure A.5 shows how the level of freightthe United States, Japan, Australia, Canada and activity (within a country, including theaggregates of four European countries and four domestic portion of foreign trade but excludingNordic ones I(France, W. Germany, Italy, and the transit goods) itself is coupled to industrialUnited Kingdom; Denmark, Finland, Norway, GDP. Figure A.6 shows the CO2 emissionsand Sweden). Knowing the energy use for each pattems for freight (Schipper, Scholl, and Pricemode we can tabulate emissions of CO2 in a 1996).straightforward way. Figure A.4 shows thesepatterns (in tons of carbon per capita) for travel Factors relatedL to vehide performance are(Schipper 1995; Scholl, Schipper, and Kiang absorbing some of the savings that advances in1996). fuel consumption technology offer. Figure A.7
56 Envirorunent Departnent Papers
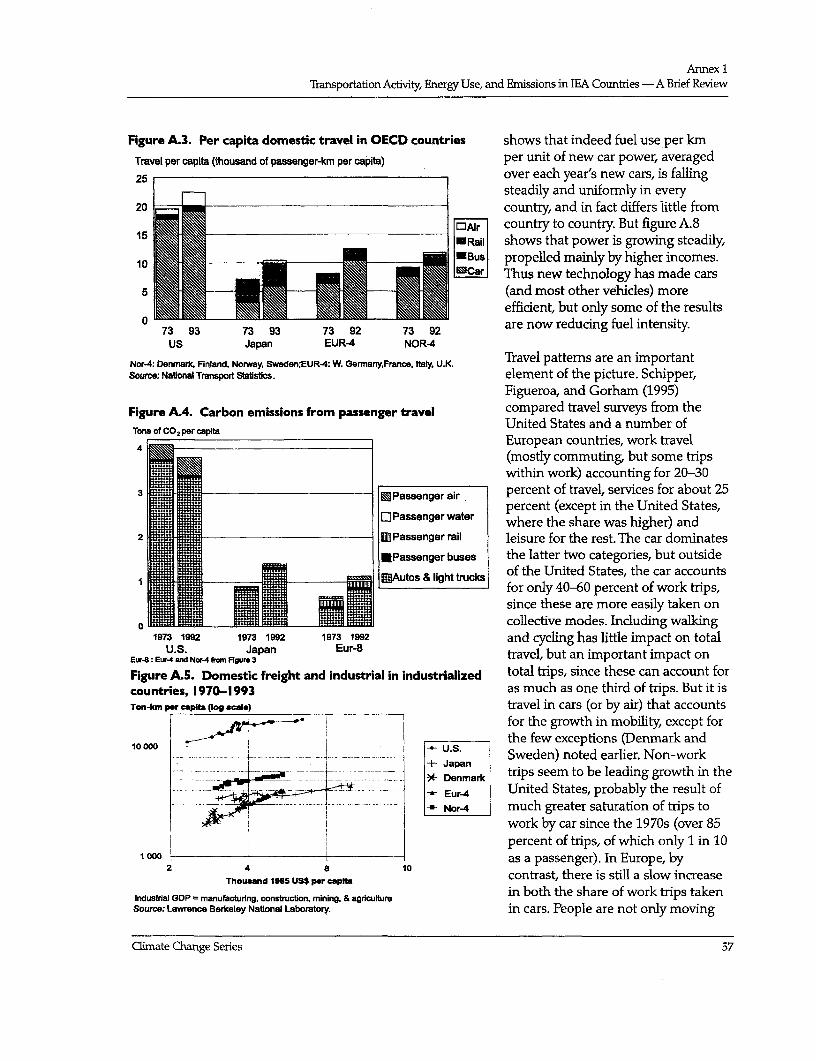
Annex 1lTansportation Activity, Energy Use, and Emissions in IEA Countries -A Brief Review
Figure A.3. Per capita domestic travel in OECD countries shows that indeed fuel use per kmTravel per capita (thousand of passenger-km per capita) per unit of new car power, averaged25 over each year's new cars, is falling
steadily and uniformly in every20 - country, and in fact differs little from
15 l country to country. But figure A.8*RailI shows that power is growing steadily,
10 r= l - Bus propelled mainly by higher incomes.imi _~2~!J 1 - XThus new technology has made cars5 (and most other vehidles) more
efficient, but ondly some of the results
0 73 93 73 93 73 92 73 92 are now reducing fuel intensity.US Japan EUR-4 NOR-4
Nor-4: Denmnark, Finjand, Nonway, Sweden;EUR-4: W. Germany,France, ItEky, U.K. Travel pattems are an importantSource: Naffonal Transport Stastfcs. element of the picture. Schipper,
Figueroa, and Gorham (1995)
Figure A.4. Carbon emissions from passenger travel compared travel surveys from theTons of CO2 per capka United States and a number of4 European countries, work travel
(mostly commutin& but some tripswithin work) accounting for 20-30
3 M 5t [|Passenger air percent of travel, services for about 25111Passengerwater percent (except in the United States,1 Passenger water |where the share was higher) and
2 i mPassenger rail leisure for the rest. The car dominates
EPassenger buses the latter two categories, but outside
I emo w1 | |Autos & light trucks of the United States, the car accountsfor only 40-60 percent of work trips,since these are more easily taken on
0 1 IfflS 1 1 1 collective modes. Including walking1973 1992 1973 1992 1973 1992 and cycling has little impact on total
Eur-:Eu.S JaNorp4nmFiure Eur-8 travel, but an important impact onFigure A.5. Domestic freight and industrial in industrialized total trips, since these can account forcountries, 1970-1993 as much as one third of trips. But it isToan-km r capita (log scale) travel in cars (or by air) that accounts
for the growth in mobility, except forthe few exceptions (Denmark and
----------- i ± Japan i Sweden) noted earlier. Non-work-- ------ ---- --- ! -+_|- -enm trips seem to be leading growth in the- - - - ----- --- --- -- SDenmark
Eur-4 United States, probably the result of--- _-----1------- - -I- Nor-4 much greater saturation of trips to
work by car since the 1970s (over 85I I , | percent of trips, of which only 1 in 10
I ow 8 toas a passenger). In Europe, by2 4 8 10
Thousand 19s8 Us$ per ca contrast, there is still a slow increaseIndustrial GDP manufacturing, construction, mining, & agriculture in both the share of work trips takenSource: Lawrence Berkeley National Laboratory. in cars. People are not only moving
Climate Change Series 57
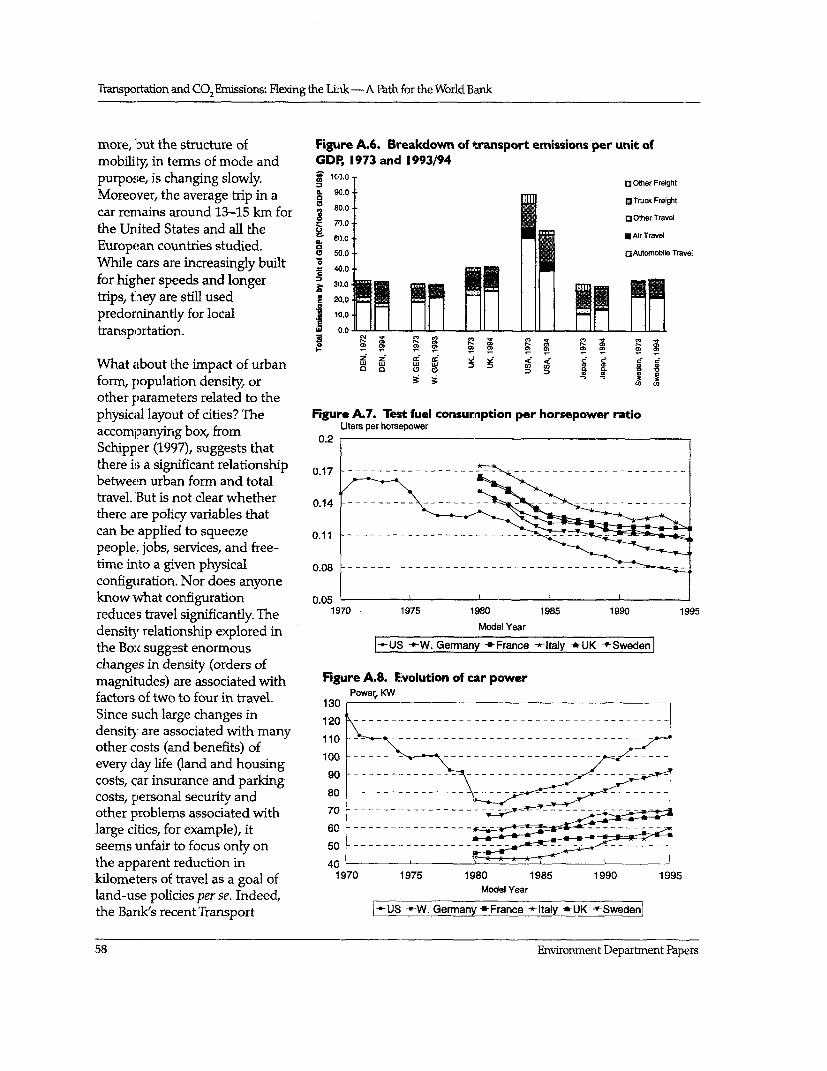
Transportation and CO2Emissions: Flexing the Lik - A Path for the World Bank
more, lbut the structure of Figure A.6. Breakdown of transport emissions per unit ofmobility, in terms of mode and GDIF 1973 and 1993/94purpose, is changing slowly. 1 -° OOther Freight
Moreover, the average trip in a 9' 0 aTruck Freight
car remains around 13-15 km for X Other Travel
the United States and all the E 70.0 - 0 Travel
European countries studied. °0 50.0 11 Automobile Travel
While cars are increasingly built o0Qic
for higher speeds and longertrips, they are still used "'2lopredoninantly for local Eln.0
transportation. l
I-. - - b - a- - v - -
What about the impact of urban c', '
form, population density, or C 3
other parameters related to thephysical layout of cities? The Figure A.7. Test fuel consumption per horsepower ratioaccompanying box, from Uiters per horsepower
Schipper (1997), suggests that 0.2
there is a significant relationship 0.17 ------------------ - - - - - - - - - - - - - -
between urban form and totaltravel.But is not clear whether 0.14---there are policy variables thatcan be applied to squeeze 0.11 --people., jobs, services, and free-time into a given physical 0.08 _----------------------------
configuration. Nor does anyoneknow what configuration 0.05 reduces travel significantly. The 1S70 1975 1980 1985 1990 1995
density relationship explored in Model Year
the Box suggest enormous -|us W._Germany -France -Italy -UK -Swedenchanges in density (orders ofmagnitudes) are associated with Figure A.8. Evolution of car powerfactors of two to four in travel. 130 Power, KW
Since such large changes in 120 ' -density are associated with many 1 -c --
other costs (and benefits) of every day life (and and housing 100 ----------- ,costs, car insurance and parking \ costs, personal security andother problems associated with 70 - -large cities, for example), it 6C0 ---1--------
seems uLnfair to focus only on 50 ------------------the apparent reduction in 4C0 ,
kilome ters of travel as a goal of 1 970 1975 1980 1985 1990 1995
land-use policies per se. Indeed, Model Yearthe Bank's recent Transport [--US -W. Germany -France -Italy -UK - Sweden|
58 Environment Department Papers
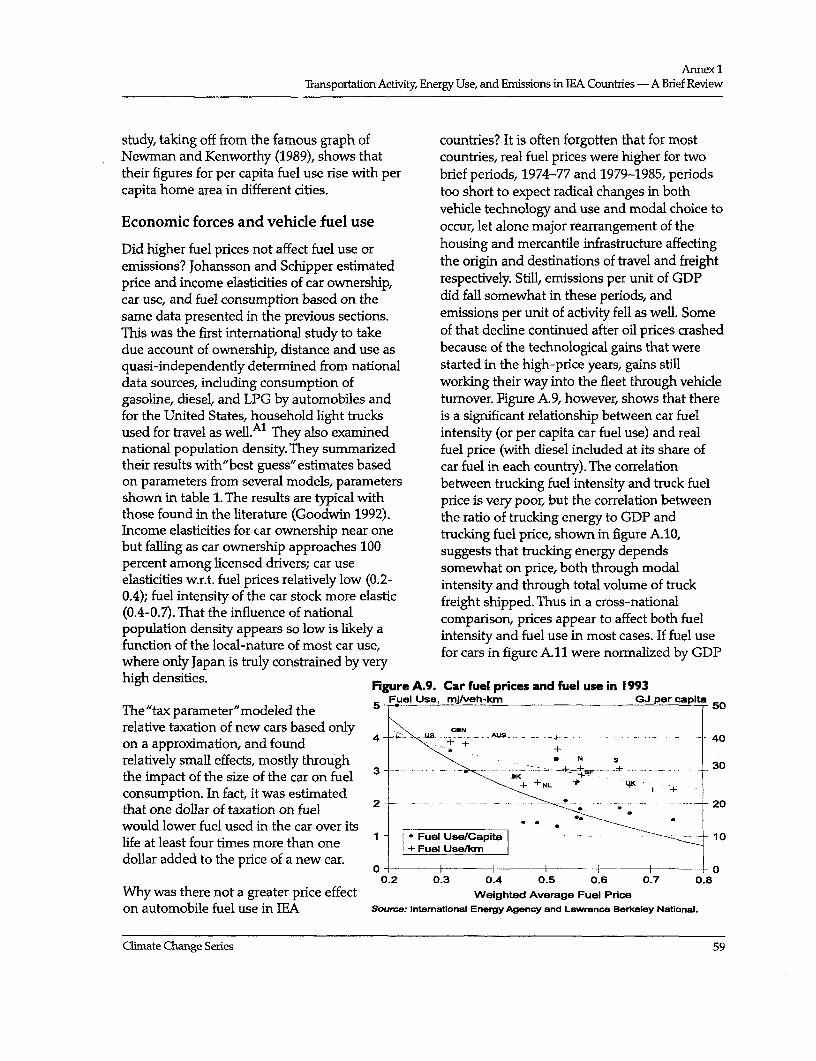
Annex 1Transportation Activity, Energy Use, and Emissions in IEA Countries -A Brief Review
study, taking off from the famous graph of countries? It is often forgotten that for mostNewman and Kenworthy (1989), shows that countries, real fuel prices were higher for twotheir figures for per capita fuel use rise with per brief periods, 1974-77 and 1979-1985, periodscapita home area in different cities. too short to expect radical changes in both
vehicle technology and use and modal choice toEconomic forces and vehicle fuel use occur, let alone major rearrangement of the
Did higher fuel prices not affect fuel use or housing and mercantile infrastructure affectingemissions? Johansson and Schipper estimated the origin and destinations of travel and freightprice and income elasticities of car ownership, respectively. Still, emissions per unit of GDPcar use, and fuel consumption based on the did fall somewhat in these periods, andsame data presented in the previous sections. emissions per unit of activity fell as well. SomeThis was the first international study to take of that decline continued after oil prices crasheddue account of ownership, distance and use as because of the technological gains that werequasi-independently determined from national started in the high-price years, gains stilldata sources, including consumption of working their way into the fleet through vehiclegasoline, diesel, and LPG by automobiles and tumover. Figure A.9, however, shows that therefor the United States, household light trucks is a significant relationship between car fuelused for travel as well.Al They also examined intensity (or per capita car fuel use) and realnational population density. They summarized fuel price (with diesel included at its share oftheir results with"best guess"estimates based car fuel in each country). The correlationon parameters from several models, parameters between trucking fuel intensity and truck fuelshown in table 1. The results are typical with price is very poor, but the correlation betweenthose found in the literature (Goodwin 1992). the ratio of trucking energy to GDP andIncome elasticities for car ownership near one trucking fuel price, shown in figure A.10,but falling as car ownership approaches 100 suggests that trucking energy dependspercent among licensed drivers; car use somewhat on price, both through modalelasticities w.r.t. fuel prices relatively low (0.2- intensity and through total volume of truck0.4); fuel intensity of the car stock more elastic freight shipped. Thus in a cross-national(0.4-0.7). That the influence of national comparison, prices appear to affect both fuelpopulation density appears so low is likely a intensity and fuel use in most cases. If fuel usefunction of the local-nature of most car use, for cars in figure All were normalzed by GDPwhere only Japan is truly constrained by veryhigh densities. Figure A.9. Car fuel prices and fuel use in 1993
TeFuel Use, mjlveh-km GJ per capitaThe"tax parameter" modeled the 5~* '-5
relative taxation of new cars based only \CON A
on a approximation, and found 4 +- s. -
relatively small effects, mostly through . N S
the impact of the size of the car on fuel O K + ,+30
consumption. In fact, it was estimated 2 +that one dollar of taxation on fuel 2 - 20
would lower fuel used in the car over itsI 1 Fuel Use/Capia----. 1
life at least four times more than one 1+ Fuel Use/0
dollar added to the price of a new car.0- I l I
0.2 0.3 0.4 0.5 0.6 0.7 0.8Why was there not a greater price effect Weighted Average Fuel Price
on automobile fuel use in IEA Source. Intemational Energy Agency and Lawrence Berkeley National.
Climate Change Series 59
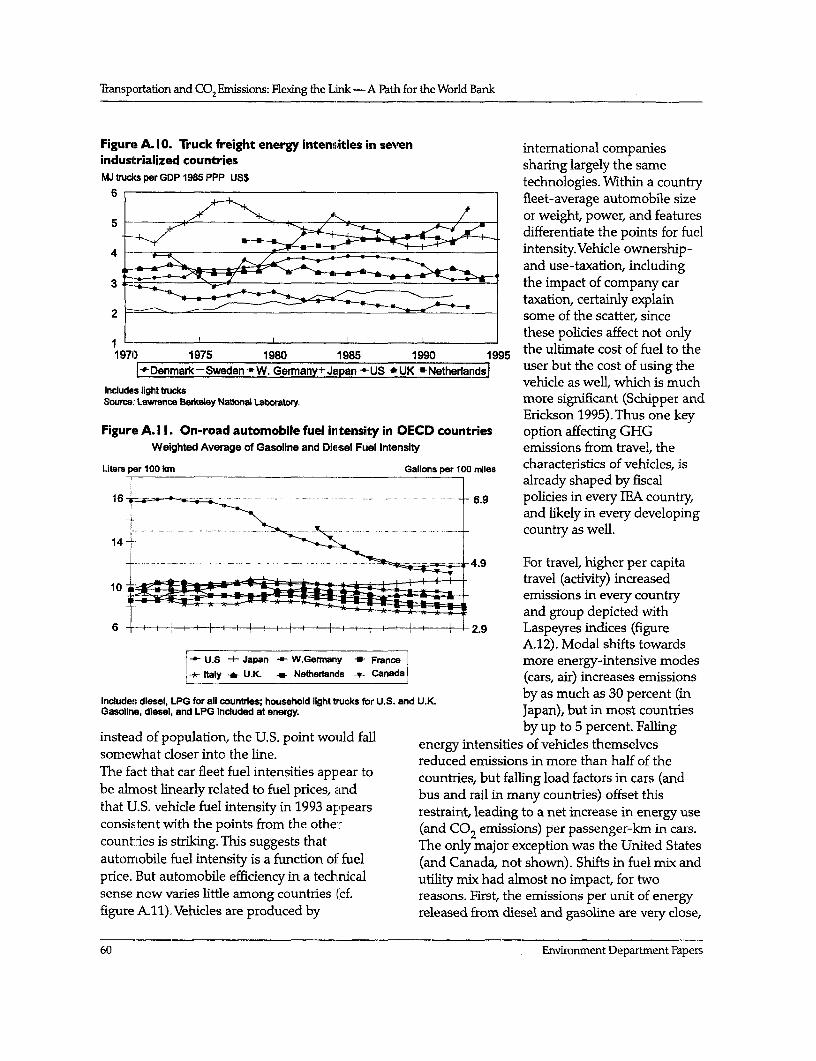
Transportation and CO2 Emissions: Flexing the Lnk -A Path for the World Bank
Figure A. 10. Truck freight energy intens,ities in seven international companiesindusitrialized countries sharing largely the sameMJ trudcs per GDP 1985 PPP US$ technologies. Within a country
6 fleet-average automobile size
5 _ Z XI s. /+ or weight, power, and features_ / _^ C differentiate the points for fuel4 intensity.Vehicle ownership-
4. < 4;-~-*and use-taxation, including3 the impact of company car
taxation, certainly explain2 _ some of the scatter, since
these policies affect not only
19710 1975 1980 1985 1990 1 5 the ultimate cost of fuel to the|-Denmark-Sweden -W. German Japan -- US -UK - Netherlands user but the cost of using the
Includes light trucks ~~~~~~~vehicle as well, which is muchIncludes light trucdesSounre: Lawrence Berkeley Nafol Labortory. more significant (Schipper and
Erickson 1995). Thus one keyFigure A. I 1. On-road automobile fuel intensity in OECD countries option affecting GHG
Weighted Average of Gasoline and Diesel Fuel Intensity emissions from travel, the
Liters par 100 km Gallons per 100 miles characteristics of vehicles, is. already shaped by fiscal
16 i . . 6.9 policies in every IEA country,and likely in every developing
.-- .- . . . -- 'K -. . .. ..... country as well.14 -
- . ....... _ ~ w =g=r 4.9 For travel, higher per capita
10 1 l - travel (activity) increased-E: - -ii~i-- -: ~ II JL ~ emissions in every country
and group depicted with6 4 | i I I I I I I -2.9 Laspeyres indices (figure
A.12). Modal shifts towards| U.S -Japan W.Germany -France more energy-intensive modes
lXtaly *~ U.K. _~ Netherlandis -F Canada (cars, air) increases emissions
Includes diesel, LPG for all countries; household light trucks for U.S. and U.K. by as much as 30 percent (inGasolins, diesel, and LPG Induded at energy. Japan), but in most countries
instead of population, the U.S. point would fall intensitieby up to 5 percent. Fallinginsomevhat losr p biton the U.S. pointwouldfall energy intensities of vehicles themselvessomewvhat closer into the line, reduced emissions in more than half of theThe faict that car fleet fuel intensities appear to countries, but falling load factors in cars (andbe almost linearly related to fuel prices, and bus and rail in many countries) offset thisthat U.S. vehicle fuel intensity in 1993 appears restraint, leading to a net increase in energy useconsistent with the points from the other (and CO2 emissions) per passenger-km in cars.countries is striking. This suggests that The only major exception was the United Statesautomobile fuel intensity is a function of fuel (and Canada, not shown). Shifts in fuel mix andprice. But automobile efficiency in a technical utility mix had almost no impact, for twosense now varies little among countries (cf. reasons. First, the emissions per unit of energyfigure A.11).Vehicles are produced by released from diesel and gasoline are very close,
60 Envirorunent Department Papers
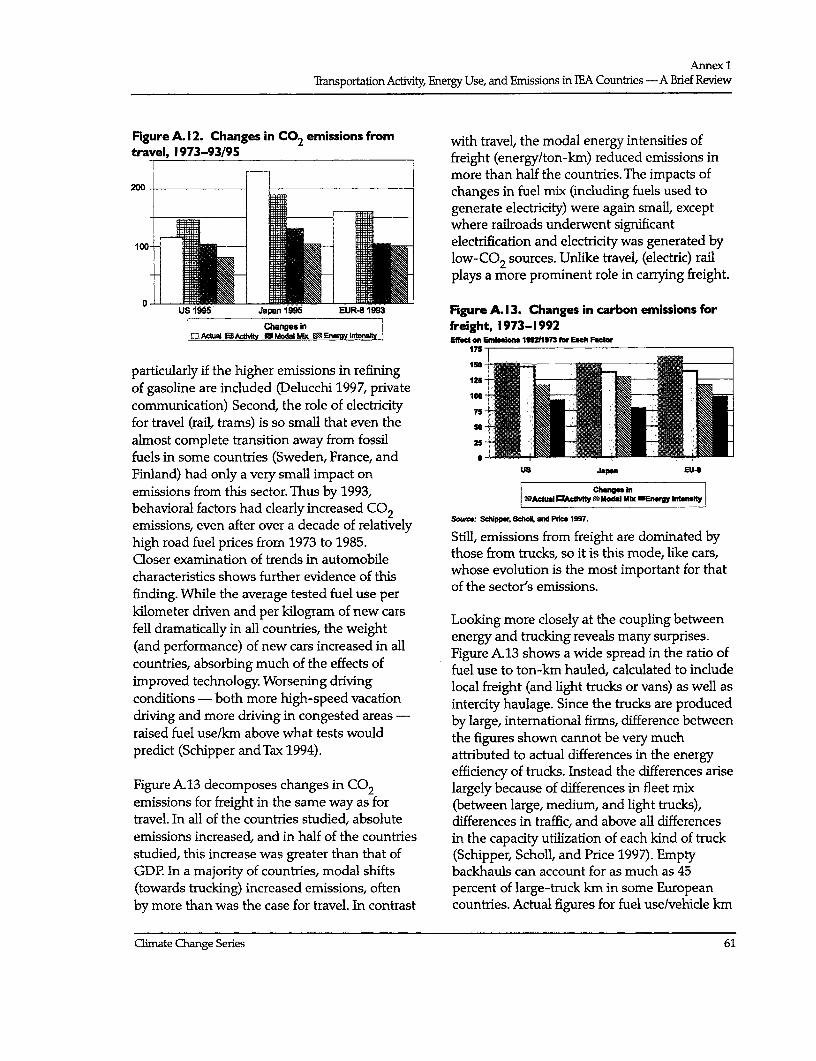
Annex 1Transportation Activity, Energy Use, and Emnissions in IEA Countries -A Brief Review
Figure A. 12. Changes in CO2 emissions from with travel, the modal energy intensities oftravel, 1973-93/95 freight (energy/ton-km) reduced emissions in
more than half the countries. The impacts of200 - changes in fuel mix (including fuels used to
generate electricity) were again small, exceptwhere railroads underwent significant
100- _ 11 | 1 [ electrification and electricity was generated bylow-CO2 sources. Unlike travel, (electric) rail
o - E | L | E plays a more prominent role in carrying freight.
US 1995 Japan 1995 EUR-8 1993 Figure A. 13. Changes in carbon emissions forChangesin freight, 1973-1992
DACt EuAL b *1ModMOalMIX I E e-tonEnmias1SmS2onrEachFFator
175
particularly if the higher emissions in refining ISOof gasoline are included (Delucchi 1997, private Incommunication) Second, the role of electricity 75__
for travel (rail, trams) is so small that even the so almost complete transition away from fossil 25 -fuels in some countries (Sweden, France, and e _Finland) had only a very small impact on us Ja E
emissions from this sector. Thus by 1993, Chang Inbehavioral factors had dearly increased CO9emissions, even after over a decade of relatively Still, enhission Sdfomfeatr Pedom 197.e
high road fuel prices from 1973 to 1985. Sthll, emissions from freight are dominated byCloser examination of trends in automobile those from trucks, soit is this mode, like cars,characteristics shows further evidence of this whose evoluton is the most important for thatfinding. While the average tested fuel use perkilometer driven and per kilogram of new cars Looking more cosely at the couplng betweenfell dramatically in all countries, the weight energy and trucking reveals many surprises.(and performance) of new cars increased in all Figure A13 shows a wide spread in the ratio ofcountries, absorbing much of the effects of fuel use to ton-km hauled, calculated to indudeimproved technology. Worsening driving local freight (and light trucks or vans) as well asconditions - both more high-speed vacation intercity haulage. Since the trucks are produceddriving and more driving in congested areas- by large, international firms, difference betweenraised fuel use/km above what tests would the figures shown cannot be very muchpredict (Schipper and Tax 1994). attributed to actual differences in the energy
efficiency of trucks. Instead the differences ariseFigure A.13 decomposes changes in CO2 largely because of differences in fleet mixemissions for freight in the same way as for (between large, medium, and light trucks),travel. In all of the countries studied, absolute differences in traffic, and above all differencesemissions increased, and in half of the countries in the capacity utilization of each kind of truckstudied, this increase was greater than that of (Schipper, Scholl, and Price 1997). EmptyGDP. In a majority of countries, modal shifts backhauls can account for as much as 45(towards trucking) increased emissions, often percent of large-truck km in some Europeanby more than was the case for travel. In contrast countries. Actual figures for fuel use/vehide km
Climate Change Series 61
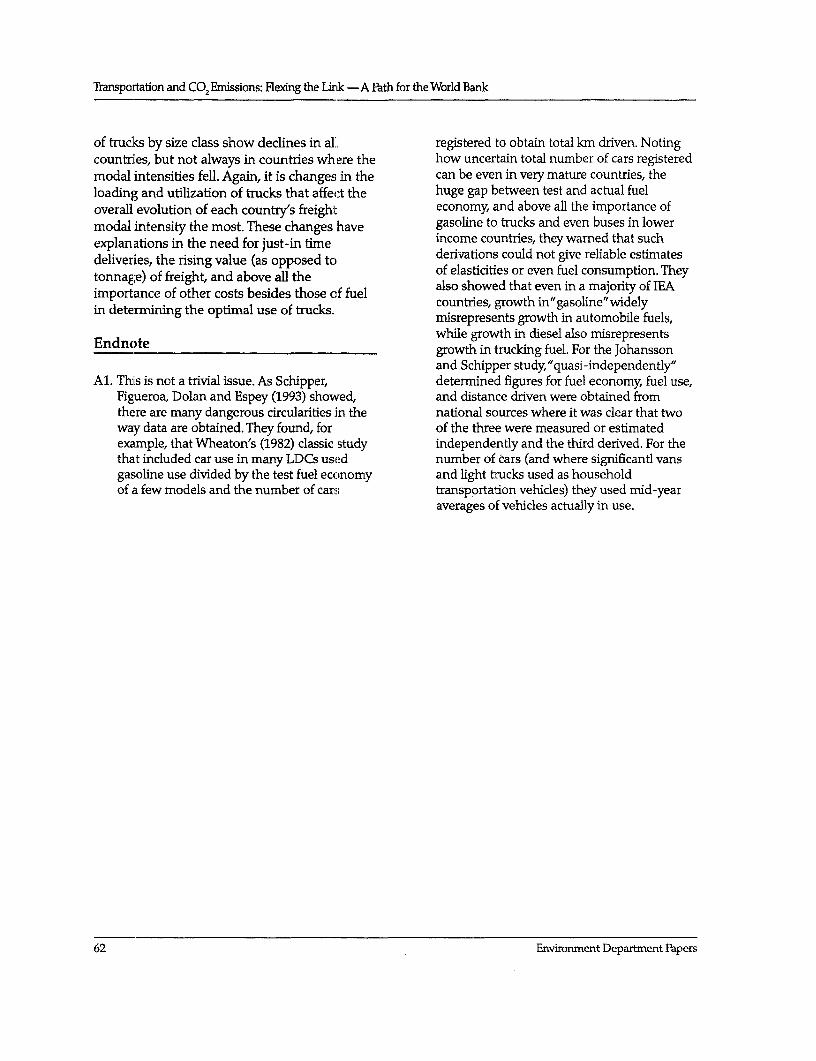
Transportation and CO2 Emissions: Flexing the Lirk-A Path for the World Bank
of trucks by size class show declines in aLl registered to obtain total km driven. Notingcountries, but not always in countries where the how uncertain total number of cars registeredmodal intensities fell. Again, it is changes in the can be even in very mature countries, theloading and utilization of trucks that affect the huge gap between test and actual fueloverall evolution of each country's freight economy, and above all the importance ofmodal intensity the most. These changes have gasoline to trucks and even buses in lowerexplanations in the need for just-in time income countries, they wamed that suchdeliveries, the rising value (as opposed to derivations could not give reliable estimatestonnage) of freight, and above all the of elasticities or even fuel consumption. Theyimportance of other costs besides those of fuel also showed that even in a majority of IEAin determining the optimal use of trucks countries, growth in"gasoline"widely
ideemnnthopmausf * misrepresents growth in automobile fuels,
Endnote while growth in diesel also misrepresentsEndnot ._ growth in trucking fuel. For the Johansson
and Schipper study,'quasi-independently"Al. This is not a trivial issue. As Schipper, determined figures for fuel economy, fuel use,
Figueroa, Dolan and Espey (1993) showed, and distance driven were obtained fromthere are many dangerous circularities in the national sources where it was clear that twoway data are obtained. They found, for of the three were measured or estimatedexample, that Wheaton's (1982) classic study independently and the third derived. For thethat included car use in many LDCs used number of tars (and where significantl vansgasoline use divided by the test fuel economy and light trucks used as householdof a few models and the number of cars transportation vehicles) they used mid-year
averages of vehicles actually in use.
62 Envirormnent Department Fapers
Annex 2
Technologies -Vehicles and Fuels: ThePotential Is There, but What Does It Cost?
Best Technologies: Vehicles. These are hard to vehicles themselves have so many technical,define without an objective function. Cars that environmental, and market requirements.run on solar cells have been crossing Australiaand the United States in competitions for years. More difficult, marginal technology costs forDo these define"best practices?" Very efficient vehicles are hard to pin down in order todiesel engines using direct injection of fuel (so calculate cost-benefit ratios, even assumingcalled "TDI") are now very popular in Europe, near-ideal pricing of externalities. The reason isand reduce fuel use compared to ordinary that it is difficult to pin point the"marginaldiesels of the same power by as much as 30 technology"and its impacts. For example, thepercent, although there are problems with NOx U.S. National Academy of Sciences found thatemissions. Chrysler is developing a gasoline- new U.S. cars could average about 34 MPG (71/run fuel cell system (based on an on-board 100 km) in the early 1990s in a"cost effective"reformer, more recently announced by Arthur way. A study by Ross and Decicco suggestedD. Little), while Daimler Benz is probing other over 40 MPG (6 1/100km), while a studyapproaches to fuel cells, buying a fuel cell commissioned by the auto industry pointedcompany and announcing plans to build a fuel- towards 31 MPG (7.75 1/100 km). Who wascell Mercedes. Ford Motor Co. has since bought right? Each considered packages of individualinto the same fuel-cell manufacturer, Ballard options. And the endless arguments over theSystems. Neither device has on-board welfare costs of achieving the U.S. new testcombustion and so there are no thermal losses average of 28 MPG (8.2 1/100 km) throughassociated with these systems. Others advocate imposition of CAFE standards revolve verybattery-based electric drive (the GM EV-1), much over measuring the"costs"of reducingcombined combustion/electric hybrids (Toyota, fuel consumption, reductions in weight andNissan, for example). Mitsubushi, Honda, and power (much of which was won back in theNissan also place a great deal of hope on direct longer term), and sacrifices of consumerinjection gasoline engines that would reduce surplus. "Costs"of new metro and rail systems,fuel use to nearly parity with diesels for the new highways are always uncertain, but thesame (or better) performance. Which are best cloudiness of the incremental costs of savingdepends both on the full costs to the users as energy in automobiles remain a source ofwell as the balance of externalities. If a Honda controversy. Thus the cost of reducing GHGLean bum gasoline engine reduces CO2 emissions from changing vehicles is hard toemissions/km 25 percent over those of a similar estimate. The same is true for infrastructureHonda without the engine in question, but developments. And estimating both real costsNOx emissions are higher, is the lean bum of changing how vehicles are designed and"better?" And what if the NO. is eliminated produced, as well as what they will ultimatelybut the performance is not as good? In other cost in the marketplace priced so consumerswords, it is very difficult to define"best"for will buy them, remains the largest economicmost kinds of vehicle technologies because the cloud over the promise of technology.
Climate Change Series 63
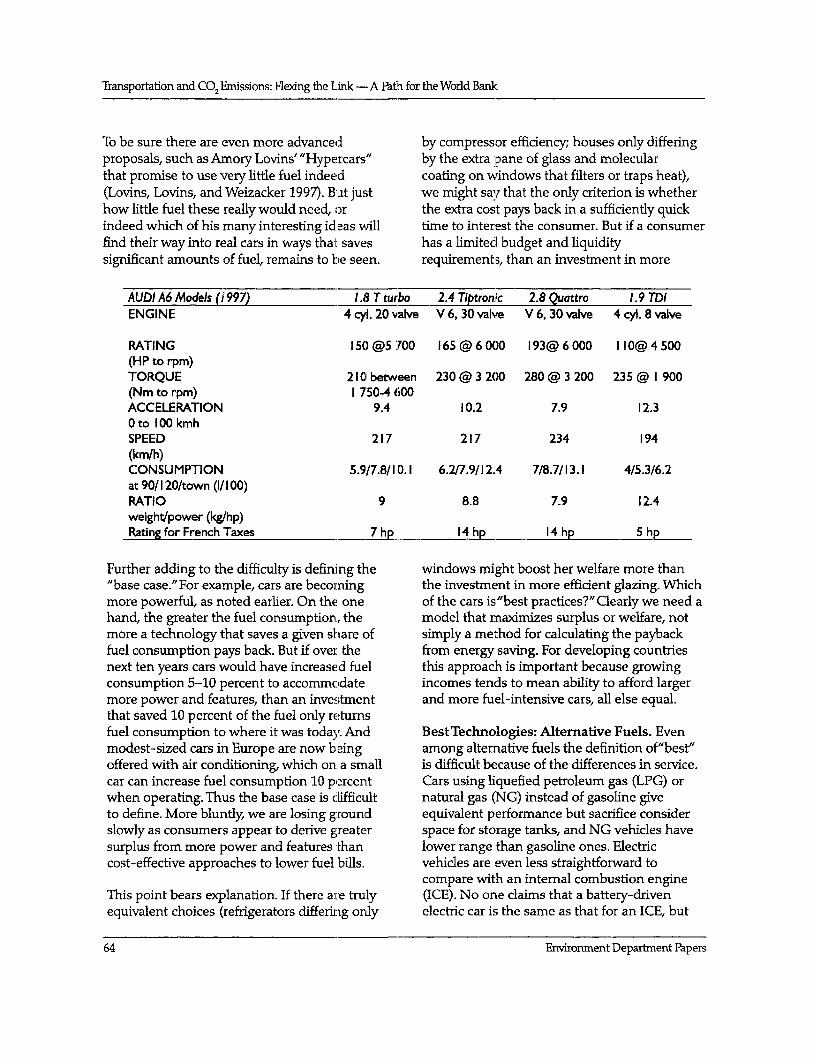
Transportation and CO2 Emissions: Flexing the Link -A Path for the World Bank
To be sure there are even more advanced by compressor efficiency; houses only differingproposals, such as Amory Lovins' "Hypercars" by the extra pane of glass and molecularthat promise to use very little fuel indeed coating on windows that filters or traps heat),(Lovins, Lovins, and Weizacker 1997). But just we might say that the only criterion is whetherhow little fuel these really would need, or the extra cost pays back in a sufficiently quickindeed which of his many interesting ideas wilL time to interest the consumer. But if a consumerfind their way into real cars in ways thalt saves has a limited budget and liquiditysignificant amounts of fuel, remains to be seen. requirements, than an investment in more
AUDI A6 Models (1997) 1.8 T turbo 2.4 Tiptronkc 2.8 Quattro 1.9 TDIENGINE 4 cyl. 20valve V6,30valve V 6, 30 valve 4 cyl.8 valve
PATING 150 @5 700 165 @ 6 000 193@ 6 000 I10@ 4 500(IHP to rpm)T-ORQUE 210 between 230 @ 3 200 280 @ 3 200 235 @ 1 900(INm to rpm) 1 750-4 600ACCELERATION 9.4 10.2 7.9 12.3a to 100 kmhSPEED 217 217 234 194(lKm/h)C:ONSUMPTION 5.9/7.8/10.1 6.2/7.9/12.4 7/8.7/13.1 4/5.3/6.2at 90/120/town (1/ 100)FATIO 9 8.8 7.9 12.4weight/power (kg/hp)RAting for French Taxes 7hp 14 hp 14 hp 5 hp
Furthier adding to the difficulty is defining the windows might boost her welfare more than"base case."For example, cars are becomrning the investment in more efficient glazing. Whichmore powerful, as noted earlier. On the one of the cars is"best practices?" Clearly we need ahancl, the greater the fuel consumption, the model that maximizes surplus or welfare, notmore a technology that saves a given share of simply a method for calculating the paybackfuel consumption pays back. But if over the from energy saving. For developing countriesnext ten years cars would have increased fuel this approach is important because growingconsumption 5-10 percent to accommodate incomes tends to mean ability to afford largermore power and features, than an investment and more fuel-intensive cars, all else equal.that saved 10 percent of the fuel only returnsfuel consumption to where it was todaly. And Best Technologies: Alternative Fuels. Evenmodest-sized cars in Europe are now being among alternative fuels the definition of"best"offered with air conditioning, which on a small is difficult because of the differences in service.car can increase fuel consumption 10 percent Cars using liquefied petroleum gas (LPG) orwhen operating. Thus the base case is dLifficult natural gas (NG) instead of gasoline giveto define. More bluntly, we are losing g-round equivalent performance but sacrifice considerslowly as consumers appear to derive greater space for storage tanks, and NG vehides havesurplus from more power and features than lower range than gasoline ones. Electriccost-effective approaches to lower fuel bills. vehicles are even less straightforward to
compare with an internal combustion engineThis point bears explanation. If there are truly (ICE). No one daims that a battery-drivenequi valent choices (refrigerators differing only electric car is the same as that for an ICE, but
64 Environment Department Papers
Annex 2Technologies -Vehicles and Fuels: The Potential Is There, but What Does It Cost?
the best electric cars perforrn as well as small or alternative fuel is truly low in carbon, that is,modest ICE except for range between charges. true biomass, or hydrogen produced from solar,The greenhouse characteristics of electric renewables, or nuclear sources. If we expressvehicles, however, depend critically on a full the marginal cost of a new fuel in terms offuel cycle analysis of both the gasoline and $/gallon of gasoline equivalent of fuel, then weelectricity, the charging routine of the batteries, can see how much more the new fuel costsand so forth. If the electricity is produced from relative to present costs, about $0.60-0.80 at thepresent mixes (coal, some oil or gas) it is wholesale, pre-tax price. Of course, this requirespossible that there is no greenhouse benefit at us to model differences in both well-definedall if the electric is compared with a small ICE. fixed costs (ike the cost of a natural gasHybrid electrics, by contrast, would easily reach cylinder in the car) as well as costs harder tothe performance of ICEs, as would likely fuel define, like the value of the loss of space to thecell vehides (FC), and each would offer greater cylinder. If we compare these incremental costsoverall efficiency, that is, lower net GHG to the range of likely reductions in CO2emissions. But hybrids and FC are still under emissions, we can arrive at shadow prices ofdevelopment. Should the task of the car be carbon. But these also tend to be large. Sinceredefined to fit the alternative? And energy use few believe that politicians will accept the valuein all these alternatives depends on driver of reducing carbon emissions exceeds $30/tonbehavior. What should the analyst assume? To of carbon (approximately $100/ton of C02), webe sure, true biofuels (that is, ones without a only have a modest incremental cost we cangreat amount of fossil fuels hidden in the afford to pay for altemative fuels. In terms ofharvesting and processing) would give a real the cost per liter of gasoline equivalent, this isreduction in GHG emissions, but these are still usually small compared with retail price levelselusive at costs competitive with gasoline or in W. Europe, for example. Of course, advocatesdiesel. of altemative fuels point to the cost reductions
they expect as particular options becomeSome analysts defined a shadow cost of popular.gasoline or carbon that makes the altemative"cheaper.' Sperling and others (1993) took this There is another perspective on this compari-approach, using technologies of the early 1990s son. With gasoline prices at approximatelythat induded battery electrics, various kinds of $1.25/liter, new cars in Italy on average arebiomass, natural gas, and other fuels. He found significantly smaller and less powerful than inthat were the shadow value of gasoline not the United States, and consume one third lessused as much as $1.00/gallon over its market fuel/km. The average new car in Italy stillprice, altematives would pay off. The price of outperforms"average"electric cars. Does thatelectricity itself was almost irrelevant to the mean that with an even higher market price forcomparison, because most of the cost of using gasoline of, say $2/liter, electric cars would slidean electric car is for the higher fixed cost.A2 For into the market with much more ease? We doother fuels, fuel costs mattered, but so did other not know. But it is true that if drivers invehicle costs. Southem Califomia, where a certain fraction of
new cars sold by 2003 must be electric, facedWith present technologies, the incremental significantly higher fuel prices, their choices forcosts of using altemative fuels tend to be new cars would match more cdosely what issignificantly higher than for gasoline or diesel available in electrics, and they might embraceon an equal energy content basis. Expressed as the loss of trunk space and range to purchasedifferentials per unit of carbon not released, CNG vehicles. Or they might choose less fuel-these differentials become very large unless the intensive gasoline vehicles. In other words, the
Climate Change Series 65
Tansportation and CO2Emissions: Fle)dng the Link -A Path for the World Bank
first sl:ep towards any alternative fuels that first declaring the winner, it might be better toaffect the performance of cars must be a pricing better define the loser!strategy to first eke some fuel savings out ofICEs running on gasoline or diesel fuels. This Endnotestrategy also defines the shadow value ofreducing gasoline or diesel use by means of A2. This invites the prospect of somewhat higheralternative fuels, and gives both fuel and. car driving levels, which we argue farther on issupplies something to shoot at. Unfortunately, only a small effect in developed countries butmost present-day strategies rely on ediclts or tax could be a significant effect in developingbreaks that favor the alternatives: Rather than countries..
66 Environment Department Papers
References
Ararki,Y., General Manager, Powertrain Operations Eskeland, G.S., and S. Devarajan. 1996. Taxing BadsPlanning, Nissan Motor Co., Tokyo, private. by Taxing Goods, Pollution Control withcommunication. Presumption Charges, The World Bank.
Barde, J.P. and K. Button. 1990. Transport Policy and Eskeland, G.S., and J. Xie. 1998. Integrating Local andthe Environment, Six Case Studies. London, UK: Global Environmental Benefits: Mechanisms andEarthscan Publications Ltd. Case Studies in the Transport Sector, World Bank,
Bennathan, E., J. Fraser, and L.S. Thompson. 1992. Global Environment Division, forthcoming.What Determines Demandfor Freight Transport?. European Conference of Ministers of TransportWorld Bank, Working Paper WPS 998 (October). (ECMT). 1998a. Efficient Transport in Europe:
Braudel, F. 1992."The Wheels of Commerce."In: Policies for Internalization of External Costs. Paris:Civilization and Capitalism, 15th-18th Century. Organization for Economic Cooperation andVol. 2, Berkeley, CA: University of California Development.Press. . 1998b."Land-Use Planning and Sustainable
CEC (Commission of the European Communities). Urban Travel: Overcoming Barriers to Effective1995a. Towards Fair and Efficient Pricing in Coordination."Background paper to conferenceTransport-Policy Options for Internalising the Land-Use Planning and Sustainable Travel.External Costs of Transport in the European Union, Paris: Organization for Economic CooperationGreen Paper COM(95) 691 final, Brussels, and Development (forthcoming).Belgium. Fouchier,V. 1994."The Density Concept and its
-____ 1995b. Communication from the Commission Social Implications."In: Fouchier.V. and Merlin,to the Council and the European Parliament, A P., eds., High Urban Densities: A Solutionfor ourCommunity Strategy to Reduce CO2 Emissionsfrom Cities? Hong Kong: French Consulate andPassenger Cars and Improve Fuel Economy, French Institute of Town Planning.COM(95) 689 final. Brussels, Belgium. Goodwin, RB. 1992. "A Review of New Demand
COWI Consult AS. 1996. CO2 reduktioner I Elasticities with Special Reference to Short andTransportsektorn. HIovedrapport. Copenhagen, Long Run Effects of Price Changes."In: JournalDenmark: Ministry of Traffic. of Transport Economics and Policy 26(2):155-170.
Dargay J. and D. Gately. 1997. Income's effect on car Gorham, R. E. 1996. Regional Planning and Traveland vehicle ownership, Worldwide, 1960-2015. Behavior: A Comparative Study of the SanEconomic research Report. Francisco and Stockholm Metropolitan Regions.
Delucchi. 1997. Private communication. Master's Thesis, Berkeley, CA: University ofEskeland, G.S. 1992. "AttackingAir Pollution in California.
Mexico City,"In Finance and Development Greene, D., andY. Fan. 1992. Transportation Energy29(4):28-30. Efficiency Trends 1972-1992. ORNL 6828. Oak
Eskeland, G.S., and T. Feyzioglu. 1995. Rationing can Ridge, TN: Oak Ridge Natl. Lab.backfire, The Day "Without a Car"in Mexico City, Greene, David L. 1996. Transportation and Energy,The World Bank, Policy Research Department, Eno Transportation Foundation, Inc.,Public Economics Division. Landsdowne,VA.
Climate Change Series 67
Transpoitation and CO2 Emissions: Flexing the Link -A Path for the World Bank
Greening, L.A., W.B. Davis, L.J. Schipper, and M. NAS. 1997. Transportation Research Board, Toward aKhlrushch. 1997."Comparison of Six Sustainable Future: Addressing the Long-TermDecomposition Methods: Application to Effects of MotorVehicle Transportation onAggregate Energy Intensity for Manufacturing Climate and Ecology, National Researchin 1en OECD Countries."In: Energy Economics. Council, National Academy Press, Washington,
Greening L., L.J. Schipper, R. Davis, and S. Bell. D.C.1997.'Prediction of Household Levels of Organization for Economic Co-operation andGreenhouse Gas Emissions from Personal Development (OECD). 1995. EnvironmentalAutomotive Transportation."In: Energy-The Taxes in OECD Countries. Paris, France.InternationalJournal, 22(5) 449-460. Oum, T. H. 1992. 'Concepts of Price Elasticities of
Hanser, J.M. 1996. Danish Energy Agency. Private Transport I)emand and Recent Empiricalcommunication. Estimates : an Interpretative Survey." In: Journal
International EnergyAgency, 1997b. Indicator; Of of Transport Economics and Policy 26(2):155-170.Energy Use and Efficiency: Understanding the link Peake, S. 1997. Vehicle and Fuel Challenges Beyondbetween energy and human Activity. Paris, France. 2000: Market Impacts of the EU's Auto OilOECDAIEA. Programme. London, UK: Financial Times
International Energy Agency, 1997c. Energy Automotive Publishing.Technologiesfor the 21st Century. Paris, FraLnce. Peake, S., and L.J. Schipper, International EnergyOECD/IEA. 1997. Agency (IEA). 1997a. Energy Policy Makingfor
IPCC. 1-996. Climate Change 1995: Impacts, Transport and Climate Change. Paris, France.CC. and996hgahon.of Climate Change1995:Imp,OECD/EA.Adaptations, and Mitigation of Climate Changes: Pearce, D., and others. 1996. The True Costs of RoadScientific-Technical Analyses, Cambridge. Transport. London, UK: Earthscan.
IVL 1996. (Institutet for vatten-och Sluftvardsforskning), Mlitning av Utslapp][ Schipper L.J., and S.T. Meyers. 1983.a"Energy UseverkligTrafik Med Feat-Teknik, Ake Sjodin, and Efficiency in menya,"In: Energy Policy.Goteborg. (September).Johansson,gO. an . cipe.197"esuigSchipper, L.J., S. Bartlett, D. Hawk, and E.L.Vine.
Johansson, 0. and L.J. Schipper. 1997."Measu.Ling 1989. 'Lirnking Energ Use and Life-Styles: ALong-Run Automobile Fuel Demand: Separate 1989. of g Energy Annual ifergyEstimations ofVehicle Stock, Mean Fuel 4Matter of Time?"In: Annual Review of EnergyIntensity, and Measured Annual Driving (14). Palo Alto, CA: Ann. Revs. Inc.DiStances."In: Transport Economics and Policy. Schipper, L.J., R. Steiner, P. Duerr, An, F., and S.(September). Stroem. 1992. "Energy Use in Passenger
McRae, R. 1994. 'Gasoline Demand in Developing Transport in OECD Countries: ChangesAcian R.u1994."ale Deman in DVloping between 1970 and 1987." In: Transportation,Asian Coantries."The Energy Journal, Vol 15, 19:25-42. 1992.
NuLmber 1 pp 143-155. Schipper, L.J., M.J. Figueroa, L. Price, and M. Espey.Martinot, E., L.J. Schipper, M. Khrushch. 1995. 1993."Mind the Gap: TheVicious Circle of
"Energy Demand and Efficiency in Estonia: Measuring Automobile Fuel Use."In: EnergyStructure, Potential, and Policies."In: Energy Policy 21(12):1173.
Poi'icy. 23 (3) 217-233. Schipper, L.J., and G. Eriksson. 1995."TaxationMeyers, S., L.J. Schipper, J. Salay. 1994."Energy Use Policies Affecting Automobile Characteristics
in Poland: An Intemational Compari- so:n."In: and Use in Westem Europe, Japan, and theEnergy-The International Journal. 19 (6) 6 01-617. United States."In: Proceedings of 1993 Workshop
Ministy for the Environment (Italy), FIAT S.]:).a. "Sustainable Transportation,"Washington, DC:1997. Agreement of Intent between the Ministry of American Council for an Energy-Efficientthe Environment and FIAT. Rome, Italy. Economy.
68 Environment Department Papers

References
Schipper, L.J. 1995.'Determinants of Automobile Sperling D. 1994. Future Drive: Electric Vehicles andUse and Energy Consumption in OECD Sustainable Transportation. Washington, DC:Countries: A Review of the Period Island Press.1970-1992."In: Annual Review of Energy and Sperling D., and M. Delucchi. 1993."AltemativeEnvironment, (20) Palo Alto, CA: Ann. Revs. Inc. Transportation Energy,"Chapter 4, 85-141. In:
Schipper, L.J., M.J. Figueroa, and R. Gorham. 1995. The Environment of Oil, Studies in IndustrialPeople on the Move: A Comparison of Travel Organization, Richard J. Gilbert, ed., KluwerPatterns in OECD Countries. Institute of Urban Academic Publishers, BostonlDordrecht/and Regional Development, University of London.California, Berkeley, CA. Steen, P., and others. 1997. Faerder I Framtiden (Frips
Schipper, L.J., M. Ting P. Khrushch, P. Monahan, F. in the Future), FMS (Research Group forUnander, and W. Golove. 1996. The Evolution of Environment and Society) and Swedish BoardCarbon Dioxide Emissions from Energy Use in for Communication and TransportationIndustrialized Countries: An End-Use Analysis. Research.LBL-38574. Berkeley, CA: Lawrence Berkeley Westling H. 1995. "Market Acceptance Process",Laboratory. IEA DSM Agreement, Annex III.
Schipper, L.J. 1996."Life-Styles and the Wheaton, W.C. 1982. The long-run structure ofEnvironment: The Case of Energy."In: Daedalus transportation and gasoline demand. Bell J. Econ.125 (3, Summer 1996) 113-138. 13(2):439-54.
Schipper, L.J., L. Scholl, and L. Price. 1997. "Energy World Bank 1997. Guidelinesfor Climate ChangeUse and Carbon from Freight in Ten Global Overlays. Environment Department PaperIndustrialized Countries: An Analysis of Trends no. 47. Washington, DC, The World Bank.from 1973 to 1992."In: Transportation Research- World Bank. 1996. Sustainable Transport: Priorities forPart D: Transport and Environment 2(1): 57-76. Policy Reform. Washington, DC, The World Bank.
Schipper, L. 1997. "People on the Move and Goods World Bank. 1994. Chile-Managing Environmentalon the Go": A Research Program at Lawrence Problems: Economic Analysis of Selected Issues,
Berkeley National Laboratory. Environment and Urban Development Division,Scholl, L., L.J. Schipper, and N. Kiang. 1996. "CO2 Country Department 1, Latin America and the
Emissions from Passenger Transport: A Caribbean region.Comparison of Intemational Trends From1973-1992". In: Energy Policy, 24(1): 17-30. Zegras, and others. 1996. The World Bank andTransportation. International Institute for Energy
Small, K.A., and C. Kazimi. 1995. On the costs of air Conservation.pollution from motor vehicles. J. Transp. Econ.Policy.
Climate Change Series 69


Environment DepartmentThe World Bank1818 H Street, N WWashington, D C 20433202 473 3641 202 477 0565 FAX
> Printed cn 100% post-consumer recycled paper