Embed Size (px)
Citation preview

Supporting Information
A scalable slurry process to 3D lithiophilic and conductive
framework for high performance lithium metal anode
Yuanming Liu,a,b 1 Xianying Qin,a,d 1 Shaoqiong Zhang,a,b Lihan Zhang,a,b
Feiyu Kang,a,b,c Guohua Chen,d,* Xiangfeng Duan,e,* Baohua Lia,c*
a Engineering Laboratory for Next Generation Power and Energy Storage
Batteries, Engineering Laboratory for Functionalized Carbon Materials,
Graduate School at Shenzhen, Tsinghua University, Shenzhen 518055, China.b School of Materials Science and Engineering, Tsinghua University, Beijing
100084,China.c Shenzhen Geim Graphene Center, Shenzhen 518055, China.d Department of Mechanical Engineering, The Hong Kong Polytechnic
University, Hong Kong, China.e Department of Chemistry and Biochemistry, University of California, Los
Angeles, CA 90095, USA.
1 These authors contributed equally to this work.
*Corresponding authors:
[email protected] (G. Chen)
[email protected] (X. Duan)
[email protected] (B. Li)
Electronic Supplementary Material (ESI) for Journal of Materials Chemistry A.This journal is © The Royal Society of Chemistry 2019

40 50 60 70 80
Inte
nsity
(a.u
.)
2 Theta (deg.)
Micro copper particle Nano copper particle
Figure S1. XRD patterns of Cu micro- and nano-particles.

(a) (b)
Figure S2. (a), (b) Front SEM images of CCP-mix current collector after slurry
coating and drying process under different magnifications.
(a) (b) (c) (d)
(e) (f) (g) (h)
(i) (j) (k) (l)
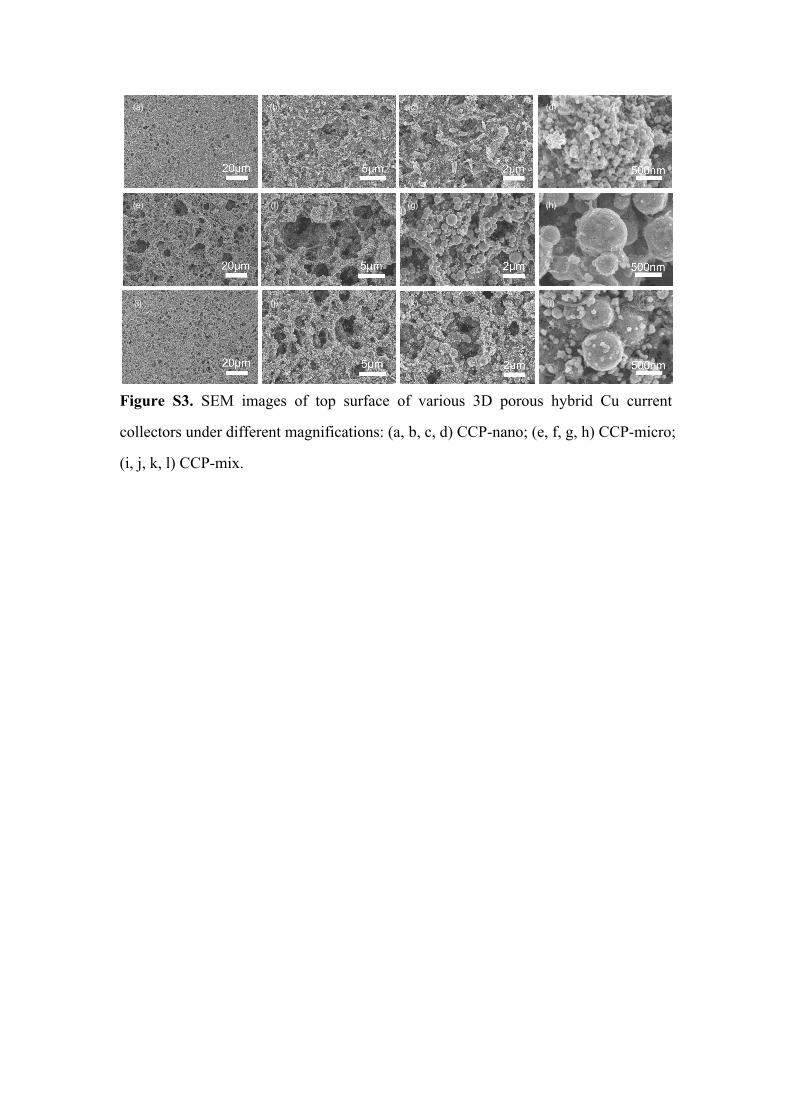
Figure S3. SEM images of top surface of various 3D porous hybrid Cu current
collectors under different magnifications: (a, b, c, d) CCP-nano; (e, f, g, h) CCP-micro;
(i, j, k, l) CCP-mix.

(a) (b)
(c) (d)
Figure S4. SEM images of CCP-mix electrodes with different ratio of micro- and
nano- copper particles: (a) 1:1; (b) 2:1; (c) 3:1; (d) 4:1.

280 284 288 292 296
O/N-C=N/OC-N/O
C-C
Binding Energy (eV)
Inte
nsity
(a.u
.)
C=C
930 940 950 960
Inte
nsity
(a.u
.)
Binding Energy (eV)
Cu 2p3/2
Cu 2p1/2
(a) (b)
392 394 396 398 400 402 404 406 408
Pyridinic-N-oxide
Graphitic NPyrrolic NIn
tens
ity (a
.u.)
Binding Energy (eV)
Pyridinic N
526 528 530 532 534 536 538Binding Energy (eV)
Inte
nsity
(a.u
.)
C-O-H
C=O(c) (d)
Figure S5. XPS spectrum of (a) Cu 2p; (b) C1s; (c) O1s and (d) N1s of CCP-mix current collector.

Table S1. Mass percent of each elements of CCP-mix current collector and each
categories of oxygen and nitrogen atoms through XPS analysis.
Element Cu C N O
Mass percent(%) 42.5 40.82 5.08 11.6
Category of
oxygen atom
Carbonyl Alkoxy
Mass percent(%) 64.52 35.48
Category of
nitrogen atom
Pyridinic N Pyrrolic N Graphitic N Pyridinic-N-
oxide
Mass percent(%) 43.88 29.28 20.78 6.06
(a) (b) (c)
(d) (e)
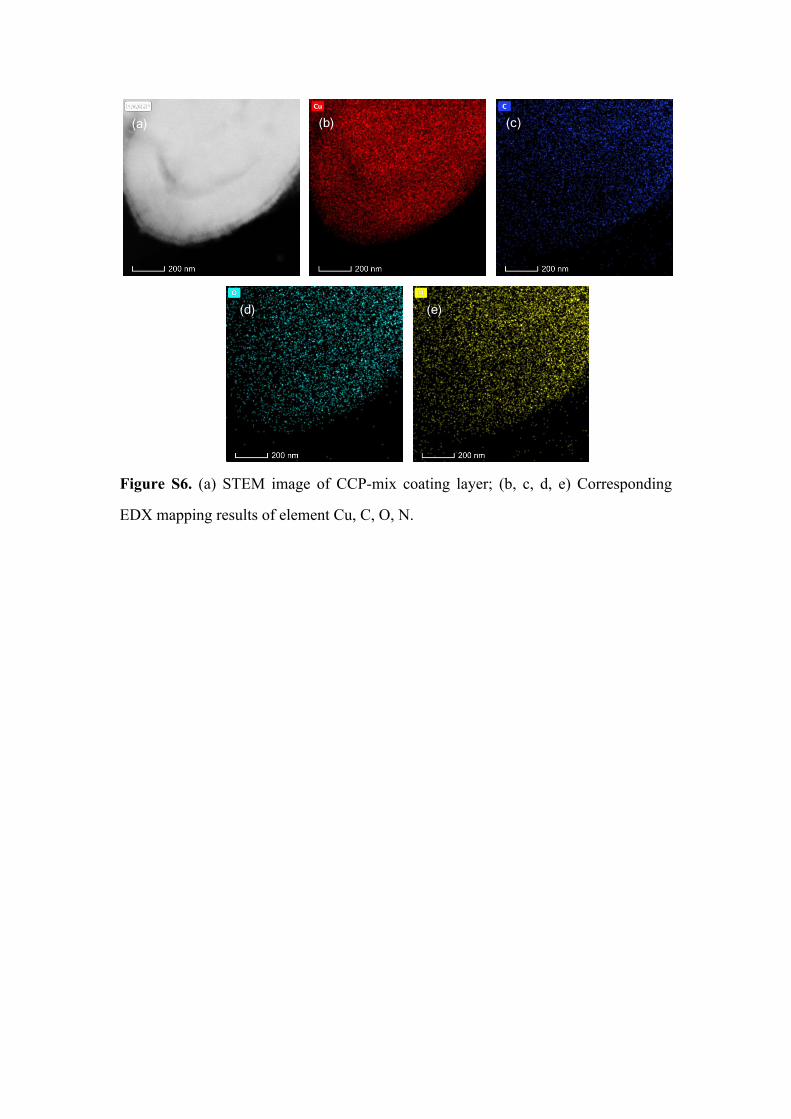
Figure S6. (a) STEM image of CCP-mix coating layer; (b, c, d, e) Corresponding
EDX mapping results of element Cu, C, O, N.

(a)
(b)
(c)
(d)
Figure S7. Elemental mapping results for the CCP-mix @ Li electrodes with (a) 0.5
mAh cm-2; (b) 1 mAh cm-2; (c) 2 mAh cm-2 and (d) 6 mAh cm-2 of Li deposition.

(a) (b) (c) (d)
(e) (f) (g) (h)
(i) (j) (k) (l)
Figure S8. SEM images of Li deposited on Planar Cu foil at 1 mA cm-2 with various
Li capacities: (a, b, c, d) 1 mAh cm-2, (e, f, g, h) 2 mAh cm-2, (i, j, k, l) 6 mAh cm-2.
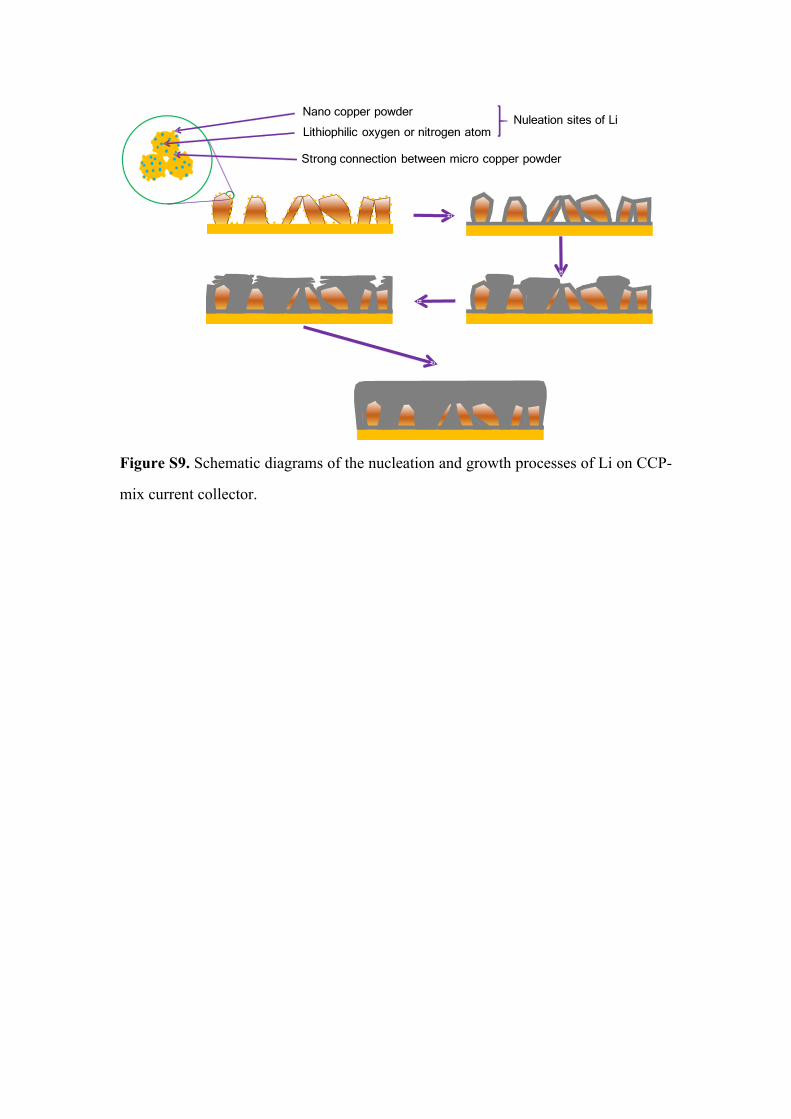
Nuleation sites of Li
Strong connection between micro copper powder
Nano copper powder
Lithiophilic oxygen or nitrogen atom
Figure S9. Schematic diagrams of the nucleation and growth processes of Li on CCP-
mix current collector.

M:N=1:1 M:N=2:1 M:N=3:1 M:N=4:1
0 40 80 120 160 20020
40
60
80
100
120
140
Cou
lom
bic
effic
ienc
y (%
)
Cycle
1 mA cm-2, 1 mAh cm-2
Figure S10. Coulombic efficiency of CCP-mix electrodes with different mass ratio of
micro- and nano-copper particles.

0 20 40 60 80 100 120 140 160 18020406080
100120140
Planar Cu CCP-nano CCP-micro CCP-mix
Cycle
Coul
ombi
c Ef
ficie
ncy
(%)
2 mA cm-2, 2 mAh cm-2
0 20 40 60 80 10020406080
100120140
Planar Cu CCP-mix
Cou
lom
bic
Effic
ienc
y (%
)
Cycle
10 mA cm-2, 1 mAh cm-2(a) (b)
Figure S11. Coulombic efficiencies of Planar Cu, CCP-nano, CCP-micro and CCP-
mix current collector with deposition capacity and current density of: (a) 2 mAh cm-2
and 2 mA cm-2; (b) 1 mAh cm-2 and 10 mA cm-2.

Table S2. Comparison of Coulombic efficiencies of 3D hybrid Cu network current
collector (CCP-mix) to other state of art modifications.
Scaffold Current
density
(mA cm-2)
Capa
city
(mAh
cm-2)
Coulombic
Efficiency
(%)
Cycles Electrolyte Reference
2 2 99.6 300
2 6 99.4 150
N-doped
graphitic
carbon 2 8 99.1 140
1M LiTFSI
DOL/DME,
2% LiNO3
Adv. Mater.,
2018, 30,
1706216.
0.5 0.5 97.5 700
1 1 97.5 120
3 1 96 170
1 2 95 190
Crumpled
graphene
balls
1 12 96 40
1M LiTFSI
DOL/DME,
1% LiNO3
Joule, 2018,
2, 184-193
0.5 0.5 99 200
0.5 1 99 150
1 1 99 150
Double
layer
diamond
interfaces 1 2 98.4 150
1M LiTFSI
DOL/DME
Joule,2018,
2, 1595-
1609
Engineerin
g stable
interfaces
0.5 1 99 500 1M LiTFSI
DOL/DME,
5% LiNO3
Sci. Adv.
2018, 4,
eaat5168
1 1 92.2 242
4 1 93.7 240
1 5 98.3 160
LiNO3
protected
glass fiber
5 10 98.1 53
1M LiPF6
EC/DEC
PNAS,
2018, 115,
5676-5680
1 1 95 250Cu-CuO-
Ni hybrid
structure
3 0.5 95 90
1M LiTFSI
DOL/DME,
1% LiNO3
Adv. Mater.
2018, 29,
1705830

0.5 1 97 150
0.5 4 97 100
N-doped
graphene
decorated
Cu foam
1 2 97 50
1M LiTFSI
DOL/DME,
1% LiNO3
Adv. Funct.
Mater.,
2018, 27,
1606422
1 1 95.8 300
1 3 97.5 120
3 1 97.4 140
5 1 95.6 100
3D PMF
coating
10 1 94.7 50
1M LiTFSI
DOL/DME,
2% LiNO3
Adv.
Energy.
Mater.,
2018,
1703360
1 1 98.8 500
1 4 91.6 100
4 1 92 169
8 1 92.22 160
10 1 80.3 100
3 D hybrid
Cu
network
(CCP-mix)
12 1 91 70
1M LiTFSI
DOL/DME,
1% LiNO3
This work

(a)
0.0 0.2 0.4 0.6 0.8 1.0
0.0
0.2
0.4
0.6
0.8 1st 100th 200th 300th 400th 500th 600th
1 mA cm-2, 1 mAh cm-2
Areal capacity (mAh cm-2)
Volta
ge (V
vs.
Li+
/Li)
0.0 0.2 0.4 0.6 0.8 1.0-0.10.00.10.20.30.40.50.6
4 mA cm-2, 1 mAh cm-2
Volta
ge (V
vs.
Li+
/Li)
Areal capacity (mAh cm-2)
1st 50th 100th 150th
0.0 0.2 0.4 0.6 0.8 1.0-0.2-0.10.00.10.20.30.40.50.6
8 mA cm-2, 1 mAh cm-2
Volta
ge (V
vs.
Li+
/Li)
Areal capacity (mAh cm-2)
1st 50th 100th 150th
(b)
(c) (d)
0.0 0.2 0.4 0.6 0.8 1.0-0.10.00.10.20.30.40.5
Volta
ge (V
vs.
Li+
/Li)
Areal capacity (mAh cm-2)
1st 50th 100th
1 mA cm-2, 1 mAh cm-2
Figure S12. The voltage-capacity profiles of (a) Li/planar Cu cell at 1 mA cm-2 with
Li capacity of 1 mAh cm-2 at specific cycles and (b,c,d) Li/CCP-mix cells at (b) 1 mA
cm-2, (c) 4 mA cm-2, (d) 8 mA cm-2 with Li capacity of 1 mAh cm-2 at specific cycles.

0 20 40 60 80 100 120 1400
50
100
150
200
Li foil (10 mAh cm-2) CCP-mix @ Li (4 mAh cm-2)
Dis
char
ge c
apac
ity (m
Ah
g-1 )
Cycle
0
20
40
60
80
100
120
Cou
lom
bic
effic
ienc
y (%
)
0.0
0.3
0.6
0.9
1.2
1.5
1.8
Are
al c
apac
ity (m
Ah
cm-2
)
Figure S13. Electrochemical performance of Li | LFP full cell with low N/P ratio of
2.16 (CCP-mix electrode) and 5.41 (Li foil).
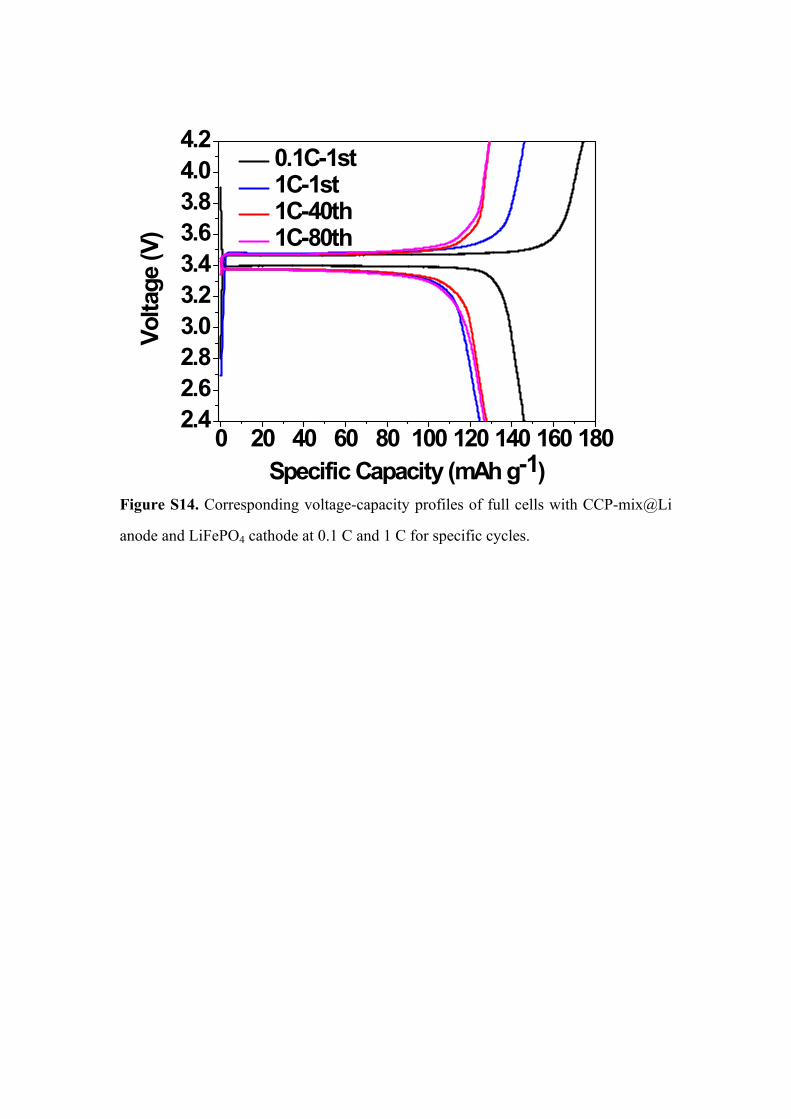
0 20 40 60 80 100 120 140 160 1802.42.62.83.03.23.43.63.84.04.2
Volta
ge (V
)
Specific Capacity (mAh g-1)
0.1C-1st 1C-1st 1C-40th 1C-80th
Figure S14. Corresponding voltage-capacity profiles of full cells with CCP-mix@Li
anode and LiFePO4 cathode at 0.1 C and 1 C for specific cycles.
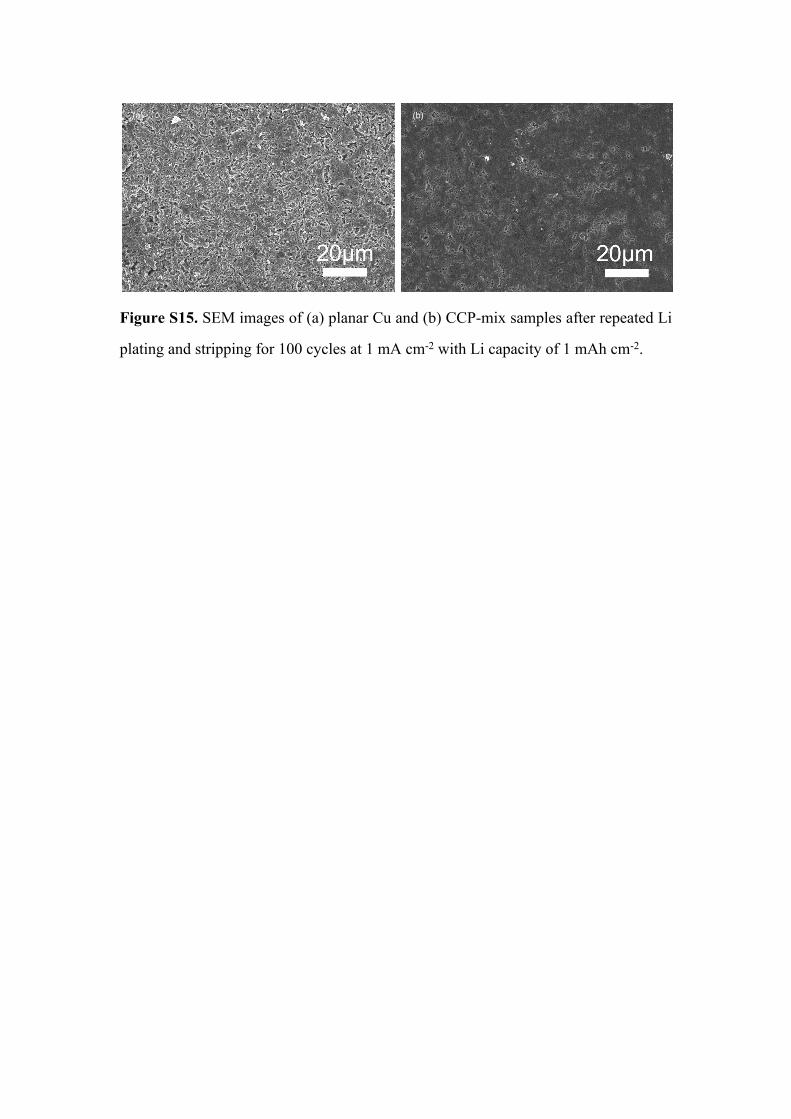
(a) (b)
Figure S15. SEM images of (a) planar Cu and (b) CCP-mix samples after repeated Li
plating and stripping for 100 cycles at 1 mA cm-2 with Li capacity of 1 mAh cm-2.

0 20 40 60 80 1000
20
40
60
80
100-Z
imag
e (o
hm)
Zreal (ohm)
Fresh cell 100th
0 20 40 60 80 1000
20
40
60
80
100
Fresh cell 100th
Zreal (ohm)
-Zim
age
(ohm
)
(a) (b)
Figure S16. The Nyquist curves of fresh cells and cycled cells after repeated plating
and stripping Li at 1 mA cm-2 with Li capacity of 1 mAh cm-2 for 100 cycles of (a)
Planar Cu and (b) CCP-mix samples.
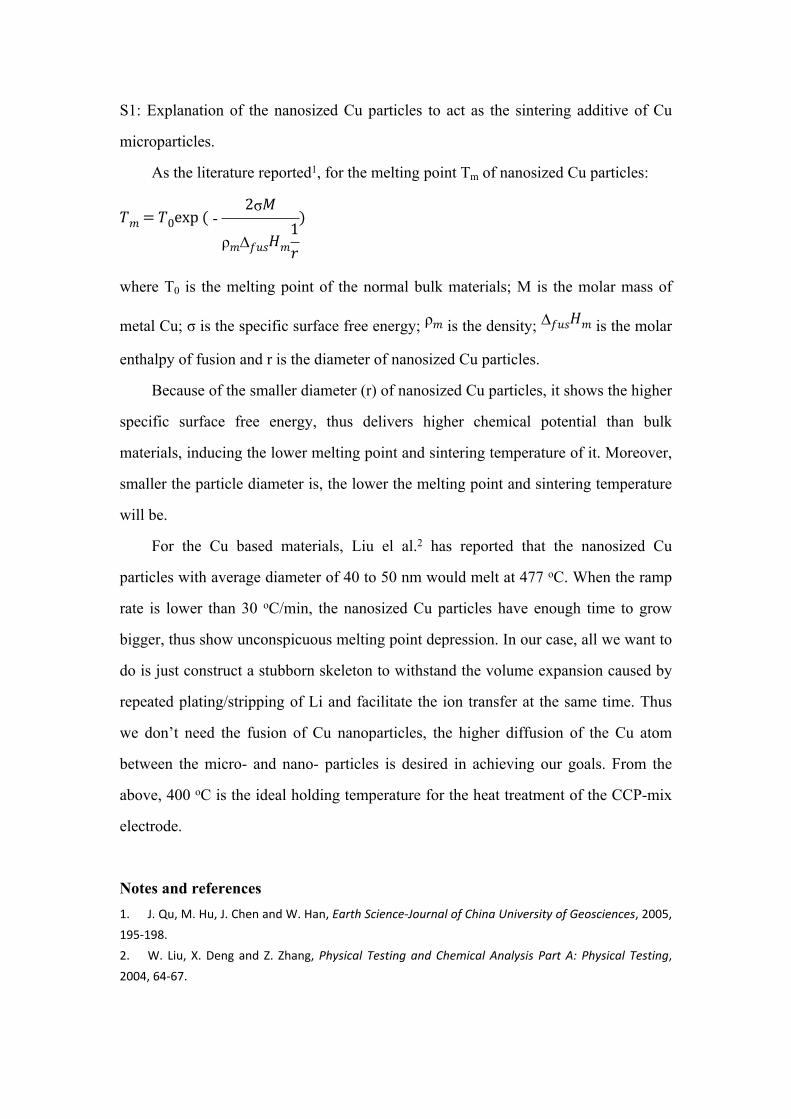
S1: Explanation of the nanosized Cu particles to act as the sintering additive of Cu
microparticles.
As the literature reported1, for the melting point Tm of nanosized Cu particles:
𝑇𝑚= 𝑇0exp ( -2σ𝑀
ρ𝑚∆𝑓𝑢𝑠𝐻𝑚1𝑟
)
where T0 is the melting point of the normal bulk materials; M is the molar mass of
metal Cu; σ is the specific surface free energy; is the density; is the molar ρ𝑚 ∆𝑓𝑢𝑠𝐻𝑚
enthalpy of fusion and r is the diameter of nanosized Cu particles.
Because of the smaller diameter (r) of nanosized Cu particles, it shows the higher
specific surface free energy, thus delivers higher chemical potential than bulk
materials, inducing the lower melting point and sintering temperature of it. Moreover,
smaller the particle diameter is, the lower the melting point and sintering temperature
will be.
For the Cu based materials, Liu el al.2 has reported that the nanosized Cu
particles with average diameter of 40 to 50 nm would melt at 477 oC. When the ramp
rate is lower than 30 oC/min, the nanosized Cu particles have enough time to grow
bigger, thus show unconspicuous melting point depression. In our case, all we want to
do is just construct a stubborn skeleton to withstand the volume expansion caused by
repeated plating/stripping of Li and facilitate the ion transfer at the same time. Thus
we don’t need the fusion of Cu nanoparticles, the higher diffusion of the Cu atom
between the micro- and nano- particles is desired in achieving our goals. From the
above, 400 oC is the ideal holding temperature for the heat treatment of the CCP-mix
electrode.
Notes and references1. J. Qu, M. Hu, J. Chen and W. Han, Earth Science-Journal of China University of Geosciences, 2005, 195-198.2. W. Liu, X. Deng and Z. Zhang, Physical Testing and Chemical Analysis Part A: Physical Testing, 2004, 64-67.