Embed Size (px)
Citation preview

Smart Buildings: The “leaves” of the Smart Grid “tree”
Yuvraj AgarwalE-Mail: [email protected]: www.synergylabs.org/yuvraj
CMU :: SCS :: ISR
© 2014 :: Yuvraj Agarwal :: Carnegie Mellon University

2

3

IT energy use as the problem
• Information Technology (IT) equipment is ubiquitous– Mobile devices to data centers, telecom + networked devices
• An important and growing component of energy use* – PCs and peripherals (57%) + telecom (25%) + data centers (18%)
• Reducing energy consumption of IT is critical– For battery life, reducing costs, managing carbon footprint
4* “SMART 2020: Enabling the Low Carbon Economy in the Information Age”, The Climate Group, 2008
IT is also part of the solution
5
* Smart2020: A total of 7.8 GtCO2e of IT enabled reductions are possible For reference total ICT emissions projected in 2020 are 1.43 GtCO2e
Smart Buildings
Smart Electrical Grid
* “SMART 2020: Enabling the Low Carbon Economy in the Information Age”, The Climate Group, 2008
1.68 GtCO2e reductions

Buildings: The Big Opportunity
6
• 41% of total energy consumption• 73% of electricity consumption• 34% of natural gas consumption
• > 50% including indirect• 12% of potable water
Even moderate improvements in electricity, water, and gas consumption in buildings can have a significant impact
Adapted from Mani Srivastava
Sankey Diagram for the National Academy of Sciences
According to LLNL: 99.2Q (2008) 94.6Q (2009), 98Q (2010), 97.3Q (2011), 95.1Q (2012)
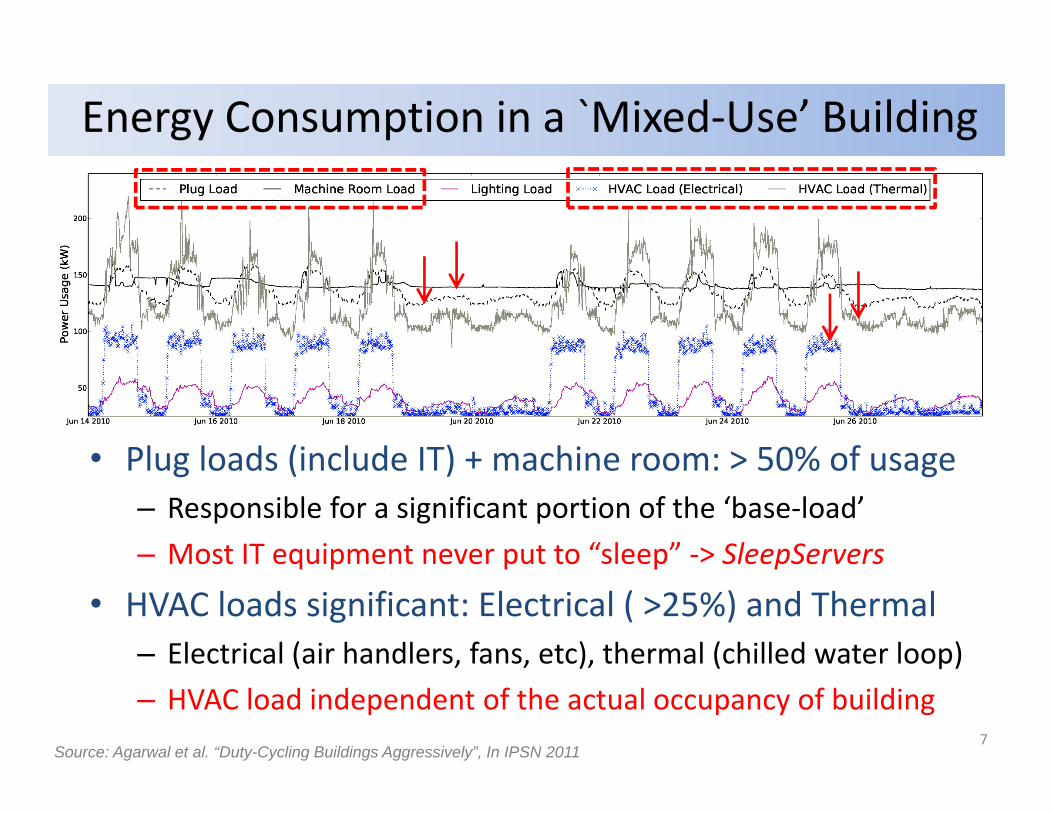
Energy Consumption in a `Mixed‐Use’ Building
• Plug loads (include IT) + machine room: > 50% of usage – Responsible for a significant portion of the ‘base‐load’ – Most IT equipment never put to “sleep” ‐> SleepServers
• HVAC loads significant: Electrical ( >25%) and Thermal – Electrical (air handlers, fans, etc), thermal (chilled water loop)– HVAC load independent of the actual occupancy of building
7Source: Agarwal et al. “Duty-Cycling Buildings Aggressively”, In IPSN 2011

Outline• Motivation
• Energy Efficient Computing– Aggressively duty‐cycling using collaborative heterogeneity – Reducing PC energy usage [NSDI’09, USENIX’10]
• Energy Efficient Buildings – Sensing and control within buildings – Duty‐Cycling the HVAC system [BuildSys’10, IPSN’11, SenSys’13]– Managing Plug‐Loads [BuildSys’11]
• BuildingDepot: An Open Platform for Smart Buildings
8

Barriers to “duty‐cycling” of Computers
• Must maintain desktop state • Must maintain availability, network connectivity
– Background traffic: ICMP, ARPs – Occasional access: RDP, SSH, SMB, patches, ..– Background applications:
• Presence/Communication: VoIP (Skype, SIP), IM, Bonjour • Unattended Downloads: HTTP, BitTorrent (P2P) • Server based applications: Apache, [media streamers]
Low-Power modes (e.g. Sleep, Hibernate) affect usability
9
Question: can we create “hybrid” states of operation where computers maintain network presence even in sleep modes?
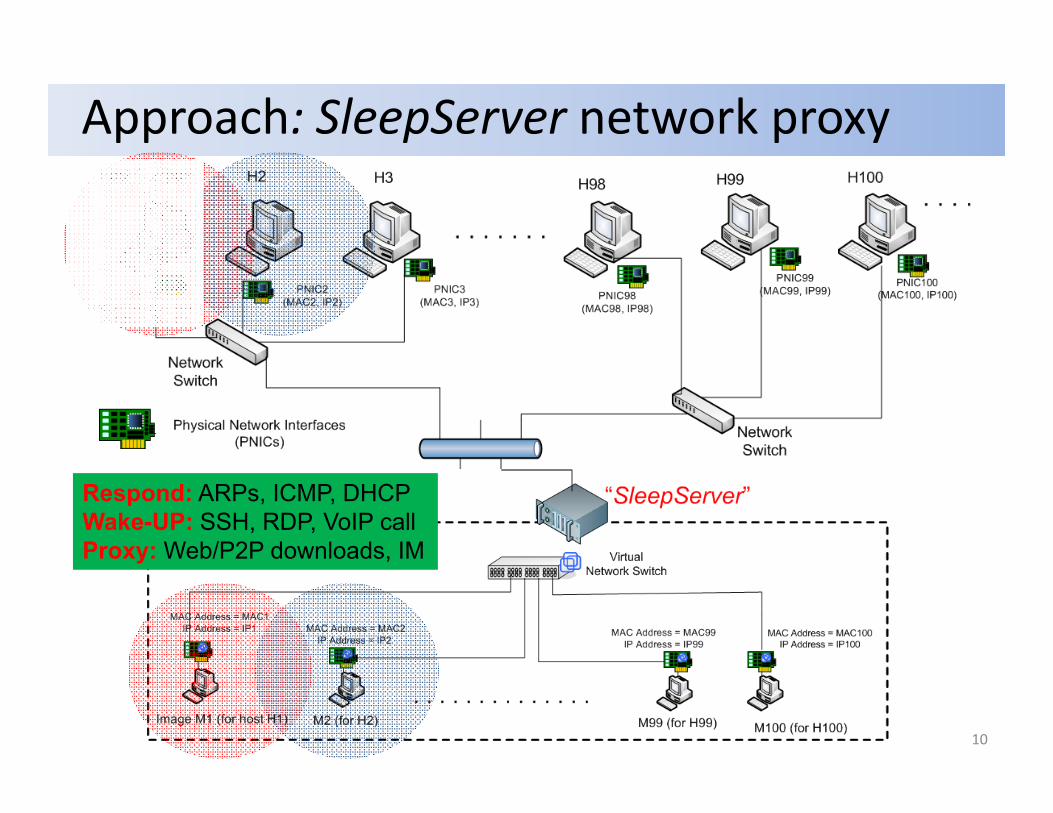
Approach: SleepServer network proxy
Respond: ARPs, ICMP, DHCPWake-UP: SSH, RDP, VoIP callProxy: Web/P2P downloads, IM
10
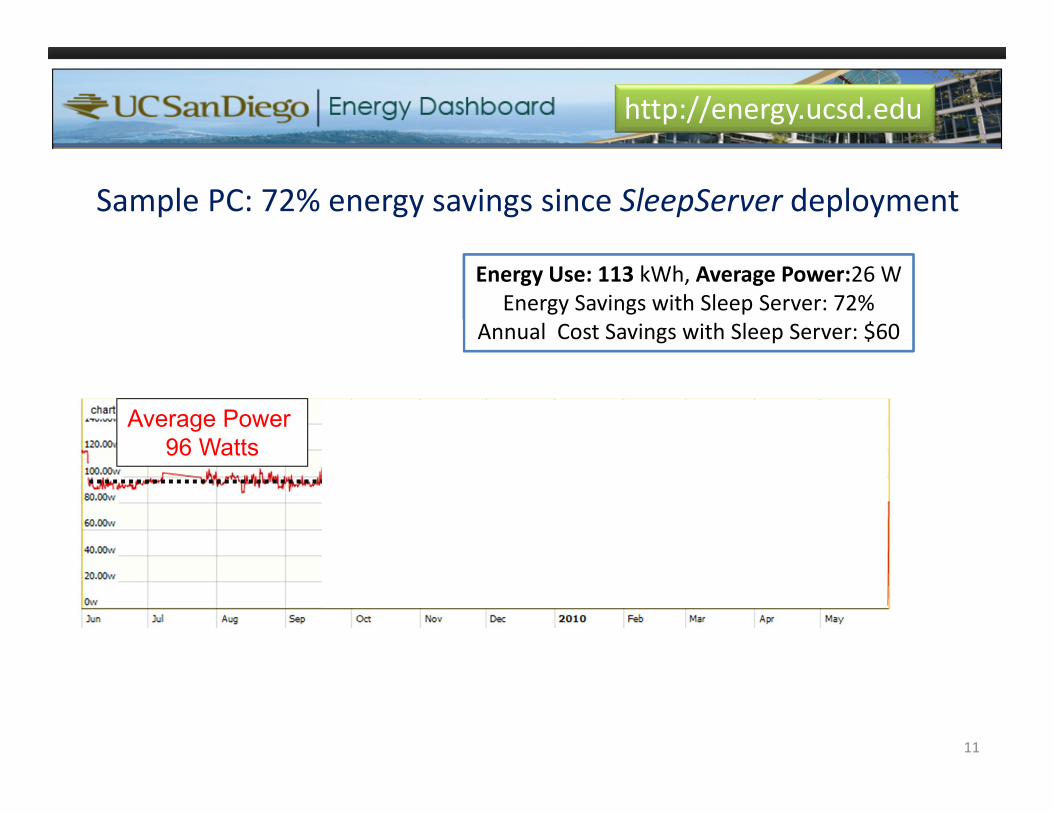
Sample PC: 72% energy savings since SleepServer deployment
Energy Use: 113 kWh, Average Power:26 WEnergy Savings with Sleep Server: 72%
Annual Cost Savings with Sleep Server: $60
http://energy.ucsd.edu
11
Average Power 96 Watts
Average Power 26 Watts
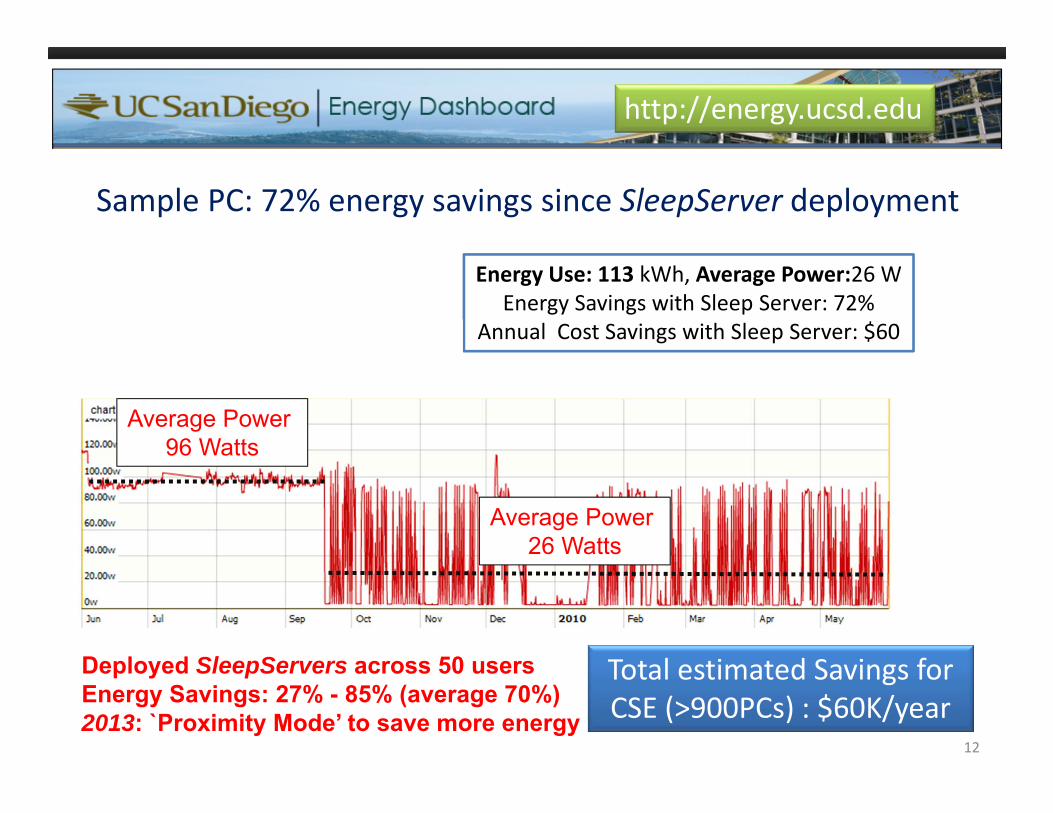
Sample PC: 72% energy savings since SleepServer deployment
Energy Use: 113 kWh, Average Power:26 WEnergy Savings with Sleep Server: 72%
Annual Cost Savings with Sleep Server: $60
http://energy.ucsd.edu
Total estimated Savings for CSE (>900PCs) : $60K/year
Deployed SleepServers across 50 usersEnergy Savings: 27% - 85% (average 70%)2013: `Proximity Mode’ to save more energy
12
Average Power 96 Watts
Average Power 26 Watts

Outline• Motivation
• Energy Efficient Computing– Aggressively duty‐cycling using collaborative heterogeneity – Reducing PC energy usage [NSDI’09, USENIX’10]
• Energy Efficient Buildings – Sensing and control within buildings– Duty‐Cycling the HVAC system [BuildSys’10, IPSN’11, SenSys’13]– Managing Plug‐Loads [BuildSys’11]
• BuildingDepot: An Open Platform for Smart Buildings

Reducing HVAC energy consumption
• Modern buildings have efficient HVAC systems– Central cooling + chilled water loop is common
• Unfortunately, use of static schedules prevalent– Energy wasted during periods of low occupancy
HVAC ON
5:15AM 6:30PM
Some people actually arrive 2 hours later!
HVAC starts at this time
Points to the benefits of occupancy based control
Un-Occupied PeriodsHVAC stops at this time
Challenges in Determining Occupancy• Need inexpensive occupancy sensing solutions
– Low (incremental) deployment andmaintenance cost– Leverage existing infrastructure whenever possible
• Need accurate detection – False negatives cause discomfort: Actual=Occupied, Detect=Away– False positive waste energy: Actual=Away, Detect=Occupied
• Manage privacy, security and policy issues– Camera based solutions face significant barriers– Controlling HVAC systems affects building occupants
15

Occupancy Driven HVAC Control• Key Idea: Use real‐time occupancy to drive HVAC
– Multiple sensors (PIR + door switch), wireless, battery – Infer occupancy by network traffic (Sentinel‐SenSys’13) – Data analysis and control Interface with EMS – Use existing HVAC VAV boxes as Actuators
EMS
Occupancy NodesBase Station
Wireless linkWired link
Energy Management System
HVAC VAV Box
Data Analysis/Control
EMS
Database
HVAC Control/Actuation
16
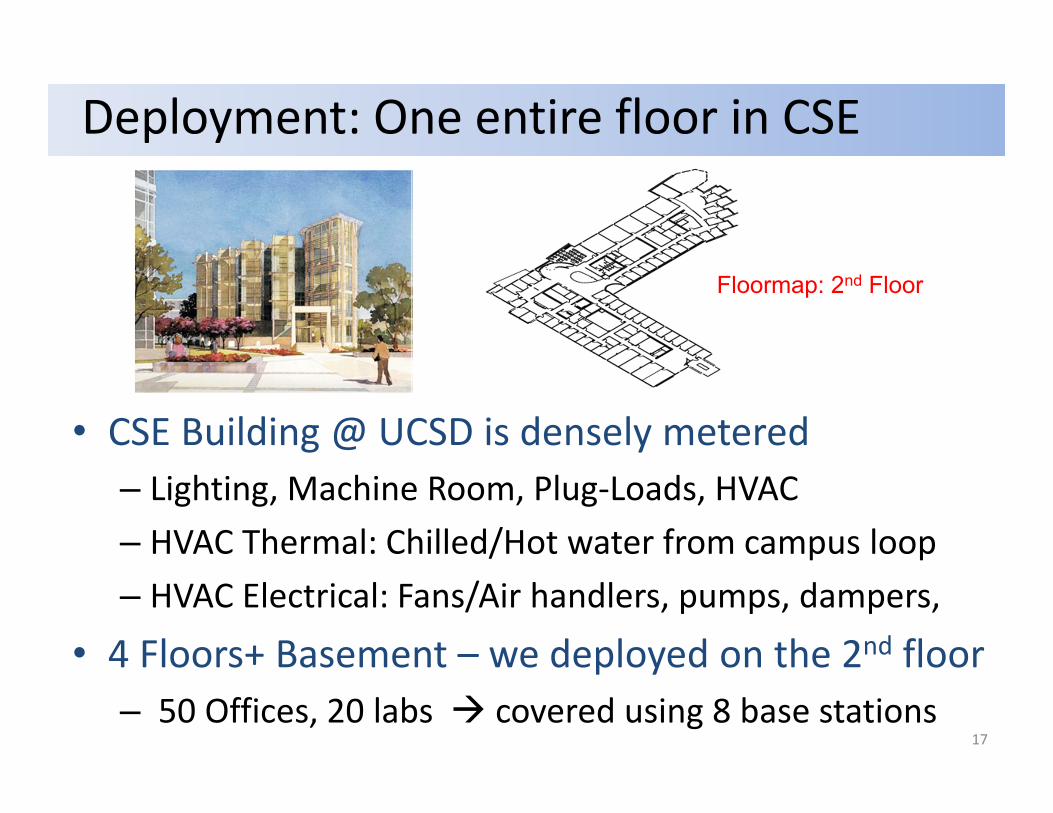
Deployment: One entire floor in CSE
• CSE Building @ UCSD is densely metered– Lighting, Machine Room, Plug‐Loads, HVAC – HVAC Thermal: Chilled/Hot water from campus loop – HVAC Electrical: Fans/Air handlers, pumps, dampers,
• 4 Floors+ Basement – we deployed on the 2nd floor– 50 Offices, 20 labs covered using 8 base stations
Floormap: 2nd Floor
17

Example Occupancy Patterns
• Clearly shows that faculty work less than grad students!• Significant diversity in occupancy patterns• Sensor over 96% accurate, no false negatives 18

Result: Significant HVAC Energy Savings
Estimated ~30% savings if deployed across CSE@UCSDDetailed occupancy can be used to drive other systems
HVAC Energy Consumption (Electrical and Thermal) during the baseline day.
HVAC Energy Consumption (Electrical and Thermal) for a test day with a similar weather profile. HVAC energy savings are significant: 11.6% (HVAC-Electrical), 12.4% for cooling and 9.6% for heating (HVAC-Thermal) for just the 2nd floor
19
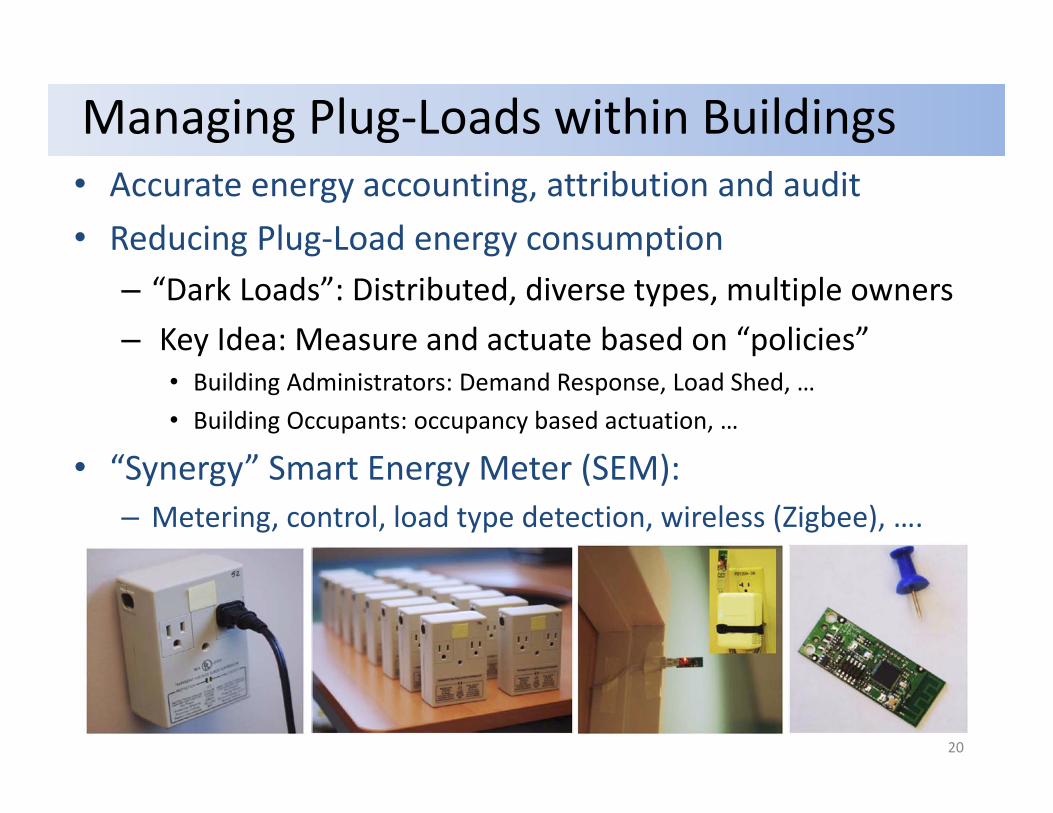
Managing Plug‐Loads within Buildings• Accurate energy accounting, attribution and audit • Reducing Plug‐Load energy consumption
– “Dark Loads”: Distributed, diverse types, multiple owners – Key Idea: Measure and actuate based on “policies”
• Building Administrators: Demand Response, Load Shed, … • Building Occupants: occupancy based actuation, …
• “Synergy” Smart Energy Meter (SEM): – Metering, control, load type detection, wireless (Zigbee), ….
20

Outline• Motivation
• Energy Efficient Computing– Aggressively duty‐cycling using collaborative heterogeneity – Reducing PC energy usage [NSDI’09, USENIX’10]
• Energy Efficient Buildings – Sensing and control within buildings– Optimizing HVAC energy use [BuildSys’10, IPSN’11, SenSys’13]– Managing Plug‐Loads [BuildSys’11]
• BuildingDepot: An Open Platform for Smart Buildings
Managing Building Sensor Data and Systems
• Buildings generate a lot of data from various sources– BACNet, OPC, Custom Sensor Networks, … – e.g. UCSD/CSE alone has thousands of BACNet points
• Challenge: How should this data be stored/organized? – Capture natural structure and hierarchy of buildings– Scalable (data) and flexible (metadata) organization
• Challenge: Standardized interfaces to accessing data– Fine‐grained mechanisms for accessing and sharing data– Standard API that can be used by application developers
• Need open‐data driven architecture for buildings 22

BuildingDepot 2.0* Architecture
Building A Building B Building C Building D
Data Connectors
Large amount of data generated in modern
buildings
REST/ Native API
Apps
Visualize Maintain Analyze
Data management system for sensors and
actuators
Next generation building applications via standardized API
Scalable, distributed data storageMetadata and contextual tagging Access control across users REST API for app development
Control
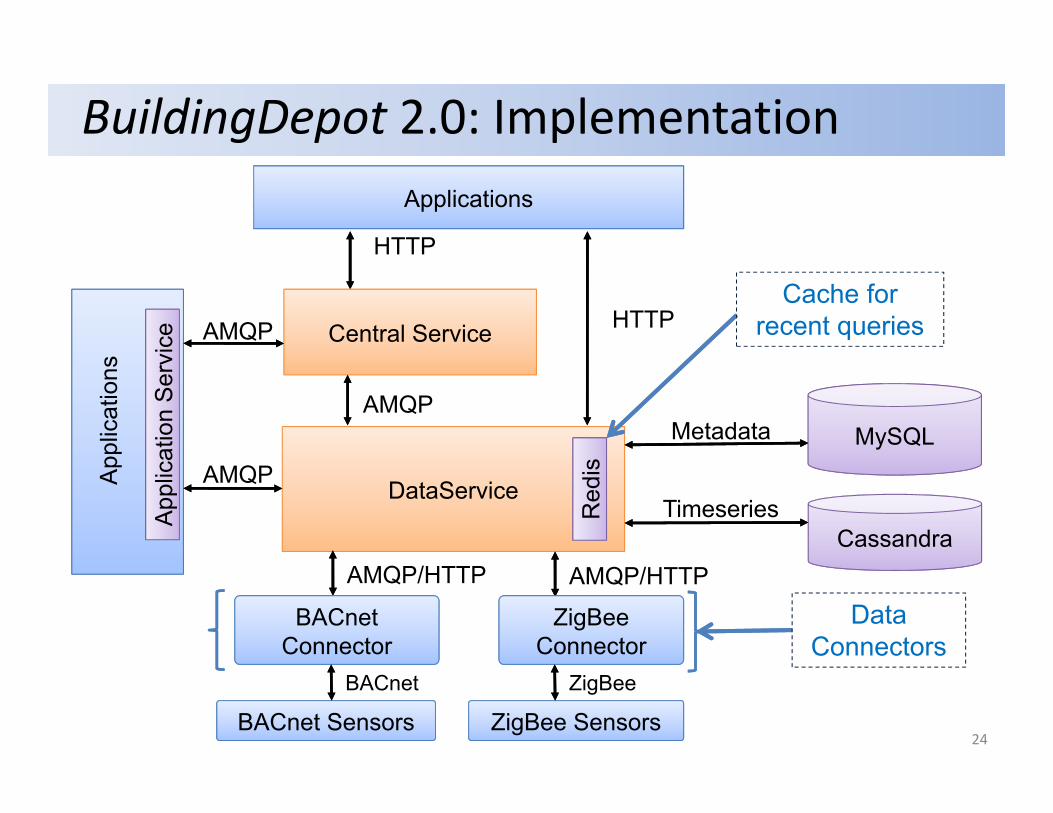
BuildingDepot 2.0: Implementation
24
DataService
Cassandra
MySQLMetadata
TimeseriesRed
isAMQP/HTTP AMQP/HTTP
Applications
HTTP
HTTPCentral Service
AMQP
Cache for recent queries
BACnet Sensors ZigBee Sensors
BACnetConnector
ZigBeeConnector
BACnet ZigBee
DataConnectors
AMQP
AMQP
Appl
icat
ion
Serv
ice
Appl
icat
ions

Example Applications: BD 2.0
25
• ZonePac*: Real‐time feedback of estimated HVAC power and other parameters => control
Visualize Control
+
* ZonePAC: Zone Power Estimation and Control via HVAC Metering and Occupant Feedback. B. Balaji, H. Teraoka, R. Gupta and Y. Agarwal, In BuildSys 2013
• BuildingViz: Interactive 3D interface to view real time building data and control/interact
Several more Smart Building “Apps” coming!

Smart Buildings: Opportunities • Several interesting research challenges
– Privacy, Anonymity: rich occupant data– Security, Access Control: ability to actuate – Scalability: real‐time processing of data streams
• BuildingDepot enables research opportunities– Building control: occupancy based, predictive, … – Data analysis: anomaly and waste detection, …– Empirical modeling: Simulation, cost‐benefit analysis– Visualization: Dashboards, 3D models, ...
26Open platforms enable community involvement! ACM BuildSys

Thank you!
27
:: Energy Efficient Systems:: Smart Buildings:: Mobile Computing
http://www.synergylabs.org
Acknowledgements: Bharathan Balaji, Thomas Weng, Anthony Knowkafor, Max Masich, Jayon Huh Visitors: Hitedoshi Teraoka, Daisuke Komaki+ Several Undergrads and M.S Students!


![PMU Placement to Ensure Observable Freqqyuency and Voltage Dynamics…electriconf/2012/slides/Section D2-P1/2... · References [1] Ali Abur, Optimal Plancement of Phasor Measurement](https://img.pdfslide.us/doc/110x75/5a827d217f8b9ada388de528/pmu-placement-to-ensure-observable-freqqyuency-and-voltage-dynamics-electriconf2012slidessection.jpg)