Embed Size (px)
Citation preview
~ 453 ~
ISSN Print: 2394-7500
ISSN Online: 2394-5869
Impact Factor: 5.2
IJAR 2020; 6(3): 453-461
www.allresearchjournal.com
Received: 19-01-2020
Accepted: 21-02-2020
Abdul Rahim Ahmadi
Shaikh Zayed University
(SZU) Khost, Afghanistan
Dr. Hiroyoky Meyazaki
Asian Institute of Technology
(AIT) Thailand
Mohammad Anwar Anwar
Shaikh Zayed University
(SZU) Khost, Afghanistan
Correspondence Author:
Dr. Hiroyoky Meyazaki
Asian Institute of Technology
(AIT) Thailand
E-government development index (EGDI) estimation
and suggestions for improvement: A case study of
Khost province, Afghanistan
Abdul Rahim Ahmadi, Dr. Hiroyoky Meyazaki and Mohammad Anwar
Anwar
Abstract
Recently, an evolution of ICT has grown dramatically, which is known as e-Gov improvement and top
ranked EGDI. EGDI is based on the three criteria, the adequacy of telecommunication infrastructure,
the ability of human resources to promote and use ICT, and the availability of online services and
content. UN reported in 2016 of estimated EGDI of Afghanistan 0.2313 that shows the lowest rank in
the worlds where, the re-estimation value is 0.3634, which is quite higher than the UN 2016 report.
Furthermore suitable areas suggested for Internet infrastructure investment. A conceptual framework
have been proposed and implemented as a case study, for which data were collect through a purposive
sampling method.
Keywords: EGDI, E-Gov, TII, HCI, OSI
1. Introduction
1.1 Background and status of e-Gov penetration
The idea of Electronic Government (E-Gov) have developed in the late 1990s although that
the historical backdrop of calculating an instrument in government creations could be
followed back to the beginning of PC itself and simply as other e-stage ideas, for example,
online business, e-health, e-transportations and etc. The term e-Gov was resulting from web
world. E-Gov which is a well-known movement was doubtful before now but from its rapid
development, there is a possible future heading for the investigation area (Oseni, Dingley, &
Hart, 2015) [1]. E-Gov is the use of information and communication (ICT) to achieve the
efficiency, viability, straightforwardness and responsibility of enlightening and value-based
trades among Government to Business (G2B), Government to Government (G2G), and
Government to Citizens (G2C) (Alateyah, Crowder, & Wills,2012) [2]. Furthermore, e-Gov is
the utilization of Information Technology (IT) to empower and enhance the proficiency
through which government services are given to employees, organizations, citizens and
agencies (Alshehri & Drew, 2010) [3]. As we know ICT has evolved rapidly, this evolution
has effected and has brought changes to every day’s life of individuals in the world and is
likely to change the route, in which governments around the globe collaborate with their
agencies, organizations, citizens, employees, and different stakeholders. These quick
progressions are considered as e-Gov improvement and top ranked EGDI (Sang & Lee,
2009) [5], (Rehman & Esichaikul, 2011) [4]. So, EGDI can be categorized in three branches,
the adequacy of telecommunication infrastructure, and the ability of human resources to
promote and use ICT, and the availability of online services and content (UN, 2016) [6].
Without doubt for development of social, economic, and quantifying ICTs are known as an
engine (Wentz, Kramer, & Starr, 2008) [7]. ICT infrastructure have rule as a basic requisite
for adoption of new technology (Senthil Kumar, 2017) [8]. Additionally, implementation of
ICT in government sector provides significance benefits to citizens, business, government
and employees but also have some barriers and challenges in adaptation (Alshehri & Drew,
2010) [3]. Most key challenges and barriers confronted to e-Gov services adoption such as
leak of infrastructure, security, privacy and citizen’s skills etc.
International Journal of Applied Research 2020; 6(3): 453-461
~ 454 ~
International Journal of Applied Research http://www.allresearchjournal.com
Modern communication technologies arrived to Afghanistan
in early 1930th with a small exchange of information only
covered Kabul city, the capital of Afghanistan. This limited
communication network boundary reached only five
campuses of the Kabul city via copper wire (Mohmand,
Marjan, & Sangin, 2010) [9]. Due to the 3 decades of wares,
the telecommunication infrastructure was mostly destroyed.
Government of Afghanistan adopted the ICT modern policy
for its improvement in 2002 when transitional government
reached to the power. The government of Afghanistan
adopted in October 2002, the telecoms development
strategies and implemented. For investment promotion of
private sector Afghan government pass a telecommunication
law in 2005. Besides that, the ministry of communication
and information technology (MCIT) has played a role as a
leader in ICT implementation in government sector in the
country. There are many running and completed e-Gov
projects which provide services to citizens, employees,
business, and government bodies (MCITprojects, n.d.) [10].
Moreover, a huge number of Companies have been invested
in ICT infrastructure for providing e-Gov services.
According to the enormous development of ICT
infrastructure some areas of the country are still uncovered
by ICT and total 89 percentage residential areas of the
country covered by telecom (Habibi et al., 2017) [11].
Afghanistan placed 156th out of 167 countries in ranking
list of ITU 2015, and UN survey 2016 indicated the lowest
ranking in south Asian countries. So, the research answered
the question “GIS-based EGDI Estimation at Subnational
Level: A Case Study of Khost, Afghanistan” and a finding of
the research study shows quite higher value of EGDI than
the UN 2016 survey report of estimated EGDI value.
1.2 Technical challenges of measuring e-Gov
performance
Field survey data important for the research study, although,
for the two dimensions Telecommunication Infrastructure
Index (TII) and Human Capital Index (HCI) data and for
mobile cell towers coordinates data were collected from the
field. But, for the third dimension Online Services Index
(OSI) and spatial data (Population density, settlements) for
suggestion of Internet infrastructure investment were used
secondary data.
1.3 Objectives of the research
Main objective of the study is GIS based EGDI estimation
for subnational level: A case study in Khost province of
Afghanistan. In details the research focuses on the following
key points:
1. Proposed and implemented EGDI estimation
framework as a case study.
2. Analysis of the status estimated EGDI and suggested
Internet infrastructure investment at Least developed
EGDI areas.
2. Methodology
2.1 Overview
GIS-based EGDI estimation framework was proposed.
Based on that framework EGDI have estimated for
subnational level of Khost province. At the end of the
research study, appropriate areas were suggested for Internet
infrastructure investment based on the population density
spatial data, Mobile-Cell towers spatial data and with leased
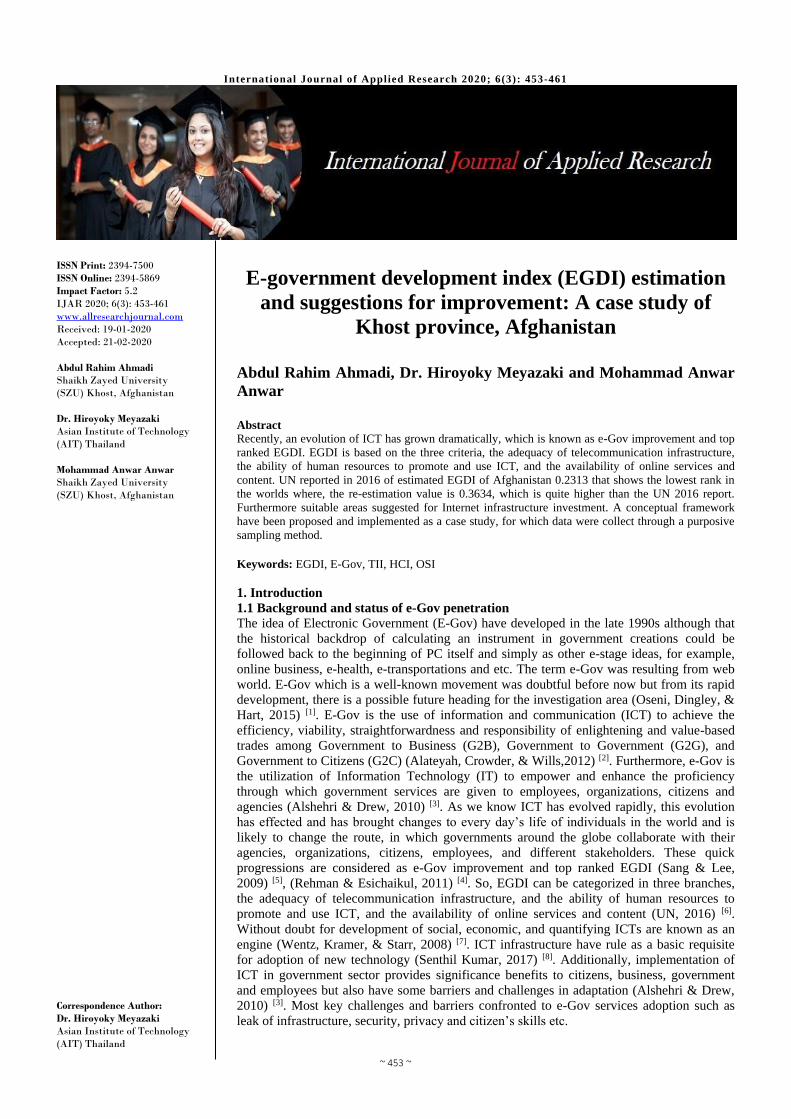
estimated EGDI. A figure 1 shows the whole process of the
research.
Fig 1: Shows the complete methodology Flowchart
Based on the methodology flowchart, a conceptual
framework proposed for subnational level as well as it was
implemented for the case study at Khost province, in future
researcher can benefits to be able to implement for the rest
of provinces, which have been open the door for estimation
of EGDI for the whole country.
~ 455 ~
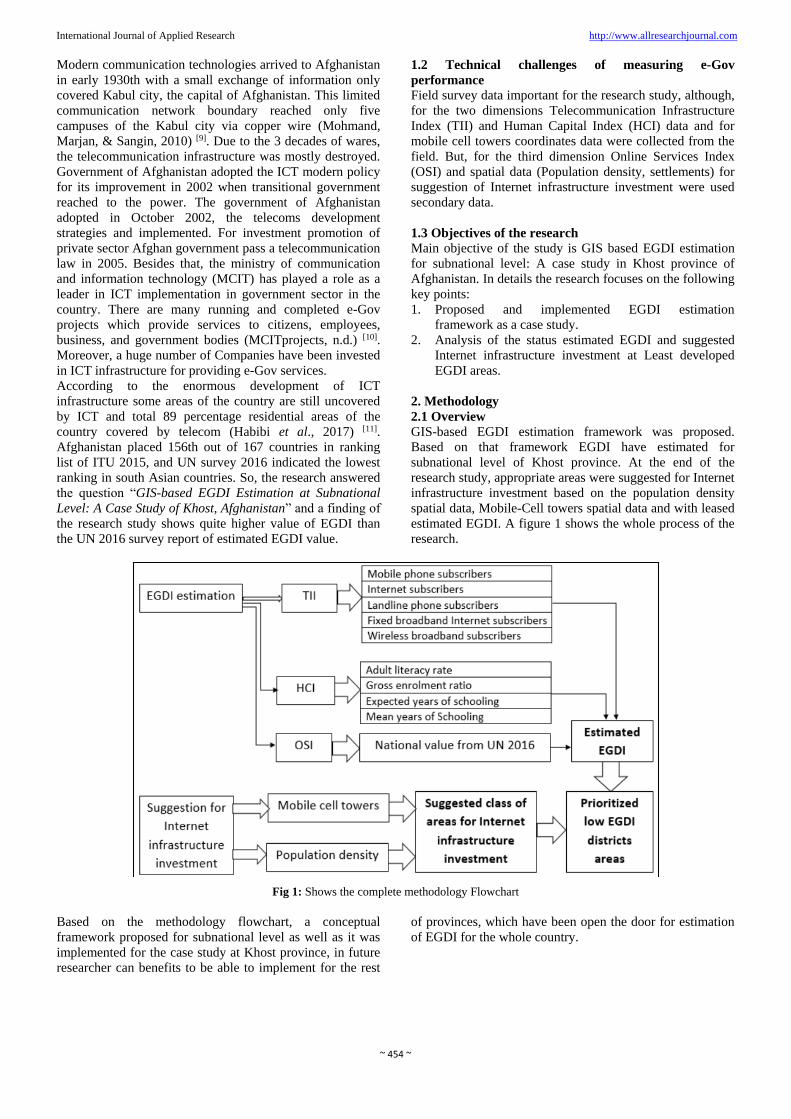
International Journal of Applied Research http://www.allresearchjournal.com
Fig 2: Proposed EGDI estimation framework
According to the UN, 2016 survey report EGDI have three
dimensions, TII, HCI and OSI. TII have five indicators
which can be seen in methodology chart, for all of five
indicators, data was collected through field survey, and each
indicator has 1:5 ratios. HCI have four indicators, which are
mentioned in methodology flowchart, just adult literacy
percentage have 1:3 ratios for calculating of the HCI, the
rest of three indicators have 2:9 ratios. OSI is a third
dimension of EGDI, the value of his dimension was used
from estimated OSI value of UN 2016 survey report. Online
services equally offer to the citizens in covered areas of the
whole country. After review and validation of the
framework by expert bodies, OSI have included to the
research study for EGDI estimation.
2.1 E-Gov development Index (EGDI)
EGDI is a normalized point of average weighted which is
combined from three main dimensions of e-government
such as an Online services quality and scope (Online
Services Index, OSI), The human capital inherent (Human
Capital Index, HCI) and status of improvement of
infrastructure of telecommunication (Telecommunication
Infrastructure Index, TII).
Mathematically, the above three dimension of e-government
and three normalized score of weighted average is called
EGDI [6].
EGDI= 1/3 [OSI Normalized +HCI Normalized + TII Normalized]
To know that the EGDI is equally decided between the three
components first of all a standard procedure of the z-score
would be implemented. EGDI is serve as a benchmark
which is used to show the e-government plan and strategies
development of United Nation members’ countries (UN,
2016) [6].
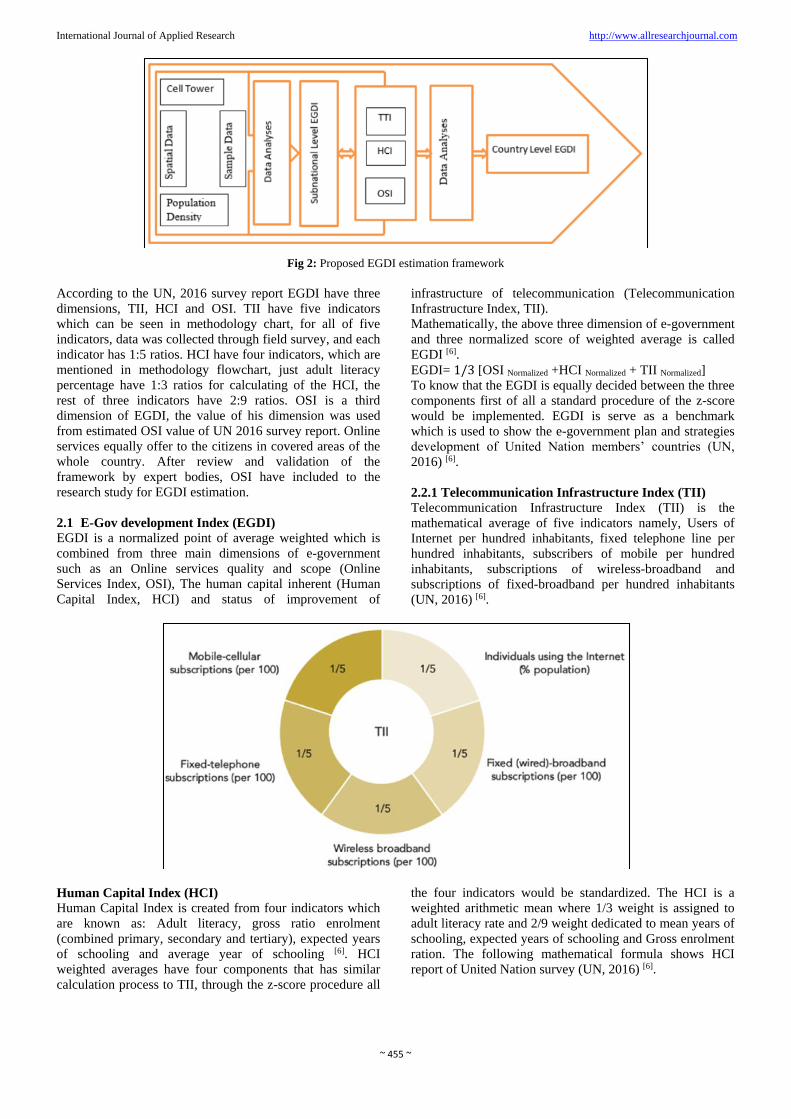
2.2.1 Telecommunication Infrastructure Index (TII)
Telecommunication Infrastructure Index (TII) is the
mathematical average of five indicators namely, Users of
Internet per hundred inhabitants, fixed telephone line per
hundred inhabitants, subscribers of mobile per hundred
inhabitants, subscriptions of wireless-broadband and
subscriptions of fixed-broadband per hundred inhabitants
(UN, 2016) [6].
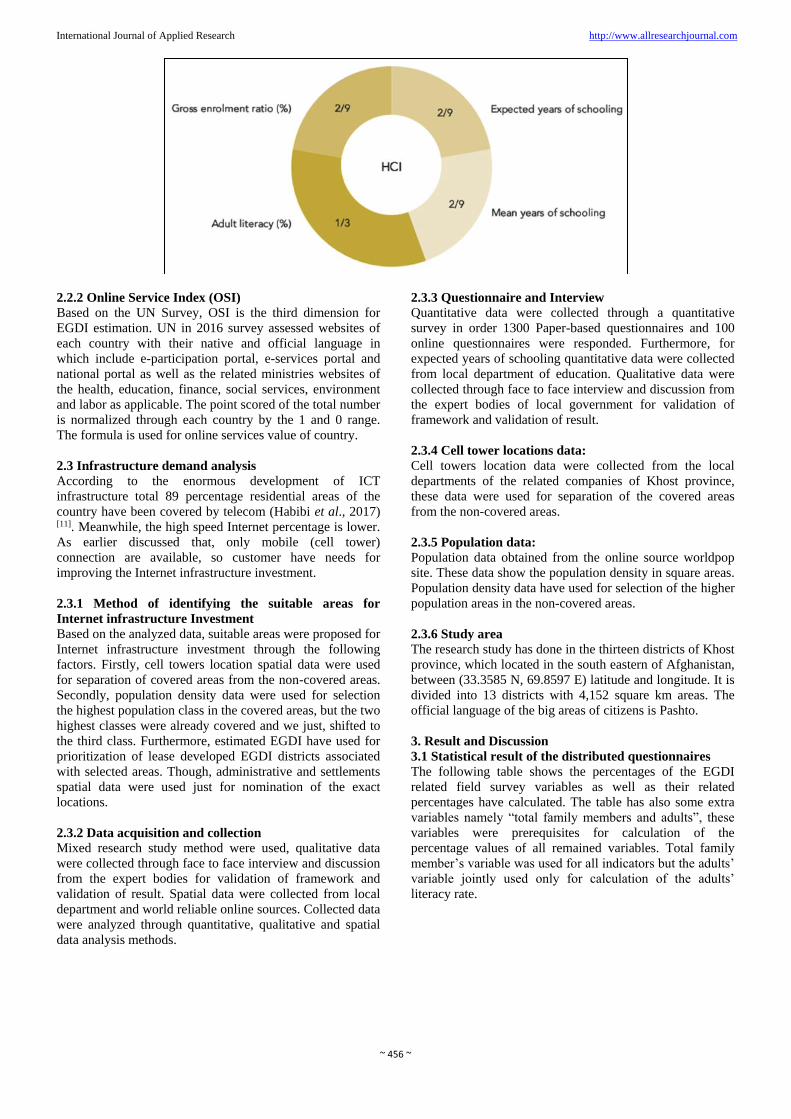
Human Capital Index (HCI)
Human Capital Index is created from four indicators which
are known as: Adult literacy, gross ratio enrolment
(combined primary, secondary and tertiary), expected years
of schooling and average year of schooling [6]. HCI
weighted averages have four components that has similar
calculation process to TII, through the z-score procedure all
the four indicators would be standardized. The HCI is a
weighted arithmetic mean where 1/3 weight is assigned to
adult literacy rate and 2/9 weight dedicated to mean years of
schooling, expected years of schooling and Gross enrolment
ration. The following mathematical formula shows HCI
report of United Nation survey (UN, 2016) [6].
~ 456 ~
International Journal of Applied Research http://www.allresearchjournal.com
2.2.2 Online Service Index (OSI)
Based on the UN Survey, OSI is the third dimension for
EGDI estimation. UN in 2016 survey assessed websites of
each country with their native and official language in
which include e-participation portal, e-services portal and
national portal as well as the related ministries websites of
the health, education, finance, social services, environment
and labor as applicable. The point scored of the total number
is normalized through each country by the 1 and 0 range.
The formula is used for online services value of country.
2.3 Infrastructure demand analysis
According to the enormous development of ICT
infrastructure total 89 percentage residential areas of the
country have been covered by telecom (Habibi et al., 2017) [11]. Meanwhile, the high speed Internet percentage is lower.
As earlier discussed that, only mobile (cell tower)
connection are available, so customer have needs for
improving the Internet infrastructure investment.
2.3.1 Method of identifying the suitable areas for
Internet infrastructure Investment
Based on the analyzed data, suitable areas were proposed for
Internet infrastructure investment through the following
factors. Firstly, cell towers location spatial data were used
for separation of covered areas from the non-covered areas.
Secondly, population density data were used for selection
the highest population class in the covered areas, but the two
highest classes were already covered and we just, shifted to
the third class. Furthermore, estimated EGDI have used for
prioritization of lease developed EGDI districts associated
with selected areas. Though, administrative and settlements
spatial data were used just for nomination of the exact
locations.
2.3.2 Data acquisition and collection
Mixed research study method were used, qualitative data
were collected through face to face interview and discussion
from the expert bodies for validation of framework and
validation of result. Spatial data were collected from local
department and world reliable online sources. Collected data
were analyzed through quantitative, qualitative and spatial
data analysis methods.
2.3.3 Questionnaire and Interview
Quantitative data were collected through a quantitative
survey in order 1300 Paper-based questionnaires and 100
online questionnaires were responded. Furthermore, for
expected years of schooling quantitative data were collected
from local department of education. Qualitative data were
collected through face to face interview and discussion from
the expert bodies of local government for validation of
framework and validation of result.
2.3.4 Cell tower locations data:
Cell towers location data were collected from the local
departments of the related companies of Khost province,
these data were used for separation of the covered areas
from the non-covered areas.
2.3.5 Population data:
Population data obtained from the online source worldpop
site. These data show the population density in square areas.
Population density data have used for selection of the higher
population areas in the non-covered areas.
2.3.6 Study area
The research study has done in the thirteen districts of Khost
province, which located in the south eastern of Afghanistan,
between (33.3585 N, 69.8597 E) latitude and longitude. It is
divided into 13 districts with 4,152 square km areas. The
official language of the big areas of citizens is Pashto.
3. Result and Discussion
3.1 Statistical result of the distributed questionnaires
The following table shows the percentages of the EGDI
related field survey variables as well as their related
percentages have calculated. The table has also some extra
variables namely “total family members and adults”, these
variables were prerequisites for calculation of the
percentage values of all remained variables. Total family
member’s variable was used for all indicators but the adults’
variable jointly used only for calculation of the adults’
literacy rate.
~ 457 ~
International Journal of Applied Research http://www.allresearchjournal.com
Table 1: Shows the variables of collected data and their calculated value.
In the first step, EGDI was estimated for subnational level
of Khost province, in a second step, suggested appropriate
areas for Internet infrastructure investment based on mobile
cell towers, population density and the estimated EGDI.
Field survey data were analyzed for all indicators and
calculated their related percentage values, then their related
mathematical mean and standard deviation values were
calculated which were necessary for calculation of
associated z-scores. Furthermore, z-score have used for
calculation of related composite values, it was used for
calculation of normalized values which shows the rank of
TII and HCI (UN, 2016) [6].
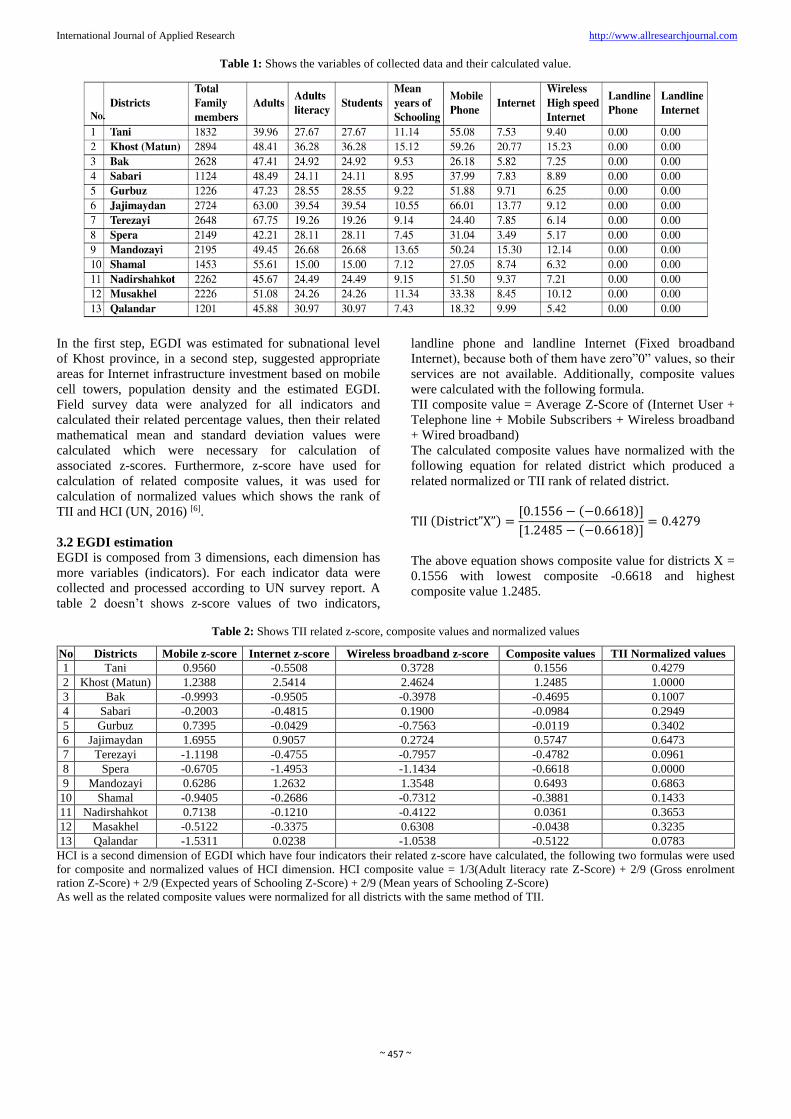
3.2 EGDI estimation
EGDI is composed from 3 dimensions, each dimension has
more variables (indicators). For each indicator data were
collected and processed according to UN survey report. A
table 2 doesn’t shows z-score values of two indicators,
landline phone and landline Internet (Fixed broadband
Internet), because both of them have zero”0” values, so their
services are not available. Additionally, composite values
were calculated with the following formula.
TII composite value = Average Z-Score of (Internet User +
Telephone line + Mobile Subscribers + Wireless broadband
+ Wired broadband)
The calculated composite values have normalized with the
following equation for related district which produced a
related normalized or TII rank of related district.
TII (District”X”) =[0.1556 − (−0.6618)]
[1.2485 − (−0.6618)]= 0.4279
The above equation shows composite value for districts X =
0.1556 with lowest composite -0.6618 and highest
composite value 1.2485.
Table 2: Shows TII related z-score, composite values and normalized values
No Districts Mobile z-score Internet z-score Wireless broadband z-score Composite values TII Normalized values
1 Tani 0.9560 -0.5508 0.3728 0.1556 0.4279
2 Khost (Matun) 1.2388 2.5414 2.4624 1.2485 1.0000
3 Bak -0.9993 -0.9505 -0.3978 -0.4695 0.1007
4 Sabari -0.2003 -0.4815 0.1900 -0.0984 0.2949
5 Gurbuz 0.7395 -0.0429 -0.7563 -0.0119 0.3402
6 Jajimaydan 1.6955 0.9057 0.2724 0.5747 0.6473
7 Terezayi -1.1198 -0.4755 -0.7957 -0.4782 0.0961
8 Spera -0.6705 -1.4953 -1.1434 -0.6618 0.0000
9 Mandozayi 0.6286 1.2632 1.3548 0.6493 0.6863
10 Shamal -0.9405 -0.2686 -0.7312 -0.3881 0.1433
11 Nadirshahkot 0.7138 -0.1210 -0.4122 0.0361 0.3653
12 Masakhel -0.5122 -0.3375 0.6308 -0.0438 0.3235
13 Qalandar -1.5311 0.0238 -1.0538 -0.5122 0.0783
HCI is a second dimension of EGDI which have four indicators their related z-score have calculated, the following two formulas were used
for composite and normalized values of HCI dimension. HCI composite value = 1/3(Adult literacy rate Z-Score) + 2/9 (Gross enrolment
ration Z-Score) + 2/9 (Expected years of Schooling Z-Score) + 2/9 (Mean years of Schooling Z-Score)
As well as the related composite values were normalized for all districts with the same method of TII.
~ 458 ~
International Journal of Applied Research http://www.allresearchjournal.com
Table 3: Shows HCI related z-score, composite values and normalized values
No Districts Z -Score of
Adult literacy
Z-Score of Gross
enrolment ratio
Z -Score of Expected
years of Schooling
Z-Score of Mean
years of Schooling
Composite
values
HCI Normalized
values
1 Tani 0.2142 0.1241 -0.6180 0.5088 0.0747 0.4628
2 Khost (Matun) 1.2081 1.5214 2.4045 2.2544 1.7761 1.0000
3 Bak 1.5279 -0.3224 -0.4326 -0.1974 0.2977 0.5332
4 Sabari -0.0254 -0.4545 -0.1910 -0.4518 -0.2523 0.3595
5 Gurbuz -0.1585 0.2659 0.6180 -0.3333 0.0695 0.4611
6 Jajimaydan 1.8971 2.0499 -0.4888 0.2500 1.0348 0.7659
7 Terezayi -1.1913 -1.2419 0.1798 -0.3684 -0.7150 0.2134
8 Spera -0.0738 0.1942 -1.0112 -1.1096 -0.4527 0.2962
9 Mandozayi 0.1623 -0.0371 1.0674 1.6096 0.6407 0.6415
10 Shamal -1.3849 -1.9329 -0.9944 -1.2544 -1.3909 0.0000
11 Nadirshahkot -0.1462 -0.3926 -0.3933 -0.3640 -0.3043 0.3431
12 Masakhel -0.8185 -0.4304 1.0843 0.5965 0.0050 0.4408
13 Qalandar -1.2122 0.6598 -1.2247 -1.1184 -0.7781 0.1935
OSI is a third component of EGDI, based on the [6] survey report OSI has a higher value 0.3043 and countywide in covered areas offer the
same services. The following formula shows the equal 1:3 ratios of all three criteria for estimation of EGDI.
EGDI =1
3(TIINarmalized + HCINormalized + OSINormalized) In addition, the following table contains all three criteria with each district related values.
Table 4: Shows three different components values
No Districts TII HCI OSI EGDI
1 Khost (Matun) 1.0000 1.0000 0.3043 0.7681
2 Jajimaydan 0.6473 0.7659 0.3043 0.5725
3 Mandozayi 0.6863 0.6415 0.3043 0.5441
4 Tani 0.4279 0.4628 0.3043 0.3983
5 Gurbuz 0.3402 0.4611 0.3043 0.3685
6 Masakhel 0.3235 0.4408 0.3043 0.3562
7 Nadirshahkot 0.3654 0.3431 0.3043 0.3376
8 Sabari 0.2949 0.3595 0.3043 0.3196
9 Bak 0.1006 0.5332 0.3043 0.3127
10 Terezayi 0.0961 0.2134 0.3043 0.2046
11 Spera 0.0000 0.2962 0.3043 0.2002
12 Qalandar 0.0783 0.1935 0.3043 0.1920
13 Shamal 0.1433 0.0000 0.3043 0.1492
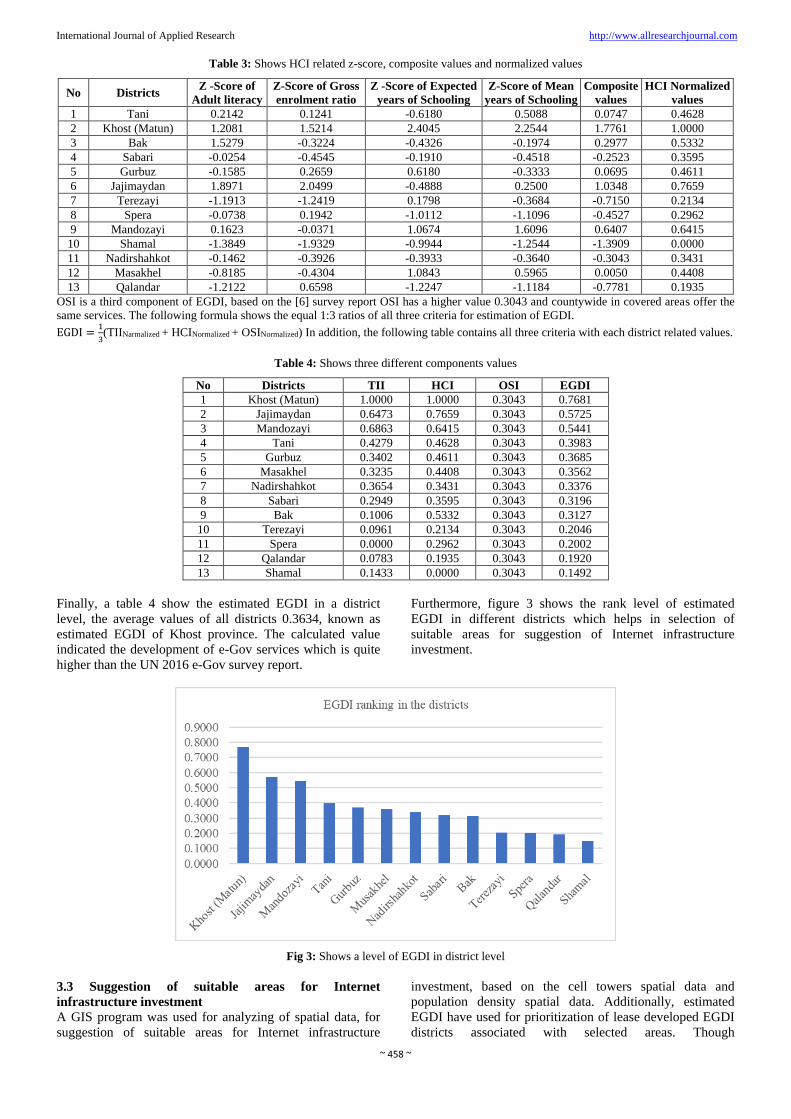
Finally, a table 4 show the estimated EGDI in a district
level, the average values of all districts 0.3634, known as
estimated EGDI of Khost province. The calculated value
indicated the development of e-Gov services which is quite
higher than the UN 2016 e-Gov survey report.
Furthermore, figure 3 shows the rank level of estimated
EGDI in different districts which helps in selection of
suitable areas for suggestion of Internet infrastructure
investment.
Fig 3: Shows a level of EGDI in district level
3.3 Suggestion of suitable areas for Internet
infrastructure investment
A GIS program was used for analyzing of spatial data, for
suggestion of suitable areas for Internet infrastructure
investment, based on the cell towers spatial data and
population density spatial data. Additionally, estimated
EGDI have used for prioritization of lease developed EGDI
districts associated with selected areas. Though
~ 459 ~
International Journal of Applied Research http://www.allresearchjournal.com
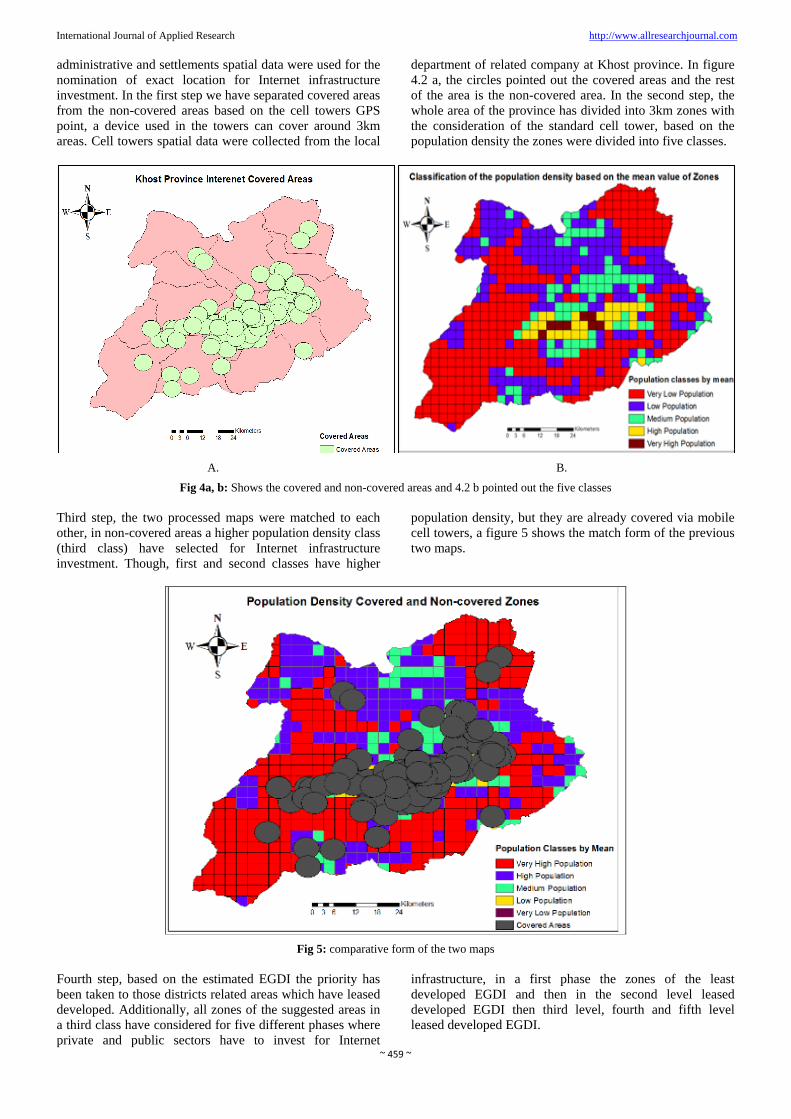
administrative and settlements spatial data were used for the
nomination of exact location for Internet infrastructure
investment. In the first step we have separated covered areas
from the non-covered areas based on the cell towers GPS
point, a device used in the towers can cover around 3km
areas. Cell towers spatial data were collected from the local
department of related company at Khost province. In figure
4.2 a, the circles pointed out the covered areas and the rest
of the area is the non-covered area. In the second step, the
whole area of the province has divided into 3km zones with
the consideration of the standard cell tower, based on the
population density the zones were divided into five classes.
A. B.
Fig 4a, b: Shows the covered and non-covered areas and 4.2 b pointed out the five classes
Third step, the two processed maps were matched to each
other, in non-covered areas a higher population density class
(third class) have selected for Internet infrastructure
investment. Though, first and second classes have higher
population density, but they are already covered via mobile
cell towers, a figure 5 shows the match form of the previous
two maps.
Fig 5: comparative form of the two maps
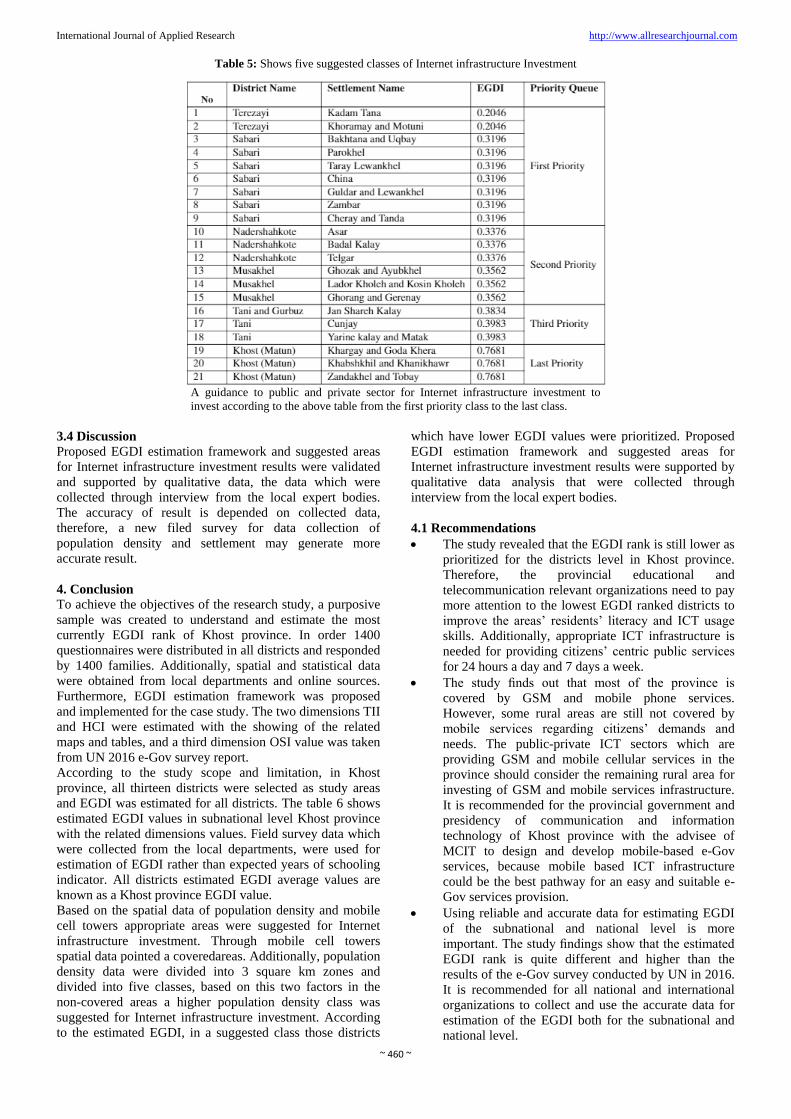
Fourth step, based on the estimated EGDI the priority has
been taken to those districts related areas which have leased
developed. Additionally, all zones of the suggested areas in
a third class have considered for five different phases where
private and public sectors have to invest for Internet
infrastructure, in a first phase the zones of the least
developed EGDI and then in the second level leased
developed EGDI then third level, fourth and fifth level
leased developed EGDI.
~ 460 ~
International Journal of Applied Research http://www.allresearchjournal.com
Table 5: Shows five suggested classes of Internet infrastructure Investment
A guidance to public and private sector for Internet infrastructure investment to
invest according to the above table from the first priority class to the last class.
3.4 Discussion
Proposed EGDI estimation framework and suggested areas
for Internet infrastructure investment results were validated
and supported by qualitative data, the data which were
collected through interview from the local expert bodies.
The accuracy of result is depended on collected data,
therefore, a new filed survey for data collection of
population density and settlement may generate more
accurate result.
4. Conclusion
To achieve the objectives of the research study, a purposive
sample was created to understand and estimate the most
currently EGDI rank of Khost province. In order 1400
questionnaires were distributed in all districts and responded
by 1400 families. Additionally, spatial and statistical data
were obtained from local departments and online sources.
Furthermore, EGDI estimation framework was proposed
and implemented for the case study. The two dimensions TII
and HCI were estimated with the showing of the related
maps and tables, and a third dimension OSI value was taken
from UN 2016 e-Gov survey report.
According to the study scope and limitation, in Khost
province, all thirteen districts were selected as study areas
and EGDI was estimated for all districts. The table 6 shows
estimated EGDI values in subnational level Khost province
with the related dimensions values. Field survey data which
were collected from the local departments, were used for
estimation of EGDI rather than expected years of schooling
indicator. All districts estimated EGDI average values are
known as a Khost province EGDI value.
Based on the spatial data of population density and mobile
cell towers appropriate areas were suggested for Internet
infrastructure investment. Through mobile cell towers
spatial data pointed a coveredareas. Additionally, population
density data were divided into 3 square km zones and
divided into five classes, based on this two factors in the
non-covered areas a higher population density class was
suggested for Internet infrastructure investment. According
to the estimated EGDI, in a suggested class those districts
which have lower EGDI values were prioritized. Proposed
EGDI estimation framework and suggested areas for
Internet infrastructure investment results were supported by
qualitative data analysis that were collected through
interview from the local expert bodies.
4.1 Recommendations
The study revealed that the EGDI rank is still lower as
prioritized for the districts level in Khost province.
Therefore, the provincial educational and
telecommunication relevant organizations need to pay
more attention to the lowest EGDI ranked districts to
improve the areas’ residents’ literacy and ICT usage
skills. Additionally, appropriate ICT infrastructure is
needed for providing citizens’ centric public services
for 24 hours a day and 7 days a week.
The study finds out that most of the province is
covered by GSM and mobile phone services.
However, some rural areas are still not covered by
mobile services regarding citizens’ demands and
needs. The public-private ICT sectors which are
providing GSM and mobile cellular services in the
province should consider the remaining rural area for
investing of GSM and mobile services infrastructure.
It is recommended for the provincial government and
presidency of communication and information
technology of Khost province with the advisee of
MCIT to design and develop mobile-based e-Gov
services, because mobile based ICT infrastructure
could be the best pathway for an easy and suitable e-
Gov services provision.
Using reliable and accurate data for estimating EGDI
of the subnational and national level is more
important. The study findings show that the estimated
EGDI rank is quite different and higher than the
results of the e-Gov survey conducted by UN in 2016.
It is recommended for all national and international
organizations to collect and use the accurate data for
estimation of the EGDI both for the subnational and
national level.
~ 461 ~
International Journal of Applied Research http://www.allresearchjournal.com
E-Gov services’ infrastructure in many districts are
still in a preliminary stage in the context of Khost
province. The research findings are opening the door
for the Public and Private Partnership (PPP) and other
governmental organizations to invest in providing
Internet, e-public services, e-educational services, e-
health services and etc.
4.2 Future work
Regarding future work, the proposed GIS based EGDI
estimation framework is recommended to be implemented
for other provinces too. This implementation will help
national and international organizations to estimate EGDI
accurately for subnational and national level in context of
Afghanistan. Additionally, the study re-estimated two
dimensions of EGDI including TII and HCI. It is
recommended to re-estimate the third dimension OSI too,
because the TII and HCI values for calculating EGDI were
quite different from the value of UN survey conducted in
2016. The OSI re-estimation may explore more accuracy in
the estimation of EGDI.
5. Acknowledgement
Without proper guide and suggestion publishing research
paper is not a simple work. In this research paper, my dear
guider and supervisor Dr. Hiroyuki Miyazaki has provided
me this opportunity to write a research paper under the topic
E-Government Development Index (EGDI) Estimation and
Suggestion for Improvement: A Case Study of Khost
Province Afghanistan. I am deeply happy and want to say
special thanks Sir. Furthermore, I also want to say bundle of
thanks to Asian Institute of Technology especially School of
Engineering and Technology and the Department of
Information and Communication Technology.
6. Reference
1. Oseni KO, Dingley K, Hart P. Barriers facing e-service
technology in developing countries: A structured
literature review with Nigeria as a case study. In
Information society (i-society), 2015 international
conference on 2015, 97-103.
2. Alateyah S, Crowder RM, Wills GB. Citizen adoption
of e-government services. In Information society (i-
society), 2012 international conference on 2012, 182-
187.
3. Alshehri M, Drew S. Challenges of e-government
services adoption in Saudi Arabia from an e-ready
citizen perspective. World Academy of Science,
Engineering and Technology, 2010, 66.
4. Rehman M, Esichaikul V. Factors influencing the
adoption of e-government in Pakistan. In E-business
and e-government (icee), 2011 international conference
on, 2011, 1-4.
5. Sang S, Lee JD. A conceptual model of e-government
acceptance in public sector. In Digital society, 2009.
icds’09. third international conference on 2009, 71-76.
6. UN. United nation e-government survey 2016.
7. Wentz L, Kramer F, Starr S. Information and
communication technologies for reconstruction and
development: Afghanistan challenges and opportunities
(Tech. Rep.). National Defense Univ Washington Dc
Center for Technology and National Security Policy,
2008.
8. Senthil Kumar K. Recent trends of ict services and the
present scenario of some selected engineering college
libraries in Coimbatore district, Tamilnadu: A study,
2017.
9. Mohmand AM, Marjan A, Sangin A. Developing e-
government in Afghanistan. In Proceedings of the 4th
international conference on theory and practice of
electronic governance, 2010, 43-48.
10. MCIT projects. (n.d.). Ministry of communication and
information technology running and completed
projects.
11. Habibi MA, Ulman M, Baha B, Stoces M.
Measurement and statistical analysis of end user
satisfaction with mobile network coverage in
Afghanistan. Ar Xiv preprint arXiv:1706.06933, 2017.