Embed Size (px)
Citation preview
E-Commerce Logistics DriversJohn Callan – UrsaMajor Associates
Shea Felix - EndiciaCooper Smith – Business Insider
The Future of DeliveryMatt Swain – InfoTrends
Gary Reblin - USPS
E-Commerce Logistics Drivers / The Future of Delivery
Cooper Smith – Business Insider
Brody Buhler - Accentúre
Matt Swain - InfoTrends
Gary Reblin - USPS
Amine Khechfé - Endicia
PostalVision2020
March 2015
3
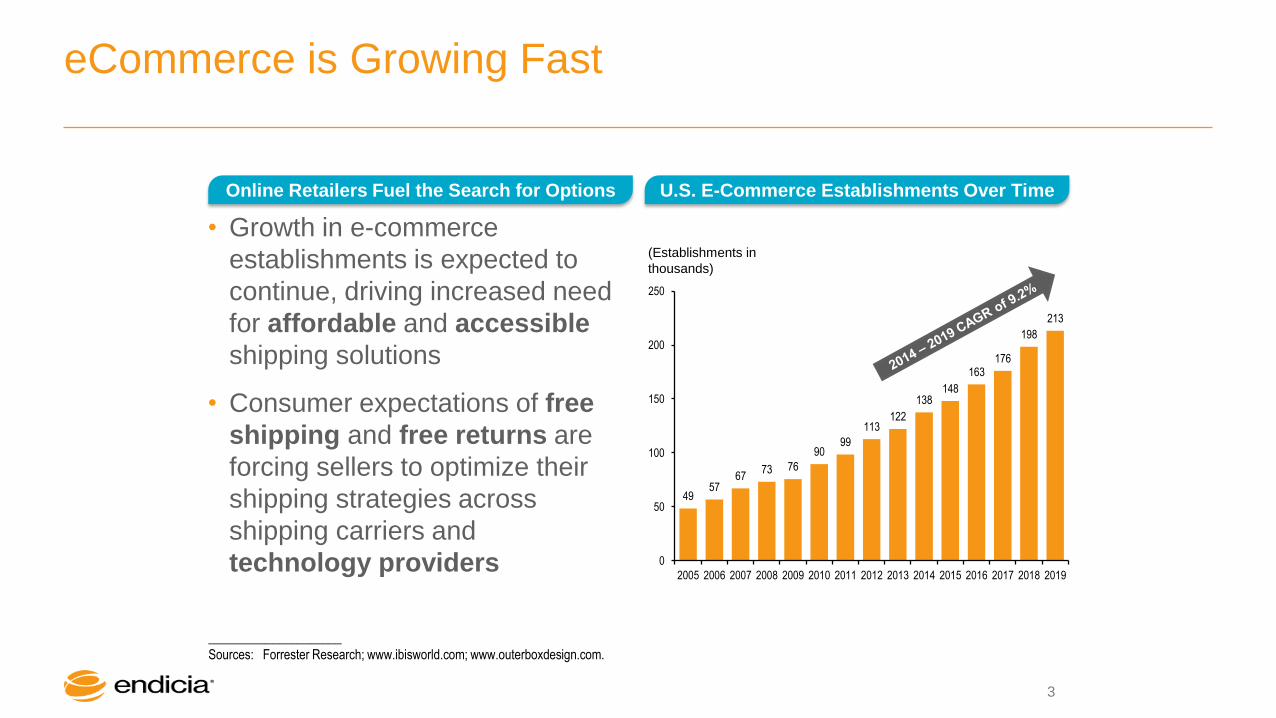
eCommerce is Growing Fast
U.S. E-Commerce Establishments Over Time
_____________________
Sources: Forrester Research; www.ibisworld.com; www.outerboxdesign.com.
4957
6773 76
9099
113122
138148
163176
198
213
0
50
100
150
200
250
2005 2006 2007 2008 2009 2010 2011 2012 2013 2014 2015 2016 2017 2018 2019
(Establishments in
thousands)
Online Retailers Fuel the Search for Options
• Growth in e-commerce
establishments is expected to
continue, driving increased need
for affordable and accessible
shipping solutions
• Consumer expectations of free
shipping and free returns are
forcing sellers to optimize their
shipping strategies across
shipping carriers and
technology providers
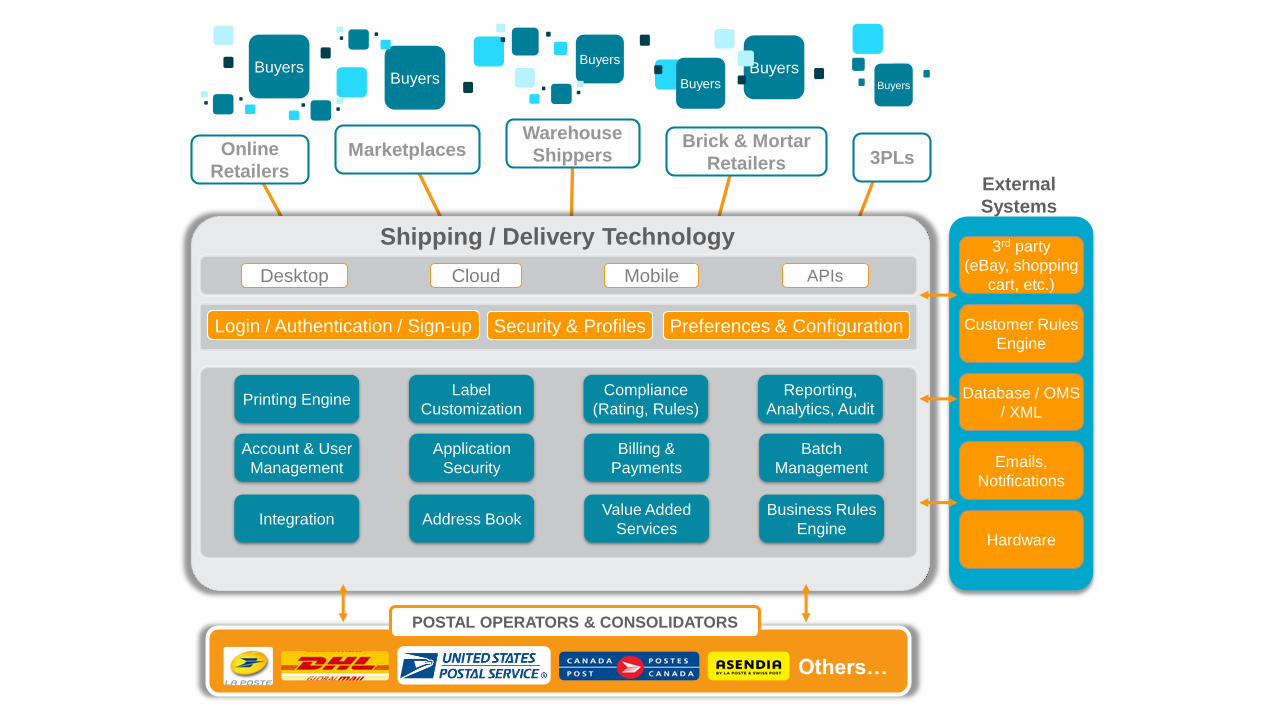
BuyersBuyers
BuyersBuyers
Buyers Buyers
Desktop Cloud Mobile APIs
Shipping / Delivery Technology
Online
RetailersMarketplaces Brick & Mortar
Retailers
Warehouse
Shippers 3PLs
Login / Authentication / Sign-up Preferences & ConfigurationSecurity & Profiles
Printing EngineLabel
Customization
Integration
Batch
Management
Reporting,
Analytics, Audit
Account & User
Management
Address Book
Compliance
(Rating, Rules)
Value Added
Services
Business Rules
Engine
Application
Security
Billing &
Payments
External
Systems
Database / OMS
/ XML
Emails,
Notifications
3rd party
(eBay, shopping
cart, etc.)
Hardware
Customer Rules
Engine
Others…
POSTAL OPERATORS & CONSOLIDATORS

thanks!

A Research Service By Business Insider
E-Commerce Logistics Drivers
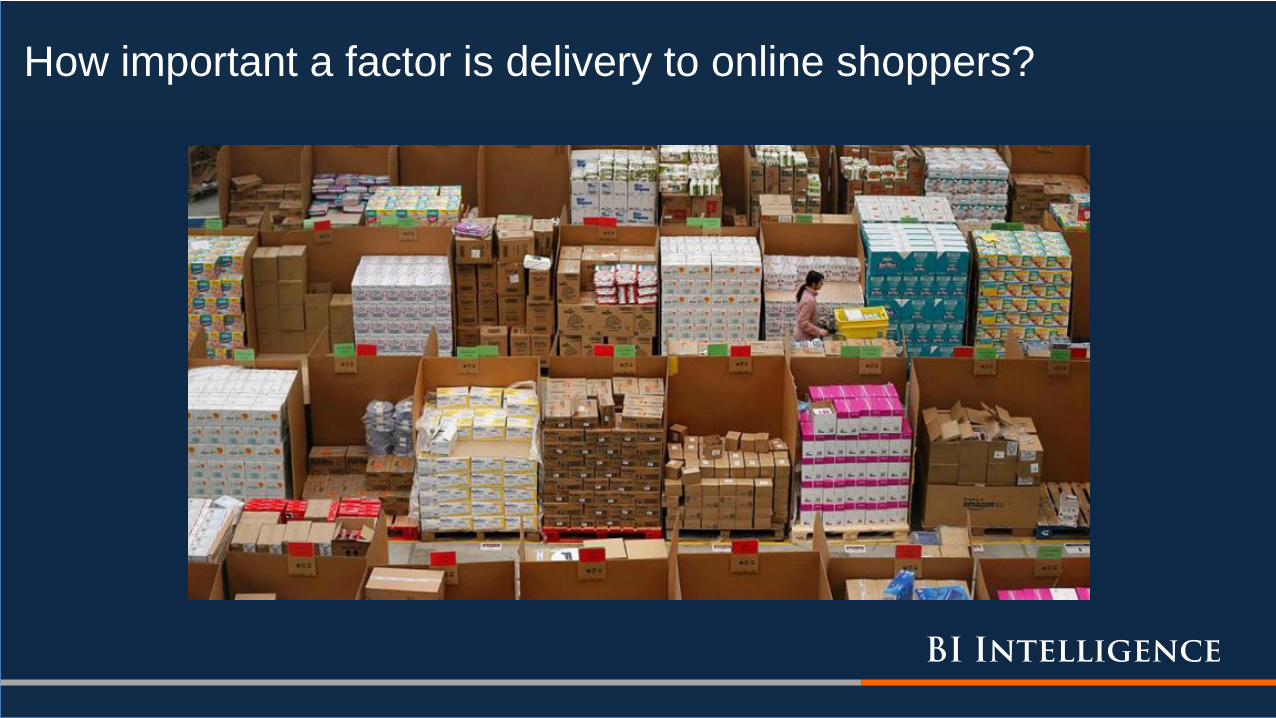
How important a factor is delivery to online shoppers?
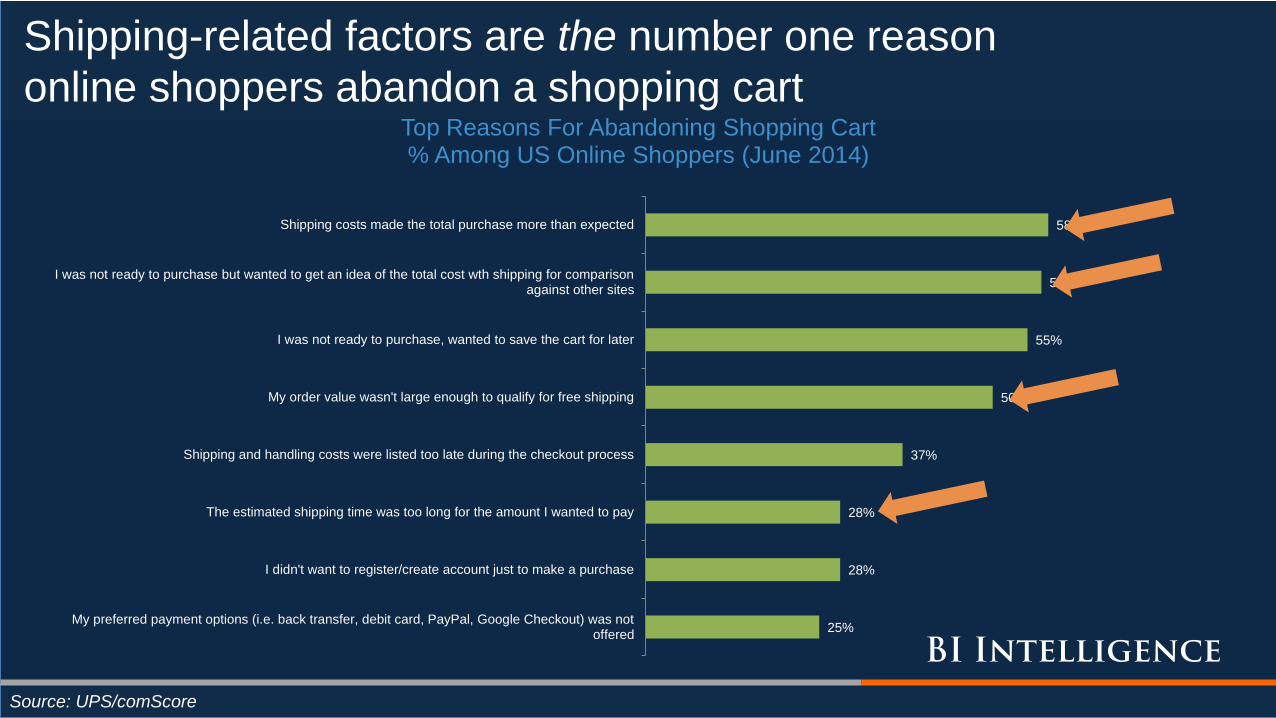
Shipping-related factors are the number one reason
online shoppers abandon a shopping cart
Source: UPS/comScore
25%
28%
28%
37%
50%
55%
57%
58%
My preferred payment options (i.e. back transfer, debit card, PayPal, Google Checkout) was notoffered
I didn't want to register/create account just to make a purchase
The estimated shipping time was too long for the amount I wanted to pay
Shipping and handling costs were listed too late during the checkout process
My order value wasn't large enough to qualify for free shipping
I was not ready to purchase, wanted to save the cart for later
I was not ready to purchase but wanted to get an idea of the total cost wth shipping for comparisonagainst other sites
Shipping costs made the total purchase more than expected
Top Reasons For Abandoning Shopping Cart% Among US Online Shoppers (June 2014)
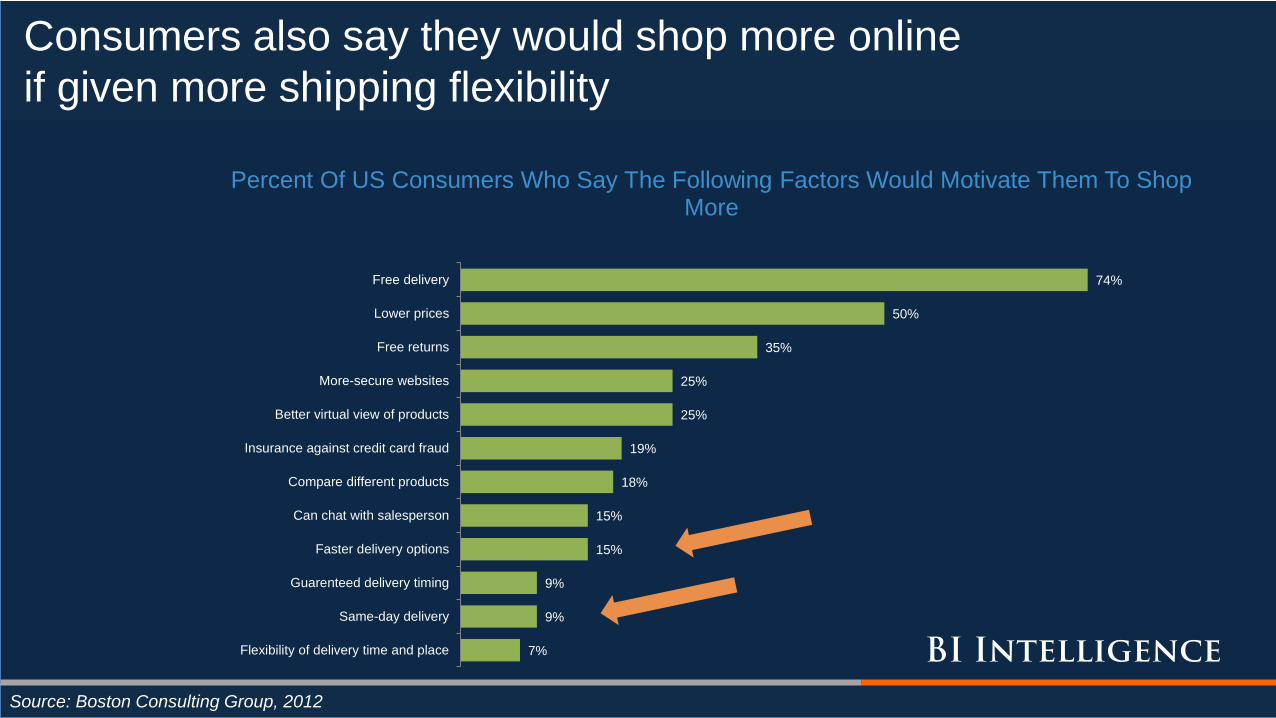
Consumers also say they would shop more online
if given more shipping flexibility
Source: Boston Consulting Group, 2012
7%
9%
9%
15%
15%
18%
19%
25%
25%
35%
50%
74%
Flexibility of delivery time and place
Same-day delivery
Guarenteed delivery timing
Faster delivery options
Can chat with salesperson
Compare different products
Insurance against credit card fraud
Better virtual view of products
More-secure websites
Free returns
Lower prices
Free delivery
Percent Of US Consumers Who Say The Following Factors Would Motivate Them To Shop More
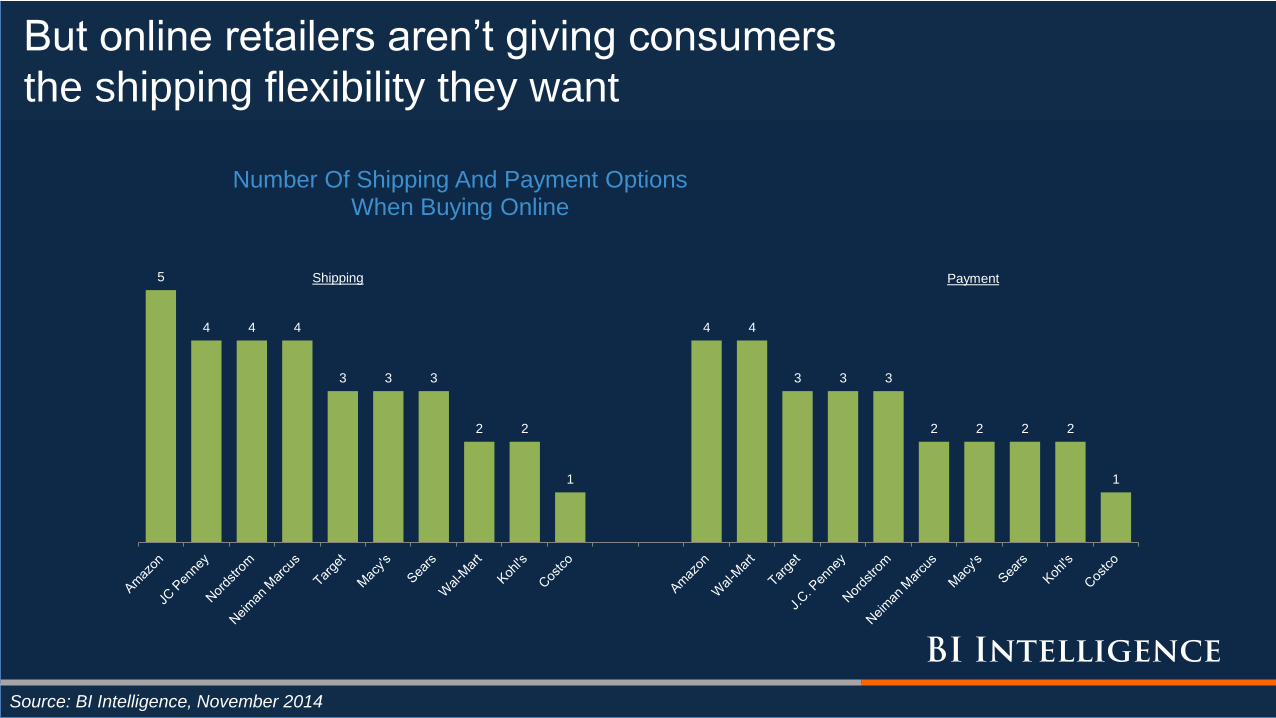
But online retailers aren’t giving consumers
the shipping flexibility they want
Source: BI Intelligence, November 2014
5
4 4 4
3 3 3
2 2
1
4 4
3 3 3
2 2 2 2
1
Number Of Shipping And Payment Options When Buying Online
Shipping Payment
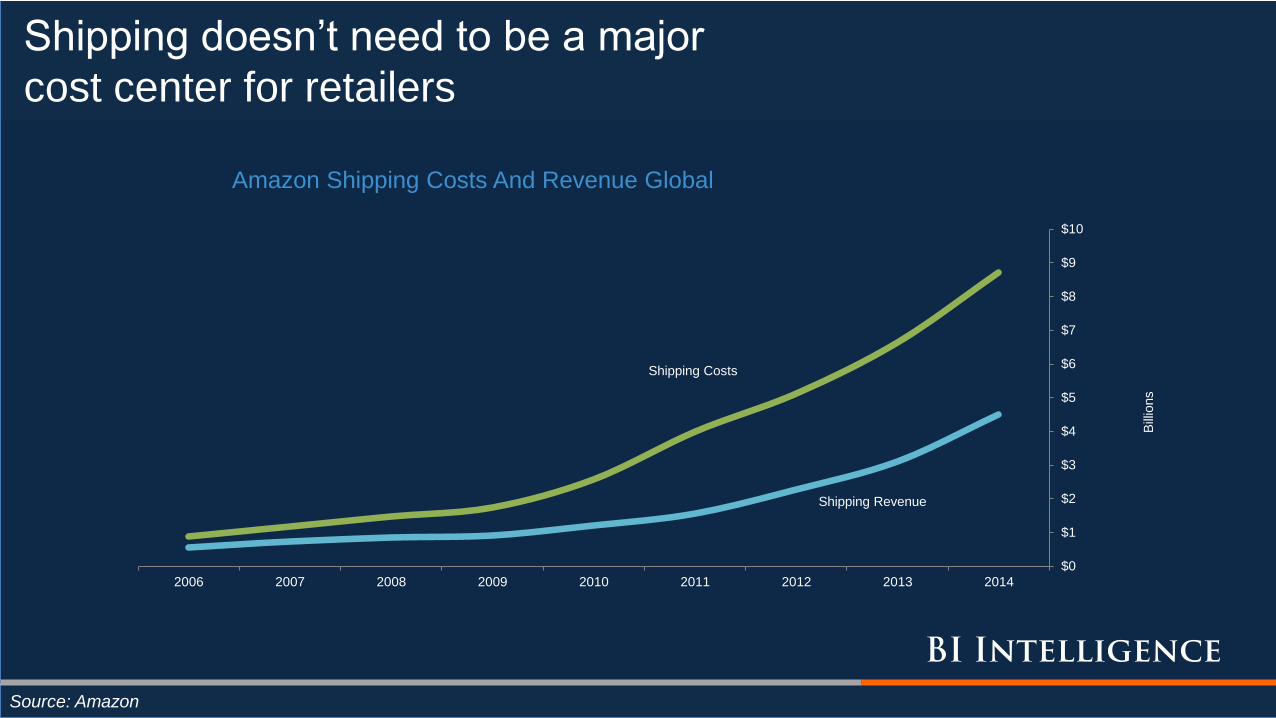
Shipping doesn’t need to be a major
cost center for retailers
Source: Amazon
$0
$1
$2
$3
$4
$5
$6
$7
$8
$9
$10
2006 2007 2008 2009 2010 2011 2012 2013 2014
Bill
ions
Amazon Shipping Costs And Revenue Global
Shipping Revenue
Shipping Costs
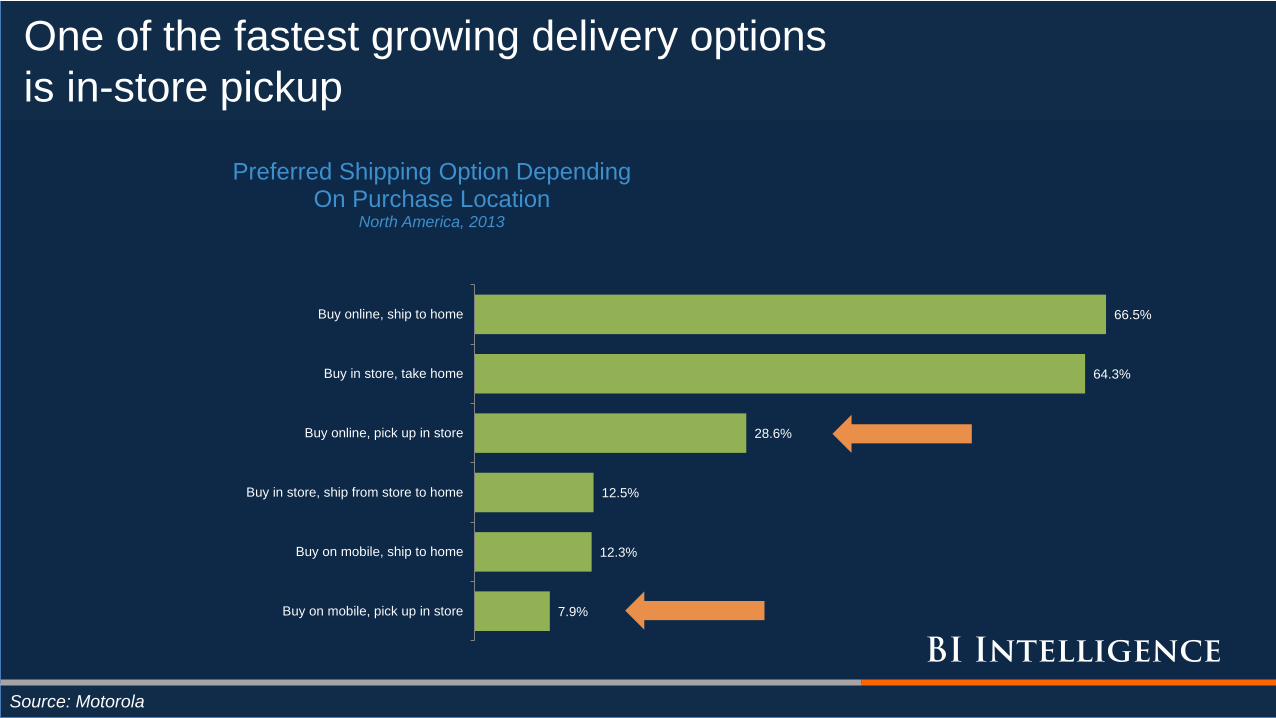
One of the fastest growing delivery options
is in-store pickup
Source: Motorola
7.9%
12.3%
12.5%
28.6%
64.3%
66.5%
Buy on mobile, pick up in store
Buy on mobile, ship to home
Buy in store, ship from store to home
Buy online, pick up in store
Buy in store, take home
Buy online, ship to home
Preferred Shipping Option Depending On Purchase Location
North America, 2013
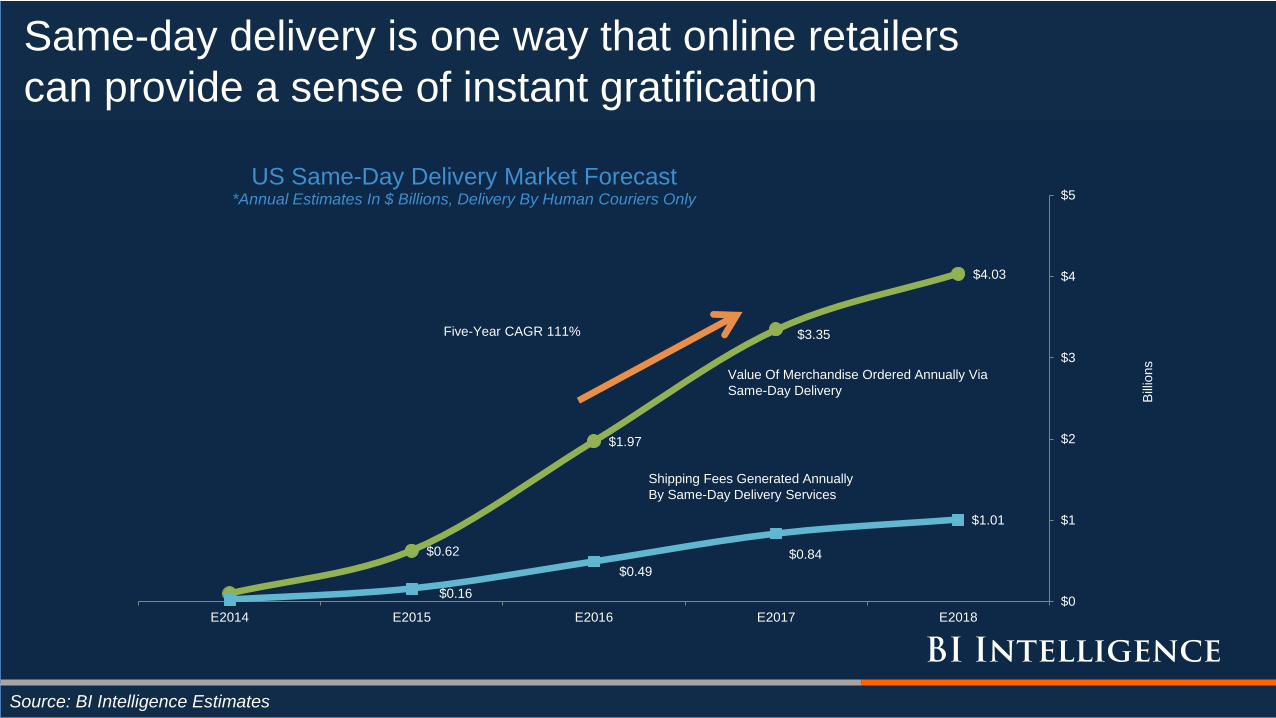
Same-day delivery is one way that online retailers
can provide a sense of instant gratification
Source: BI Intelligence Estimates
$0.62
$1.97
$3.35
$4.03
$0.16
$0.49
$0.84
$1.01
$0
$1
$2
$3
$4
$5
E2014 E2015 E2016 E2017 E2018
Bill
ions
US Same-Day Delivery Market Forecast*Annual Estimates In $ Billions, Delivery By Human Couriers Only
Value Of Merchandise Ordered Annually Via
Same-Day Delivery
Shipping Fees Generated Annually
By Same-Day Delivery Services
Five-Year CAGR 111%
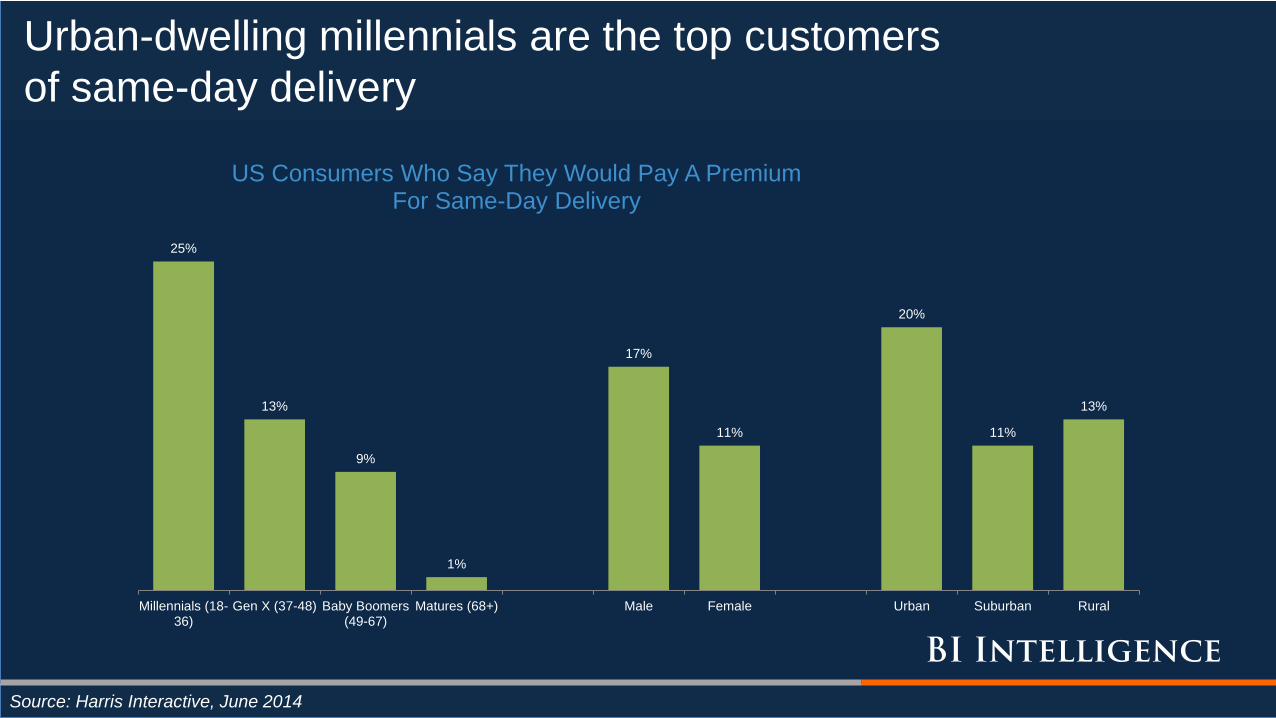
Urban-dwelling millennials are the top customers
of same-day delivery
Source: Harris Interactive, June 2014
25%
13%
9%
1%
17%
11%
20%
11%
13%
Millennials (18-36)
Gen X (37-48) Baby Boomers(49-67)
Matures (68+) Male Female Urban Suburban Rural
US Consumers Who Say They Would Pay A Premium For Same-Day Delivery
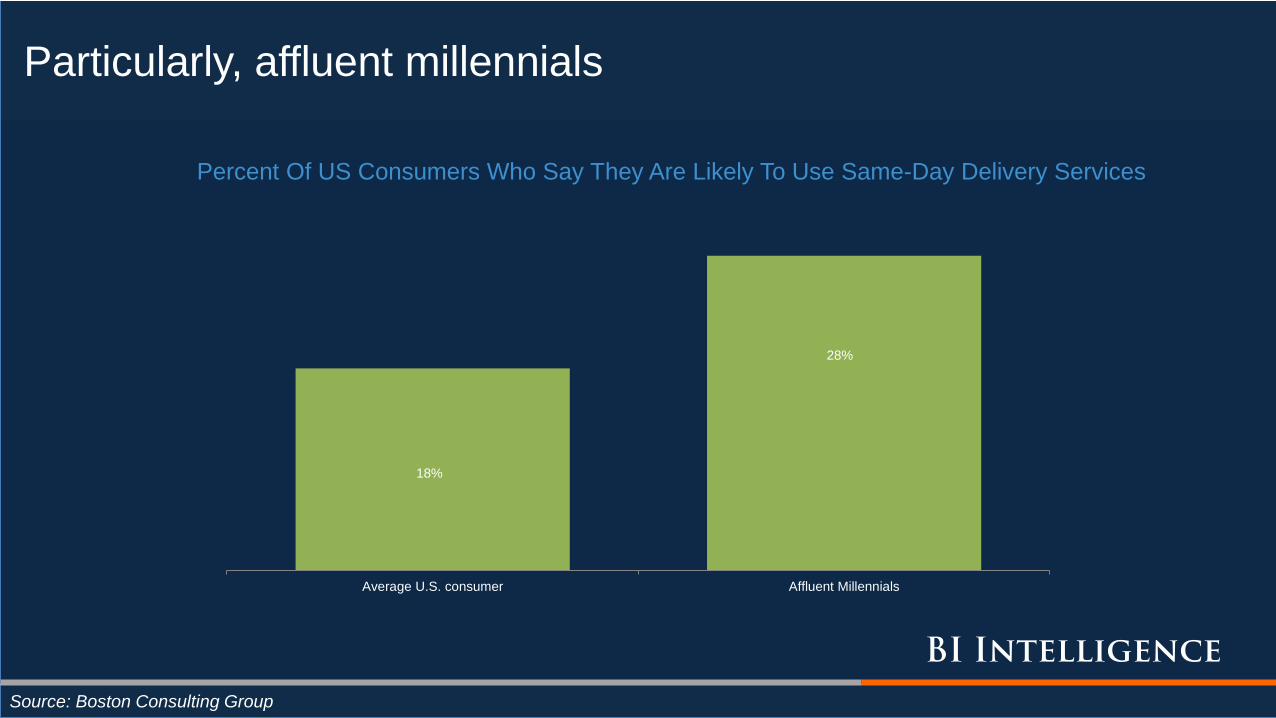
Particularly, affluent millennials
Source: Boston Consulting Group
18%
28%
Average U.S. consumer Affluent Millennials
Percent Of US Consumers Who Say They Are Likely To Use Same-Day Delivery Services
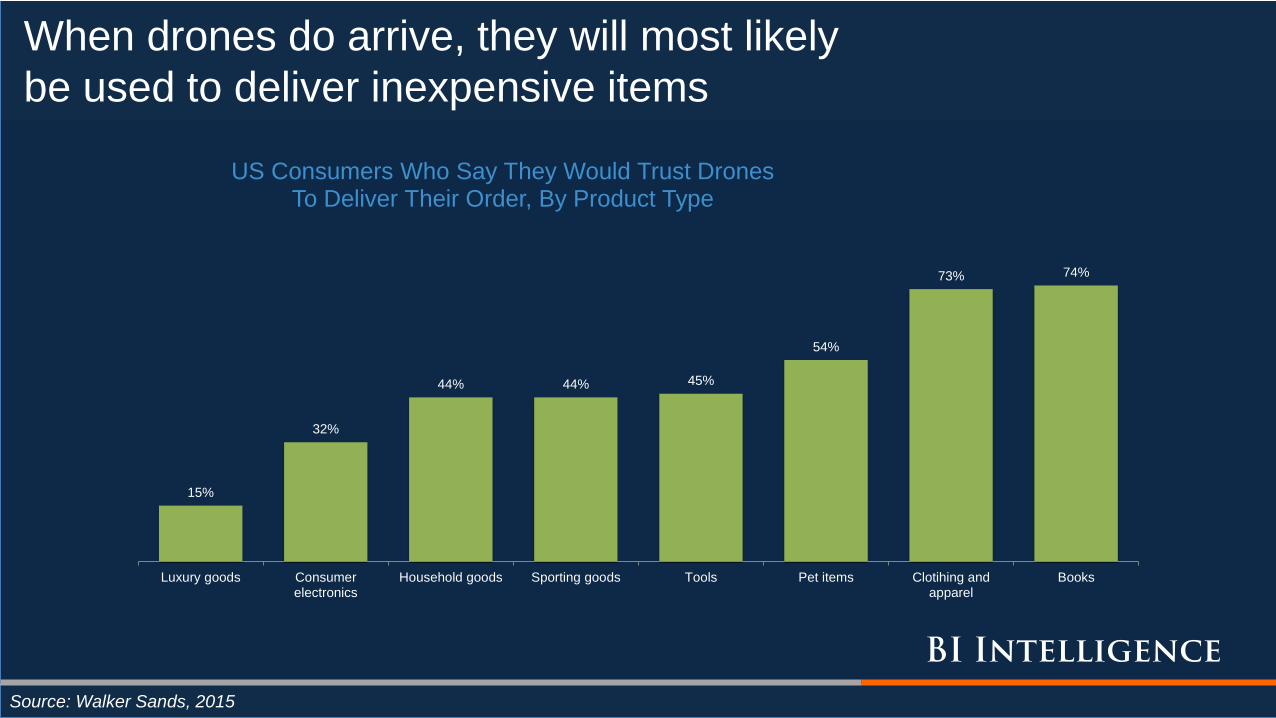
When drones do arrive, they will most likely
be used to deliver inexpensive items
Source: Walker Sands, 2015
15%
32%
44% 44% 45%
54%
73% 74%
Luxury goods Consumerelectronics
Household goods Sporting goods Tools Pet items Clotihing andapparel
Books
US Consumers Who Say They Would Trust Drones To Deliver Their Order, By Product Type
intelligence.businessinsider.com
BI Intelligence
Henry Blodget
CEO & Editor-in-Chief
Emily Adler
Senior Research Editor
Marcelo Ballvé
Editorial Director
Cale Weissman
Reporter
Evan Bakker
Research Associate
John Greenough
Research Analyst
Jessica Smith
Research Associate
Tony Danova
Senior Research Analyst
Mark Hoelzel
Research Analyst
John Heggestuen
Research Analyst
Cooper Smith
Senior Research Analyst
PostalVision 2020 – New
Delivery ModelsMarch 2015
19
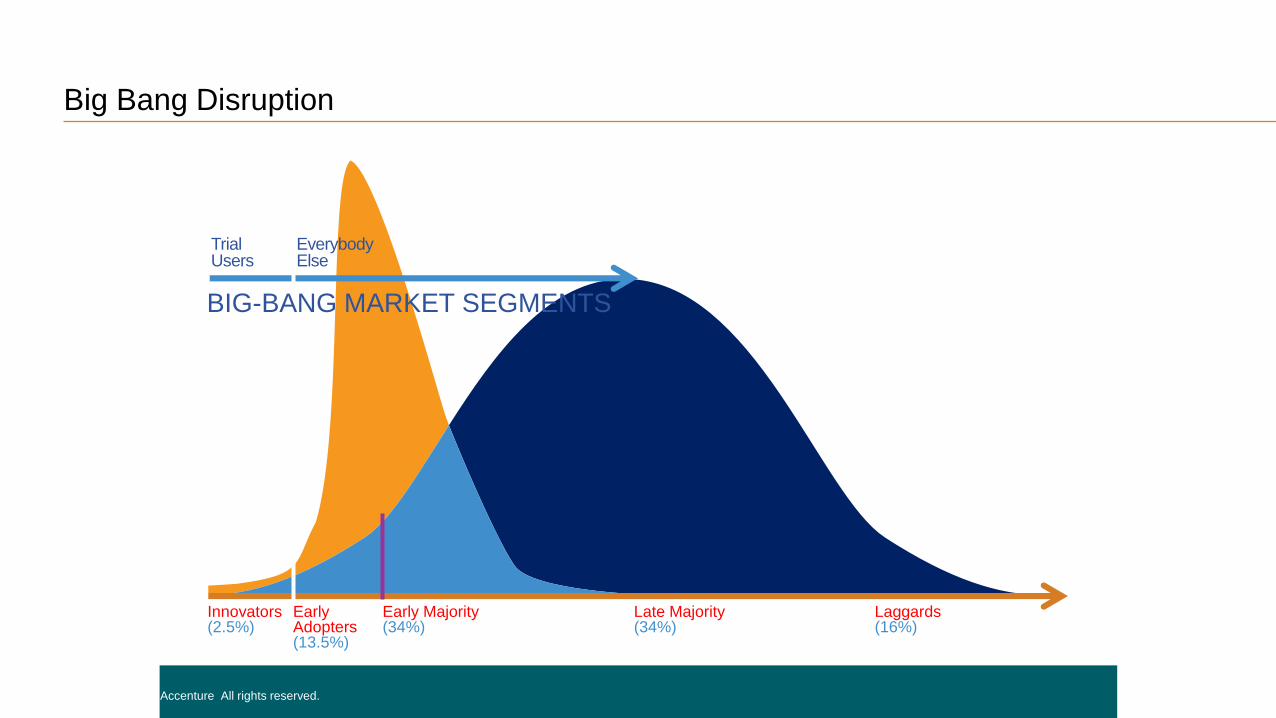
Big Bang Disruption
Copyright © 2015 Accenture All rights reserved.
Trial Users
Everybody Else
Innovators(2.5%)
Early Adopters (13.5%)
Early Majority (34%)
Late Majority (34%)
Laggards(16%)
BIG-BANG MARKET SEGMENTS
20
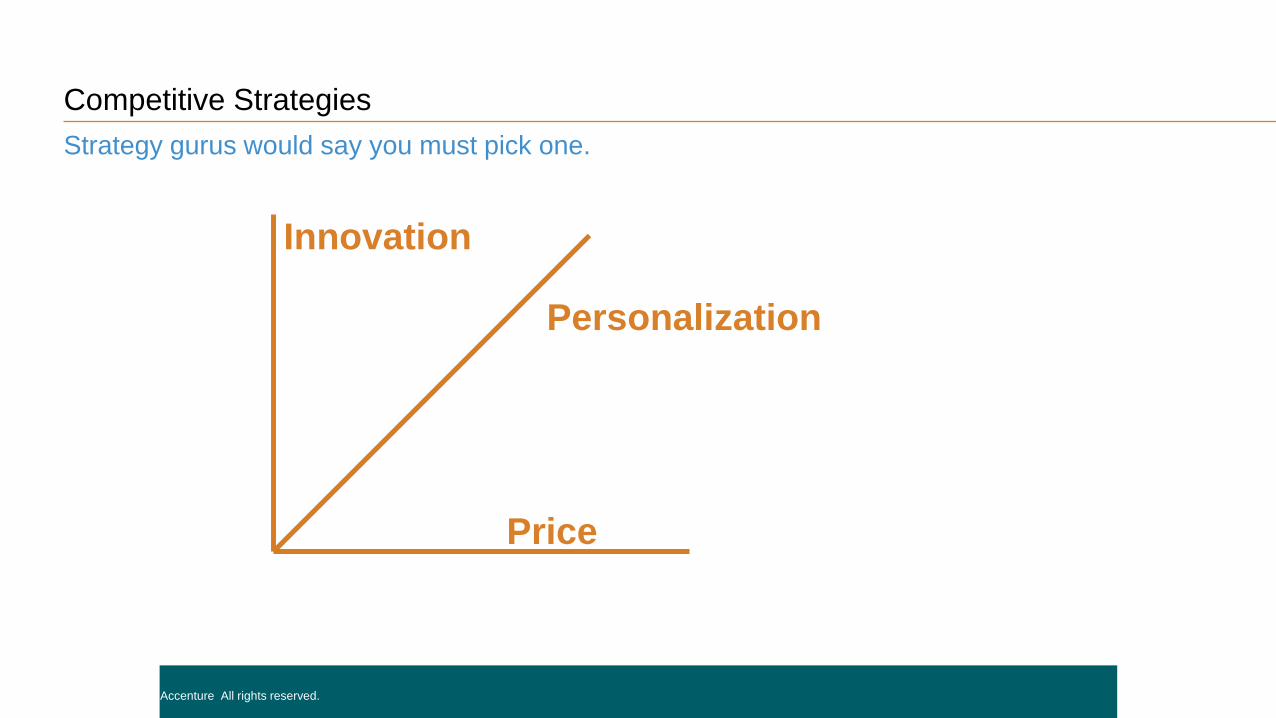
Competitive Strategies
Strategy gurus would say you must pick one.
Copyright © 2015 Accenture All rights reserved.
Price
Innovation
Personalization
21
Big Bang
The Big Bang theory suggests that new models compete on all three.
Copyright © 2015 Accenture All rights reserved.
Better
Cheaper
More Personalized
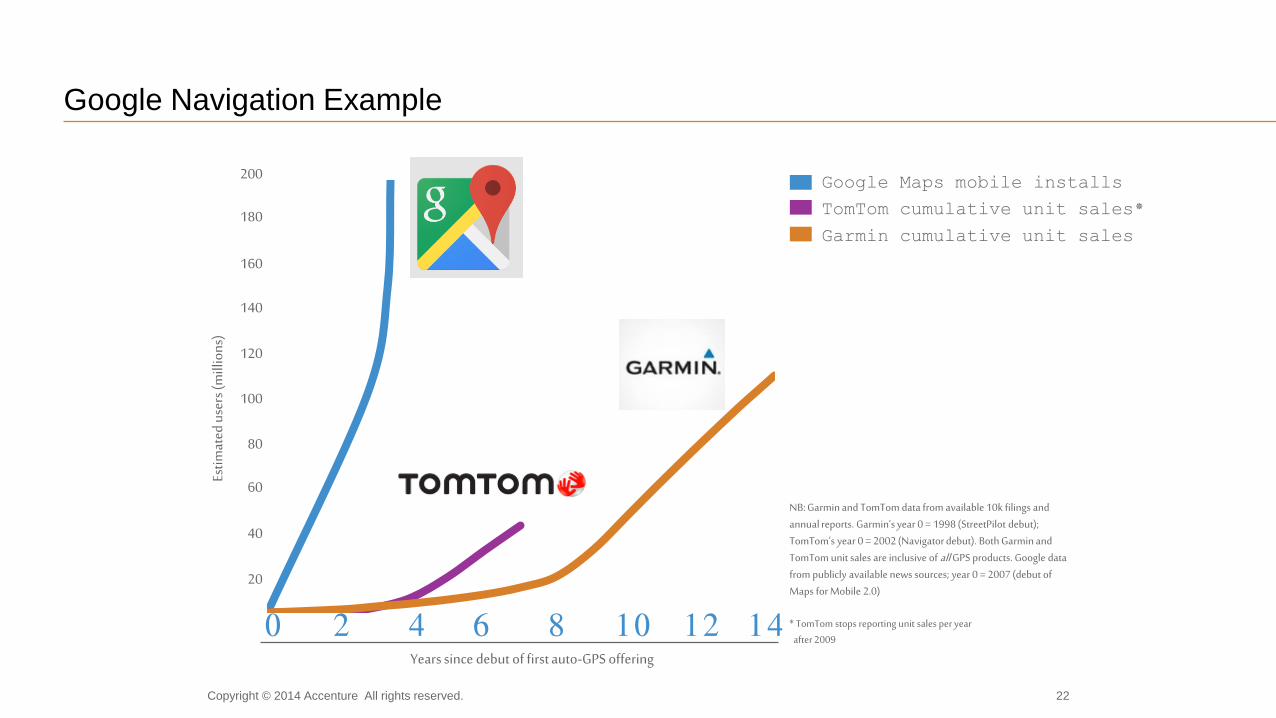
Google Navigation Example
NB: Garmin and TomTom data from available 10k filings and annual reports. Garmin’s year 0 = 1998 (StreetPilot debut); TomTom’s year 0 = 2002 (Navigator debut). Both Garmin and TomTom unit sales are inclusive of all GPS products. Google data from publicly available news sources; year 0 = 2007 (debut of Maps for Mobile 2.0)
* TomTom stops reporting unit sales per yearafter 2009
0 2Years since debut of first auto-GPS offering
4 6 8 10 12 14
200
180
160
140
120
100
80
60
40
20
Estim
ated
use
rs (m
illio
ns)
Google Maps mobile installs
TomTom cumulative unit sales*
Garmin cumulative unit sales
Copyright © 2014 Accenture All rights reserved. 22
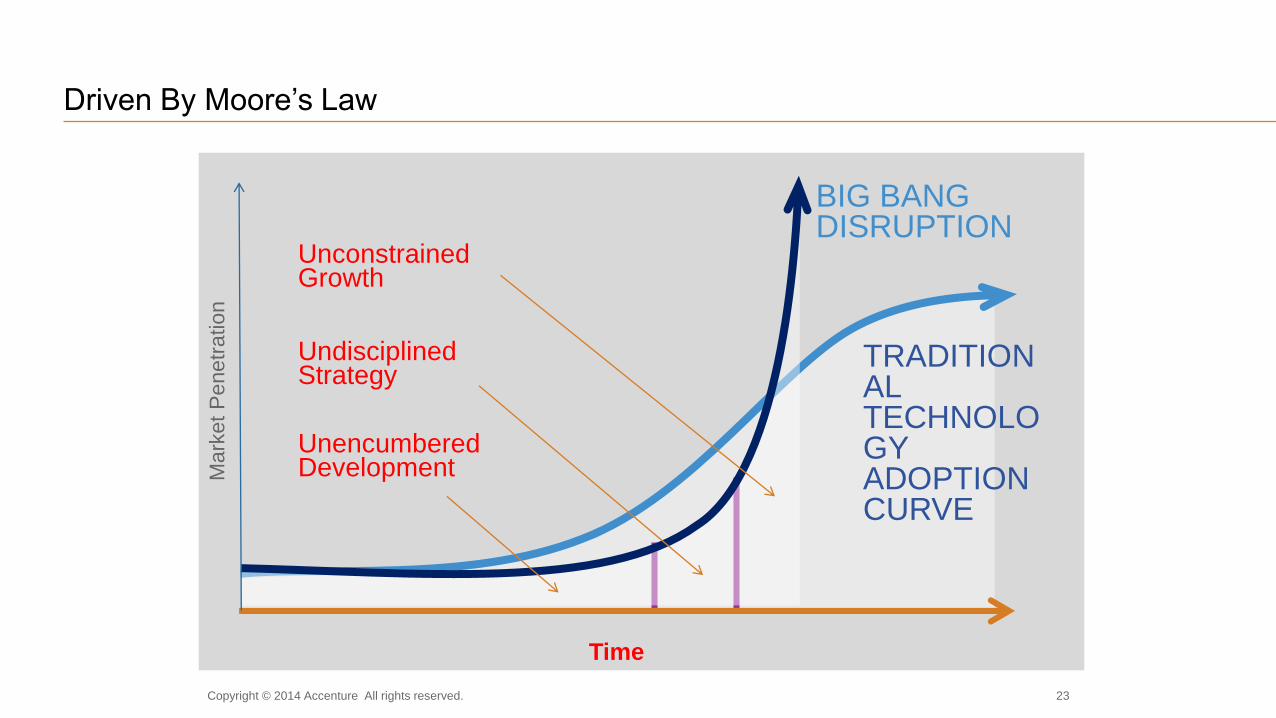
Unencumbered Development
BIG BANG DISRUPTION
Time
Mark
et
Pene
tration
TRADITIONALTECHNOLOGYADOPTION CURVE
Undisciplined Strategy
Unconstrained Growth
Driven By Moore’s Law
Copyright © 2014 Accenture All rights reserved. 23
24
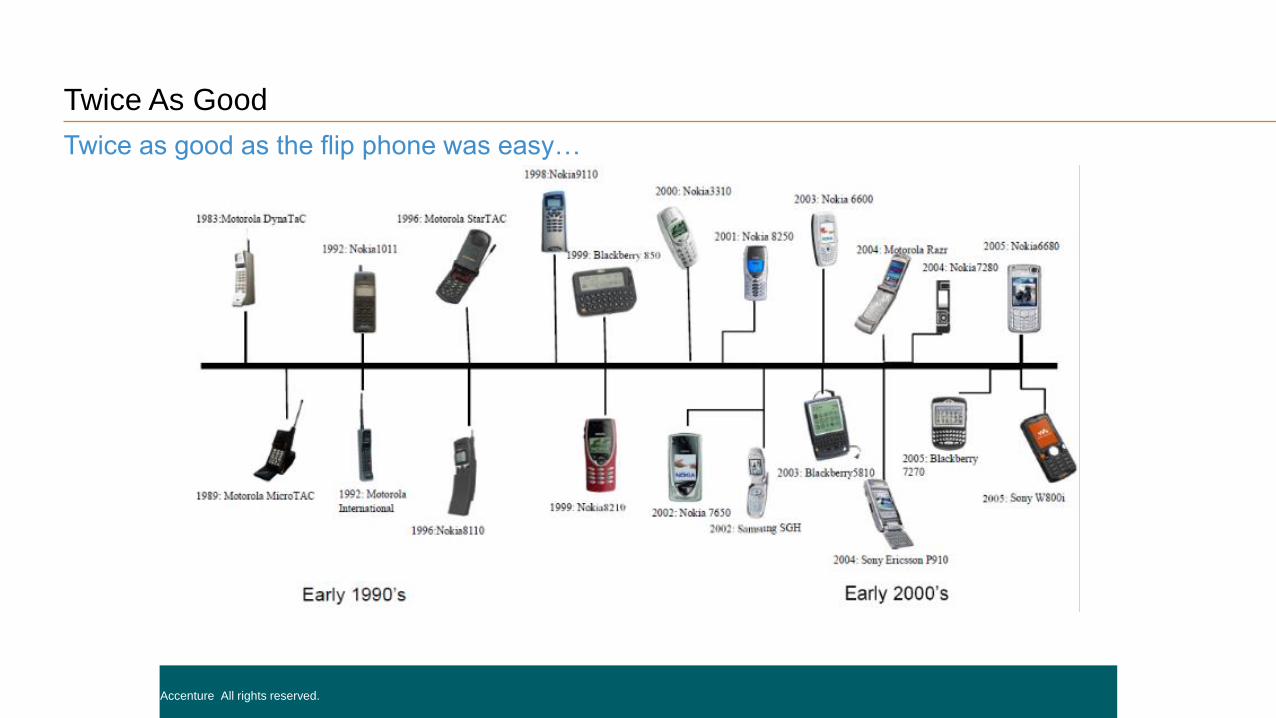
Twice As Good
Twice as good as the flip phone was easy…
Copyright © 2015 Accenture All rights reserved.
25
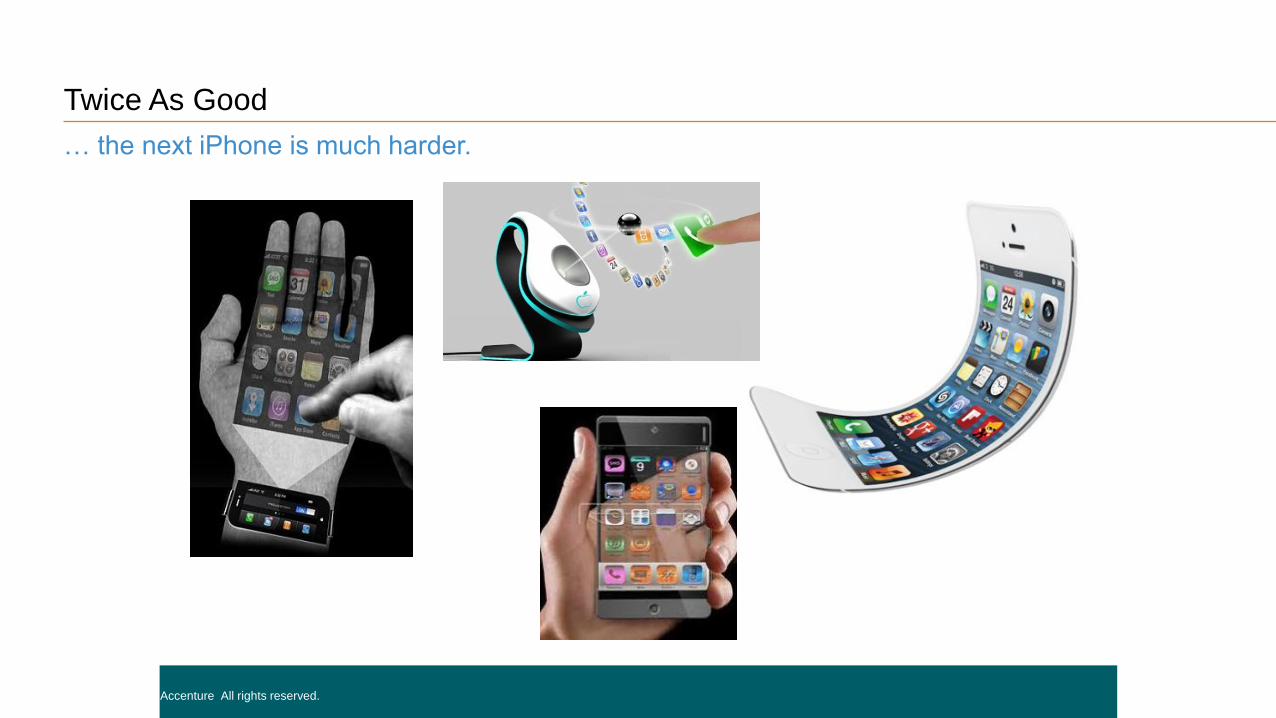
Twice As Good
… the next iPhone is much harder.
Copyright © 2015 Accenture All rights reserved.
1993 1996 1998 1999 2003
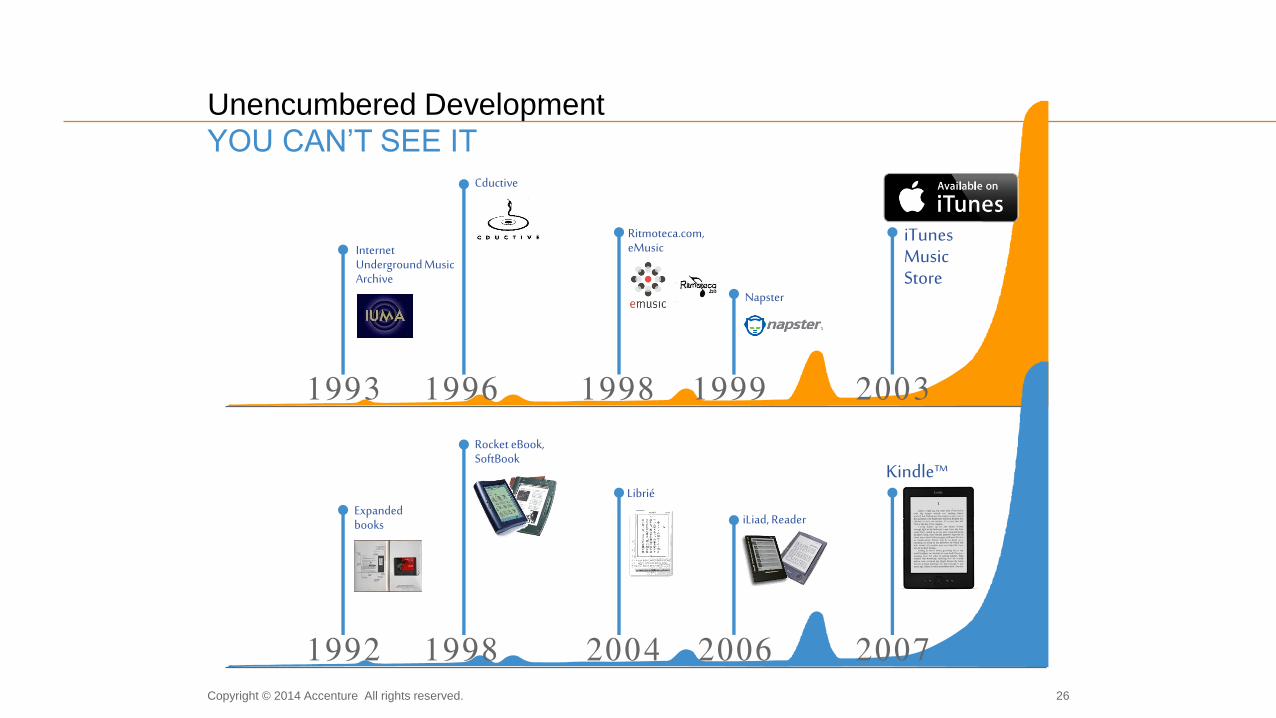
Unencumbered Development
YOU CAN’T SEE IT
Napster
iTunes Music Store
Internet Underground Music Archive
Ritmoteca.com, eMusic
Cductive
Kindle™
Expanded books
Rocket eBook, SoftBook
Librié
iLiad, Reader
1992 1998 2004 2006 2007Copyright © 2014 Accenture All rights reserved. 26
27
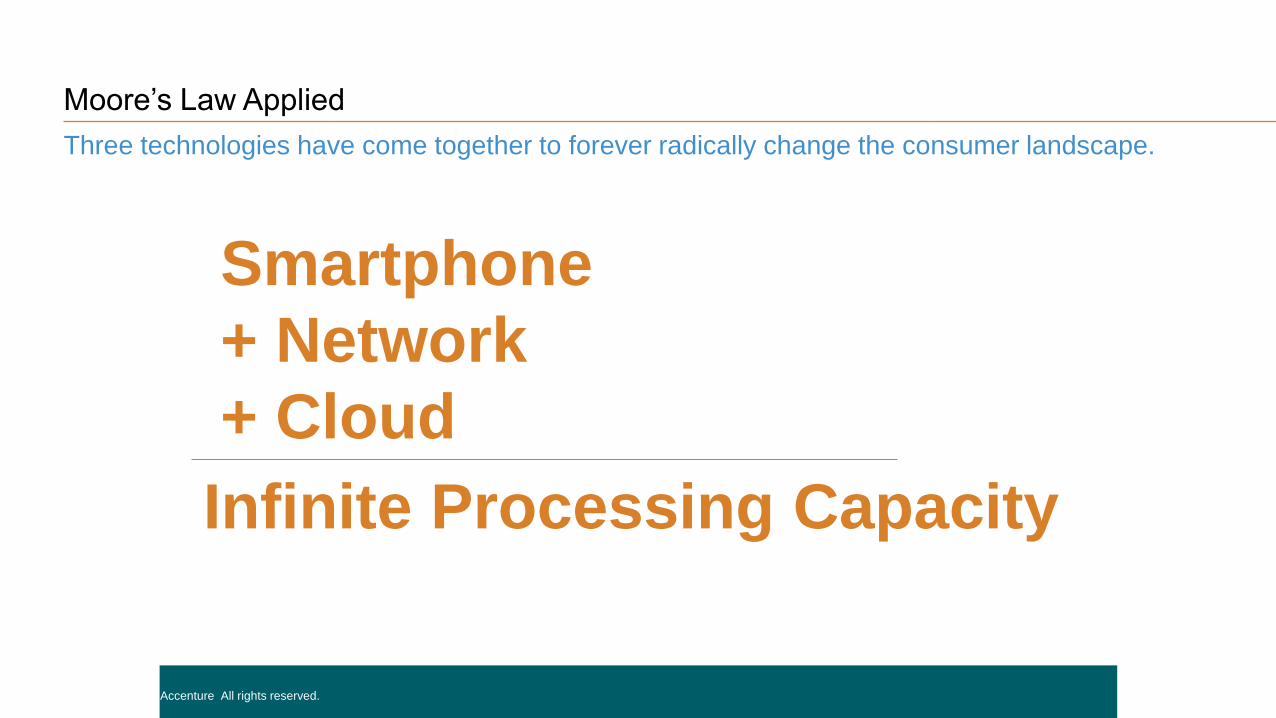
Moore’s Law Applied
Three technologies have come together to forever radically change the consumer landscape.
Copyright © 2015 Accenture All rights reserved.
Smartphone
+ Network
+ Cloud
Infinite Processing Capacity
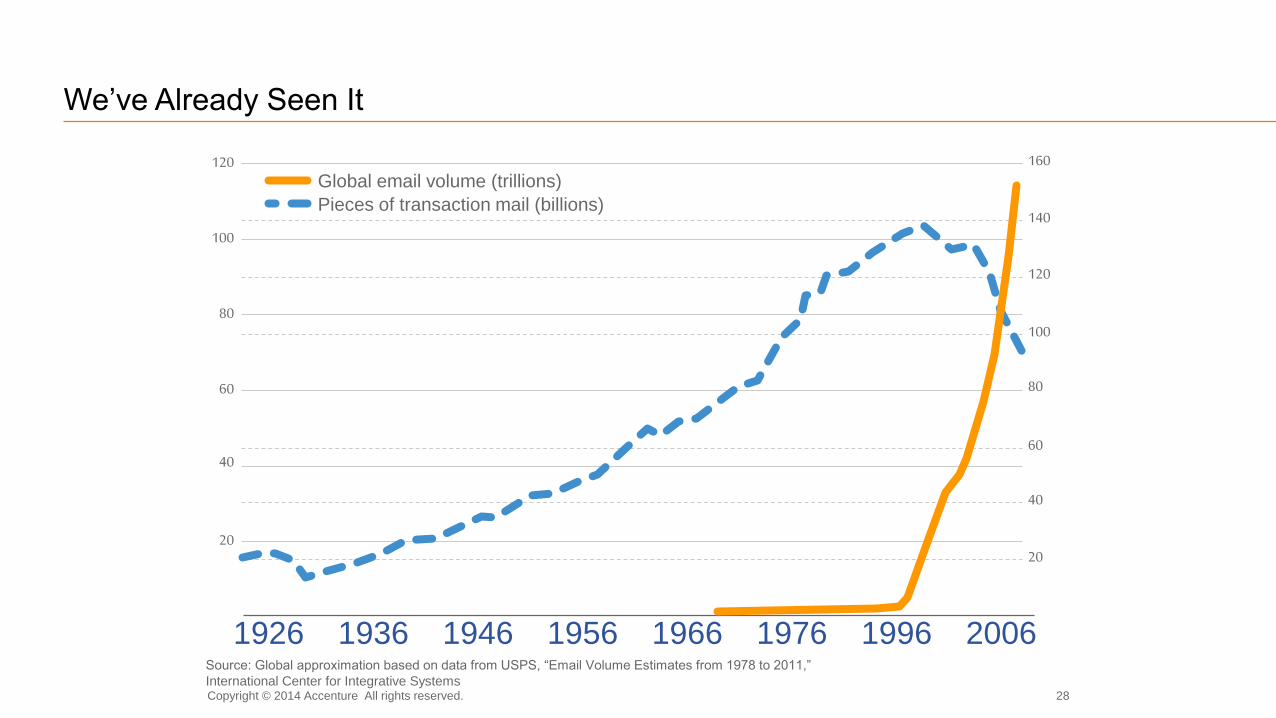
We’ve Already Seen It
Source: Global approximation based on data from USPS, “Email Volume Estimates from 1978 to 2011,”
International Center for Integrative Systems
1926 1936 1946 1956
Pieces of transaction mail (billions)
Global email volume (trillions)120
100
80
60
40
20
160
140
100
80
40
20
120
60
1966 20061976 1996
Copyright © 2014 Accenture All rights reserved. 28
29
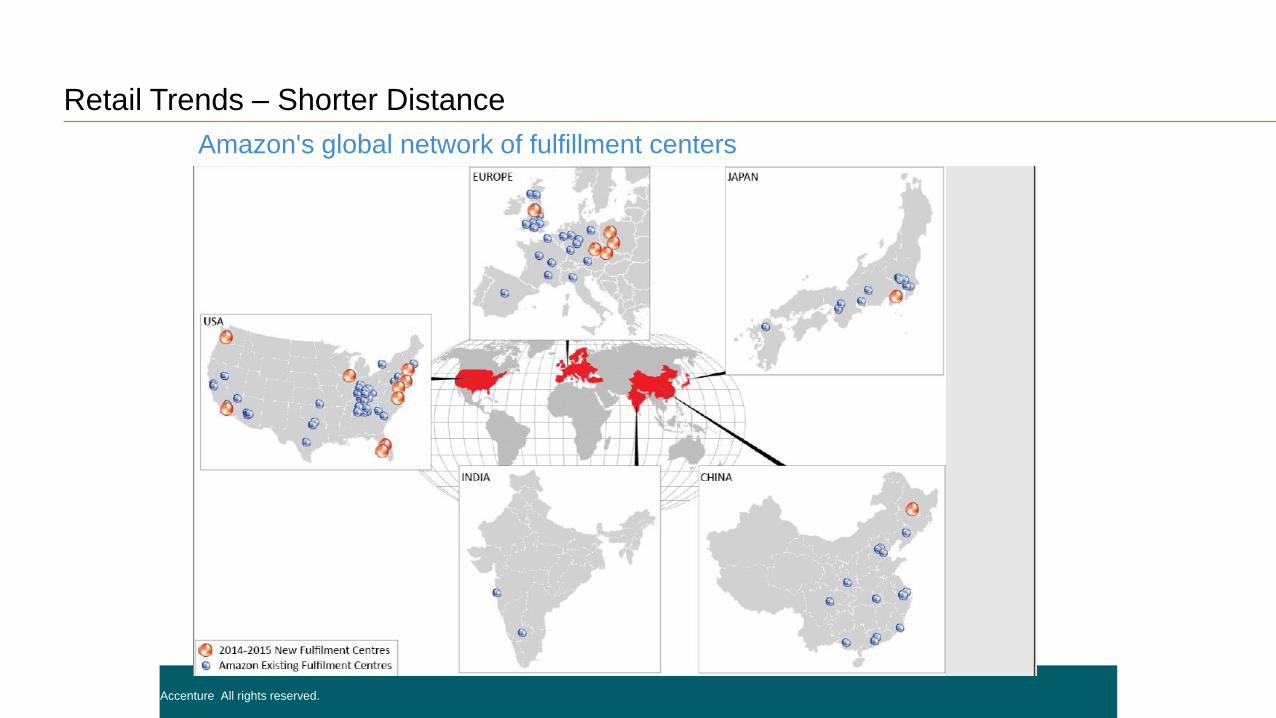
Retail Trends – Shorter Distance
Copyright © 2015 Accenture All rights reserved.
Amazon's global network of fulfillment centers
30
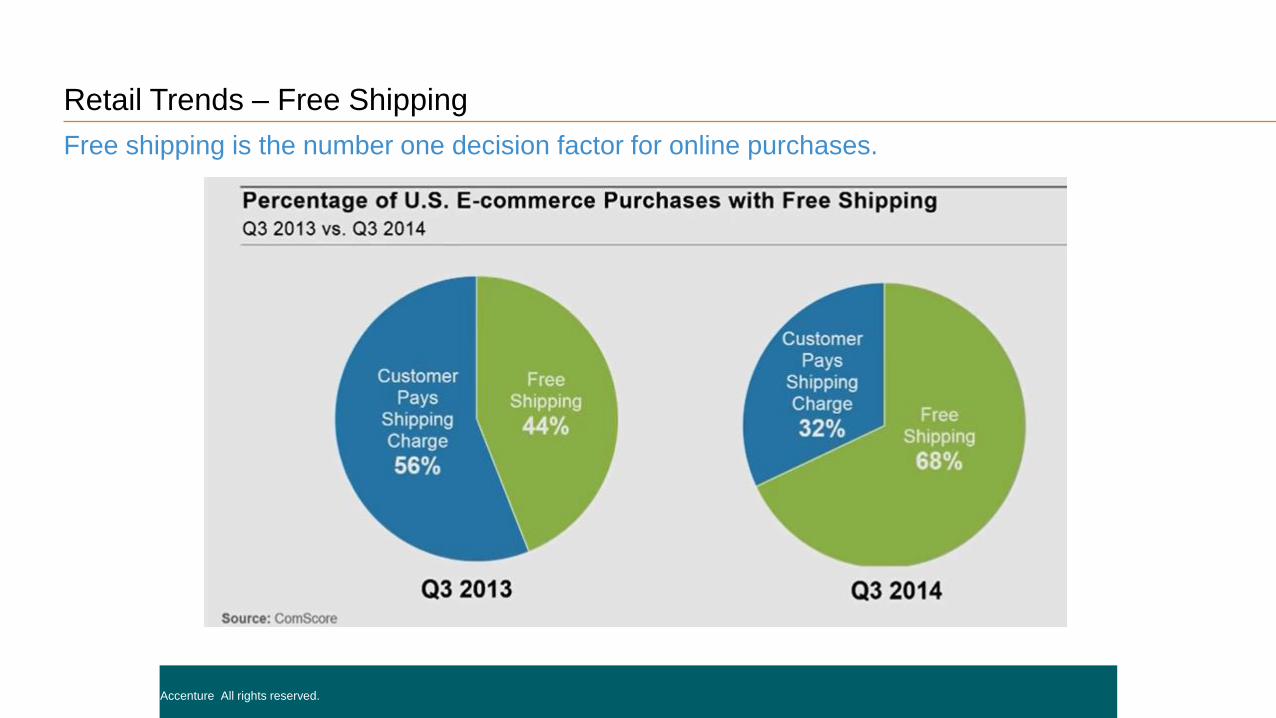
Retail Trends – Free Shipping
Free shipping is the number one decision factor for online purchases.
Copyright © 2015 Accenture All rights reserved.
31
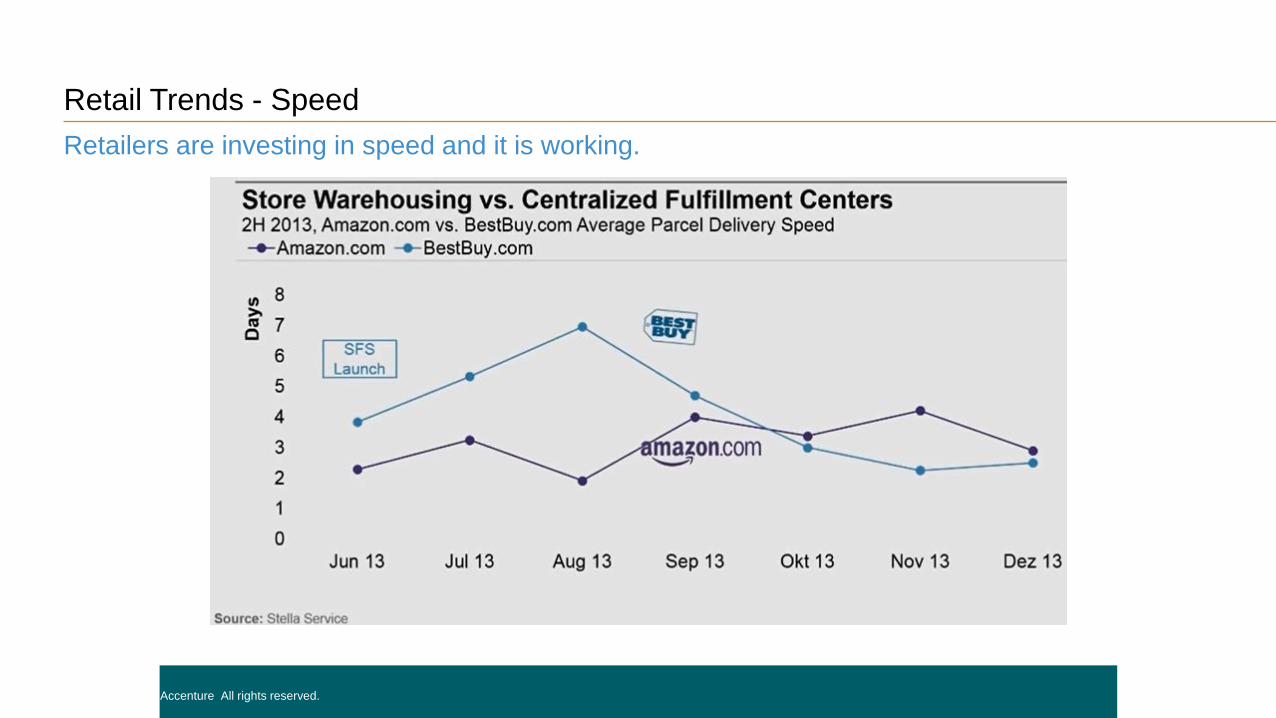
Retail Trends - Speed
Retailers are investing in speed and it is working.
Copyright © 2015 Accenture All rights reserved.
32
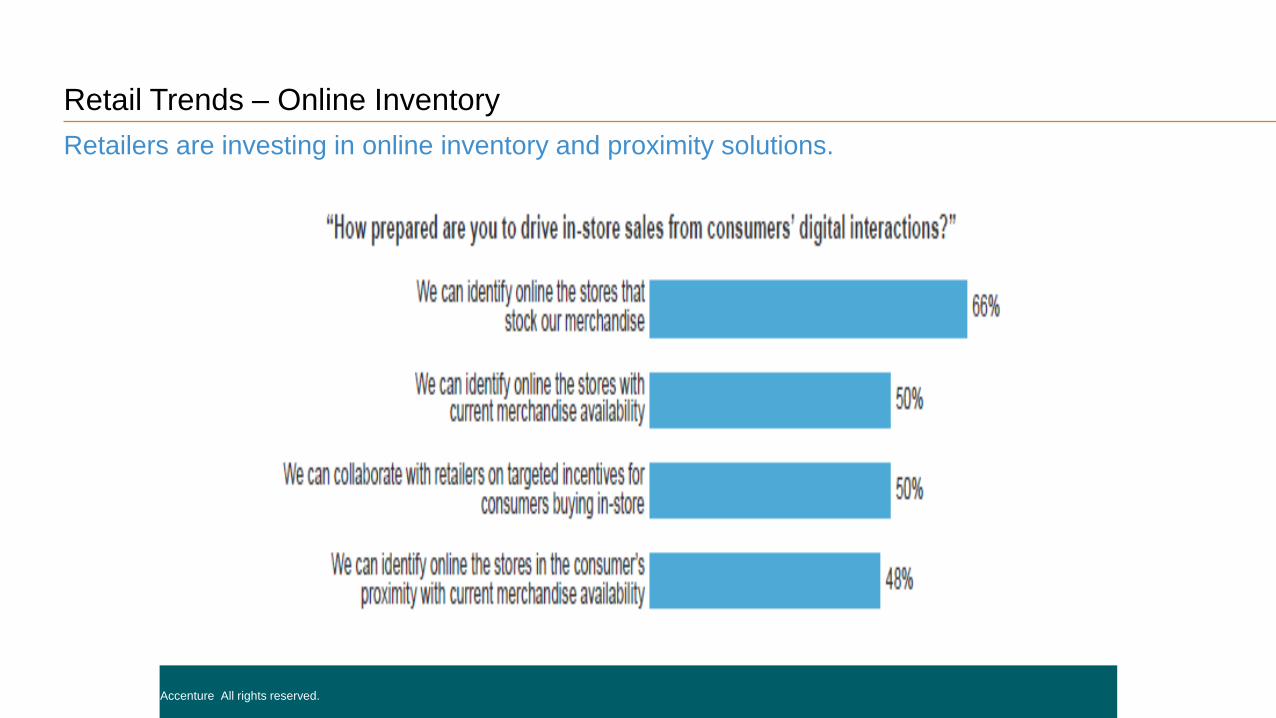
Retail Trends – Online Inventory
Retailers are investing in online inventory and proximity solutions.
Copyright © 2015 Accenture All rights reserved.
33
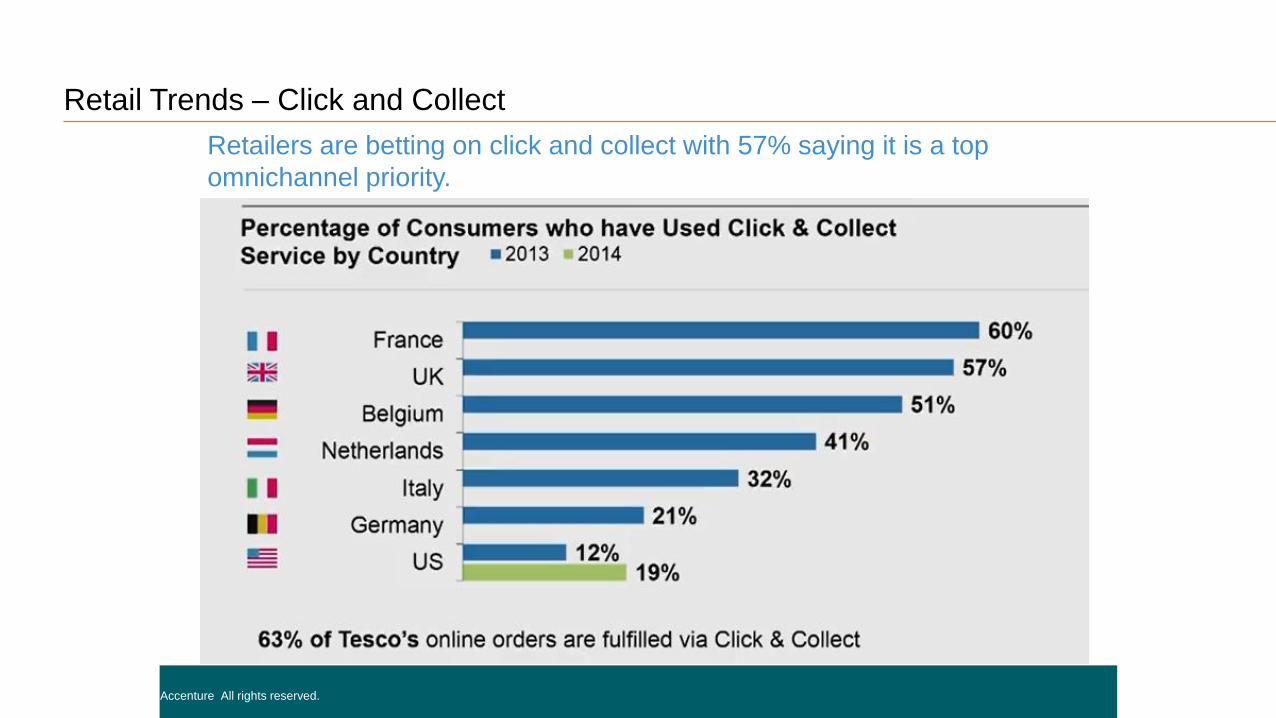
Retail Trends – Click and Collect
Retailers are betting on click and collect with 57% saying it is a top
omnichannel priority.
Copyright © 2015 Accenture All rights reserved.
34
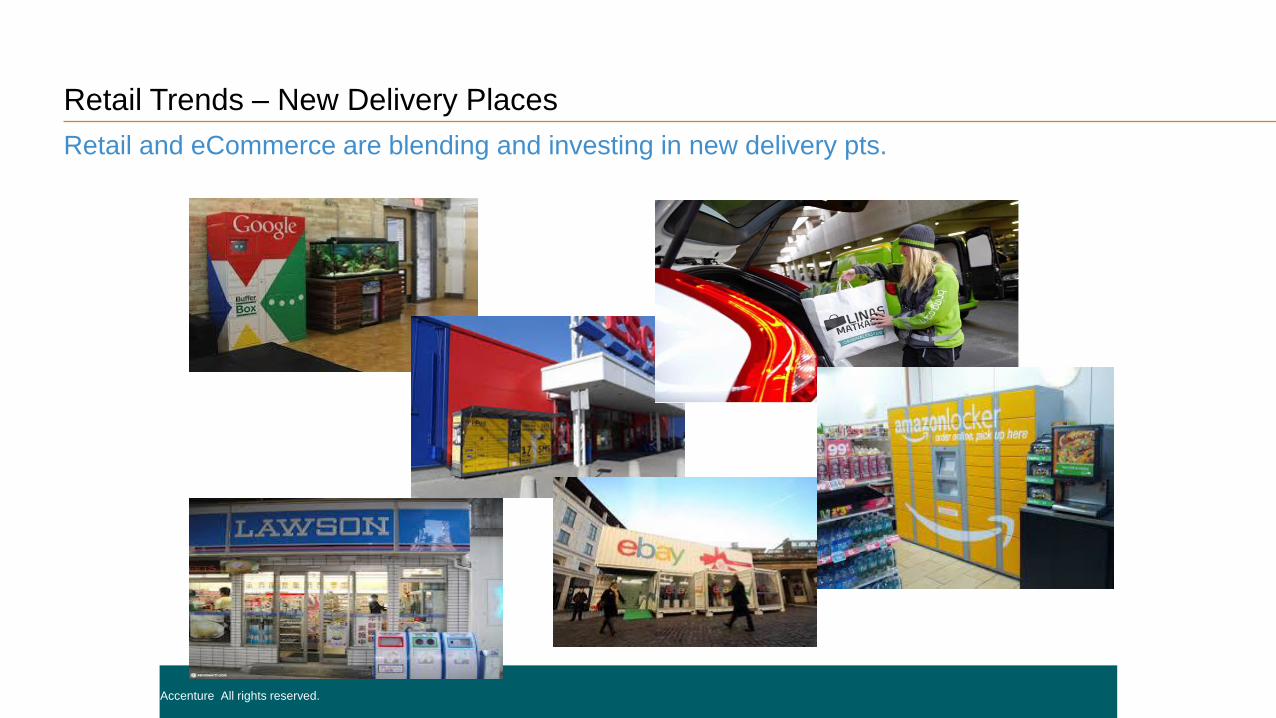
Retail Trends – New Delivery Places
Retail and eCommerce are blending and investing in new delivery pts.
Copyright © 2015 Accenture All rights reserved.
35
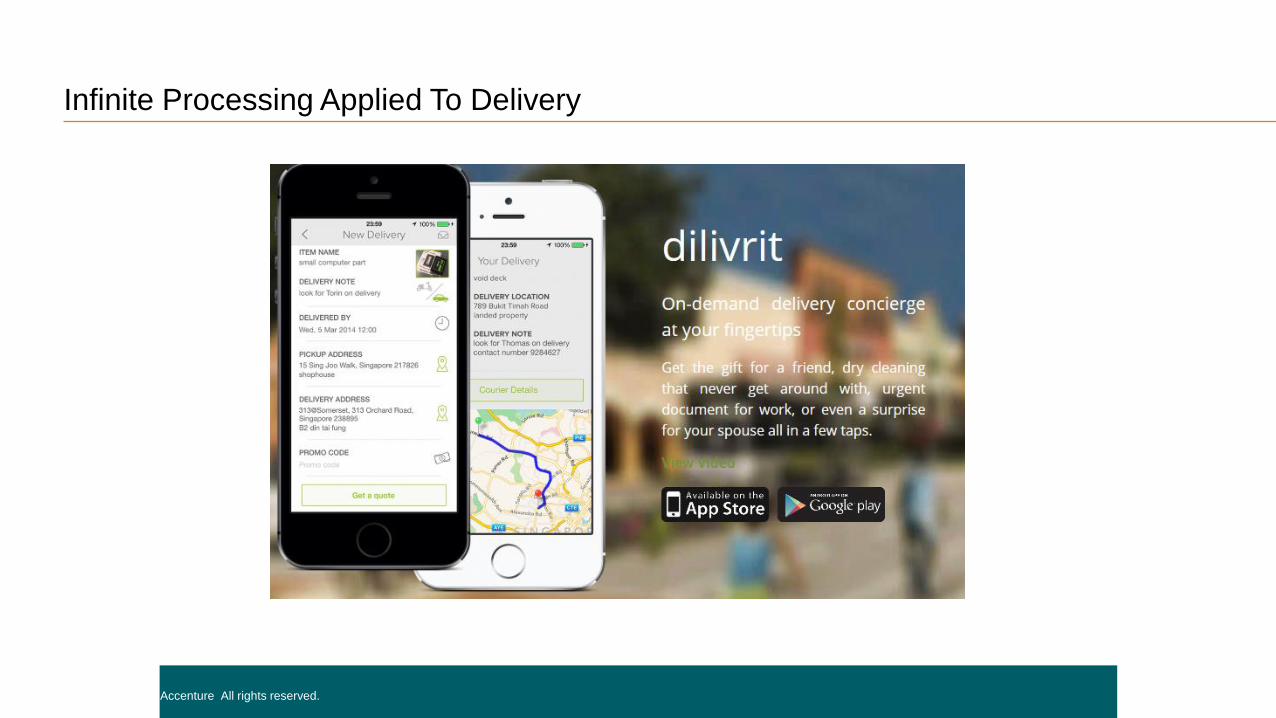
Infinite Processing Applied To Delivery
Copyright © 2015 Accenture All rights reserved.
36
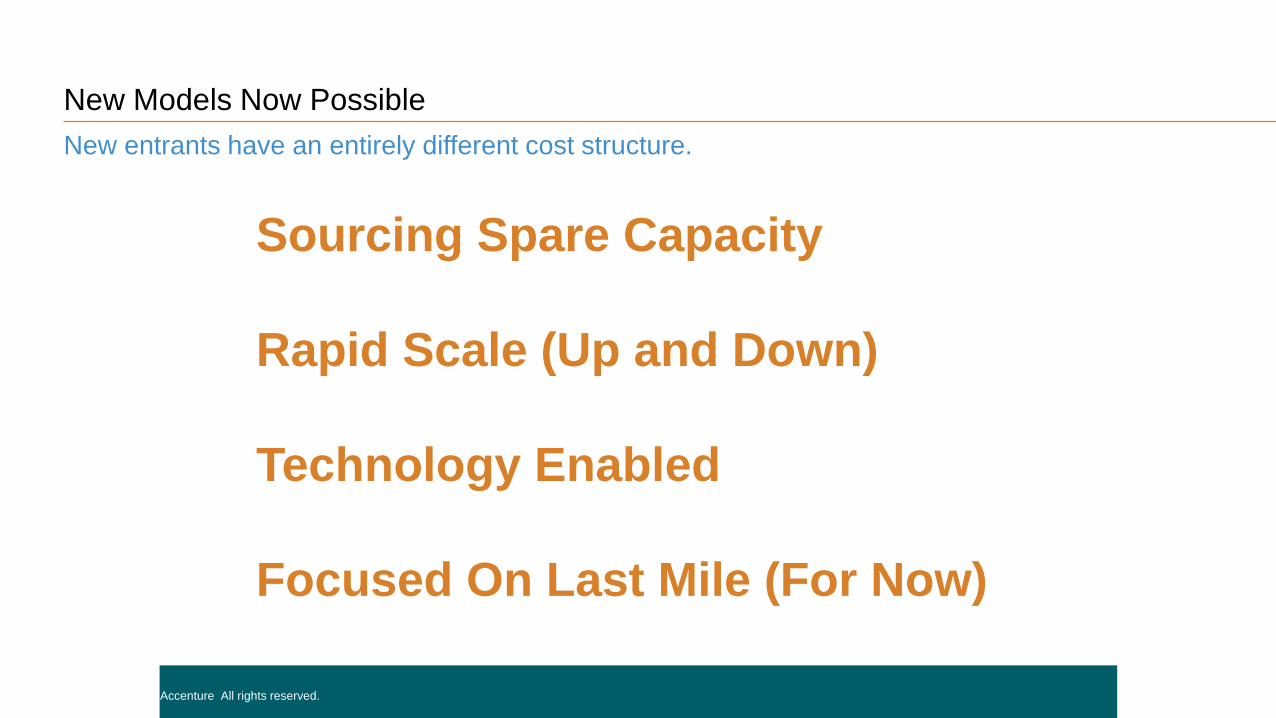
New Models Now Possible
New entrants have an entirely different cost structure.
Copyright © 2015 Accenture All rights reserved.
Sourcing Spare Capacity
Rapid Scale (Up and Down)
Technology Enabled
Focused On Last Mile (For Now)
37
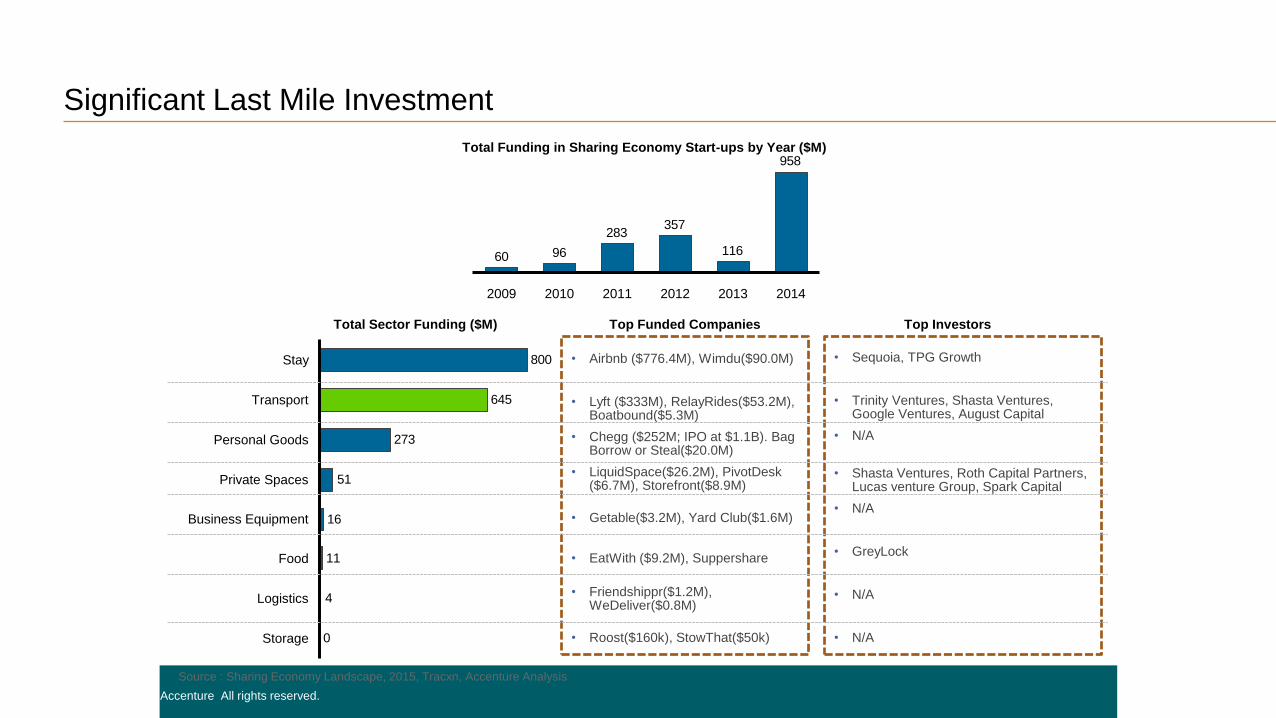
Significant Last Mile Investment
Copyright © 2015 Accenture All rights reserved.
Source : Sharing Economy Landscape, 2015, Tracxn, Accenture Analysis
958
116
357283
9660
2013 20142009 2010 2011 2012
Total Funding in Sharing Economy Start-ups by Year ($M)
0
4
11
16
51
273
645
800
Storage
Logistics
Stay
Transport
Personal Goods
Private Spaces
Food
Business Equipment
Total Sector Funding ($M)
• Airbnb ($776.4M), Wimdu($90.0M)
• Lyft ($333M), RelayRides($53.2M), Boatbound($5.3M)
• Chegg ($252M; IPO at $1.1B). Bag Borrow or Steal($20.0M)
• LiquidSpace($26.2M), PivotDesk($6.7M), Storefront($8.9M)
• Getable($3.2M), Yard Club($1.6M)
• EatWith ($9.2M), Suppershare
• Friendshippr($1.2M), WeDeliver($0.8M)
• Roost($160k), StowThat($50k)
• Sequoia, TPG Growth
• Trinity Ventures, Shasta Ventures, Google Ventures, August Capital
• N/A
• Shasta Ventures, Roth Capital Partners, Lucas venture Group, Spark Capital
• N/A
• GreyLock
• N/A
• N/A
Top Funded Companies Top Investors
38
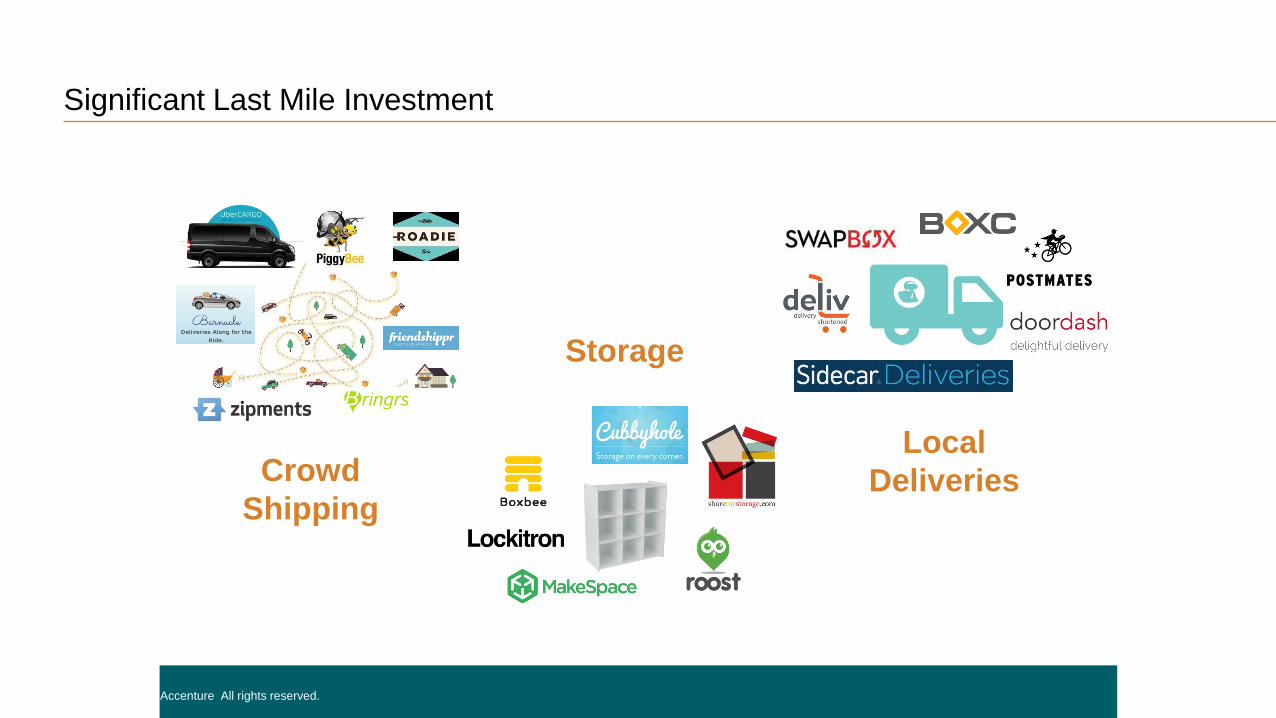
Significant Last Mile Investment
Copyright © 2015 Accenture All rights reserved.
Local
Deliveries
Storage
Crowd
Shipping
39
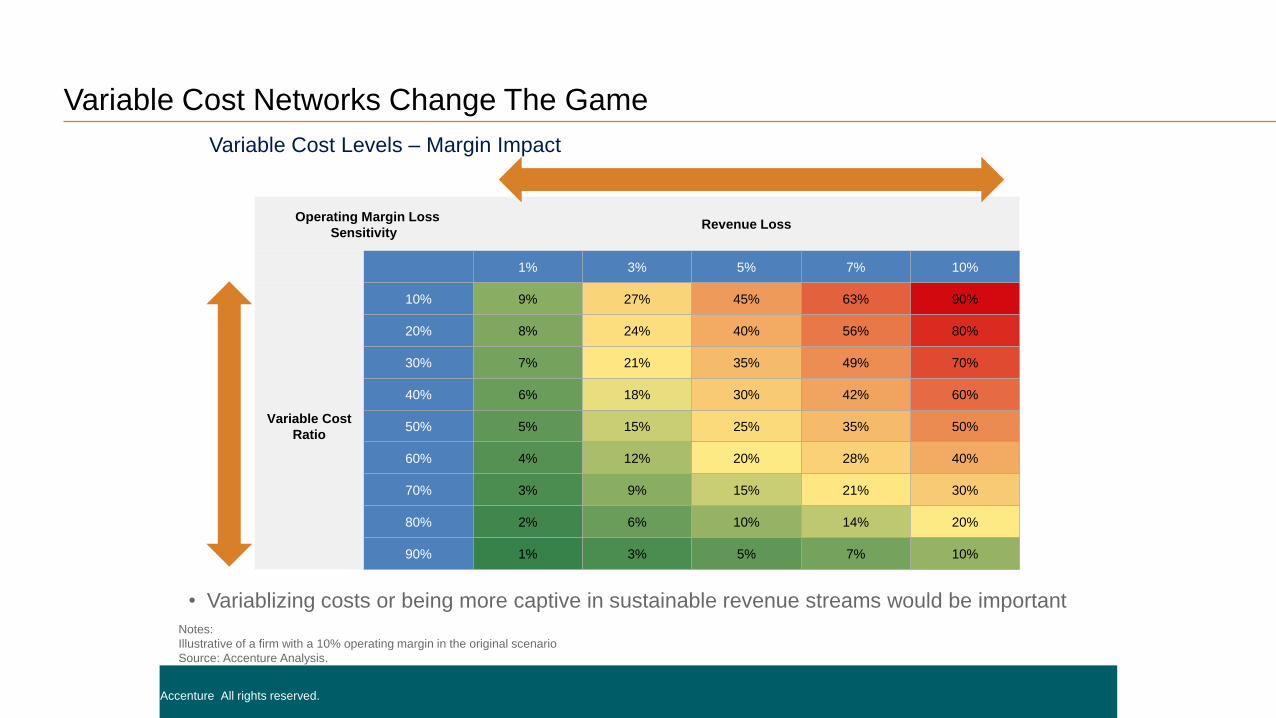
Variable Cost Networks Change The Game
Copyright © 2015 Accenture All rights reserved.
Variable Cost Levels – Margin Impact
Notes:
Illustrative of a firm with a 10% operating margin in the original scenario
Source: Accenture Analysis.
• Variablizing costs or being more captive in sustainable revenue streams would be important
Operating Margin Loss
SensitivityRevenue Loss
1% 3% 5% 7% 10%
Variable Cost
Ratio
10% 9% 27% 45% 63% 90%
20% 8% 24% 40% 56% 80%
30% 7% 21% 35% 49% 70%
40% 6% 18% 30% 42% 60%
50% 5% 15% 25% 35% 50%
60% 4% 12% 20% 28% 40%
70% 3% 9% 15% 21% 30%
80% 2% 6% 10% 14% 20%
90% 1% 3% 5% 7% 10%
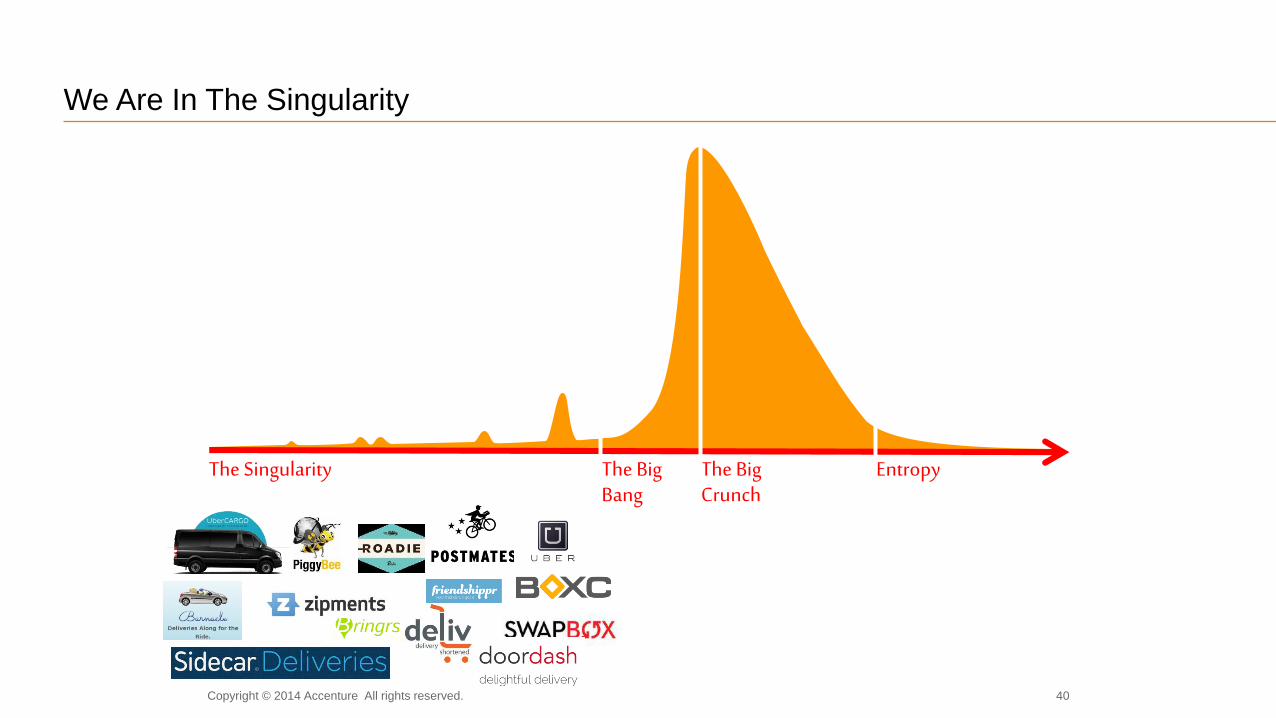
We Are In The Singularity
Copyright © 2014 Accenture All rights reserved. 40
The Singularity The BigBang
The BigCrunch
Entropy
41
What Is Better?
Copyright © 2015 Accenture All rights reserved.
Faster Delivery
New Value Added Services
Convenience Is King
42
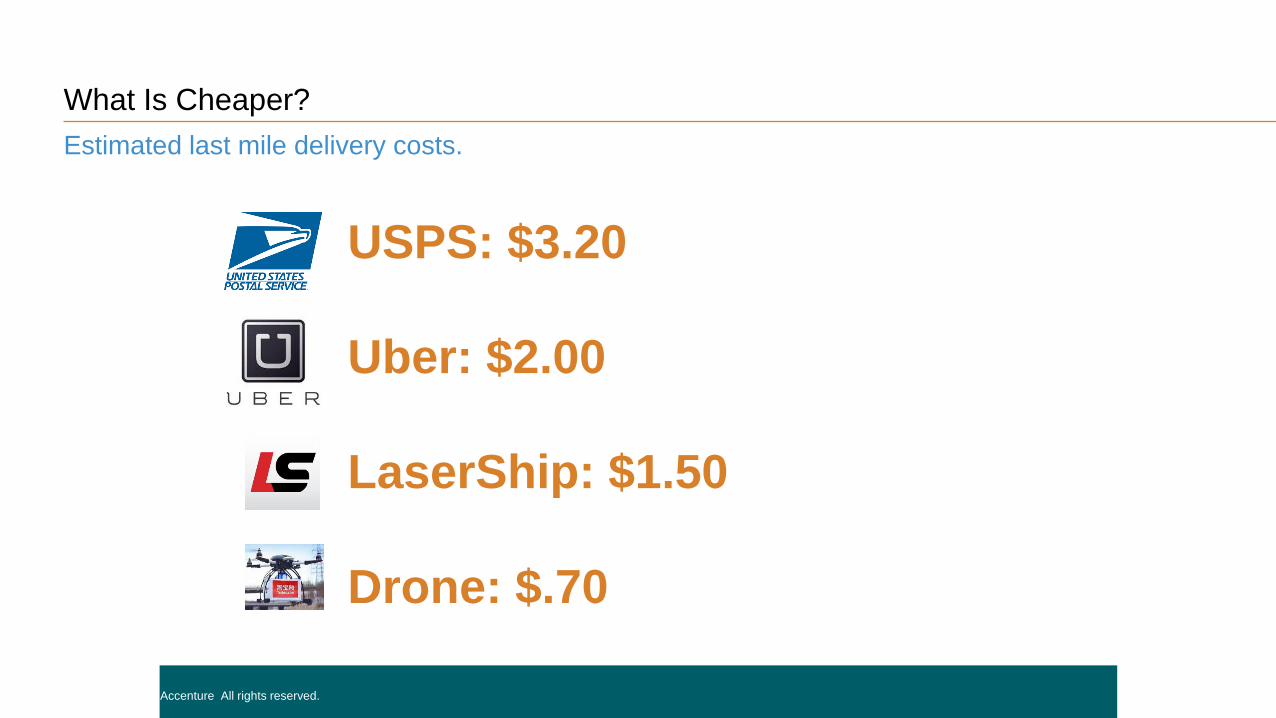
What Is Cheaper?
Copyright © 2015 Accenture All rights reserved.
USPS: $3.20
Uber: $2.00
LaserShip: $1.50
Drone: $.70
Estimated last mile delivery costs.
43
What Is More Personal?
Copyright © 2015 Accenture All rights reserved.
When I Want It
Where I Want It
Completely Transparent
Fully Within My Control
44
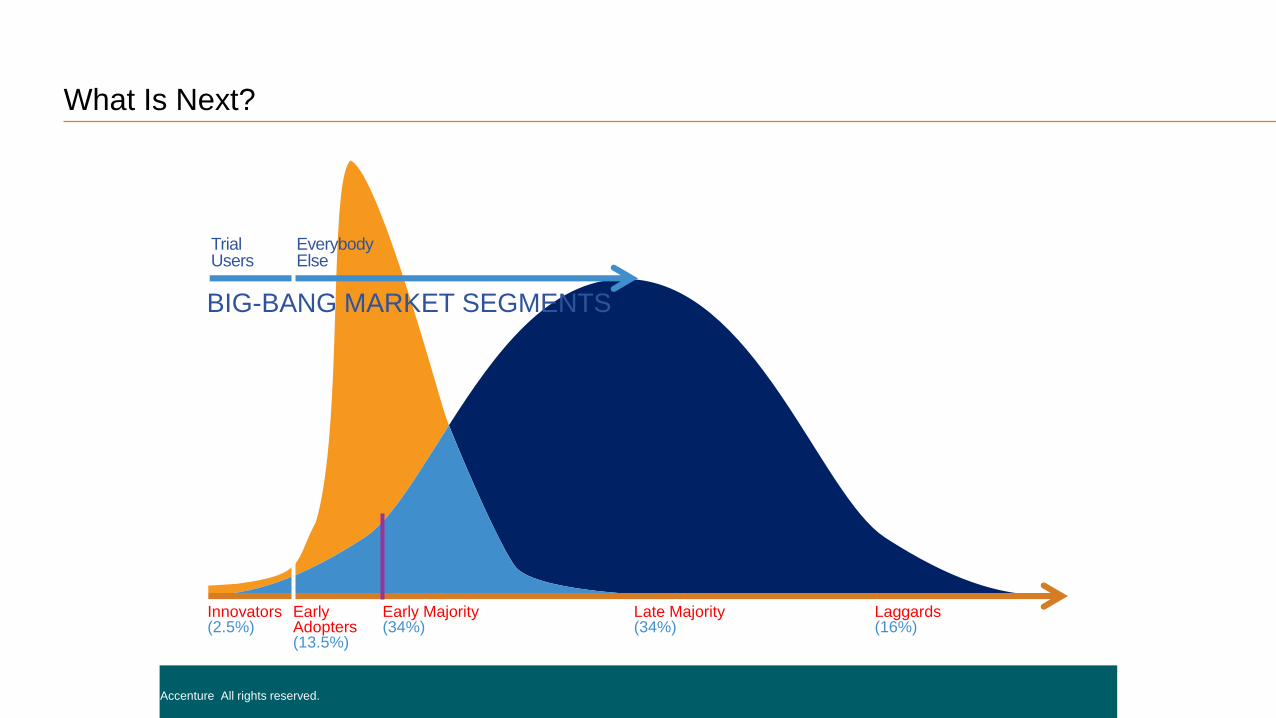
What Is Next?
Copyright © 2015 Accenture All rights reserved.
Trial Users
Everybody Else
Innovators(2.5%)
Early Adopters (13.5%)
Early Majority (34%)
Late Majority (34%)
Laggards(16%)
BIG-BANG MARKET SEGMENTS
45© 2015 InfoTrends www.infotrends.com© 2015 InfoTrends
The Future of DeliveryPrepared for PostalVision 2020/5.0
Matt SwainDirectorMarch 10, 2015
46© 2015 InfoTrends www.infotrends.com
47© 2015 InfoTrends www.infotrends.com
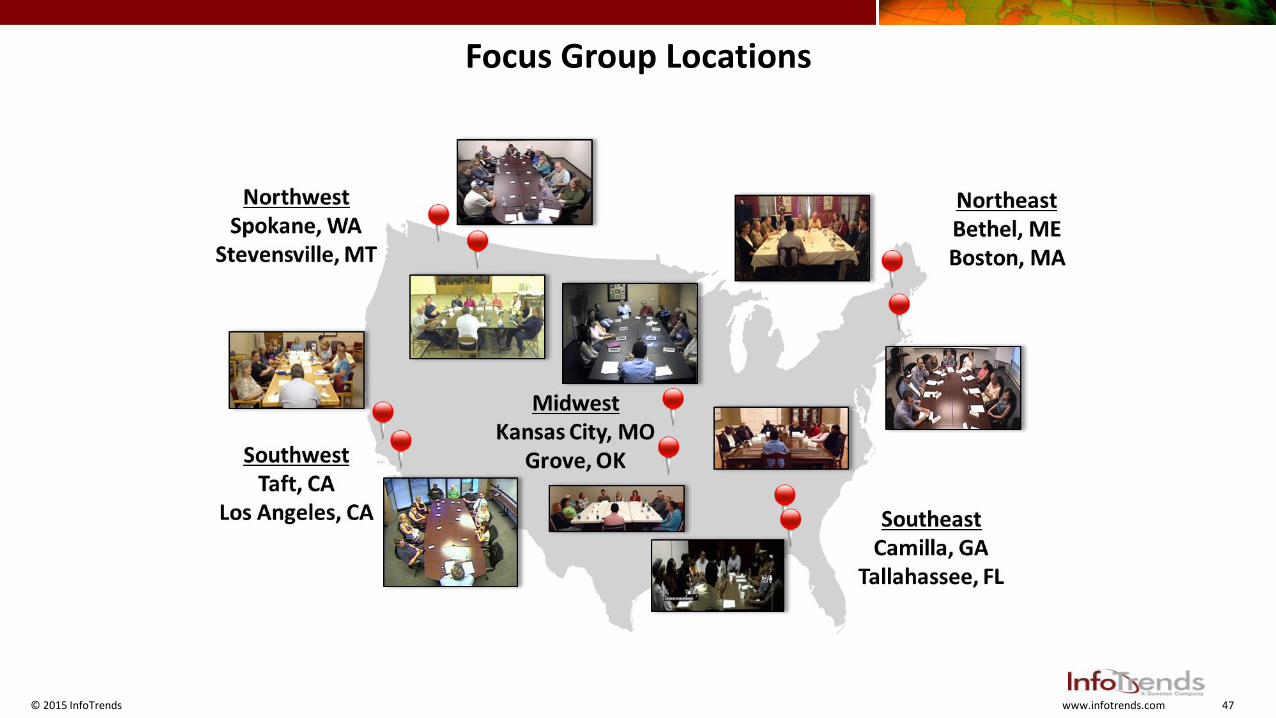
Focus Group Locations
48© 2015 InfoTrends www.infotrends.com
Focus Group Participants(A Sample)
49© 2015 InfoTrends www.infotrends.com
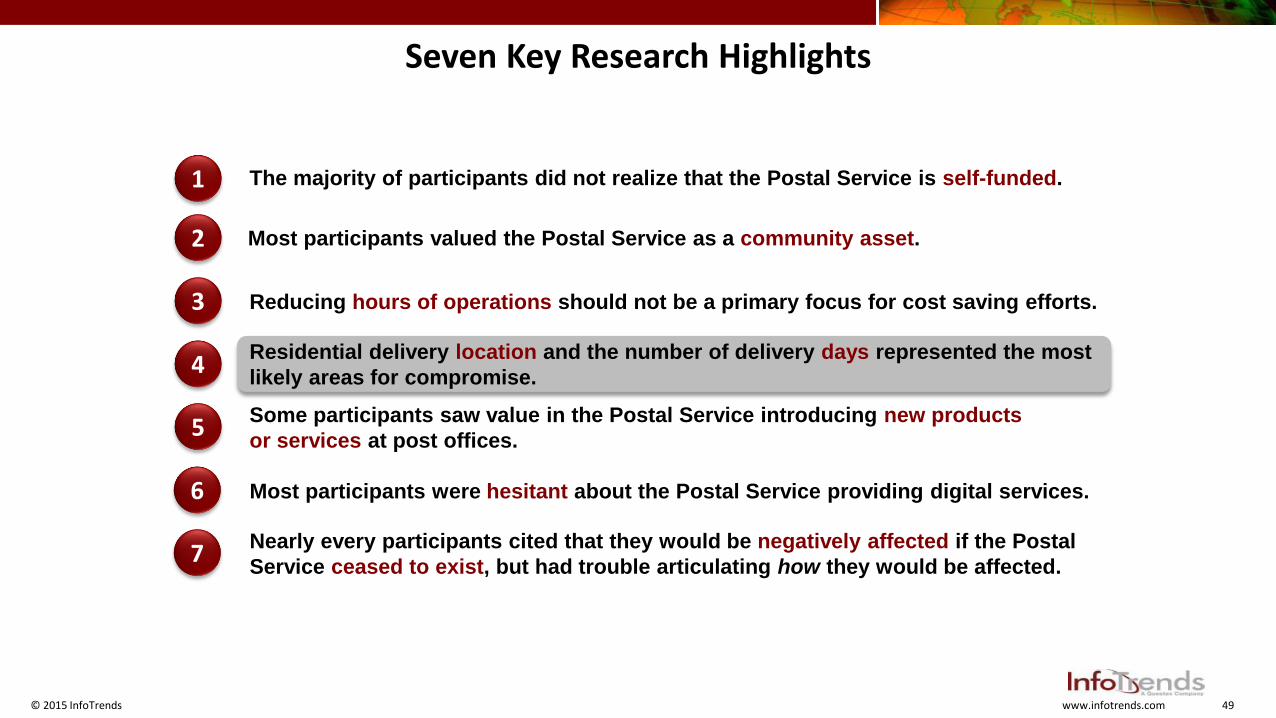
Residential delivery location and the number of delivery days represented the most
likely areas for compromise.
Seven Key Research Highlights
5
4
3
2
1
7
6
The majority of participants did not realize that the Postal Service is self-funded.
Most participants valued the Postal Service as a community asset.
Reducing hours of operations should not be a primary focus for cost saving efforts.
Some participants saw value in the Postal Service introducing new products
or services at post offices.
Most participants were hesitant about the Postal Service providing digital services.
Nearly every participants cited that they would be negatively affected if the Postal
Service ceased to exist, but had trouble articulating how they would be affected.
50© 2015 InfoTrends www.infotrends.com
Residential delivery location and the number of delivery days represented the most likely areas for compromise.
51© 2015 InfoTrends www.infotrends.com
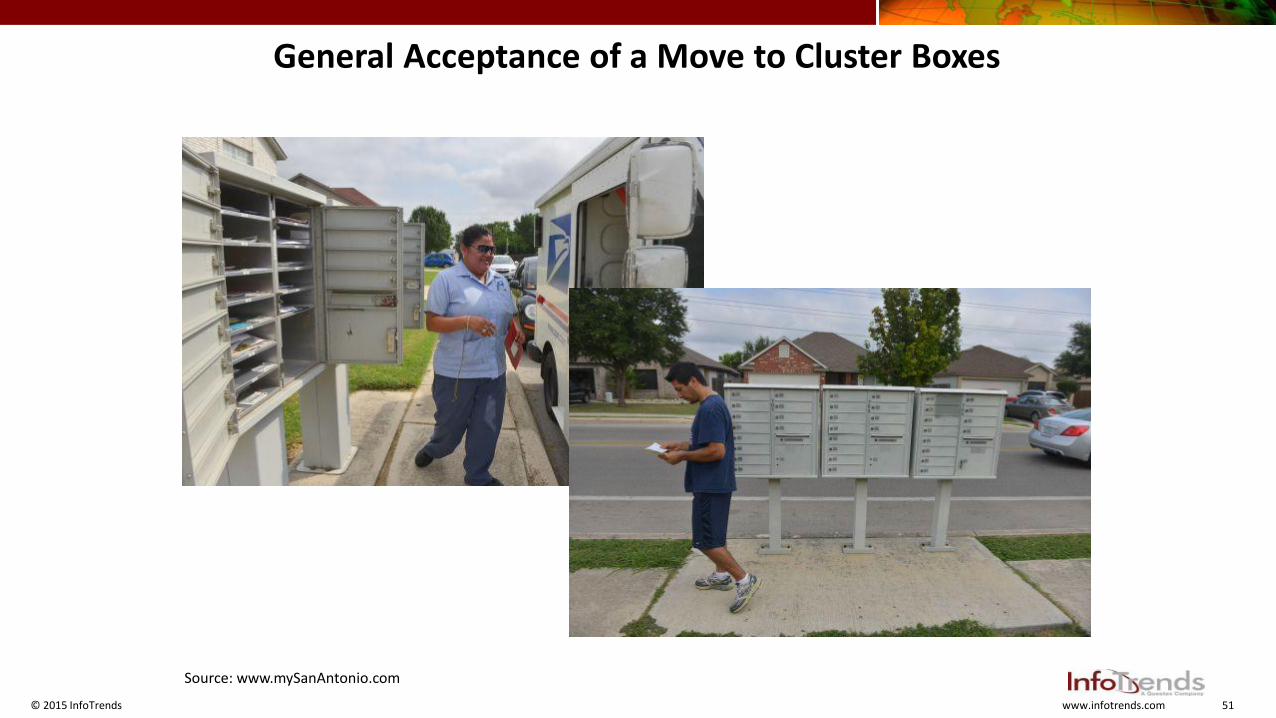
General Acceptance of a Move to Cluster Boxes
Source: www.mySanAntonio.com
52© 2015 InfoTrends www.infotrends.com
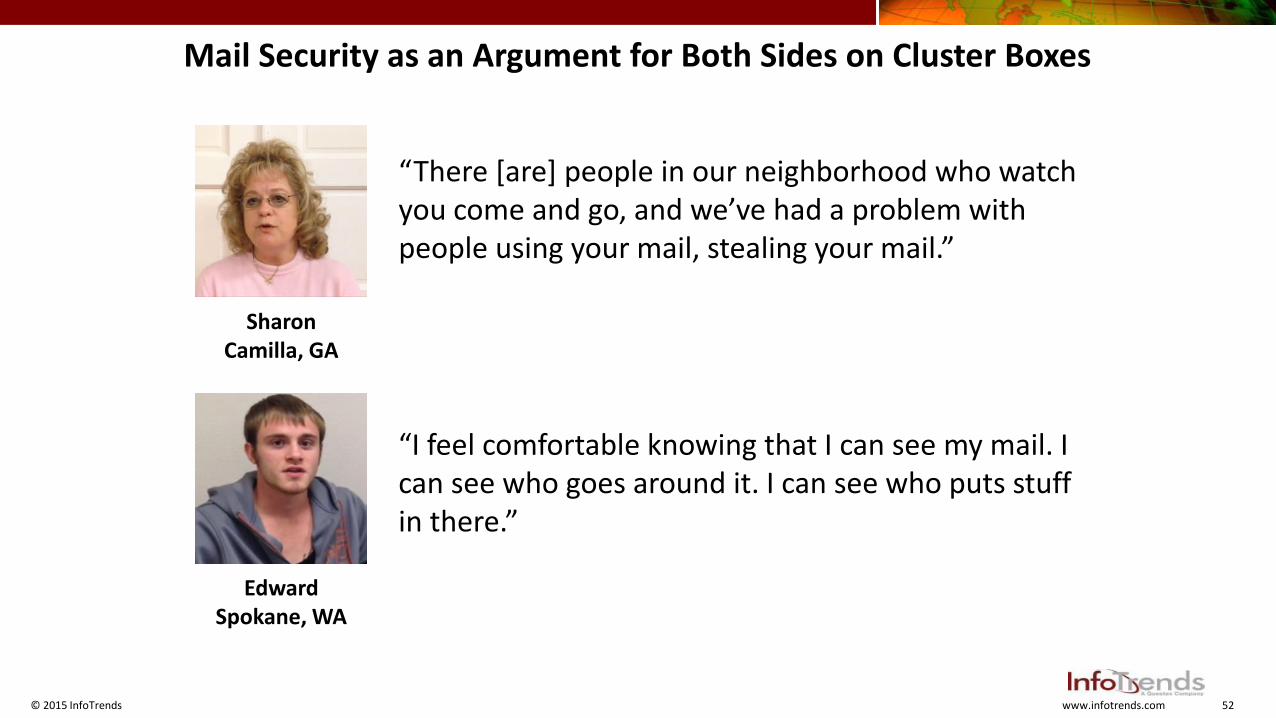
“There [are] people in our neighborhood who watch you come and go, and we’ve had a problem with people using your mail, stealing your mail.”
“I feel comfortable knowing that I can see my mail. I can see who goes around it. I can see who puts stuff in there.”
SharonCamilla, GA
EdwardSpokane, WA
Mail Security as an Argument for Both Sides on Cluster Boxes
53© 2015 InfoTrends www.infotrends.com
New Consumer Research, Including Insight on Cluster box
• InfoTrends conducted research on behalf of the USPS OIG
• Research timeline was August 2014 – September 2014
• 5,000 respondents in the United States
− Aligned age, gender, and geography by U.S. Census data
− 4,500 from web surveys, 500 from phone surveys
• 88% had Internet access at home
• This is a preview of a subset of the data, which will publish in a USPS OIG report later this year
54© 2015 InfoTrends www.infotrends.com
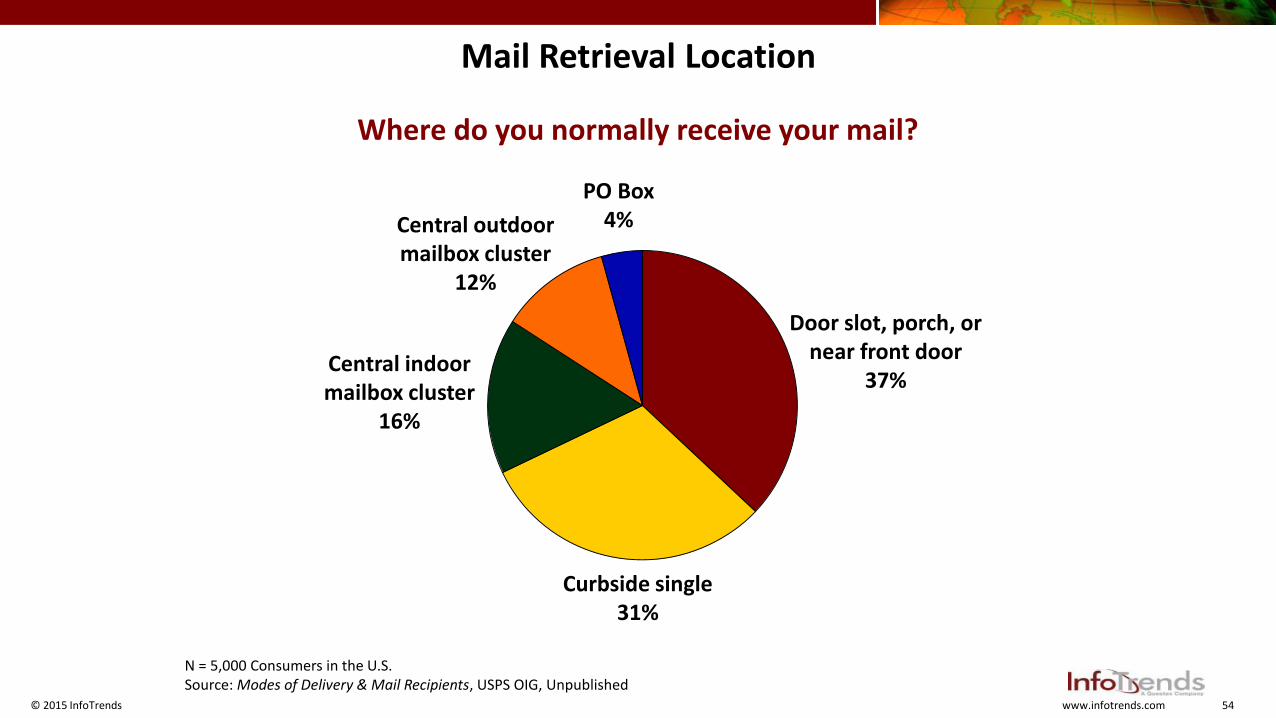
Mail Retrieval Location
Where do you normally receive your mail?
N = 5,000 Consumers in the U.S.Source: Modes of Delivery & Mail Recipients, USPS OIG, Unpublished
Central indoor mailbox cluster
16%
Central outdoor mailbox cluster
12%
PO Box4%
Door slot, porch, or near front door
37%
Curbside single31%
55© 2015 InfoTrends www.infotrends.com
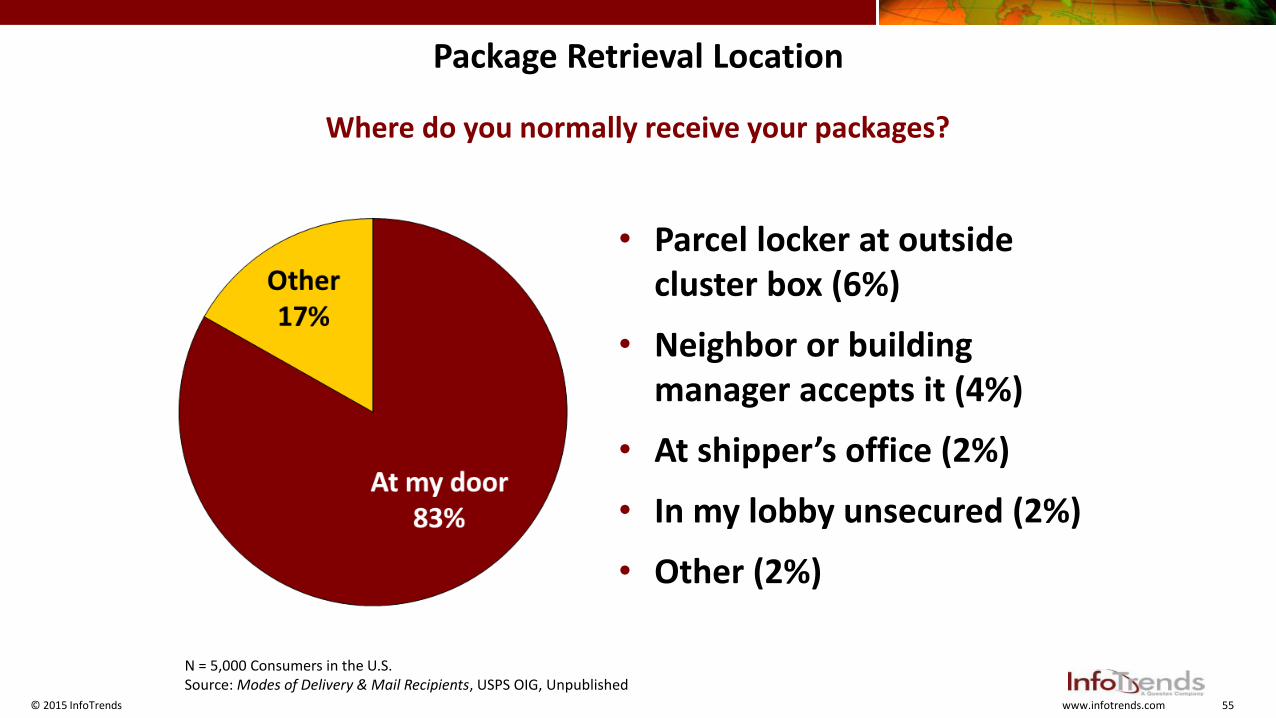
Package Retrieval Location
Where do you normally receive your packages?
• Parcel locker at outside cluster box (6%)
• Neighbor or building manager accepts it (4%)
• At shipper’s office (2%)
• In my lobby unsecured (2%)
• Other (2%)
N = 5,000 Consumers in the U.S.Source: Modes of Delivery & Mail Recipients, USPS OIG, Unpublished
56© 2015 InfoTrends www.infotrends.com
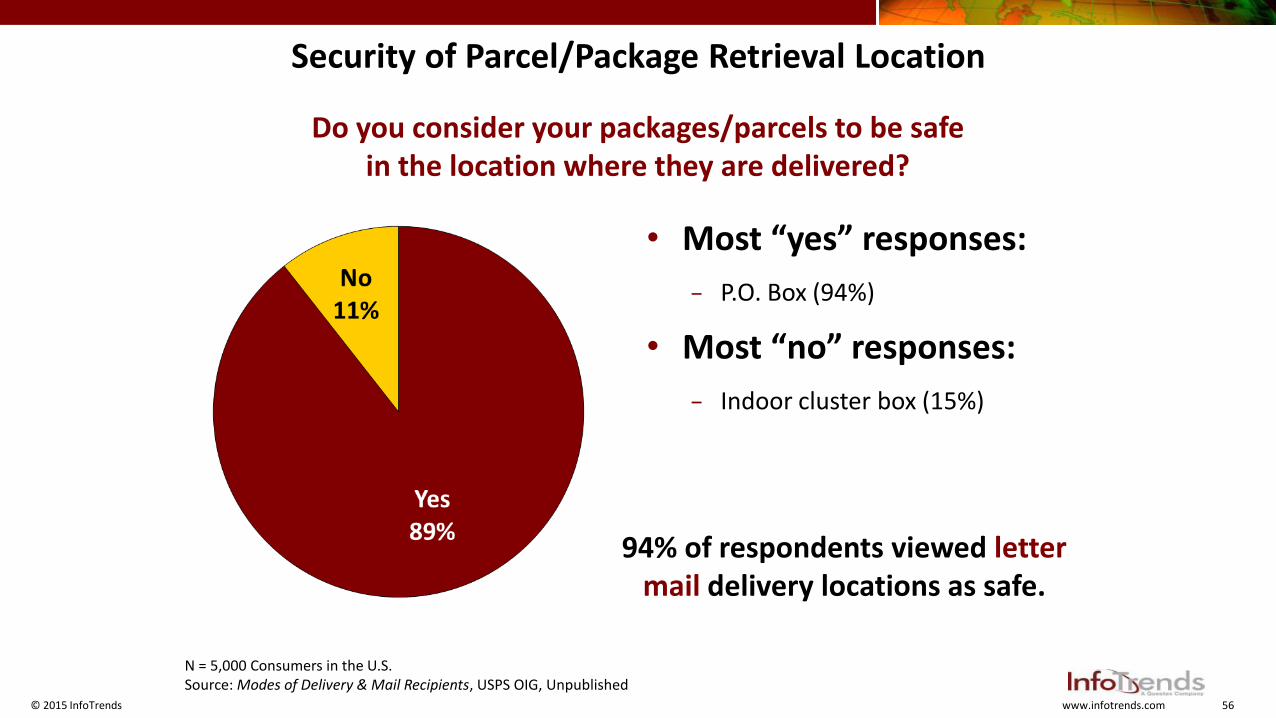
Security of Parcel/Package Retrieval Location
Do you consider your packages/parcels to be safe in the location where they are delivered?
• Most “yes” responses:
− P.O. Box (94%)
• Most “no” responses:
− Indoor cluster box (15%)
94% of respondents viewed letter mail delivery locations as safe.
N = 5,000 Consumers in the U.S.Source: Modes of Delivery & Mail Recipients, USPS OIG, Unpublished
57© 2015 InfoTrends www.infotrends.com
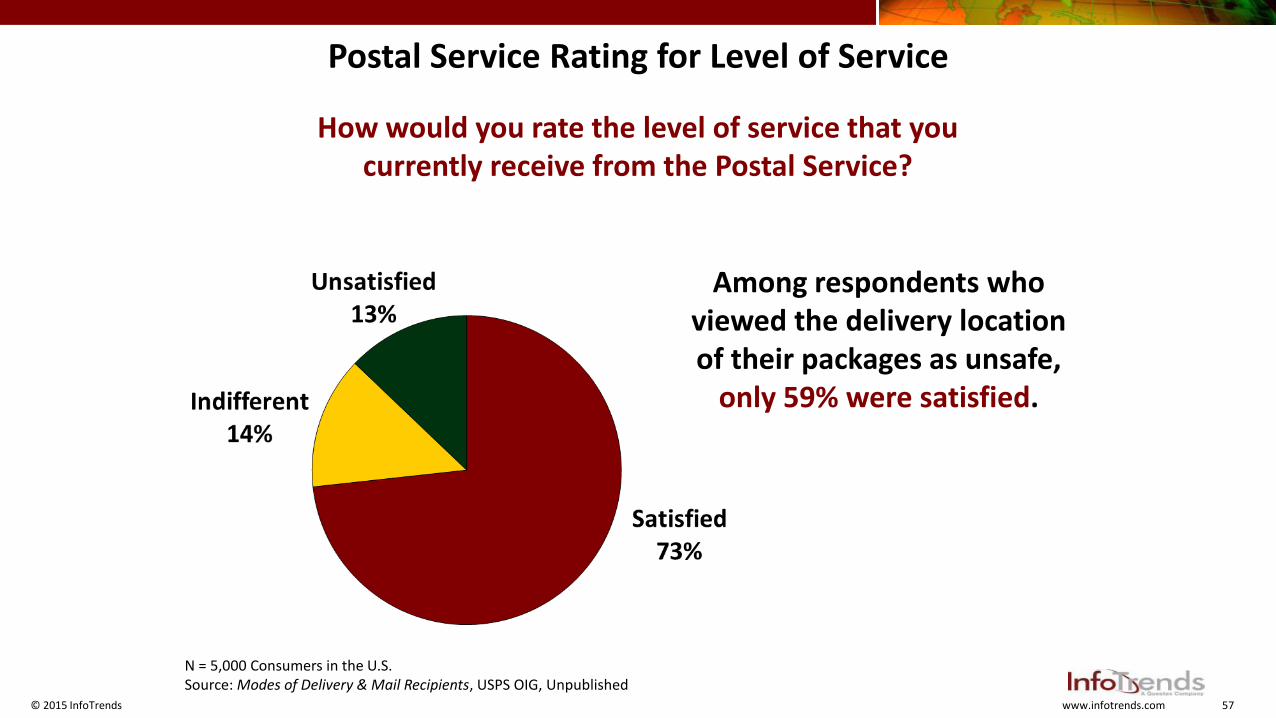
Postal Service Rating for Level of Service
How would you rate the level of service that you currently receive from the Postal Service?
Among respondents who viewed the delivery location of their packages as unsafe,
only 59% were satisfied.
N = 5,000 Consumers in the U.S.Source: Modes of Delivery & Mail Recipients, USPS OIG, Unpublished
58© 2015 InfoTrends www.infotrends.com
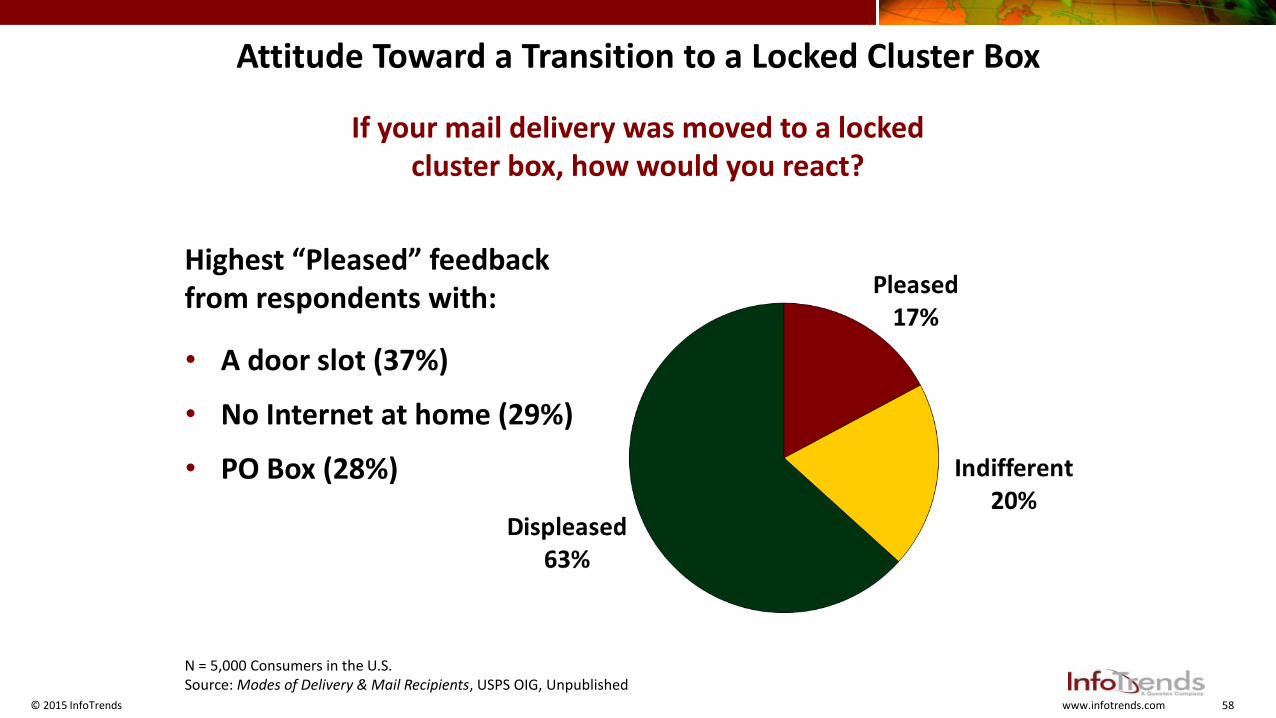
Attitude Toward a Transition to a Locked Cluster Box
If your mail delivery was moved to a locked cluster box, how would you react?
Highest “Pleased” feedback from respondents with:
• A door slot (37%)
• No Internet at home (29%)
• PO Box (28%)
N = 5,000 Consumers in the U.S.Source: Modes of Delivery & Mail Recipients, USPS OIG, Unpublished
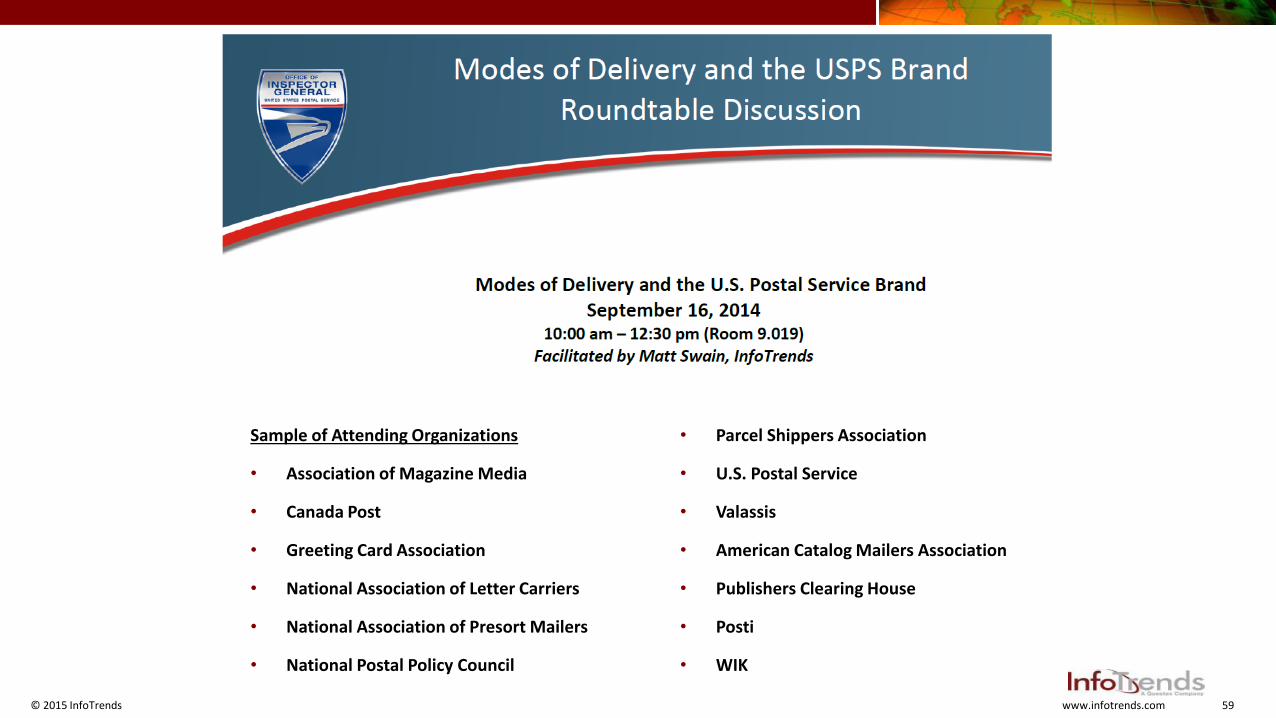
59© 2015 InfoTrends www.infotrends.com
Sample of Attending Organizations
• Association of Magazine Media
• Canada Post
• Greeting Card Association
• National Association of Letter Carriers
• National Association of Presort Mailers
• National Postal Policy Council
• Parcel Shippers Association
• U.S. Postal Service
• Valassis
• American Catalog Mailers Association
• Publishers Clearing House
• Posti
• WIK
60© 2015 InfoTrends www.infotrends.com
Key Themes from the Round Table Discussion
• We can learn from international implementations for cluster box delivery (e.g., what worked and where messaging/approach needed to be adjusted)
• Some people raised concerns about reducing Postal employee interaction with consumers and thus reducing the USPS competitive advantage
• Community cluster boxes will need to be designed to accommodate for the age of eCommerce, with an expectation for more (larger) parcels being delivered
Gary Reblin
VP, New Products & Innovation
Unite States Postal Service
United States Postal Service
Evolving now to meet tomorrow’s needs
20
4
37
0
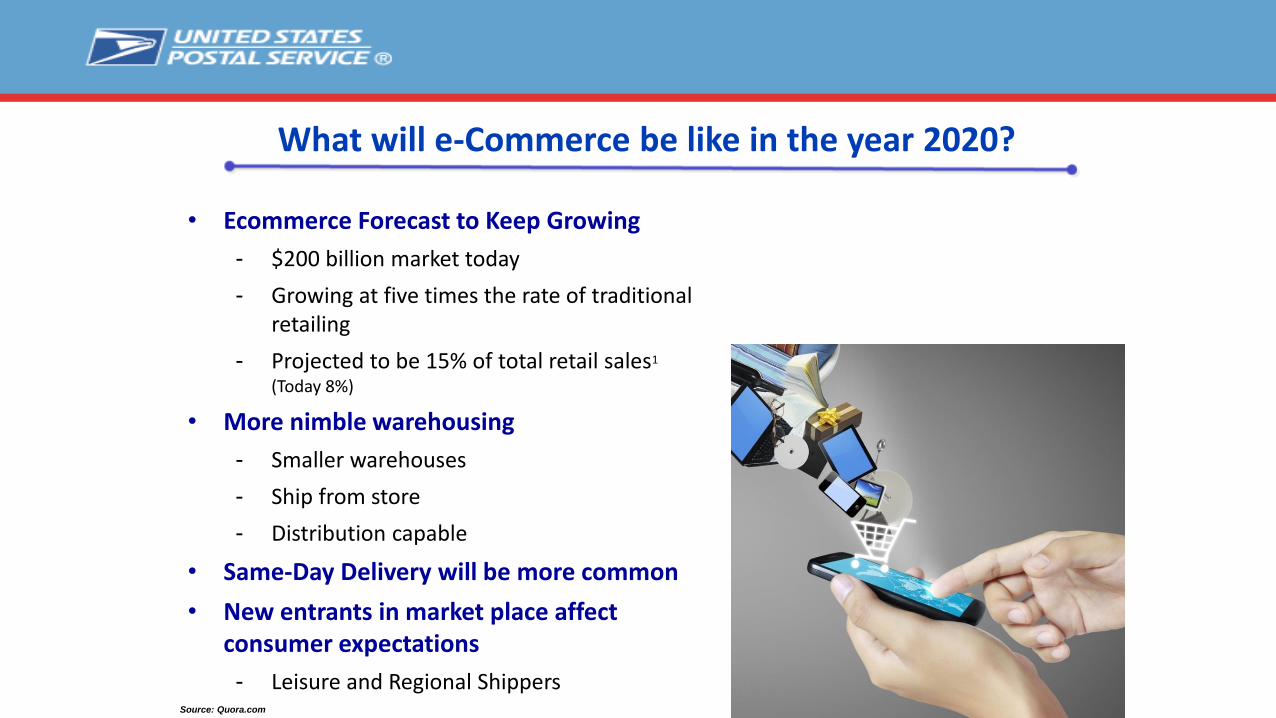
What will e-Commerce be like in the year 2020?
• Ecommerce Forecast to Keep Growing
- $200 billion market today
- Growing at five times the rate of traditional retailing
- Projected to be 15% of total retail sales1
(Today 8%)
• More nimble warehousing
- Smaller warehouses
- Ship from store
- Distribution capable
• Same-Day Delivery will be more common
• New entrants in market place affect consumer expectations
- Leisure and Regional ShippersSource: Quora.com
20
4
37
0
What will shopping be like in the year 2020?
• Shopping evolves to offer more stores that take advantage show rooming trend
- Blend of Brick and Mortar and e-Commerce
Source: 1WSJ
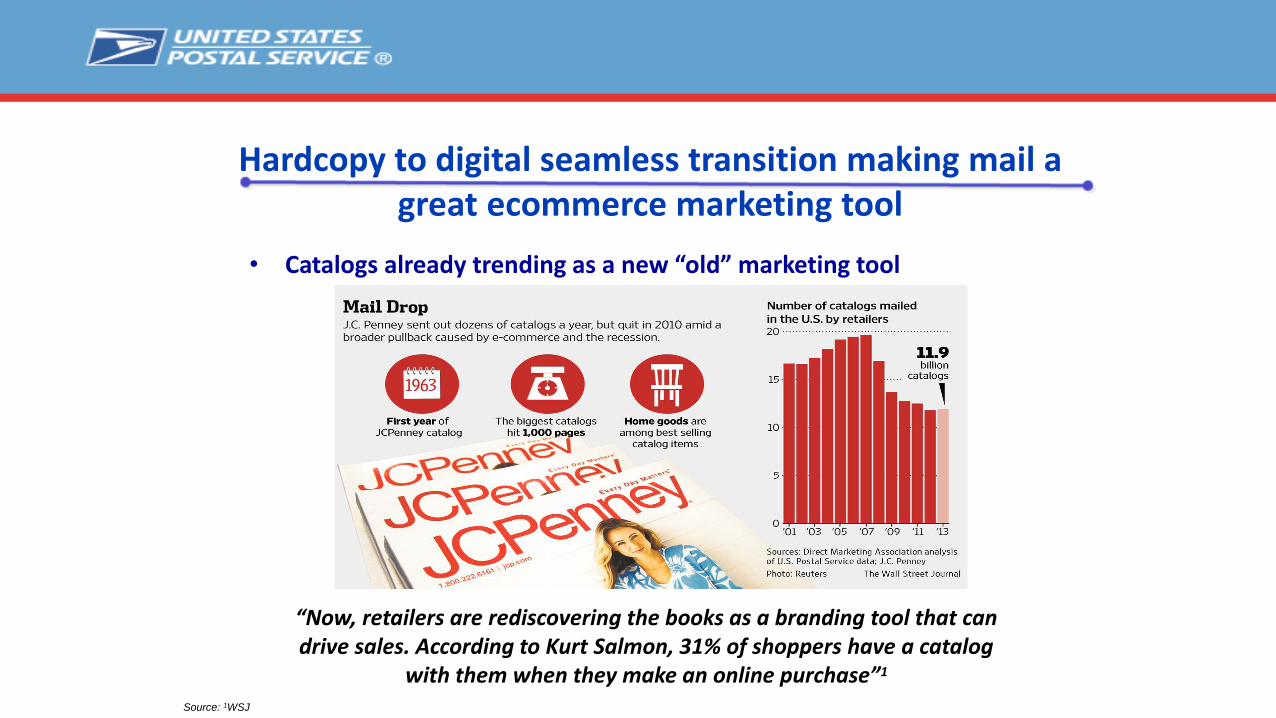
Hardcopy to digital seamless transition making mail a great ecommerce marketing tool
• Catalogs already trending as a new “old” marketing tool
“Now, retailers are rediscovering the books as a branding tool that can drive sales. According to Kurt Salmon, 31% of shoppers have a catalog
with them when they make an online purchase”1
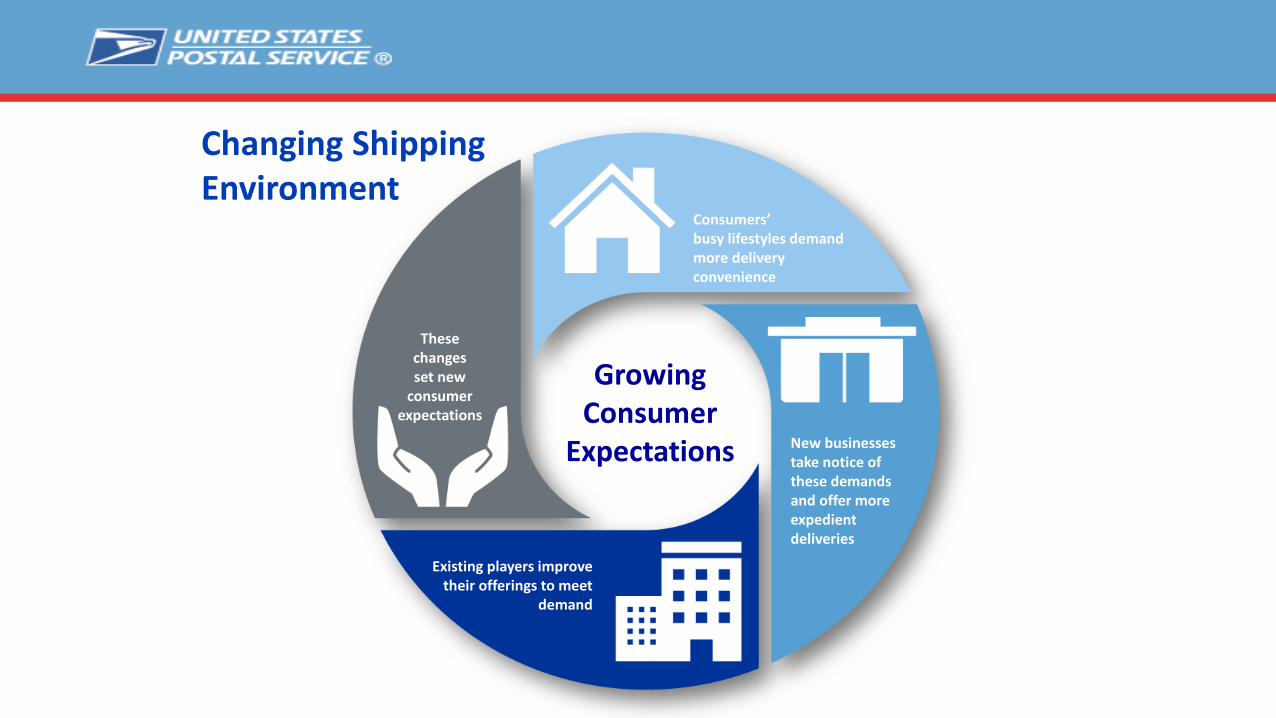
Growing Consumer
Expectations
Consumers’ busy lifestyles demand more delivery convenience
New businesses take notice of these demands and offer more expedient deliveries
Existing players improve their offerings to meet
demand
These changes set new
consumer expectations
Changing Shipping Environment
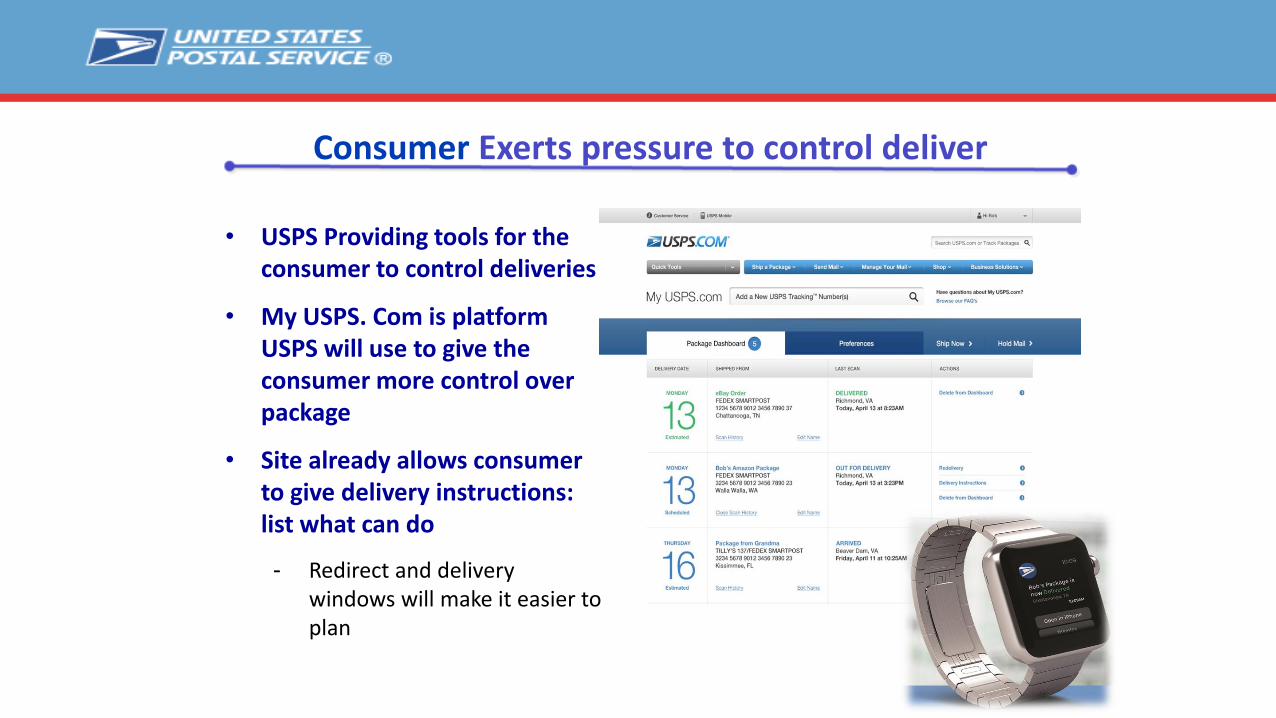
• USPS Providing tools for the consumer to control deliveries
• My USPS. Com is platform USPS will use to give the consumer more control over package
• Site already allows consumer to give delivery instructions: list what can do
- Redirect and delivery windows will make it easier to plan
Consumer Exerts pressure to control deliver
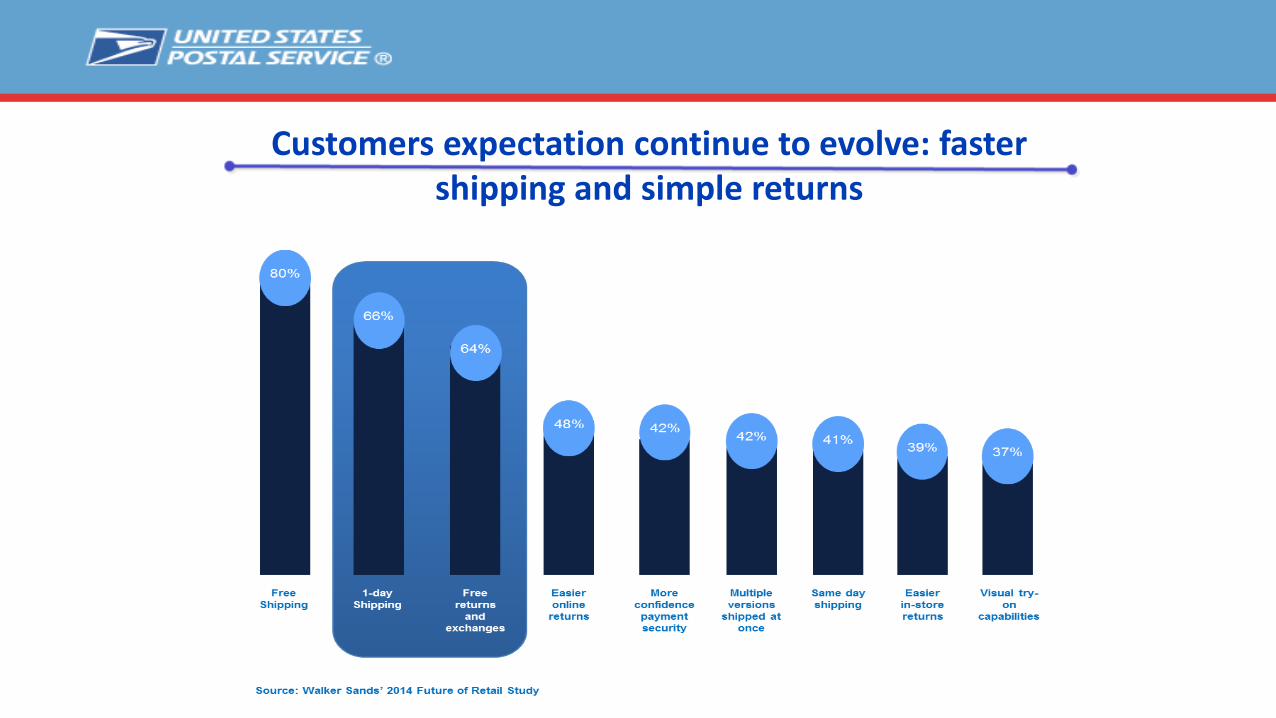
Customers expectation continue to evolve: faster shipping and simple returns
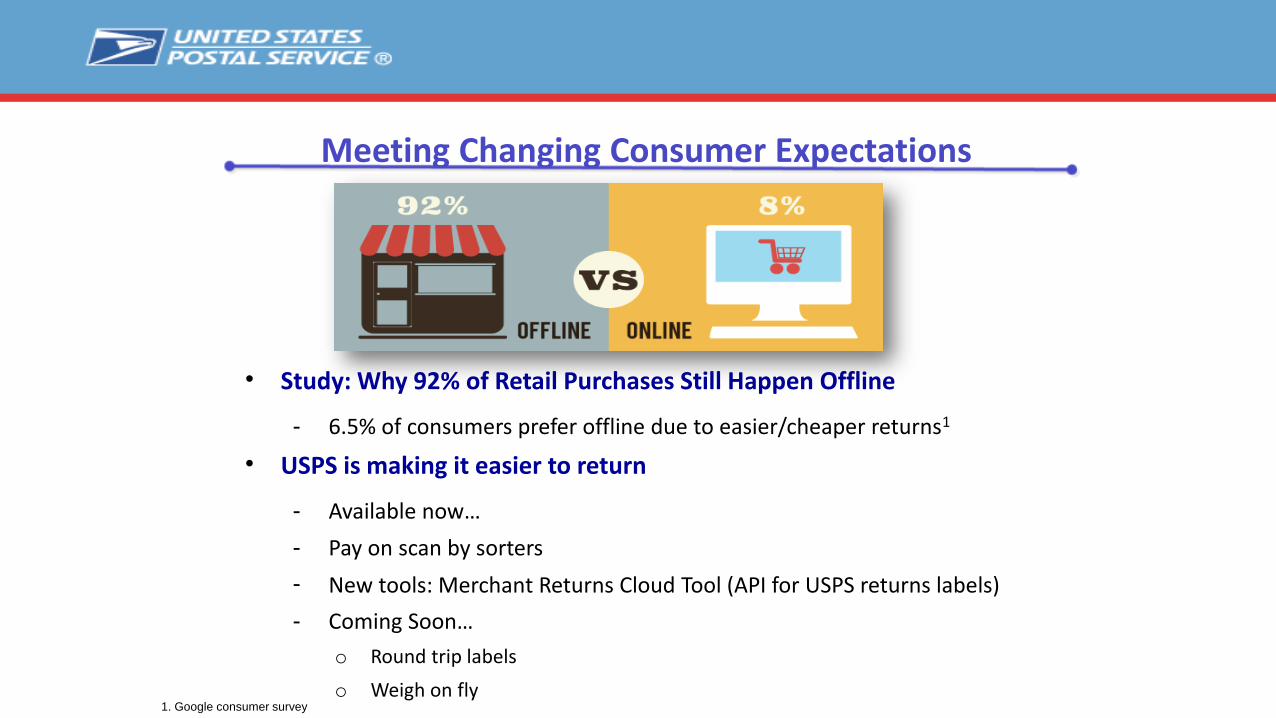
• Study: Why 92% of Retail Purchases Still Happen Offline
- 6.5% of consumers prefer offline due to easier/cheaper returns1
• USPS is making it easier to return
- Available now…
- Pay on scan by sorters
- New tools: Merchant Returns Cloud Tool (API for USPS returns labels)
- Coming Soon…
o Round trip labels
o Weigh on fly
Meeting Changing Consumer Expectations
1. Google consumer survey
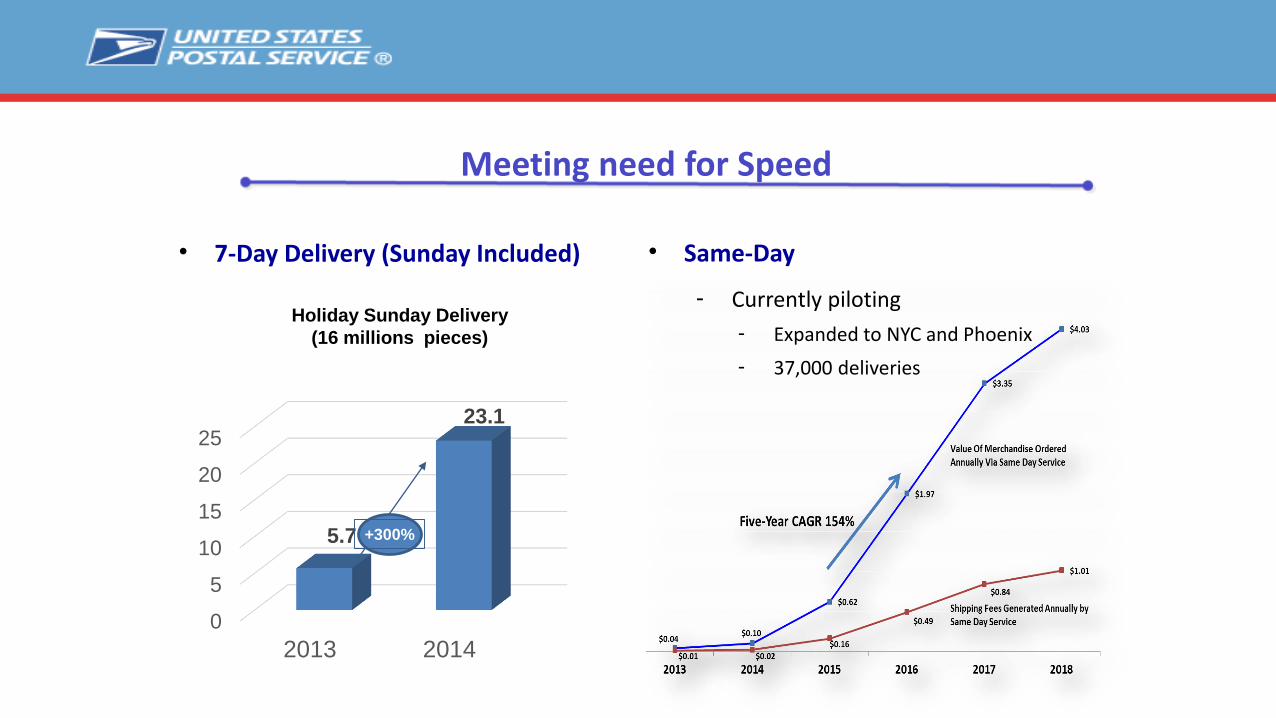
• 7-Day Delivery (Sunday Included)
Meeting need for Speed
0
5
10
15
20
25
2013 2014
5.7
23.1
+300%
Holiday Sunday Delivery
(16 millions pieces)
• Same-Day
- Currently piloting
- Expanded to NYC and Phoenix
- 37,000 deliveries
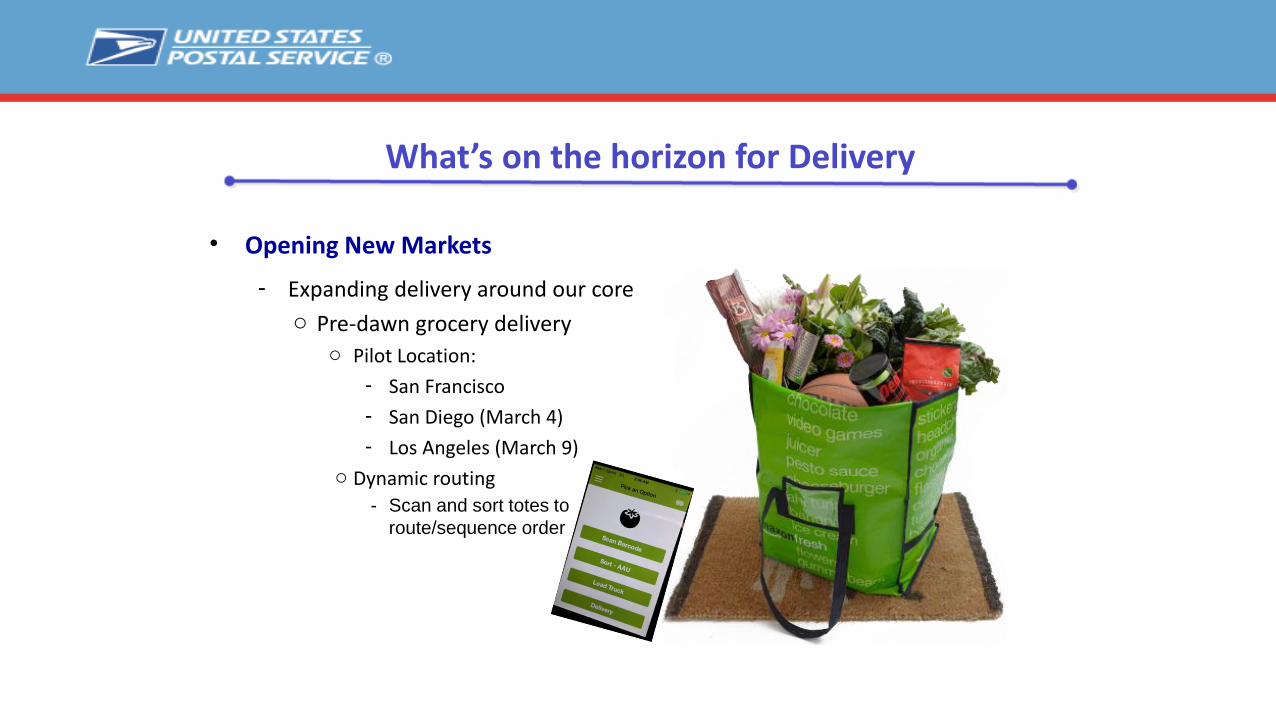
• Opening New Markets
- Expanding delivery around our core
o Pre-dawn grocery deliveryo Pilot Location:
- San Francisco
- San Diego (March 4)
- Los Angeles (March 9)
o Dynamic routing
- Scan and sort totes to
route/sequence order
What’s on the horizon for Delivery
Q & A