Embed Size (px)
Citation preview

E-COMMERCE
IN CHINA

TABLE OF
CONTENTS
E-COMMERCE IN CHINA
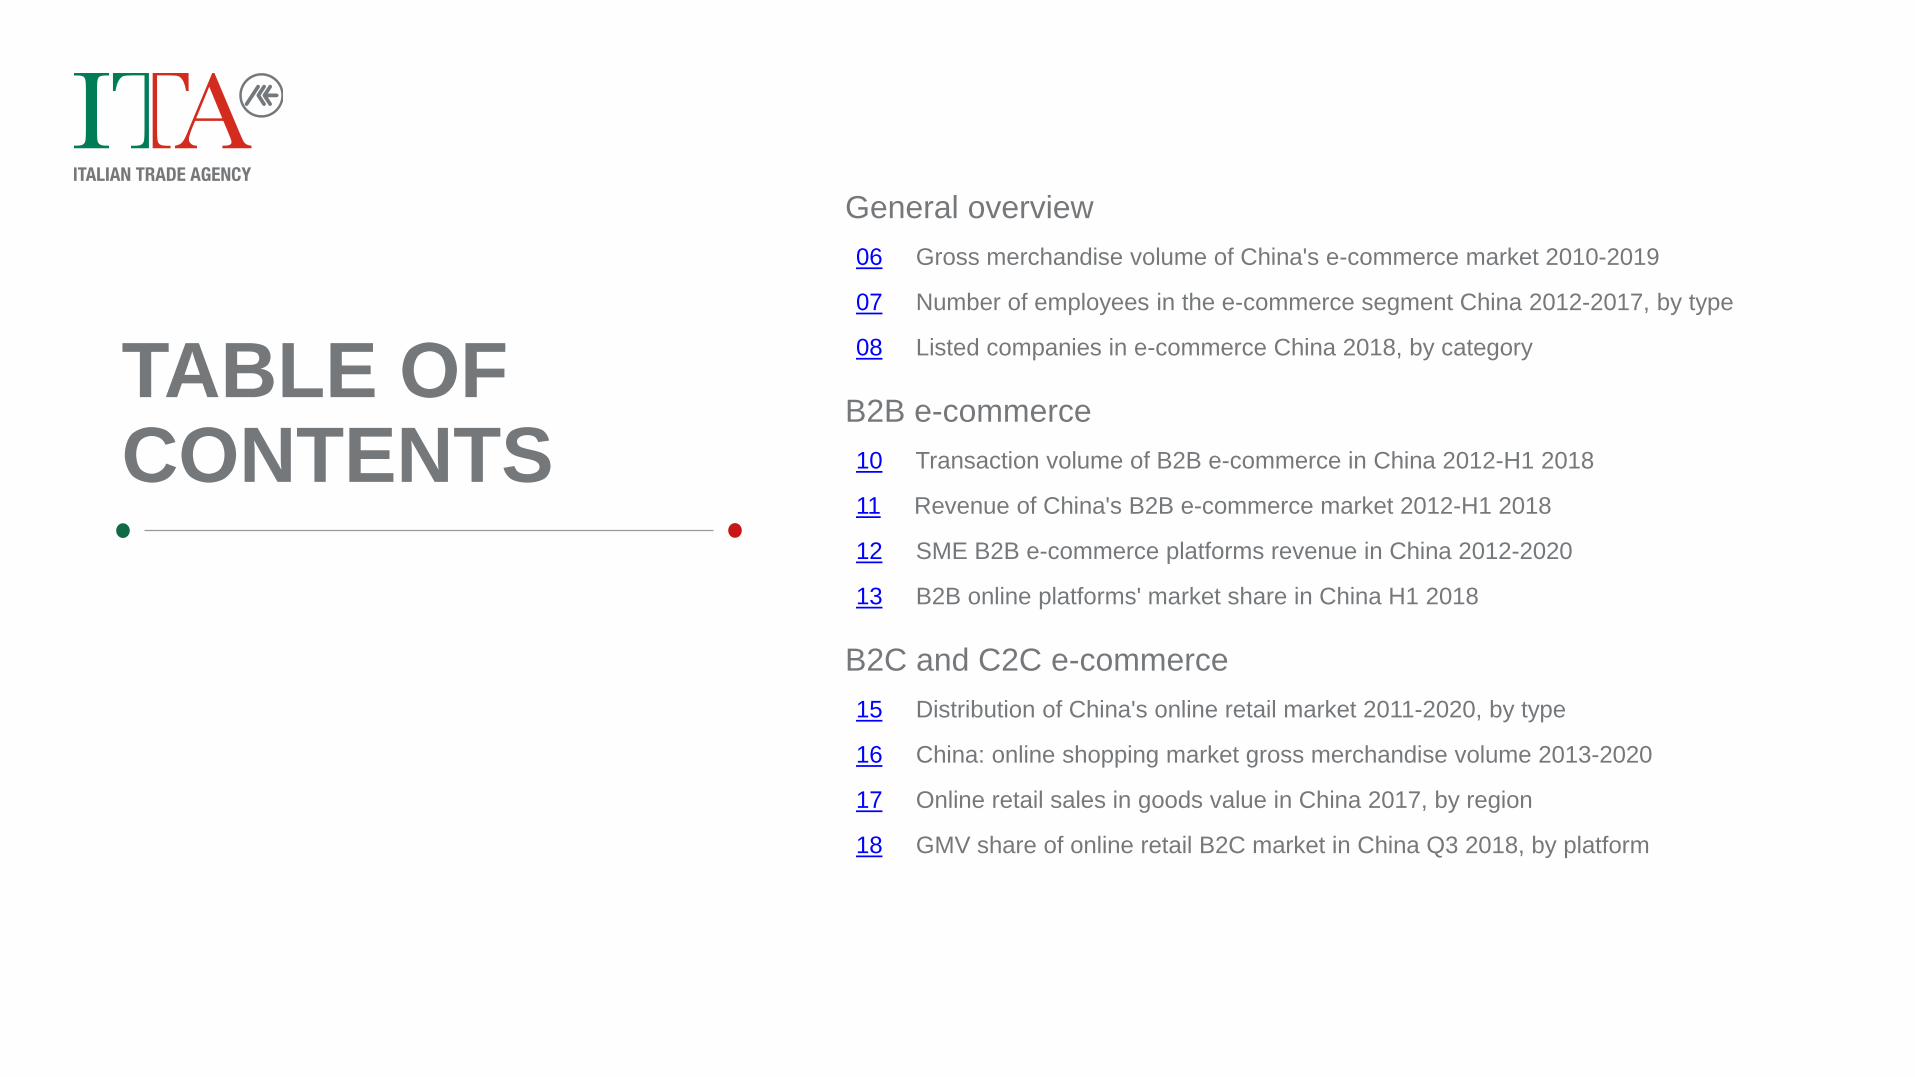
TABLE OF CONTENTS
General overview
06 Gross merchandise volume of China's e-commerce market 2010-2019
07 Number of employees in the e-commerce segment China 2012-2017, by type
08 Listed companies in e-commerce China 2018, by category
B2B e-commerce
10 Transaction volume of B2B e-commerce in China 2012-H1 2018
11 Revenue of China's B2B e-commerce market 2012-H1 2018
12 SME B2B e-commerce platforms revenue in China 2012-2020
13 B2B online platforms' market share in China H1 2018
B2C and C2C e-commerce
15 Distribution of China's online retail market 2011-2020, by type
16 China: online shopping market gross merchandise volume 2013-2020
17 Online retail sales in goods value in China 2017, by region
18 GMV share of online retail B2C market in China Q3 2018, by platform

TABLE OF CONTENTS
Cross-border e-commerce
20 Trade volume of China's cross-border e-commerce players 2011-2016
21 GMV of China's import e-commerce market 2013-2021
22 Popularity of cross-border e-commerce platforms in China 2017
23 Share of products bought on cross-border e-commerce sites in China 2017-2018,
by type24 Share of online shoppers who purchase domestically and cross-border China 2018
E-commerce consumer demographics
26 Number of online shoppers in China 2008-2018
27 Penetration rate of online shopping in China 2008-2018
28 Digital buyer penetration in China 2017-2023
29 Age structure of online shopping app users in China 2018
30 E-commerce type preference China Q2 2017, by gender

GENERAL
OVERVIEW
E-COMMERCE IN CHINA

General overview
4.86.4
8.1
10.4
13.3
16.4
20.2
24
28.1
32.7
0
5
10
15
20
25
30
35
2010 2011 2012 2013 2014 2015 2016* 2017* 2018* 2019*
Revenue in t
rilli
on y
uan
Note: China; 2010 to 2015
Further information regarding this statistic can be found on page 32.
Source(s): iResearch; ID 278552
6
GROSS MERCHANDISE VOLUME OF CHINA'S E-COMMERCE MARKET FROM 2010 TO 2019 (IN TRILLION YUAN)
GROSS MERCHANDISE VOLUME OF CHINA'S E-COMMERCE MARKET 2010-2019

General overview
1,900 2,200 2,500 2,550 2,850 3,300
14,000
16,00017,200
18,350
21,000
25,000
0
5000
10000
15000
20000
25000
30000
2012 2013 2014 2015 2016 2017
Num
ber
in e
mplo
yees in t
housands
Direct employees Indirect employees
Note: China; 2012 to 2017
Further information regarding this statistic can be found on page 33.
Source(s): 100ec.cn; ID 243872
7
NUMBER OF EMPLOYEES IN THE E-COMMERCE SEGMENT IN CHINA FROM 2012 TO 2017, BY TYPE (IN 1,000S)
NUMBER OF EMPLOYEES IN THE E-COMMERCE SEGMENT CHINA 2012-2017, BY TYPE

General overview
13
11
9
8
7
0 2 4 6 8 10 12 14
B2C
Online to offline (O2O)
Cross-border
B2B
Logistics (E-commerce)
Number of listed companies
Note: China; July 2018
Further information regarding this statistic can be found on page 34.
Source(s): 100ec.cn; Guangdong E-commerce Association; ID
912252
8
NUMBER OF LISTED COMPANIES IN E-COMMERCE IN CHINA IN 2018, BY CATEGORY
LISTED COMPANIES IN E-COMMERCE CHINA 2018, BY CATEGORY

B2B E-
COMMERCE
E-COMMERCE IN CHINA

B2B e-commerce
6.25
8.2
10
13.9
16.7
20.5
11.2
0
5
10
15
20
25
2012 2013 2014 2015 2016 2017 H1 2018
Tra
nsaction v
olu
me in t
rilli
on y
uan
Note: China; 2012 to H1 2018
Further information regarding this statistic can be found on page 35.
Source(s): 100ec.cn; ID 302040
10
TRANSACTION VOLUME OF B2B E-COMMERCE IN CHINA FROM 2012 TO 1ST HALF 2018 (IN TRILLION YUAN)
TRANSACTION VOLUME OF B2B E-COMMERCE IN CHINA 2012-H1 2018

B2B e-commerce
16
20.5
25.5
22
26
35
25.5
0
5
10
15
20
25
30
35
40
2012 2013 2014 2015 2016 2017 H1 2018
Revenue in b
illio
n y
uan
Note: China; 2012 to H1 2018
Further information regarding this statistic can be found on page 36.
Source(s): 100ec.cn; ID 723061
11
REVENUE OF CHINA'S B2B E-COMMERCE MARKET FROM 2012 TO 1ST HALF 2018 (IN BILLION YUAN)
REVENUE OF CHINA'S B2B E-COMMERCE MARKET 2012-H1 2018

B2B e-commerce
14.716.1
18.820.4
24.8
29.2
34
39.3
45.3
0
5
10
15
20
25
30
35
40
45
50
2012 2013 2014 2015 2016 2017* 2018* 2019* 2020*
Revenue in b
illio
n y
uan
Note: China; 2012 to 2016
Further information regarding this statistic can be found on page 37.
Source(s): iResearch; ID 302475
12
REVENUE OF SMALL TO MEDIUM SIZE ENTERPRISES' B2B E-COMMERCE PLATFORMS IN CHINA FROM 2012 TO 2020 (IN BILLION YUAN)
SME B2B E-COMMERCE PLATFORMS REVENUE IN CHINA 2012-2020

B2B e-commerce
Alibaba 30.07%
HC360 14.8%
Cogobuy11.6%
Mysteel.cn4.5%
Focuschina.com 1.58%
cn.toocle.com0.8%
Others 36.65%
Note: China; H1 2018
Further information regarding this statistic can be found on page 38.
Source(s): Analysys; China Internet Watch; China e-Business
Research Center; ID 243845
13
MARKET SHARE OF B2B
E-COMMERCE
PLATFORMS IN CHINA IN
1ST HALF 2018
B2B ONLINE PLATFORMS' MARKET SHARE IN CHINA H1 2018

B2C AND C2C E-
COMMERCE
E-COMMERCE IN CHINA

B2C and C2C e-commerce
74.7%
65.4%59.6%
54.9%
47.9%44.8%
40% 38%35.1% 33.2%
25.3% 34.6% 40.4% 45.1% 52.1% 55.2% 60% 62% 64.9% 66.8%
0.0%
20.0%
40.0%
60.0%
80.0%
100.0%
120.0%
2011 2012 2013 2014 2015 2016 2017 2018* 2019* 2020*
Mark
et
share
C2C B2C
Note: China; 2011 to 2017
Further information regarding this statistic can be found on page 39.
Source(s): iResearch; Fung Business Intelligence Centre ; ID
746669
15
DISTRIBUTION OF ONLINE RETAIL MARKET IN CHINA FROM 2011 TO 2020, BY TYPE
DISTRIBUTION OF CHINA'S ONLINE RETAIL MARKET 2011-2020, BY TYPE

B2C and C2C e-commerce
1.9
2.8
3.8
4.7
6.1
7.5
9.1
10.8
0
2
4
6
8
10
12
2013 2014 2015 2016 2017* 2018* 2019* 2020*
Revenue in t
rilli
on y
uan
Note: China; 2013 to 2016
Further information regarding this statistic can be found on page 40.
Source(s): iResearch; ID 278555
16
GROSS MERCHANDISE VOLUME (GMV) OF CHINA'S ONLINE SHOPPING MARKET FROM 2013 TO 2020 (IN TRILLION YUAN)
CHINA: ONLINE SHOPPING MARKET GROSS MERCHANDISE VOLUME 2013-2020
B2C and C2C e-commerce
1,360.57
850.32
581.79
554.53
514.92
264.28
208.45
147.42
113.18
110.7
110.44
97.75
95.17
83.02
72.01
0 200 400 600 800 1000 1200 1400 1600
Guangdong
Zhejiang
Shanghai
Jiangsu
Beijing
Fujian
Shandong
Sichuan
Hubei
Anhui
Hebei
Henan
Shaanxi
Tianjin
Hunan
Sales value in billion yuan
Note: China; 2017
Further information regarding this statistic can be found on page 41.
Source(s): National Bureau of Statistics of China; ID 975459
17
VALUE OF THE ONLINE RETAIL SALES IN GOODS IN CHINA IN 2017, BY REGION (IN BILLION YUAN)
ONLINE RETAIL SALES IN GOODS VALUE IN CHINA 2017, BY REGION

B2C and C2C e-commerce
59.5%
25.8%
6.4%
3.2%
1.2%
0.6%
0.5%
0.1%
0.1%
2.6%
0.0% 10.0% 20.0% 30.0% 40.0% 50.0% 60.0% 70.0%
Tmall
JD
Suning
Vipshop
Gome
Amazon
Dangdang
YHD
Jumei
Other
Market share
Note: China; Q3 2018
Further information regarding this statistic can be found on page 42.
Source(s): China Internet Watch; Analysys; ID 959881
18
GROSS MERCHANDISE VOLUME SHARE OF ONLINE RETAIL B2C MARKET IN CHINA IN 3RD QUARTER 2018, BY PLATFORM
GMV SHARE OF ONLINE RETAIL B2C MARKET IN CHINA Q3 2018, BY PLATFORM

CROSS-BORDER
E-COMMERCE
E-COMMERCE IN CHINA
Cross-border e-commerce
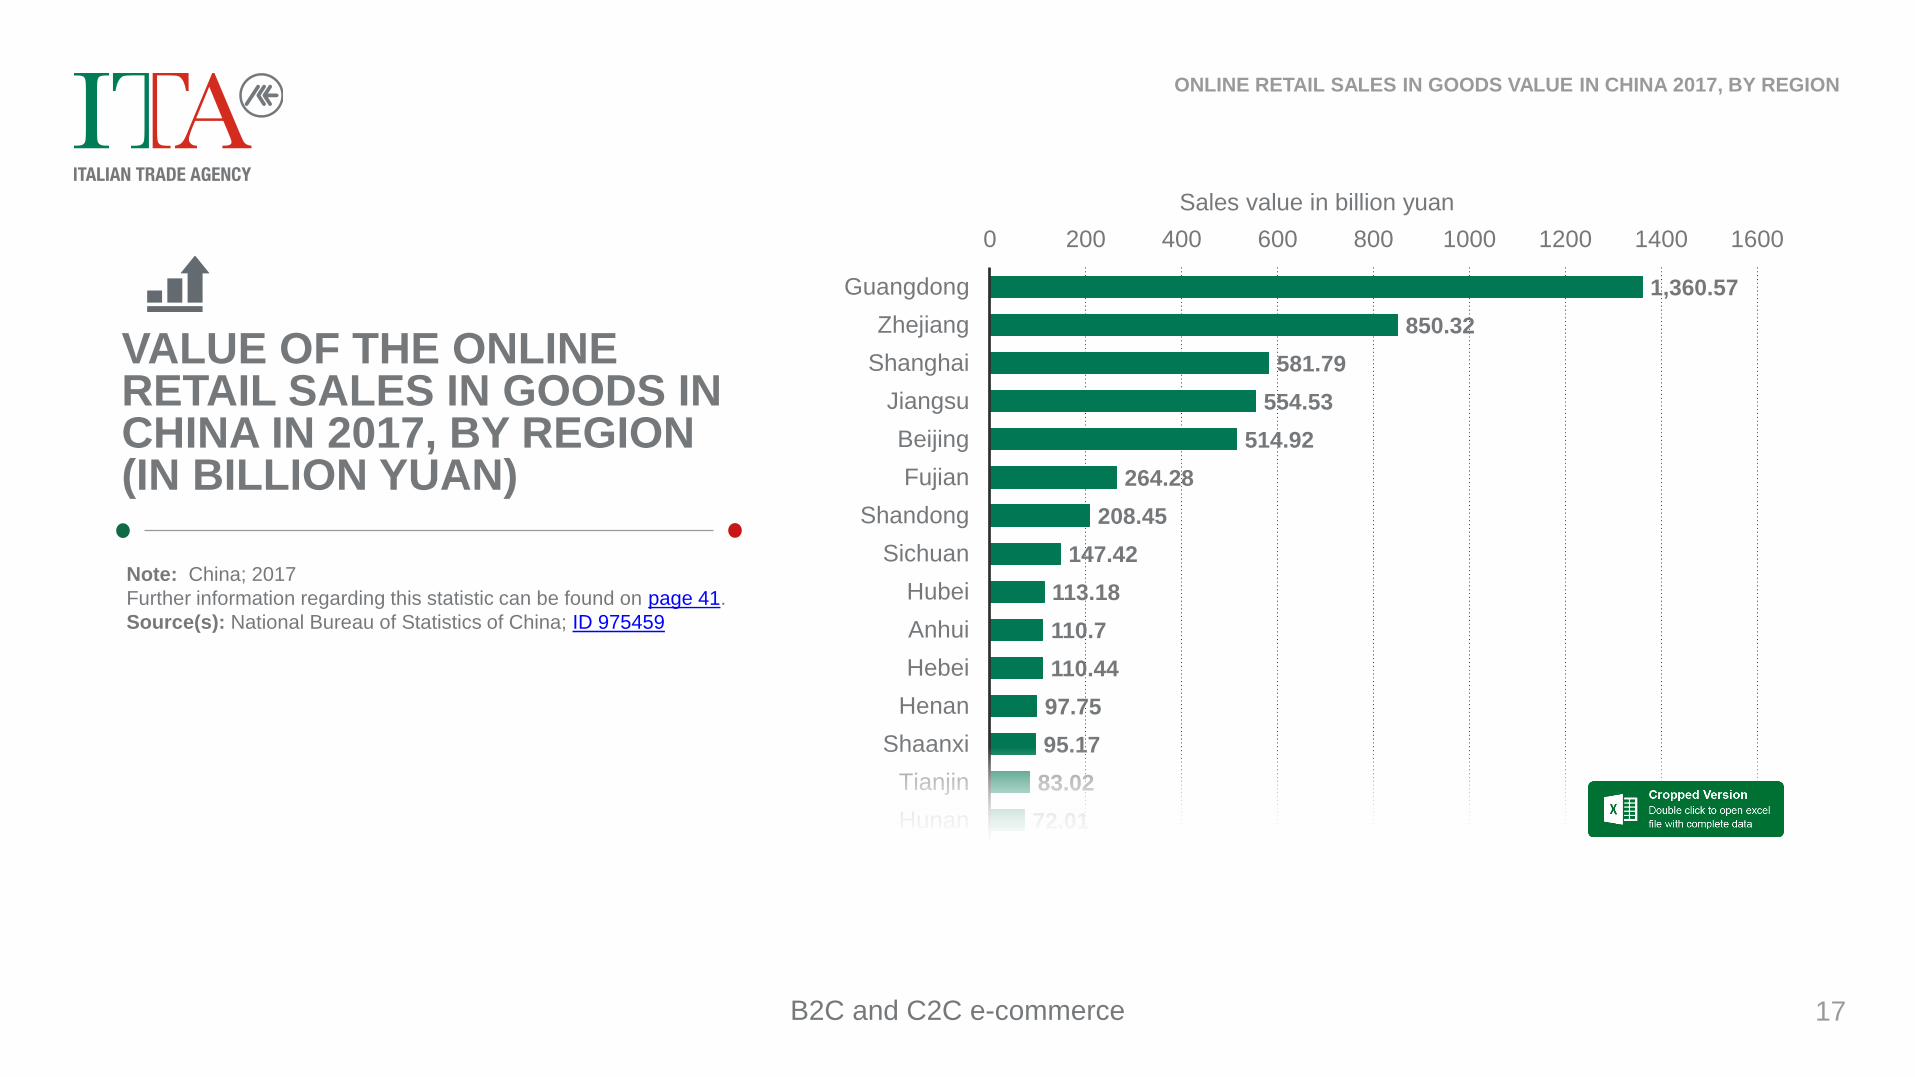
1.7
2.1
3.15
4.2
5.4
6.7
0
1
2
3
4
5
6
7
8
2011 2012 2013 2014 2015 2016
Tra
de v
olu
me in t
rilli
on y
uan
Note: China; 2011 to 2016
Further information regarding this statistic can be found on page 43.
Source(s): 100ec.cn; ID 722987
20
TRADE VOLUME OF CHINA'S CROSS-BORDER E-COMMERCE PLAYERS FROM 2011 TO 2016 (IN TRILLION YUAN)
TRADE VOLUME OF CHINA'S CROSS-BORDER E-COMMERCE PLAYERS 2011-2016
Cross-border e-commerce
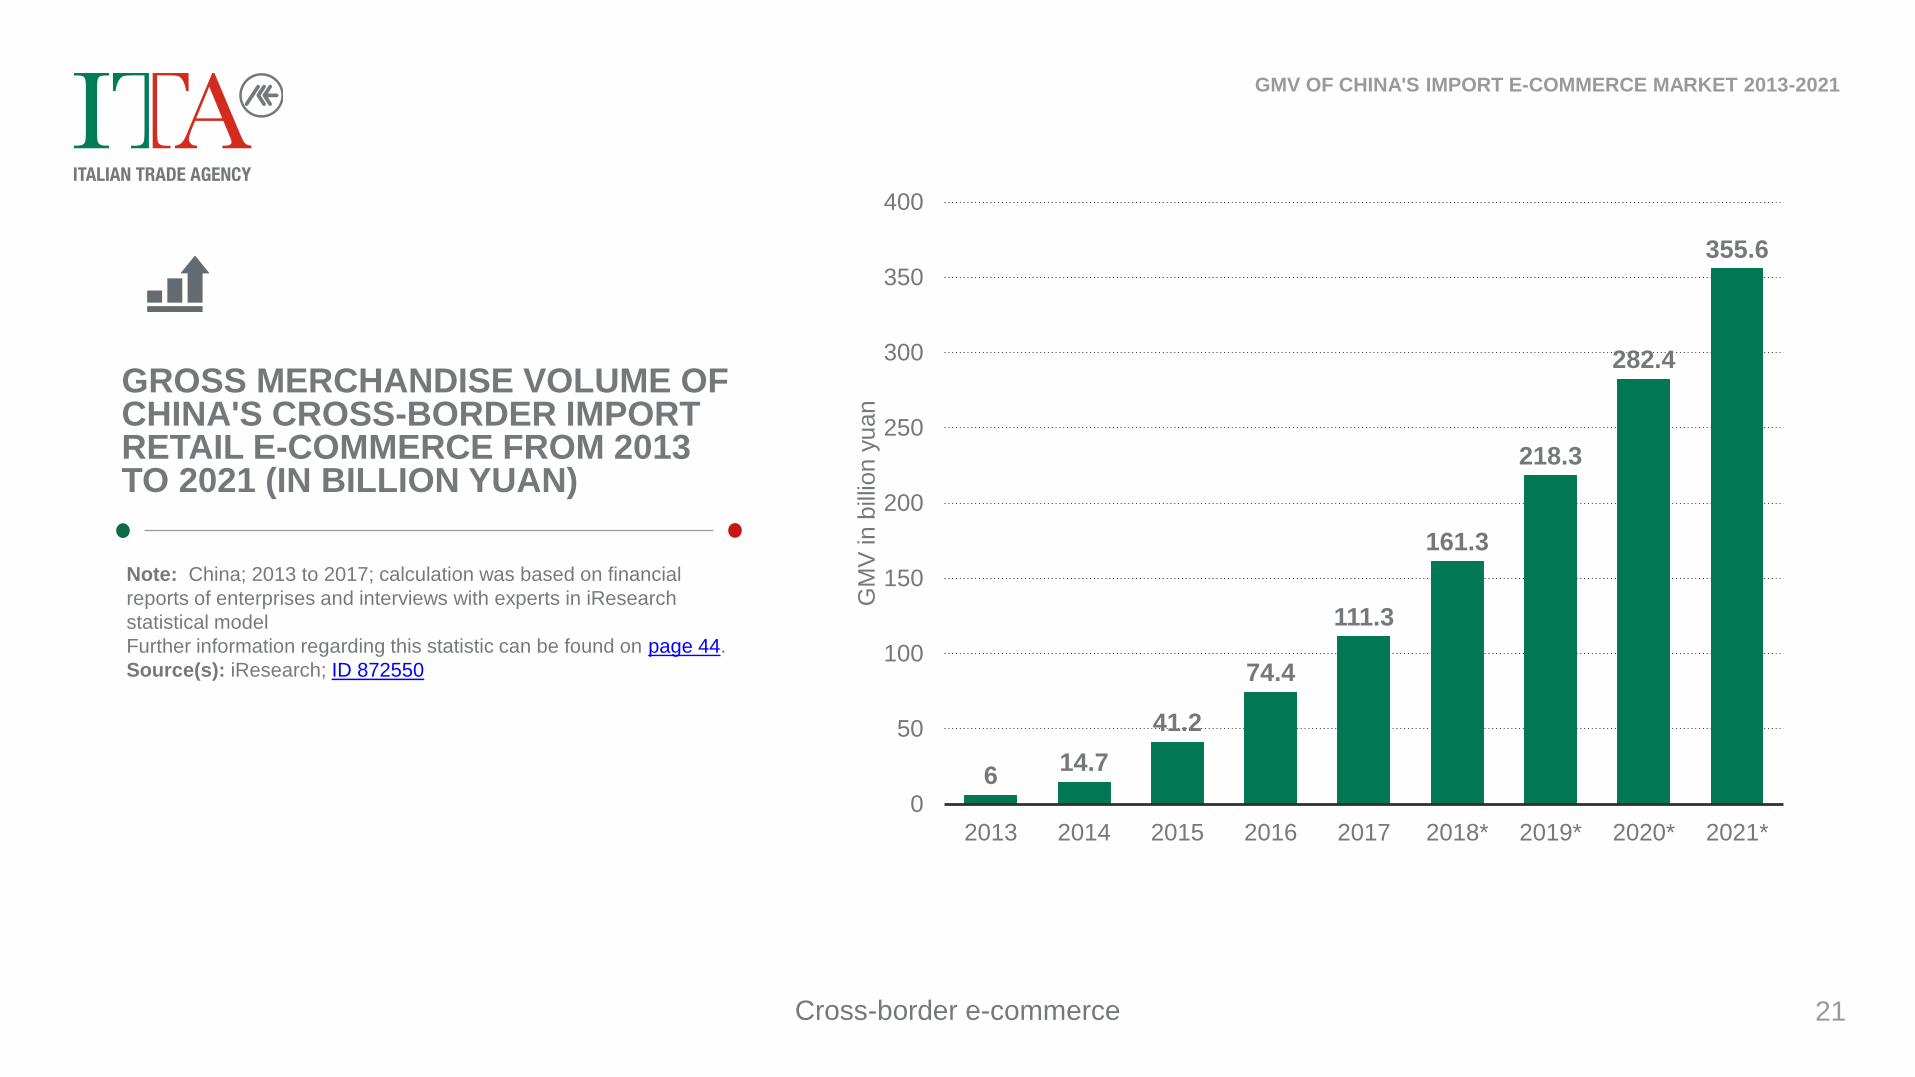
614.7
41.2
74.4
111.3
161.3
218.3
282.4
355.6
0
50
100
150
200
250
300
350
400
2013 2014 2015 2016 2017 2018* 2019* 2020* 2021*
GM
V in b
illio
n y
uan
Note: China; 2013 to 2017; calculation was based on financial
reports of enterprises and interviews with experts in iResearch
statistical model
Further information regarding this statistic can be found on page 44.
Source(s): iResearch; ID 872550
21
GROSS MERCHANDISE VOLUME OF CHINA'S CROSS-BORDER IMPORT RETAIL E-COMMERCE FROM 2013 TO 2021 (IN BILLION YUAN)
GMV OF CHINA'S IMPORT E-COMMERCE MARKET 2013-2021

Cross-border e-commerce
58.2%
53.7%
49.5%
38.3%
31.3%
22%
17.8%
5.6%
0.0% 10.0% 20.0% 30.0% 40.0% 50.0% 60.0% 70.0%
Tmall International
NetEase Kaola
JD Global
Little Red Book (Xiaohongshu)
Ymatou
VIP Global
Mia
Daling
Share of respondents
Note: China; December 2017; 2,253
Further information regarding this statistic can be found on page 45.
Source(s): iiMedia Research; ID 945068
22
POPULARITY OF CROSS-BORDER E-COMMERCE PLATFORMS IN CHINA AS OF DECEMBER 2017
POPULARITY OF CROSS-BORDER E-COMMERCE PLATFORMS IN CHINA 2017

Cross-border e-commerce
55%
49%
48.3%
35.6%
34.6%
34.1%
32.9%
32%
25.9%
24.2%
21.3%
16.9%
0.0% 10.0% 20.0% 30.0% 40.0% 50.0% 60.0%
Food
Beauty and personal care products
Apparel, footwear and bags
Home products
Baby and maternity goods
Digital products, home appliances
Healthcare products
Sporting goods and outdoor equipment
Fresh food
Toys
Jewelry
Automobile equipments
Share of products
Note: China; March 2017 to March 2018
Further information regarding this statistic can be found on page 46.
Source(s): iResearch; Fung Business Intelligence Centre ; ID
944629
23
SHARE OF PRODUCTS PURCHASED ON CROSS-BORDER E-COMMERCE PLATFORMS IN CHINA BETWEEN MARCH 2017 AND MARCH 2018, BY CATEGORY
SHARE OF PRODUCTS BOUGHT ON CROSS-BORDER E-COMMERCE SITES IN CHINA 2017-2018, BY TYPE

Cross-border e-commerce
7%
35%
57%
0.0%
10.0%
20.0%
30.0%
40.0%
50.0%
60.0%
Shop cross border only Shop domestically andcross border
Shop domestically only
Share
of re
sponden
ts
Note: Asia, China; March 13 to May 1, 2018; 18+; 1000
Respondents; Among online shoppers.
Further information regarding this statistic can be found on page 47.
Source(s): PayPal; Ipsos; ID 747557
24
SHARE OF ONLINE SHOPPERS WHO PURCHASE DOMESTICALLY AND CROSS-BORDER IN CHINA IN 2018
SHARE OF ONLINE SHOPPERS WHO PURCHASE DOMESTICALLY AND CROSS-BORDER CHINA 2018

E-COMMERCE CONSUMER DEMOGRAPHICS
E-COMMERCE IN CHINA

E-commerce consumer demographics
74108
160.51193.95
242.02
301.89
361.42
413.25
466.7
533.32
610.11
0
100
200
300
400
500
600
700
2008 2009 2010 2011 2012 2013 2014 2015 2016 2017 2018
Num
ber
of onlin
e s
hoppers
in m
illio
ns
Note: China; 2008 to 2018
Further information regarding this statistic can be found on page 48.
Source(s): CNNIC; ID 277391
26
NUMBER OF ONLINE
SHOPPERS IN CHINA
FROM 2008 TO 2018 (IN
MILLIONS)
NUMBER OF ONLINE SHOPPERS IN CHINA 2008-2018

E-commerce consumer demographics
24.8%28.1%
35.1%37.8%
42.9%
48.9%
55.7%
60%63.8%
69.1%
73.6%
0.0%
10.0%
20.0%
30.0%
40.0%
50.0%
60.0%
70.0%
80.0%
2008 2009 2010 2011 2012 2013 2014 2015 2016 2017 2018
Share
of in
tern
et
users
who s
hop o
nlin
e
Note: China; 2008 to 2018
Further information regarding this statistic can be found on page 49.
Source(s): CNNIC; ID 302071
27
PENETRATION RATE OF
ONLINE SHOPPING IN
CHINA FROM 2008 TO 2018
PENETRATION RATE OF ONLINE SHOPPING IN CHINA 2008-2018

E-commerce consumer demographics
53.5
56.1
58.5
60.8
63.1
65.3
67.5
52.1
54.1
56.1
58.1
60.1
62.1
64.1
66.1
68.1
70.1
2017 2018 2019 2020 2021 2022 2023
Share
of popula
tion in p
erc
ent
Note: 2018
Further information regarding this statistic can be found on page 50.
Source(s): Statista; ID 891315
28
DIGITAL BUYER PENETRATION IN CHINA FROM 2017 TO 2023 (IN PERCENT)
DIGITAL BUYER PENETRATION IN CHINA 2017-2023

E-commerce consumer demographics
6.5%
24.1%
21.6%
18.7%
15%14.1%
0.0%
5.0%
10.0%
15.0%
20.0%
25.0%
30.0%
Under 18 19-24 25-30 31-35 36-40 Above 40
Share
of e-c
om
merc
e a
pp u
sers
Note: China; February 2018
Further information regarding this statistic can be found on page 51.
Source(s): iResearch; ID 871581
29
AGE DISTRIBUTION OF E-COMMERCE APP USERS IN CHINA AS OF FEBRUARY 2018
AGE STRUCTURE OF ONLINE SHOPPING APP USERS IN CHINA 2018

E-commerce consumer demographics
80%
66%
20%
34%
0.0%
10.0%
20.0%
30.0%
40.0%
50.0%
60.0%
70.0%
80.0%
90.0%
Cross-border e-commerce General e-commerce
Share
of re
spondents
Female Male
Note: China; Q2 2017
Further information regarding this statistic can be found on page 52.
Source(s): Analysys; ID 856357
30
PREFERRED E-
COMMERCE TYPES IN
CHINA AS OF Q2 2017, BY
GENDER
E-COMMERCE TYPE PREFERENCE CHINA Q2 2017, BY GENDER

REFERENCES
E-COMMERCE IN CHINA

References 32
Source and methodology information
Source(s) iResearch
Conducted by iResearch
Survey period 2010 to 2015
Region(s) China
Number of
respondents
n.a.
Age group n.a.
Special
characteristics
n.a.
Published by iResearch
Publication date February 2017
Original source iresearchchina.com
Website URL visit the website
Back to statistic
Notes:
* Forecast. According to the source, the data were calculated
based on the released financial reports of enterprises,
interviews on industries and iResearch's statistical forecasting
data. Figures before 2011 have been taken from previous
publications. Note: 1 yuan equals about 0.15 U.S. dollars and
0.13 euros (as of May 2018).GROSS MERCHANDISE VOLUME OF CHINA'S E-COMMERCE MARKET FROM 2010 TO 2019 (IN TRILLION YUAN)
GROSS MERCHANDISE VOLUME OF CHINA'S E-COMMERCE MARKET 2010-2019

References 33
Source and methodology information
Source(s) 100ec.cn
Conducted by 100ec.cn
Survey period 2012 to 2017
Region(s) China
Number of
respondents
n.a.
Age group n.a.
Special
characteristics
n.a.
Published by 100ec.cn
Publication date June 2018
Original source Chinese E-commerce market data
monitoring report 2017, page 11
Website URL visit the website
Back to statistic
Notes:
n.a.
NUMBER OF EMPLOYEES IN THE E-COMMERCE SEGMENT IN CHINA FROM 2012 TO 2017, BY TYPE (IN 1,000S)
NUMBER OF EMPLOYEES IN THE E-COMMERCE SEGMENT CHINA 2012-2017, BY TYPE

References 34
Source and methodology information
Source(s) 100ec.cn; Guangdong E-commerce
Association
Conducted by 100ec.cn
Survey period July 2018
Region(s) China
Number of
respondents
n.a.
Age group n.a.
Special
characteristics
n.a.
Published by Guangdong E-commerce Association
Publication date July 2018
Original source gd-eca.org.cn
Website URL visit the website
Back to statistic
Notes:
n.a.
NUMBER OF LISTED COMPANIES IN E-COMMERCE IN CHINA IN 2018, BY CATEGORY
LISTED COMPANIES IN E-COMMERCE CHINA 2018, BY CATEGORY

References 35
Source and methodology information
Source(s) 100ec.cn
Conducted by 100ec.cn
Survey period 2012 to H1 2018
Region(s) China
Number of
respondents
n.a.
Age group n.a.
Special
characteristics
n.a.
Published by 100ec.cn
Publication date September 2018
Original source China's E-commerce Market Data Monitoring
Report H1 2018
Website URL visit the website
Back to statistic
Notes:
Note: 1 yuan equals approximately 0.15 U.S. dollars and 0.13
euros (as of February 2019). Earlier figures have been taken
from previous publications.
TRANSACTION VOLUME OF B2B E-COMMERCE IN CHINA FROM 2012 TO 1ST HALF 2018 (IN TRILLION YUAN)
TRANSACTION VOLUME OF B2B E-COMMERCE IN CHINA 2012-H1 2018

References 36
Source and methodology information
Source(s) 100ec.cn
Conducted by 100ec.cn
Survey period 2012 to H1 2018
Region(s) China
Number of
respondents
n.a.
Age group n.a.
Special
characteristics
n.a.
Published by 100ec.cn
Publication date September 2018
Original source China E-Commerce Market Data Monitoring
Report H1 2018, page 6
Website URL visit the website
Back to statistic
Notes:
Note: 1 yuan equals approximately 0.15 U.S. dollars and 0.13
euros (as of February 2019).
REVENUE OF CHINA'S B2B E-COMMERCE MARKET FROM 2012 TO 1ST HALF 2018 (IN BILLION YUAN)
REVENUE OF CHINA'S B2B E-COMMERCE MARKET 2012-H1 2018

References 37
Source and methodology information
Source(s) iResearch
Conducted by iResearch
Survey period 2012 to 2016
Region(s) China
Number of
respondents
n.a.
Age group n.a.
Special
characteristics
n.a.
Published by iResearch
Publication date February 2018
Original source iresearchchina.com
Website URL visit the website
Back to statistic
Notes:
*Estimate. Note: 1 yuan equals approximately 0.15 U.S. dollars
and 0.13 euros (as of January 2019).
REVENUE OF SMALL TO MEDIUM SIZE ENTERPRISES' B2B E-COMMERCE PLATFORMS IN CHINA FROM 2012 TO 2020 (IN BILLION YUAN)
SME B2B E-COMMERCE PLATFORMS REVENUE IN CHINA 2012-2020

References 38
Source and methodology information
Source(s) Analysys; China Internet Watch; China e-
Business Research Center
Conducted by Analysys; China e-Business Research
Center
Survey period H1 2018
Region(s) China
Number of
respondents
n.a.
Age group n.a.
Special
characteristics
n.a.
Published by China Internet Watch; China e-Business
Research Center
Publication date September 2018
Original source Chinese E-commerce market data
monitoring report H1 2018, page 22
Website URL visit the website
Back to statistic
Notes:
n.a.
MARKET SHARE OF B2B
E-COMMERCE
PLATFORMS IN CHINA IN
1ST HALF 2018
B2B ONLINE PLATFORMS' MARKET SHARE IN CHINA H1 2018

References 39
Source and methodology information
Source(s) iResearch; Fung Business Intelligence
Centre
Conducted by iResearch
Survey period 2011 to 2017
Region(s) China
Number of
respondents
n.a.
Age group n.a.
Special
characteristics
n.a.
Published by Fung Business Intelligence Centre
Publication date October 2018
Original source Spotlight on China Retail - October 2018
Website URL visit the website
Back to statistic
Notes:
*Estimate.
DISTRIBUTION OF ONLINE RETAIL MARKET IN CHINA FROM 2011 TO 2020, BY TYPE
DISTRIBUTION OF CHINA'S ONLINE RETAIL MARKET 2011-2020, BY TYPE

References 40
Source and methodology information
Source(s) iResearch
Conducted by iResearch
Survey period 2013 to 2016
Region(s) China
Number of
respondents
n.a.
Age group n.a.
Special
characteristics
n.a.
Published by iResearch
Publication date February 2018
Original source iresearchchina.com
Website URL visit the website
Back to statistic
Notes:
*Forecast. Excludes download of paid digital products, airline
tickets and online bill payments. According to the source, the
data were calculated based on the released financial reports of
enterprises, interviews with industry experts and iResearch's
statistical forecasting data. Size of online shopping market
indicates the sum of B2C and C2C shopping websites, and
transactions like download of paid digital products, air tickets
and online bill payments are excluded. Note: 1 yuan equals
approximately 0.15 U.S. dollars and 0.13 euros (as of May
2018).
GROSS MERCHANDISE VOLUME (GMV) OF CHINA'S ONLINE SHOPPING MARKET FROM 2013 TO 2020 (IN TRILLION YUAN)
CHINA: ONLINE SHOPPING MARKET GROSS MERCHANDISE VOLUME 2013-2020

References 41
Source and methodology information
Source(s) National Bureau of Statistics of China
Conducted by National Bureau of Statistics of China
Survey period 2017
Region(s) China
Number of
respondents
n.a.
Age group n.a.
Special
characteristics
n.a.
Published by National Bureau of Statistics of China
Publication date October 2018
Original source China Statistical Yearbook 2018
Website URL visit the website
Back to statistic
Notes:
Note: 1 yuan equals approximately 0.15 U.S. dollars and 0.13
euros (as of February 2019).
VALUE OF THE ONLINE RETAIL SALES IN GOODS IN CHINA IN 2017, BY REGION (IN BILLION YUAN)
ONLINE RETAIL SALES IN GOODS VALUE IN CHINA 2017, BY REGION

References 42
Source and methodology information
Source(s) China Internet Watch; Analysys
Conducted by Analysys
Survey period Q3 2018
Region(s) China
Number of
respondents
n.a.
Age group n.a.
Special
characteristics
n.a.
Published by China Internet Watch
Publication date January 2019
Original source chinainternetwatch.com
Website URL visit the website
Back to statistic
Notes:
n.a.
GROSS MERCHANDISE VOLUME SHARE OF ONLINE RETAIL B2C MARKET IN CHINA IN 3RD QUARTER 2018, BY PLATFORM
GMV SHARE OF ONLINE RETAIL B2C MARKET IN CHINA Q3 2018, BY PLATFORM

References 43
Source and methodology information
Source(s) 100ec.cn
Conducted by 100ec.cn
Survey period 2011 to 2016
Region(s) China
Number of
respondents
n.a.
Age group n.a.
Special
characteristics
n.a.
Published by 100ec.cn
Publication date May 2017
Original source China E-Commerce Market Data Report
2016, page 59
Website URL visit the website
Back to statistic
Notes:
Note: 1 yuan equals approximately 0.15 U.S. dollars and 0.13
euro as of July 2017.
TRADE VOLUME OF CHINA'S CROSS-BORDER E-COMMERCE PLAYERS FROM 2011 TO 2016 (IN TRILLION YUAN)
TRADE VOLUME OF CHINA'S CROSS-BORDER E-COMMERCE PLAYERS 2011-2016
References 44
Source and methodology information
Source(s) iResearch
Conducted by iResearch
Survey period 2013 to 2017
Region(s) China
Number of
respondents
n.a.
Age group n.a.
Special
characteristics
calculation was based on financial reports of
enterprises and interviews with experts in
iResearch statistical model
Published by iResearch
Publication date May 2018
Original source iresearchchina.com
Website URL visit the website
Back to statistic
Notes:
*Estimate. Note: 1 yuan equals approximately 0.16 U.S. dollars
and 0.13 euro as of June 2018.
GROSS MERCHANDISE VOLUME OF CHINA'S CROSS-BORDER IMPORT RETAIL E-COMMERCE FROM 2013 TO 2021 (IN BILLION YUAN)
GMV OF CHINA'S IMPORT E-COMMERCE MARKET 2013-2021

References 45
Source and methodology information
Source(s) iiMedia Research
Conducted by iiMedia Research
Survey period December 2017
Region(s) China
Number of
respondents
2,253
Age group n.a.
Special
characteristics
n.a.
Published by iiMedia Research
Publication date February 2018
Original source 2017-2018 China cross-border e-commerce
market research report
Website URL visit the website
Back to statistic
Notes:
n.a.
POPULARITY OF CROSS-BORDER E-COMMERCE PLATFORMS IN CHINA AS OF DECEMBER 2017
POPULARITY OF CROSS-BORDER E-COMMERCE PLATFORMS IN CHINA 2017

References 46
Source and methodology information
Source(s) iResearch; Fung Business Intelligence
Centre
Conducted by iResearch; Fung Business Intelligence
Centre
Survey period March 2017 to March 2018
Region(s) China
Number of
respondents
n.a.
Age group n.a.
Special
characteristics
n.a.
Published by Fung Business Intelligence Centre
Publication date October 2018
Original source Spotlight on China Retail - Issue 8, page 6
Website URL visit the website
Back to statistic
Notes:
n.a.
SHARE OF PRODUCTS PURCHASED ON CROSS-BORDER E-COMMERCE PLATFORMS IN CHINA BETWEEN MARCH 2017 AND MARCH 2018, BY CATEGORY
SHARE OF PRODUCTS BOUGHT ON CROSS-BORDER E-COMMERCE SITES IN CHINA 2017-2018, BY TYPE

References 47
Source and methodology information
Source(s) PayPal; Ipsos
Conducted by PayPal; Ipsos
Survey period March 13 to May 1, 2018
Region(s) Asia, China
Number of
respondents
1000
Age group 18+
Special
characteristics
Among online shoppers.
Published by PayPal
Publication date July 2018
Original source PayPal Cross-Border Consumer Research
2018, page 6
Website URL visit the website
Back to statistic
Notes:
The question was phrased by the source as follows: "Thinking
about shopping online, from which of the following country or
geographies` websites have you purchased in the past 12
months?".
SHARE OF ONLINE SHOPPERS WHO PURCHASE DOMESTICALLY AND CROSS-BORDER IN CHINA IN 2018
SHARE OF ONLINE SHOPPERS WHO PURCHASE DOMESTICALLY AND CROSS-BORDER CHINA 2018
References 48
Source and methodology information
Source(s) CNNIC
Conducted by CNNIC
Survey period 2008 to 2018
Region(s) China
Number of
respondents
n.a.
Age group n.a.
Special
characteristics
n.a.
Published by CNNIC
Publication date February 2019
Original source 43rd Statistical Report on Internet
Development in China February 2019, page
27
Website URL visit the website
Back to statistic
Notes:
n.a.
NUMBER OF ONLINE
SHOPPERS IN CHINA
FROM 2008 TO 2018 (IN
MILLIONS)
NUMBER OF ONLINE SHOPPERS IN CHINA 2008-2018
References 49
Source and methodology information
Source(s) CNNIC
Conducted by CNNIC
Survey period 2008 to 2018
Region(s) China
Number of
respondents
n.a.
Age group n.a.
Special
characteristics
n.a.
Published by CNNIC
Publication date February 2019
Original source 43rd Statistical Report on Internet
Development in China February 2019, page
27
Website URL visit the website
Back to statistic
Notes:
n.a.
PENETRATION RATE OF
ONLINE SHOPPING IN
CHINA FROM 2008 TO 2018
PENETRATION RATE OF ONLINE SHOPPING IN CHINA 2008-2018

References 50
Source and methodology information
Source(s) Statista
Conducted by Statista
Survey period 2018
Region(s) n.a.
Number of
respondents
n.a.
Age group n.a.
Special
characteristics
n.a.
Published by Statista
Publication date March 2019
Original source Digital Market Outlook
Website URL visit the website
Back to statistic
Notes:
The e-commerce market includes the sale of physical goods via
a digital channel to a private end user (B2C). This comprises
purchases via desktop computer (including notebooks and
laptops) as well as purchases via mobile devices such as
smartphones and tablets. The main sales channels are cross-
brand online mail order companies and the online shops of
individual companies. All monetary figures refer to the annual
gross revenue and do not factor in shipping costs. The exact
definition of the eCommerce market can be found here .
Information on the methodology can be found under the link .
DIGITAL BUYER PENETRATION IN CHINA FROM 2017 TO 2023 (IN PERCENT)
DIGITAL BUYER PENETRATION IN CHINA 2017-2023

References 51
Source and methodology information
Source(s) iResearch
Conducted by iResearch
Survey period February 2018
Region(s) China
Number of
respondents
n.a.
Age group n.a.
Special
characteristics
n.a.
Published by iResearch
Publication date April 2018
Original source iresearchchina.com
Website URL visit the website
Back to statistic
Notes:
Calculation was based on online behavior of 400,000
households and offices, excluding public internet cafes.
AGE DISTRIBUTION OF E-COMMERCE APP USERS IN CHINA AS OF FEBRUARY 2018
AGE STRUCTURE OF ONLINE SHOPPING APP USERS IN CHINA 2018
References 52
Source and methodology information
Source(s) Analysys
Conducted by Analysys
Survey period Q2 2017
Region(s) China
Number of
respondents
n.a.
Age group n.a.
Special
characteristics
n.a.
Published by Analysys
Publication date October 2017
Original source analysyschina.com
Website URL visit the website
Back to statistic
Notes:
User data based on the coverage of cumulative 2.07 billion
installations and behaviors of over 480 million active users were
monitored for this statistic.
PREFERRED E-
COMMERCE TYPES IN
CHINA AS OF Q2 2017, BY
GENDER
E-COMMERCE TYPE PREFERENCE CHINA Q2 2017, BY GENDER