Embed Size (px)
Citation preview
Int.J.Curr.Microbiol.App.Sci (2015) 4(8): 892-906
892
Original Research Article
Diversity assessment of E. coli collected from water bodies of Bhopal using sole source carbon utilization (SSCU) profile
Medha Sharma1, Anushka Shrotriya1, Shweta Chouhan2, Pramod Kumar Sairkar2* and RK Singh2
1Madhav Institute of Technology & Science, Gwalior, Madhya Pradesh, India 2Centre of Excellence in Biotechnology, M.P. Council of Science & Technology, Bhopal,
Madhya Pradesh, India *Corresponding author
A B S T R A C T
Introduction
Approximately 4 billion year ago, Micro-organisms were the first form of life to develop on earth and about 3 billion year ago all organisms were microscopic. Microbial diversity comprises the diversity of bacteria, protozoans, fungi, unicellular algae and creates the most extraordinary reservoir of life in the biosphere (Schopf
1994). It is a key to human survival and economic wellbeing and provides a huge reservoir of resources that we can utilize for our welfare. Microbes play a vital role in the recycling of nutrients, production and consumption of gases that affect global climate, destruction of pollutants, treatment of our wastes and they can be used for
ISSN: 2319-7706 Volume 4 Number 8 (2015) pp. 892-906 http://www.ijcmas.com
E. coli is the most prominent microbe and has a wide application in biotechnology industry. Carbone source for cultivation of any microorganism at laboratory to industrial level is important. Looking upon this fact, an experiment was conducted for assessment of diversity of E. coli, which was collected from 4 water bodies of Bhopal using their sole source carbon utilization (SSCU) profile. Two Samples were collected from Upper Lake while one sample each was collected from Lower Lake, Shahpura Lake and Kaliasot Dam. Samples were cultured, isolated and identified with selective media and their carbon utilization patter was observed. Based on observed data of 10 samples, analysed phylo-tree to identify similarity between microorganisms isolated from 5 different locations of Bhopal lakes. Samples collected from same location make separate cluster, which indicate that they utilize the similar carbon source. Four groups of the carbon sources show similarity with each other like first group was formed by DL Malic Acid, citric acid, malonic acid and succinic acid, while second group was made by dextrose and l-histidine. L (+) Rhmnose and D + cellobiose creates third group and sucrose, d-soribtol and D (+)_Maltose formed fourth group. E. coli acquire carbon source for their survival if availability of any carbon source is not sufficient, will substitute from their similar carbon source.
K e y w o r d s
E. coli, Bhopal lakes, Carbon source, Sole source carbon utilization (SSCU), Selective media
Int.J.Curr.Microbiol.App.Sci (2015) 4(8): 892-906
893
biological control of pests affecting plants and animals (Parr and Hornick 1992a; 1992b).
To solve new and emerging disease problems and to advance in biotechnology, study of microbial diversity is also significant. New technologies, mostly in nucleic acid analysis, analytical chemistry, computer science, and habitat sampling and characterization place the study of microbial diversity on the vanguard of science (Kapur and Jain2004; Fatima et al, 2010).
Despite with the microbial diversity, E. coli is the most prominent microbe and has a wide application in biotechnology industry (Schiraldi et al, 2002). E. coli is a gram-negative bacterium of the family Enterobacteriacae and is a normal inhabitant of intestinal tract of birds (Singleton and Sainburg 1981).It is the most widely used host organism for biopharmaceutical production of simple non-modified heterologous recombinant proteins and have their ability to quickly reach high cell densities in inexpensive media (Ferrer-Miralles et al, 2009).
E. coli is easily grown in the laboratory and the vectors are well characterized so it recommended obtaining recombinant enzyme for basic characterization. (Schirald et al, 2002). Presently, the genetically engineered E. coli bacteria were employed in the production of human insulin, human growth hormone and also the evidence of biofuel production (Kamionka 2011).
Low cost and simplicity of cultivating bacteria make the E. coli expression system a preferable choice for production of therapeutic proteins, enzymes and secondary metabolites both on a lab scale and in industry (Kamionka 2011). Utilization of same carbon source when supplied to all
isolates are been taken up by some and avoided by some (Silawat et al, 2010). In the present study, an experiment was conducted for the understanding of Carbon utilization pattern of E. coli by SSCU. This gives the evidence of diversity on the basis of physiological properties of genetically similar E. coli. This brings up the diversity based on physiological properties basically carbon utilization pattern.
Materials and Methods
The experiment was carried out at the Centre of Excellence in Biotechnology laboratory, MPCST Bhopal, India. The study was done with 10 water samples from 5 lakes of Bhopal region were investigated for the presence of E. coli. Out of these, 2 samples collected from each location (Table 1). A water sample of 20 ml was collected directly in sterile screw capped tubes. The isolation of bacterial colonies was done on MacConkey s agar (Oxoid, England). CFU were calculated and then the 30 isolated colonies were pure cultured through four way streak technique on same MacConkey s agar. Microorganisms grown on MacConkey agar are capable of metabolizing lactose which produces acid by-products that lower the pH of the media which causes the neutral red indicator to turn red, and if sufficient acid is produced, a zone of precipitated bile develops around the colony. The pure isolated colonies were then further subjected to series of procedures for identification.
Growth on selective media
EMB agar plates were prepared and isolates were grown to confirm the presence of E. coliand purified on selective media (Deshmukh 1997).Further single colony inoculated in EMB broth and incubated at 37 °C.
Int.J.Curr.Microbiol.App.Sci (2015) 4(8): 892-906
894
Staining
All the pure isolated cultures were subjected to Gram staining to identify the shape and gram positivity and gram negativity of the isolated culture.
Biochemical testing
Out of 30 positive samples, 10 were subjected to a series of biochemical testing for identification like Indole test, Kovac Indole test and Simon Citrate test (Ewing, 1986).
Sole source carbon utilization (SSCU) test
Carbon source
A total of 31 carbon sources were selected which were most relevant to compost community for isolates utilization. These included carbohydrates, amino acids and organic acids. D
Sorbitol, D
Mannitol, Dextrose Monohydrate, Lactose Monohydrate, Sucrose, D (+) Maltose Monohydrate,
Cyclodextrin, D
Fructose, D (+) Galactose, L
(+) Rhmnose Monohydrate, D (+) Mannose, D (+) Arabitol, L (+) Arabinose, D (+) Cellobiose, D (+) Trehalso Dihydrate, DL Malic Acid, Citric Acid Anhydrous, Malonic Acid, Succinic Acid, DL
Methonine, L Histidine Hydrochloride, L
Alanine, L
Leucin, L
Asparagine Monohydrate, DL
Asparatic Acid, DL Alanine, L Valine, L
Threonine, DL
Serine, L
Arginine Hydrochloride, L Histidine.
Preparation of bacterial suspension
Total10 samples were then streaked on King s B agar plate at 37 °C for 24 hour. Pure single colony of bacterial cultures were inoculated in 10 ml of King s B broth and incubated at 37 °C for 24 hour for two days
until log phase growth. Centrifugation was done to obtain pellet at 10,000 rpm for 10 minutes. Supernatant was discarded and remaining pellet was washed with 0.85% NaCl by Centrifugation at 10,000 rpm for 10 minutes. Above step was repeated 2 times and finally O.D. was taken at 456 nm (Jaspers and Overmam 2004).
Preparation of micro titre plates: For growth test, each micro titre well received 50 l of bacterial suspension, 50 l of Triphenyl Tetrazolium Chloride dye (TTC) (0.5%), 50 l of C-source (10%) and 50 l of M-9 medium devoid of glucose. The plates were incubated for 5 days at 30 ± 2°C.
Data matrix: For the dendrogram, Data matrix was prepared from the results obtained from SSCU tests. 0 was written for negative result and 1 to 3 for positive results was given as per the intensity of carbon utilization.
Distance matrix and Dendrogram (Jaccard): Distance matrix was generated by PAST (Paleontological Statistics) Software (Hammer et al, 2001) using Jaccard s coefficient and UPGMA. Phylo-tree was prepared employing the un-weighted pair group method with arithmetic average.
Results and Discussion
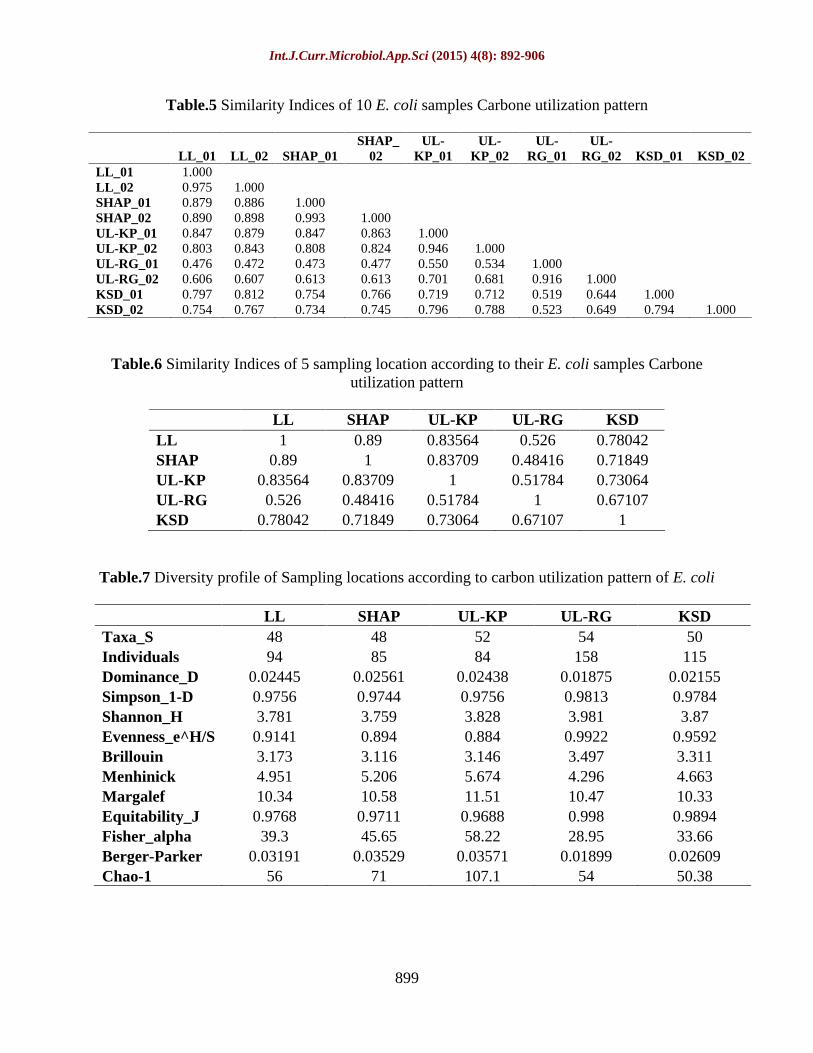
Total 5 locations were selected from Bhopal region from which 2 sample taken from each location.10 samples were cultured on MacConkey medium at 37 C for morphological characterization. After 24 hours, two types of colonies were observed under macroscopic examination. Some of the isolated colonies appear pinkish on MacConkey medium, while other are creamy yellow as shown in figure 1, simultaneously CFU (Colony forming unit)
Int.J.Curr.Microbiol.App.Sci (2015) 4(8): 892-906
895
has been calculated and the results are listed in Table 2.
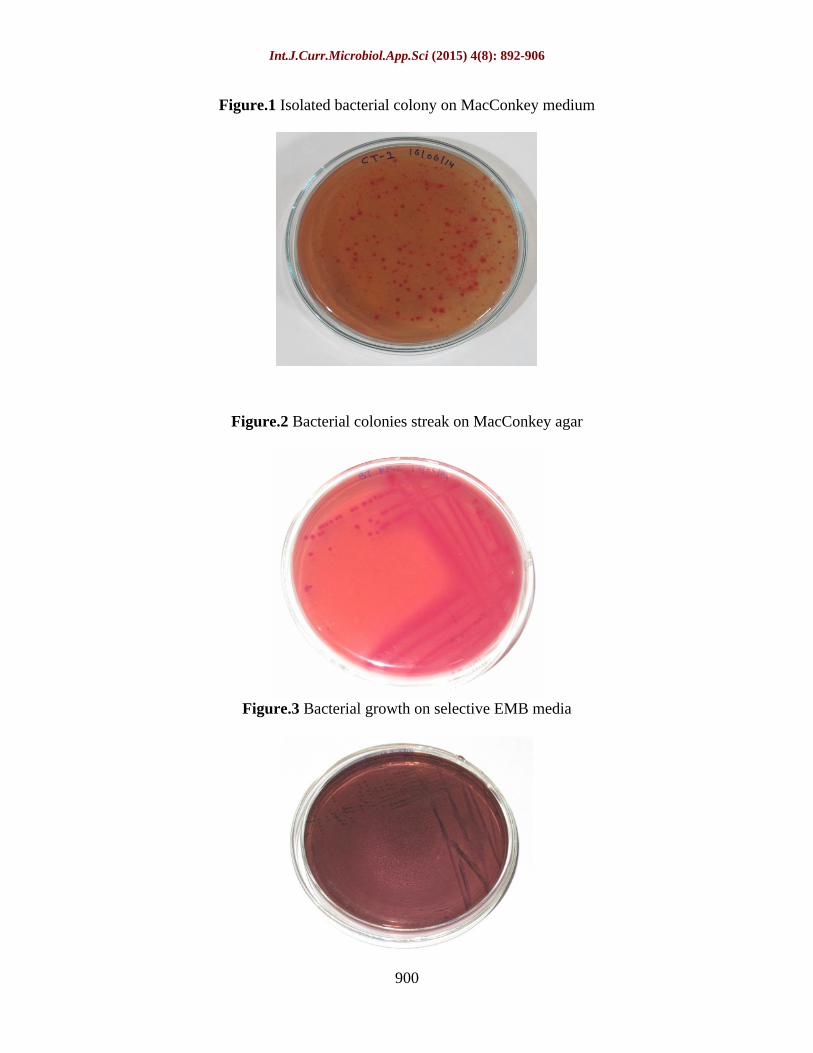
E. coli was observed in highest concentration from water samples of different location of Bhopal lakes. Total 30 bacterial colonies were streak on MacConkey agar (figure 2) then purified 30 bacterial colonies indicated the presence of E. coliwhich was confirmed and identified by growth on selective EMB media (figure 3).
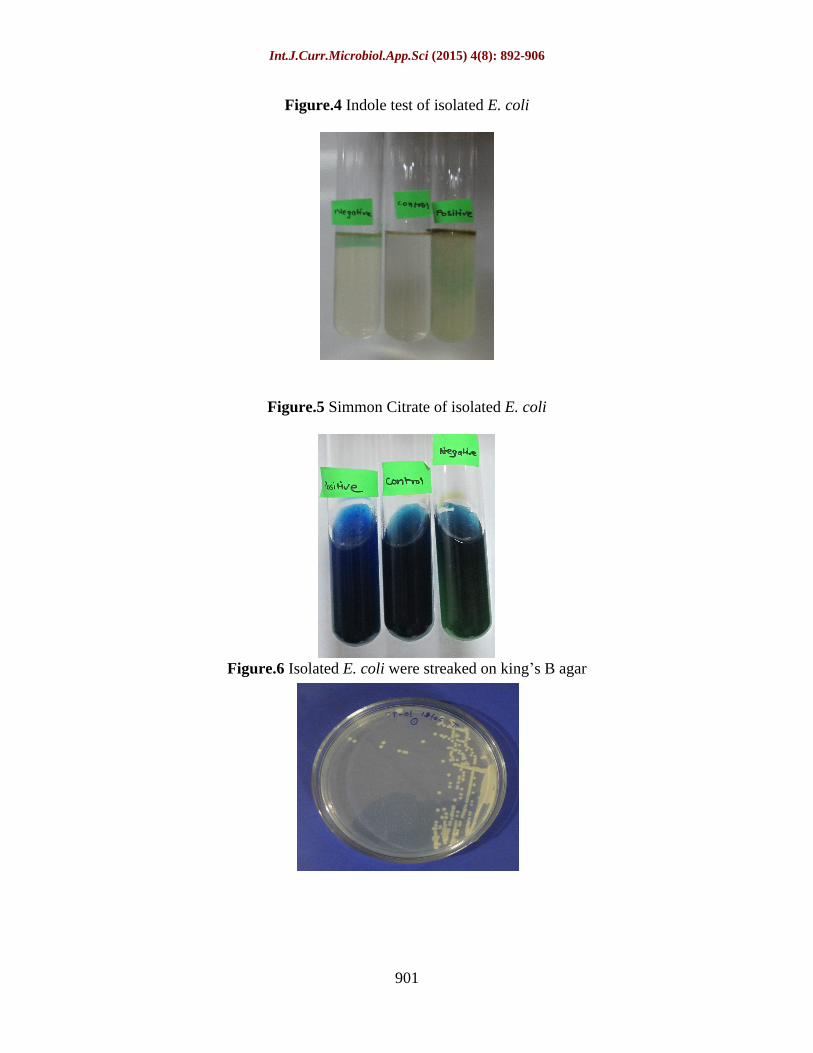
After plating, purified blue dotted single colony was transfer into EMB broth. Later on out of 30 E. coli samples, 10E. coli samples were taken for different biochemical test. On the basis of Indole test, all the 10 isolates produced rich growth on Congo red medium. Out of 10 isolates 8 resulted in the growth of brick red colour colonies while the remaining 2 produced greyish white colonies after 96 hours of growth (figure 4) while out of 10 sample, 8 sample are Simmon Citrate positive and two are Simmon Citrate negative (figure 5, table 3).
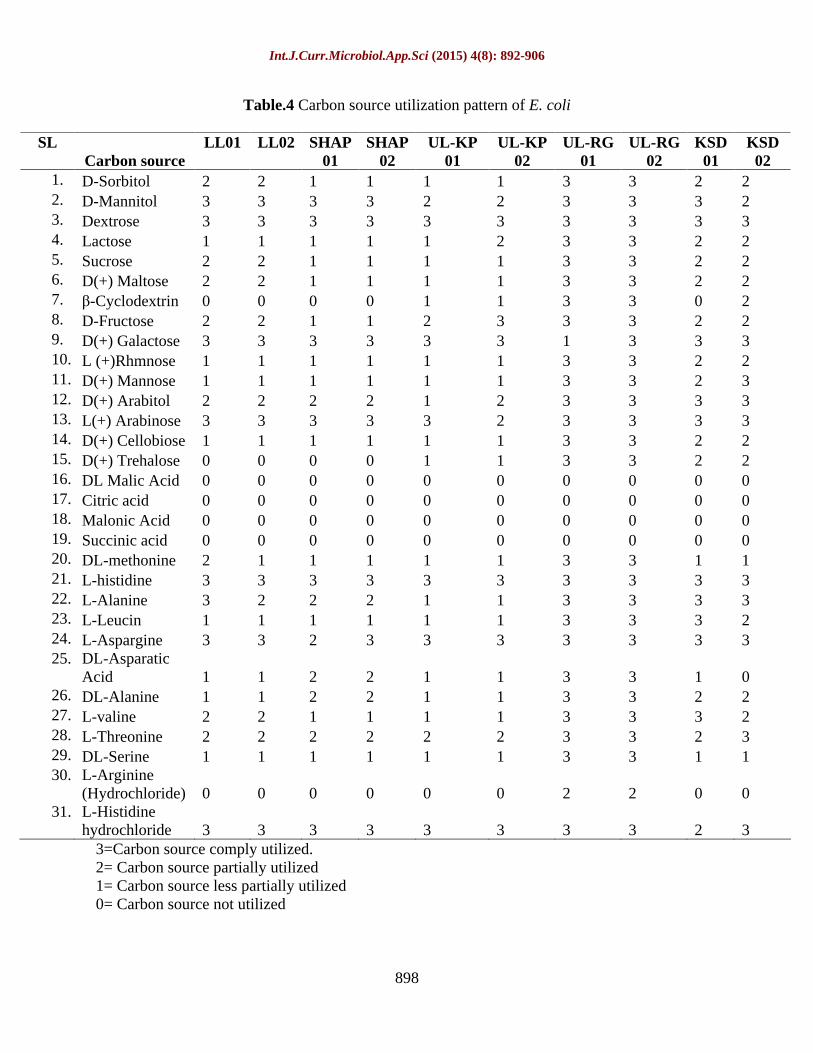
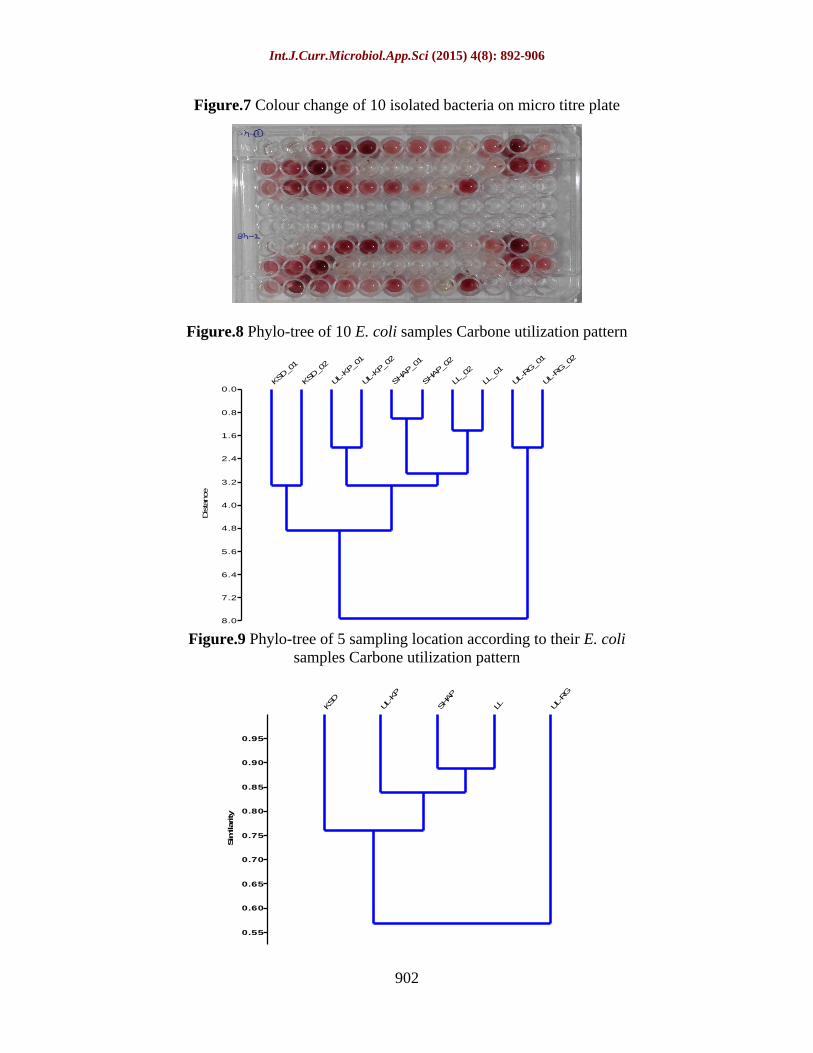
The 10 samples were streaked on king s B agar (figure 6) and single colonies were inoculated on King s B broth. These bacterial suspensions were grown on micro titer plate and colour change of 10 isolated bacteria on microtitre plate was observed (figure 7).The observation was seen that acids like malonic acid, citric acid anhydrous, succinic acid and DL-malic acid and other carbon source like L-arginine were not utilize by the bacteria. While D-mannitol, D-arabitol and L-histidine hydrochloride completely utilized by bacteria. Different utilization pattern was observed in LL01, LL02, SHPL01, SHPL02, UL-KP01, UL-KP02, KSD01 andKSD02. These bacteria utilized carbon source in different pattern such as completely, partially and not utilized it means these
bacteria require more incubation time for complete utilization. But in UL-RG01 and UL-RG02 completely utilized all carbon sources within 24 hours except 4 different acids (Table 4).
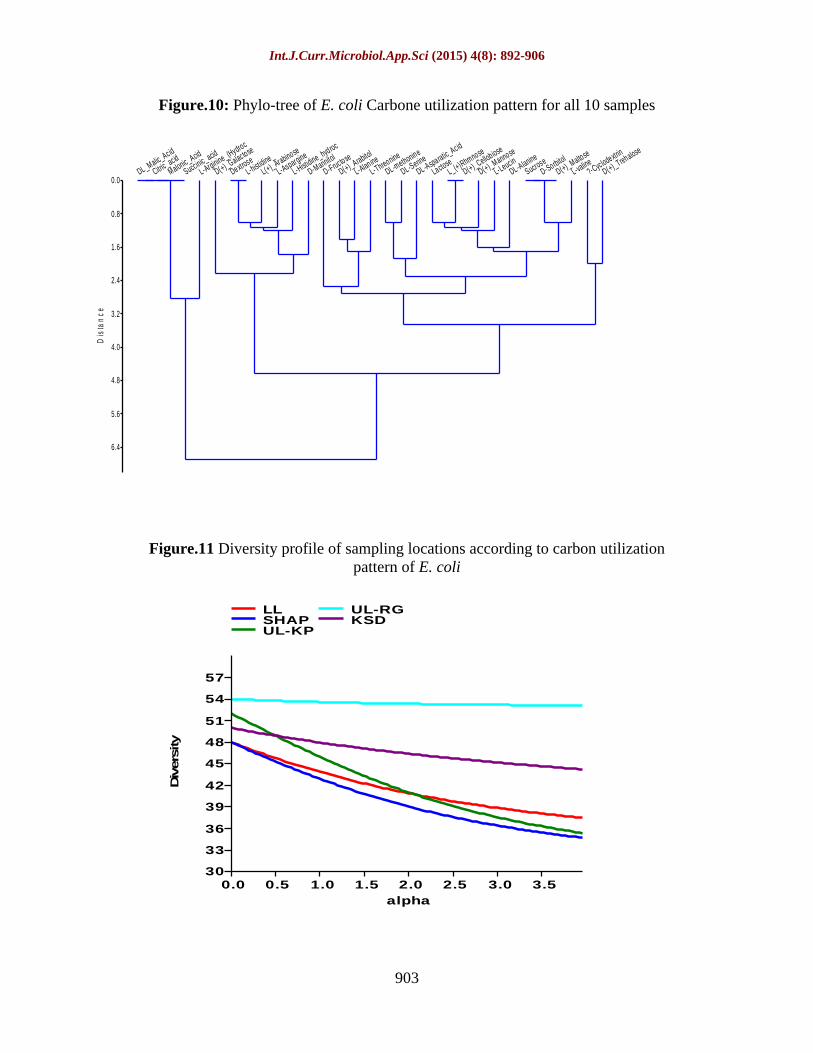
Based on observed data of 10 samples, analysed phylo-tree to identify similarity between microorganisms isolated from 5 different locations of Bhopal lakes. This phylo-tree represents similarity among microorganisms. Samples collected from same location make separate cluster, which indicate that they utilize the same carbon source represent in phylo-tree (figure 8, table 5) while out of these 5 samples, SHAP and LL are more similar rather than others at the level between 0.85 and 0.9 (figure 9, table 6). This data shows coefficient of association which shows closely relatedness among species. Higher the values of coefficient of association more similarity will be occur between species.
Carbon utilization pattern of isolated E. coli accessions were studied and the basis of observed data by sole source carbon utilization technique which shows the relationship between 31-carbon source utilized by micro-organisms of 5 different locations. According to phylo-tree (figure 9) it was observed that four groups of the carbon sources show similarity with each other like first group was formed by DL Malic Acid, citric acid, malonic acid and succinic acid, while second group was made by dextrose and l-histidine. L (+) Rhmnose and D + cellobiose creates third group and sucrose, d-soribtol and D(+)_Maltose formed fourth group. E. coli acquire carbon source for their survival if availability of any carbon source is not sufficient, will substitute from their similar carbon source. From this analysis we conclude that for the growth of E. coli, we can use alternate carbon source to change the substrate or
Int.J.Curr.Microbiol.App.Sci (2015) 4(8): 892-906
896
feed product of bacterial culture at industrial level so that we reduce the running cost of product production that produce from the particular bacterial product or bacteria.
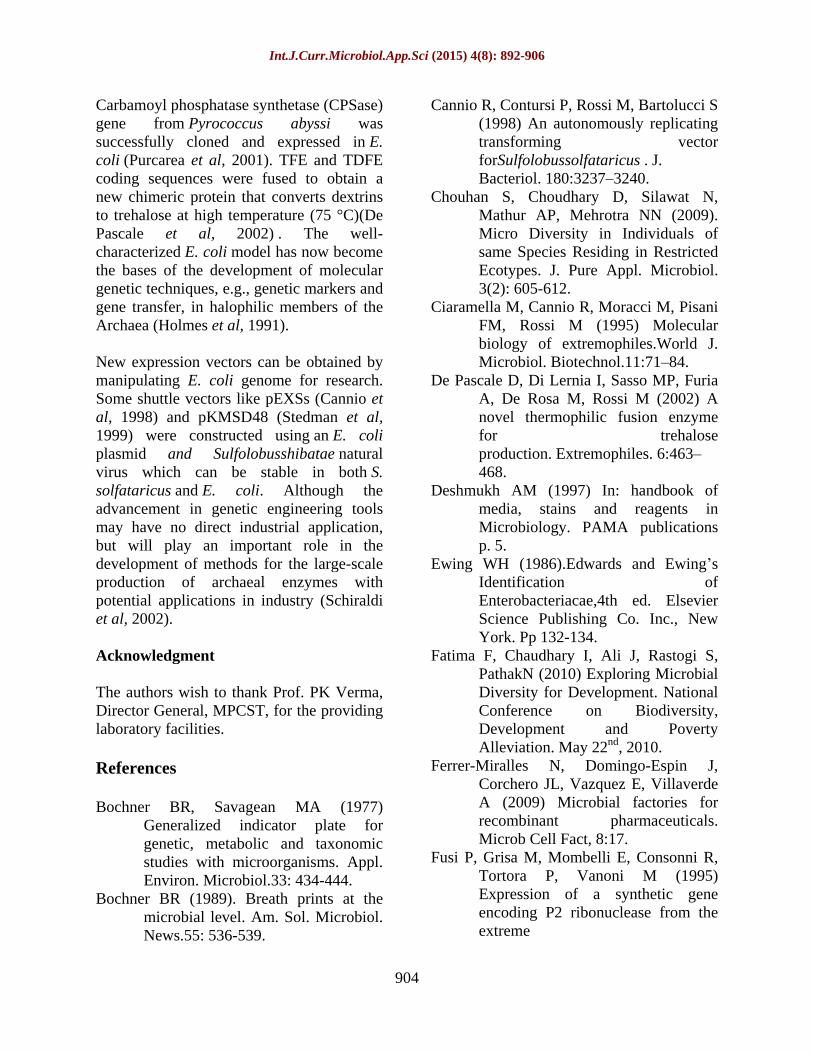
To observe different parameters on the basis of mathematical measures, diversity index comes in the picture. With the use various parameters in calculating diversity which represent species richness and evenness among different isolated samples (table 7). Various diversity parameters like Dominance_D, Simpson_1-D, Shannon_H, Evenness H/S, Brillouin, Menhinick, Margalef, Equitability_J, Fisher_alpha, Berger-Parker and Chao-1 were calculated for each locations using carbon utilization pattern of isolated E. coil of respective location. Over all diversity among isolated E. coli was analysed by the graph which is developed by calculated data (figure 11).
SSCU is basically a substrates utilization test which provides important information regarding the variant physiological activities in spite of same genetic makeup of closely related species (Chouhan et al, 2009). The functional diversity of microorganisms, mainly as defined by the substrates used for energy metabolism, is integral used for energy metabolism, is integral to our understanding of biogeochemistry (Silawat et al, 2010). Our result shows the relationship between 31-carbon sources utilized pattern of E. coli of 5 different locations. According to the phylo-tree, four groups of the carbon sources were observed which showed similarity of carbon utilization pattern. This analysis was conclude that, we can use alternate carbon source to change the substrate or feed product of bacterial culture at industrial level for the growth of E. coli. The BLOLOG redox technology based on tetrazolium dye reduction as an indicator of sole-carbon-source utilization was evaluated as a rapid, community-level method to
characterize and classify heterotrophic microbial communities (Bochner and Savagrave 1977, Bochner 1989).
Recombinant human insulin was made as the first medicine via recombinant DNA technology (Johnson 1983) and this technology fashions revolution for production of many industrially important enzymes. Using the recombinant DNA technology, many extreme environments adapted archaeal enzymes are also produced, which are appropriate candidates for applications in industrial processes that are performed under severe conditions, such as high ionic strength or high temperatures or in the presence of organic solvents (Schiraldi et al, 2002). Genes encoded numerous enzymes from extremophiles have been cloned in mesophilic hosts for overproduction of the enzyme (Ciaramella et al, 1995). Escherichia coli have been used successfully as mesophilic hosts for a number of archaeal genes (Jorgensen et al, 1997, Niehaus et al, 1999, Gritz and Davies 1983, Ishida et al, 1997).
Fed-batch culture technique of E. coli was used for efficient production of truncated thermostable xylanases (Nordberg-Karlsson 1999) while microfiltration bioreactor was used for Effective production of a thermostable -Glucosidase (Schiraldi et al, 2000). May products were prepared by creation of mutation in the gene of E. coli (Voorhorst et al, 1995). To obtain a sufficient amount of a recombinant enzyme for basic characterization, E. coli expression is recommended, because this host is easily grown in the laboratory and the vectors are well characterized. Recombinant enzymes can also be obtained by cloning and expressing a synthetic gene. The modified gene encode P2 ribonuclease of S.Solfataricus consists codon which are extensively used to increase protein expression in E. coli (Fusiet al, 1995).

Int.J.Curr.Microbiol.App.Sci (2015) 4(8): 892-906
897
Table.1 Locations of sample collection and there codes
SL Location Sample Code 1 Upper Lake Kamla Park UL-KP 2 Upper Lake Ret Ghat UL-RG 3 Lower Lake LL 4 Shahpura Lake SHPL 5 Kaliasote Dam KSD
Table.2 CFU (Colony forming unit) of isolated samples
SL Sample E. coli colony Fecal colony 1. UL-KP01 37 59 2. UL-KP02 19 10 3. KSD01 4 40 4. KSD02 5 64 5. LL01 94 10 6. LL02 92 12 7. SHPL01 15 8 8. SHPL02 20 19 9. UL-RG01 88 19 10. UL-RG02 74 20
Table.3 Biochemical test for confirmation of E. coli
SL Sample source Indole test Kovacindole Simmon citrate test 1. LL 01 Positive Positive positive 2. LL 02 Positive Positive positive 3. SHPL 01 Positive Positive positive 4. SHPL 02 Positive Positive positive 5. BT KP 01 Positive Positive positive 6. BT KP 02 Positive Positive positive 7. BT RG 01 Positive Positive positive 8. UL-RG02 Positive Positive positive 9. KSD 01 Positive Positive Negative 10. KSD 02 Positive Positive Negative
Int.J.Curr.Microbiol.App.Sci (2015) 4(8): 892-906
898
Table.4 Carbon source utilization pattern of E. coli
SL Carbon source
LL01 LL02
SHAP
01 SHAP
02 UL-KP
01 UL-KP
02 UL-RG
01 UL-RG
02 KSD
01 KSD
02 1.
D-Sorbitol 2 2 1 1 1 1 3 3 2 2
2.
D-Mannitol 3 3 3 3 2 2 3 3 3 2
3.
Dextrose 3 3 3 3 3 3 3 3 3 3
4.
Lactose 1 1 1 1 1 2 3 3 2 2 5.
Sucrose 2 2 1 1 1 1 3 3 2 2 6.
D(+) Maltose 2 2 1 1 1 1 3 3 2 2 7.
-Cyclodextrin 0 0 0 0 1 1 3 3 0 2 8.
D-Fructose 2 2 1 1 2 3 3 3 2 2 9.
D(+) Galactose 3 3 3 3 3 3 1 3 3 3 10.
L (+)Rhmnose 1 1 1 1 1 1 3 3 2 2 11.
D(+) Mannose 1 1 1 1 1 1 3 3 2 3 12.
D(+) Arabitol 2 2 2 2 1 2 3 3 3 3 13.
L(+) Arabinose 3 3 3 3 3 2 3 3 3 3 14.
D(+) Cellobiose 1 1 1 1 1 1 3 3 2 2 15.
D(+) Trehalose 0 0 0 0 1 1 3 3 2 2 16.
DL Malic Acid 0 0 0 0 0 0 0 0 0 0 17.
Citric acid 0 0 0 0 0 0 0 0 0 0 18.
Malonic Acid 0 0 0 0 0 0 0 0 0 0 19.
Succinic acid 0 0 0 0 0 0 0 0 0 0 20.
DL-methonine 2 1 1 1 1 1 3 3 1 1 21.
L-histidine 3 3 3 3 3 3 3 3 3 3 22.
L-Alanine 3 2 2 2 1 1 3 3 3 3 23.
L-Leucin 1 1 1 1 1 1 3 3 3 2 24.
L-Aspargine 3 3 2 3 3 3 3 3 3 3 25.
DL-Asparatic Acid 1 1 2 2 1 1 3 3 1 0
26.
DL-Alanine 1 1 2 2 1 1 3 3 2 2 27.
L-valine 2 2 1 1 1 1 3 3 3 2 28.
L-Threonine 2 2 2 2 2 2 3 3 2 3 29.
DL-Serine 1 1 1 1 1 1 3 3 1 1 30.
L-Arginine (Hydrochloride) 0 0 0 0 0 0 2 2 0 0
31.
L-Histidine hydrochloride 3 3 3 3 3 3 3 3 2 3
3=Carbon source comply utilized. 2= Carbon source partially utilized 1= Carbon source less partially utilized 0= Carbon source not utilized
Int.J.Curr.Microbiol.App.Sci (2015) 4(8): 892-906
899
Table.5 Similarity Indices of 10 E. coli samples Carbone utilization pattern
LL_01 LL_02 SHAP_01 SHAP_
02 UL-
KP_01 UL-
KP_02 UL-
RG_01 UL-
RG_02 KSD_01 KSD_02 LL_01 1.000 LL_02 0.975 1.000 SHAP_01 0.879 0.886 1.000 SHAP_02 0.890 0.898 0.993 1.000 UL-KP_01 0.847 0.879 0.847 0.863 1.000 UL-KP_02 0.803 0.843 0.808 0.824 0.946 1.000 UL-RG_01 0.476 0.472 0.473 0.477 0.550 0.534 1.000 UL-RG_02 0.606 0.607 0.613 0.613 0.701 0.681 0.916 1.000 KSD_01 0.797 0.812 0.754 0.766 0.719 0.712 0.519 0.644 1.000 KSD_02 0.754 0.767 0.734 0.745 0.796 0.788 0.523 0.649 0.794 1.000
Table.6 Similarity Indices of 5 sampling location according to their E. coli samples Carbone utilization pattern
LL SHAP UL-KP UL-RG KSD LL 1 0.89 0.83564 0.526 0.78042 SHAP 0.89 1 0.83709 0.48416 0.71849 UL-KP 0.83564 0.83709 1 0.51784 0.73064 UL-RG 0.526 0.48416 0.51784 1 0.67107 KSD 0.78042 0.71849 0.73064 0.67107 1
Table.7 Diversity profile of Sampling locations according to carbon utilization pattern of E. coli
LL SHAP UL-KP UL-RG KSD Taxa_S 48 48 52 54 50 Individuals 94 85 84 158 115 Dominance_D 0.02445 0.02561 0.02438 0.01875 0.02155 Simpson_1-D 0.9756 0.9744 0.9756 0.9813 0.9784 Shannon_H 3.781 3.759 3.828 3.981 3.87 Evenness_e^H/S
0.9141 0.894 0.884 0.9922 0.9592 Brillouin 3.173 3.116 3.146 3.497 3.311 Menhinick 4.951 5.206 5.674 4.296 4.663 Margalef 10.34 10.58 11.51 10.47 10.33 Equitability_J 0.9768 0.9711 0.9688 0.998 0.9894 Fisher_alpha 39.3 45.65 58.22 28.95 33.66 Berger-Parker 0.03191 0.03529 0.03571 0.01899 0.02609 Chao-1 56 71 107.1 54 50.38
Int.J.Curr.Microbiol.App.Sci (2015) 4(8): 892-906
900
Figure.1 Isolated bacterial colony on MacConkey medium
Figure.2 Bacterial colonies streak on MacConkey agar
Figure.3 Bacterial growth on selective EMB media
Int.J.Curr.Microbiol.App.Sci (2015) 4(8): 892-906
901
Figure.4 Indole test of isolated E. coli
Figure.5 Simmon Citrate of isolated E. coli
Figure.6 Isolated E. coli were streaked on king s B agar
Int.J.Curr.Microbiol.App.Sci (2015) 4(8): 892-906
902
Figure.7 Colour change of 10 isolated bacteria on micro titre plate
Figure.8 Phylo-tree of 10 E. coli samples Carbone utilization pattern
8.0
7.2
6.4
5.6
4.8
4.0
3.2
2.4
1.6
0.8
0.0
Dista
nce
KSD_0
1
KSD_0
2
UL-KP_
01
UL-KP_
02
SHAP_01
SHAP_02
LL_0
2
LL_0
1
UL-RG
_01
UL-RG
_02
Figure.9 Phylo-tree of 5 sampling location according to their E. coli samples Carbone utilization pattern
0.55
0.60
0.65
0.70
0.75
0.80
0.85
0.90
0.95
Sim
ilarity
KSD
UL-KP
SHAP
LL UL-RG
Int.J.Curr.Microbiol.App.Sci (2015) 4(8): 892-906
903
Figure.10: Phylo-tree of E. coli Carbone utilization pattern for all 10 samples
6.4
5.6
4.8
4.0
3.2
2.4
1.6
0.8
0.0
Dis
tan
ce
DL_Malic_Acid
Citric_acid
Malonic_Acid
Succinic_acid
L-Arginine_(Hydroc
D(+)_Galactose
DextroseL-histidine_
L(+)_Arabinose
L-Aspargine
L-Histidine_hydroc
D-Mannitol
D-Fructose
D(+)_Arabitol
L-Alan ineL-Threonine
DL-methonine
DL-Serine
DL-Asparatic_Acid
LactoseL_(+)Rhmnose
D(+)_Cellob iose
D(+)_Mannose
L-LeucinDL-Alanine
SucroseD-Sorbitol
D(+)_Maltose
L-valine?-Cyclodextrin
D(+)_Trehalose
Figure.11 Diversity profile of sampling locations according to carbon utilization pattern of E. coli
0.0 0.5 1.0 1.5 2.0 2.5 3.0 3.5alpha
30
33
36
39
42
45
48
51
54
57
Div
ers
ity
LLSHAPUL-KP
UL-RGKSD
Int.J.Curr.Microbiol.App.Sci (2015) 4(8): 892-906
904
Carbamoyl phosphatase synthetase (CPSase) gene from Pyrococcus abyssi was successfully cloned and expressed in E. coli (Purcarea et al, 2001). TFE and TDFE coding sequences were fused to obtain a new chimeric protein that converts dextrins to trehalose at high temperature (75 °C)(De Pascale et al, 2002) . The well-characterized E. coli model has now become the bases of the development of molecular genetic techniques, e.g., genetic markers and gene transfer, in halophilic members of the Archaea (Holmes et al, 1991).
New expression vectors can be obtained by manipulating E. coli genome for research. Some shuttle vectors like pEXSs (Cannio et al, 1998) and pKMSD48 (Stedman et al, 1999) were constructed using an E. coli plasmid and Sulfolobusshibatae natural virus which can be stable in both S. solfataricus and E. coli. Although the advancement in genetic engineering tools may have no direct industrial application, but will play an important role in the development of methods for the large-scale production of archaeal enzymes with potential applications in industry (Schiraldi et al, 2002).
Acknowledgment
The authors wish to thank Prof. PK Verma, Director General, MPCST, for the providing laboratory facilities.
References
Bochner BR, Savagean MA (1977) Generalized indicator plate for genetic, metabolic and taxonomic studies with microorganisms. Appl. Environ. Microbiol.33: 434-444.
Bochner BR (1989). Breath prints at the microbial level. Am. Sol. Microbiol. News.55: 536-539.
Cannio R, Contursi P, Rossi M, Bartolucci S (1998) An autonomously replicating transforming vector forSulfolobussolfataricus . J. Bacteriol. 180:3237 3240.
Chouhan S, Choudhary D, Silawat N, Mathur AP, Mehrotra NN (2009). Micro Diversity in Individuals of same Species Residing in Restricted Ecotypes. J. Pure Appl. Microbiol. 3(2): 605-612.
Ciaramella M, Cannio R, Moracci M, Pisani FM, Rossi M (1995) Molecular biology of extremophiles.World J. Microbiol. Biotechnol.11:71 84.
De Pascale D, Di Lernia I, Sasso MP, Furia A, De Rosa M, Rossi M (2002) A novel thermophilic fusion enzyme for trehalose production. Extremophiles. 6:463468.
Deshmukh AM (1997) In: handbook of media, stains and reagents in Microbiology. PAMA publications p. 5.
Ewing WH (1986).Edwards and Ewing s Identification of Enterobacteriacae,4th ed. Elsevier Science Publishing Co. Inc., New York. Pp 132-134.
Fatima F, Chaudhary I, Ali J, Rastogi S, PathakN (2010) Exploring Microbial Diversity for Development. National Conference on Biodiversity, Development and Poverty Alleviation. May 22nd, 2010.
Ferrer-Miralles N, Domingo-Espin J, Corchero JL, Vazquez E, Villaverde A (2009) Microbial factories for recombinant pharmaceuticals. Microb Cell Fact, 8:17.
Fusi P, Grisa M, Mombelli E, Consonni R, Tortora P, Vanoni M (1995) Expression of a synthetic gene encoding P2 ribonuclease from the extreme
Int.J.Curr.Microbiol.App.Sci (2015) 4(8): 892-906
905
thermoacidophilicarchaebacterium Sulfolobussolfataricus in mesophylic hosts. Gene. 154:99 103.
Gritz L, Davies J (1983) Plasmid-encoded hygromycin B resistance: the sequence of hygromycin B phosphotransferase gene and its expression in Escherichia coli and Saccharomyces cerevisiae. Gene.25:179 188.
Hammer O, Harper DAT, Ryan PD (2001). PAST: Paleontological Statistics Software Package for Education and Data Analysis. Palaeontologia Electronica http://palaeoelectronica. org/2001_1/past/issue1_01.htm 4(1): 9.
Holmes ML, Nuttal SD, Dyall-Smith ML(1991) Construction and use of halobacterial shuttle vectors and further studies on Haloferax DNA gyrase. J. Bacteriol. 173:3807 3813.
Ishida M, Yoshida M, Oshima T (1997) Highly efficient production of enzymes of an extreme thermophile, Thermusthermophilus: a practical method to overexpress GC- rich genes in Escherichia coli. Extremophiles.1:157 162.
Jaspers E, Overmann J (2004). Ecological significance of Microdiversity: Identical 16S rRNA Gene sequences can be found in bacteria with highly divergent genomes and ecophysiologies. Appl.Environ. Microbiol. 70: 9831-4839.
Johnson IS (1983) Human insulin from recombinant DNA technology. Science 219 (4585):632 637.
Jorgensen S, Vorgias CE, Antranikian G (1997) Cloning, sequencing, characterization, and expression of an extracellular alpha-amylase from the hyperthermophilicarchaeonPyrococcusfuriosus in Escherichia coli and
Bacillus subtilis. J. Biol. Chem.272:16335 16342.
Kamionka M (2011) Engineering of Therapeutic Proteins Production in Escherichia coli.Curr Pharm Biotechnol. 12(2): 268 274.
Kapur M, Jain RK (2004) Microbial Diversity: Exploring the Unexplored. World Federation of Culture Collection Newsletter, 39. pp. 12-16.
Niehaus F, Bertoldo C, Kahler M, Antranikian G (1999) Extremophiles as a source of novel enzymes for industrial application. Appl. Microbiol. Biotechnol.51:711 729.
Nordberg-Karlsson E, Holst O, Tocaj A (1999) Efficient production of truncated thermostablexylanases from Rhodothermusmarinus in Escherichia coli fed-batch cultures. J. Biosci. Bioeng.87:598 606.
Parr JF,HornickSB (1992a) Agricultural use of organic amendments: A historical perspective. Amer. J. Alternative Agric. 7:181-189.
Parr JF,Hornick SB(1992b) Utilization of municipal wastes. p.545-559. In F.B. Metting (ed.) Soil Microbial Ecology: Applications in Agriculture and Environmental Management. Marcel Dekker, Inc., New York, USA.
Purcarea C, Herve G, Cunin R, Evans DR (2001) Cloning, expression, and structure analysis of carbamate kinase-like carbamoyl phosphate synthetase from Pyrococcusabyssi. Extremophiles. 5:229 239.
Schiraldi C, Giuliano M, Rosa MD (2002) Perspectives on biotechnological applications of archaea. Archaea. 1(2): 75 86.
Schiraldi C, Martino A, Acone M, Di Lernia I, Di Lazzaro A, Marulli F, Generoso M, Carteni M, De Rosa M (2000)
Int.J.Curr.Microbiol.App.Sci (2015) 4(8): 892-906
906
Effective production of a thermostable -Glucosidase from Sulfolobussolfataricus in Escherichia coli exploiting a microfiltration bioreactor. Biotech. Bioeng.70:670676.
Schopf JW (1994)Disparate rates, differing fates: the rules of evolution changed from the Precambrian to the Phanerozoic. Proc. Natl. Acad. Sci. U.S.A. 91:6735 6742
Silawat N,ChouhanS, Sairkar P, Garg RK, Vijay N,Mehrotra NN (2010) Estimation of bacterial diversity in soil and vermicompost using sole source carbon utilization (SSCU) profile. African Journal of Microbiology Research 4(4):255-266
SingletonP,SainsburgD (1981) Dictionary of Microbiology. International Ed. John Willey and Sons Ltd. Publication, New York. Pp 425-426.
Stedman KM, Schleper C, Rumpf E, Zillig W (1999) Genetic requirements for the function of the archaeal virus SSV1 in Sulfolobussolfataricus: construction and testing of viral shuttle vectors. Genetics.152:13971405.
Voorhorst WG, Eggen RI, Luesink EJ, de Vos WM (1995) Characterization of the celB gene coding for beta-glucosidase from the hyperthermophili carchaeon Pyrococcus furiosus and its expression and site-directed mutation in Escherichia coli. J. Bacteriol. 177:7105 7111.