Embed Size (px)
Citation preview

Università degli Studi di Milano
Scuola di Dottorato in Medicina Molecolare
Curriculum di: Medicina Molecolare delle Reazioni Immuni ed Infiammatorie
Ciclo XXV
Anno Accademico 2011-2012
Dottorando: Barbara TAVANO.
DYSREGULATION OF THE ILT7/BST2 pDC NEGATIVE FEEDBACK BY HIV-1:
IMPLICATIONS FOR HIV-1 TRANSMISSION AND
IMMUNOPATHOGENESIS
Direttore della Scuola: Ch.mo Prof. Mario Clerici
Tutore: Prof.ssa Daria TRABATTONI


RINGRAZIAMENTI
I risultati di questo progetto sono dovuti sia al contributo scientifico e che al
supporto morale di numerose persone.
Anzitutto vorrei citare il Prof. Mario Clerici, il mio supervisore la Prof.ssa Daria
Trabattoni e la Dott.ssa Mara Biasin dell’Universitá di Milano.
Grazie per avermi permesso di intraprendere la mia carriera scientifica, per avermi
guidato e consigliato nelle prime fasi di questo percorso e per avermi incitato a
passare un periodo all’estero.
Un ringraziamento particolare va al Dr. Adriano Boasso, dell’Imperial College di
Londra, dove gran parte del lavoro presentato in questa tesi è stato svolto.
Senza il tuo costante incoraggiamento, la tua fiducia, la tua guida e il tuo contributo
scientifico il compimento di questo progetto sarebbe stato arduo. Grazie mille
Adriano!
Ringrazio oltremodo la Prof.ssa Frances Gotch, la Dr.ssa Imami Nesrina, il Dr.
Peter Kelleher e il Dr. Steven Patterson dell’Imperial College di Londra.
Grazie per gli spunti, le idee e i suggerimenti durante le numerose riunioni di
laboratorio.
Vorrei ringraziare poi tutti i dottorandi e i post-docs sia del Dipartimento di Scienze
Biomediche e Cliniche dell’Ospedale L. Sacco di Milano, sia del Dipartimento di
Immunologia del Chelsea and Westminster Hospital di Londra, con cui ho
trascorso gran parte delle mie giornate nel corso di questi 3 anni. In particolare i
“miei compagni della pausa caffè”: grazie Salvinia ed Adel!
Un grazie speciale va al mio Amore. Grazie per essermi sempre stato vicino sia nei
tanti momenti belli che durante i periodi di crisi. Grazie per avermi sempre
appoggiato e sostenuto; senza di te sarebbe stato tutto piu’ difficile.
Ultimi, ma primi in importanza i miei genitori.
Questa tesi è dedicata a voi! Grazie per avermi sempre sostenuto in tutte le mie
scelte, per aver sempre creduto in me. Grazie per essere semplicemente stati li
quando ne avevo bisogno. Vi voglio bene!

ACKNOWLEDGMENTS The results of this project are due to both the scientific contribution and moral support of many people. First of all I would like to acknowledge Prof. Mario Clerici, my supervisor Prof. Daria Trabattoni and Dr. Mara Biasin from the University of Milan. Thank you for allowing me to undertake my scientific career, for guiding and advising me in the early stages of this process and for encouraging me to spend a period abroad. Special thanks go to Dr. Adriano Boasso from Imperial College London, where much of the work presented in this thesis was carried out. Without your constant encouragement, your belief in me, your guidance and your scientific contribution the completion of this project would have been arduous. Thank you very much Adriano! I also would like to acknowledge Professor Frances Gotch, Dr. Imami Nesrina, Dr. Peter Kelleher and Dr. Steven Patterson from Imperial College London. Thanks for the various advices, ideas and suggestions during numerous laboratory meetings. I would also like to thank all PhD students and post-docs from the Department of Clinical and Biomedical Science at Sacco Hospital in Milan, and from the Department of Immunology at Chelsea and Westminster Hospital in London, with whom I spent most of my days over the past three years. A particular thank goes, to Salvinia and Adel my "coffee break mates"! A special thank goes to my Love. Thanks for standing by me in both the many good moments and the periods of crisis. Thanks for always backing and supporting me; without you it would have been more difficult. Last but not least in importance, my parents. This thesis is dedicated to you! Thank you for always supporting me in all my choices and for always believing in me. Thank you for just being there when I needed it. I love you!
I
SOMMARIO
Introduzione: ILT7 (immunoglobulin like transcript 7) è una molecola di superficie selettivamente espressa dalle cellule dendritiche plasmacitoidi (pDC) umane. Il cross-linking di ILT7 sopprime l’attivazione delle pDC e la produzione di interferoni di tipo I (IFN I) mediata dai recettori Toll-like (TLR)7/9. BST2 (bone marrow stromal cell antigen 2), identificato come un ligando naturale di ILT7, è espresso da diversi tipi di cellulari e regolato da IFN I. L’interazione tra BST2 e ILT7 costituirebbe un feedback negativo sull’attivazione delle pDC che se alterato potrebbe contribuire all’attivazione cronica di tali cellule mediata da HIV. Pertanto, abbiamo verificato: 1) se l’espressione di BST2/ILT7 nelle cellule mononucleate del sangue periferico (peripheral blood mononuclear cell, PBMC) fosse correlata con l'attivazione delle pDC mediata da HIV-1 o da TLR7/9L; 2) quali stimoli influenzassero l’espressione di BST2 sulle PBMC e la produzione di IFN I; 3) se l'attivazione delle pDC in risposta a HIV-1 e TLR7/9L fosse direttamente modulata da BST2 in vitro. Metodi: Le PBMC, isolate da donatori sani, sono state coltivate per tutta la notte in presenza o meno di imiqimod (TLR7L), CpG ODN (TLR9L), AT2-HIV1, TNFα, IFNγ, IL4 IL10, Anti-IFNAR2 (Interferon Alpha/Beta Receptor Chain 2) o della proteina di fusione BST2-GST. Le cellule T sono state stimolate con anticorpi anti-CD3. L'effetto del blocco di BST2 e del cross-linking di ILT7 è stato testato utilizzando un anticorpo monoclonale (mAb) anti-BST2 e un mAb che induce il cross-linking di ILT7. L’espressione di ILT7, BST2, CD83 e CCR7 è stata analizzata mediante citofluorimetria. Le linee cellulari 293T, transfettate con BST2
wt
o mutato, sono state usate per testare l’efficienza di legame di anti-BST2 mAb e in coltura con le pDC per testare l’effetto biologico di BST2. L’IFNα è stato quantificato mediante ELISA. L’analisi statistica è stata condotta con SPSS 19.0 Risultati: ILT7 è selettivamente espressa dalle pDC, ma la sua espressione diminuisce rapidamente in vitro durante la maturazione delle pDC, confermata da cambiamenti morfologici e dall’espressione di CCR7. L’aumento di CD83, segno di piena maturazione e attivazione delle pDC, avviene solo in seguito alla stimolazione di TLR7/9. L’espressione di BST2 non è affetta da coltura in vitro. E’ maggiore nei monociti, nelle mDC e nelle cellule B, rispetto alle pDC e alle cellule T, ed è modulata da IFNα. Inoltre, l’espressione di BST2 sulle pDC è massima a moderate concentrazioni degli stimoli dei TLR, ma modesta a dosi elevate degli stessi. Questo profilo correla con quello di CD83 e con la produzione di IFNα, ma differisce dall’attivita’ di IDO (indoleamine-2,3-diossigenasi) a seguito di stimolazione con HIV. Il cross-linking di ILT7 inibisce la produzione di IFNα nelle PBMC esposte ad HIV o TLR7/9L. Tuttavia, il blocco di BST2 non influenza la produzione di IFN-I. L’ossevata mancanza di efficacia di BST2 non dipende dall’inefficienza dell’anti-BST2 mAb il quale, coniugato al fluorocromo PE, lega efficacemente le cellule 293T transfettate con BST2. Inoltre la produzione di IFNα non è modificata né da BST2-GST né in pDC in coltura con cellule 293T transfettate con BST2. La stimolazione del recettore delle cellule T contribusce all’aumento di BST2, ma anche quando BST2 é elevato nei linfociti T l’anti-BST2 mAb non altera la secrezione di IFNα. IL10 e, in parte, TNFα inibiscono la produzione di IFNα indotta da TLR9L, che peró non é ripristinata bloccando BST2. Conclusioni: I nostri dati indicano che il cross-linking di ILT7 sia un meccanismo omeostatico delle pDC immature circolanti, non un feedback negativo delle pDC attivate, e pongono dubbi sul ruolo biologico di BST2 come ligando di ILT7.

II
III
ABSTRACT
Introduction: The immunoglobulin like transcript 7 (ILT7) is a surface molecule selectively expressed by human plasmacytoid dendritic cell (pDC). ILT7 cross-linking inhibits Toll like receptor (TLR) 7/9-mediated pDC activation and type I interferon (IFNI) production. The bone marrow stromal cell antigen 2 (BST2) is a natural ligand for ILT7, is expressed on several cell types and encoded by an IFN I-stimulated gene. BST2/ ILT7 interaction may provide a negative feedback for pDC activation. Alterations of the BST2/ILT7 negative feedback may contribute to HIV1-induced pDC over-activation and pathogenesis. We tested: 1) if BST2/ILT7 expression in peripheral blood mononuclear cell (PBMC) correlates with TLR-mediated pDC activation; 2) which stimuli can influence BST2 expression and IFN-I production by PBMC; 3) if TLR-induced pDC activation is directly modulated by BST2-expressing cells in vitro. Methods: PBMC from healthy donors were cultured overnight with or without imiquimod (TLR7L), CpG ODN (TLR9L), AT2-HIV1, TNFα, IFNγ, IL4 IL10, Anti-Human Interferon Alpha/Beta Receptor Chain 2 (IFNAR2), BST2-GST fusion protein. T cells were stimulated using CD3 antibody. The effect of BST2 blockade and ILT7 cross-linking were tested using an anti-BST2 and cross linking-ILT7 monoclonal antibodies (mAbs), respectively. ILT7, BST2, CD83 and CCR7 expression was analyzed by flow cytometry. 293T cell lines transfected with BST2
WT, or BST2 mutants, were used to test anti-BST2 mAb efficiency of binding
or co-cultured with purified pDC to test the biologic effect of BST2. IFNα production was quantified by ELISA. Statistical analyses were performed using SPSS 19.0. Results: pDC exclusively expressed ILT7, which was rapidly downregulated in vitro as part of a first step of pDC differentiation, characterized by an increase of the pDC morphological complexity and CCR7 expression. CD83 expression, indicative of full pDC activation and maturation, occurred only following TLR stimulation. Conversely, BST2 expression was not affected by in vitro culture; it was highest in monocytes, mDC and B cells compared to pDC and T cells and it was modulated by TLR7/9L-induced IFNα production. BST2 expression on pDC was highest at intermediate stimuli concentrations but modestly increased at maximum concentrations; a profile which correlated with CD83 expression and IFNα production but not with indoleamine 2,3 dioxygenase (IDO) activity after HIV stimulation. PBMC pre-treatment with ILT7 cross-linking mAbs reduced both TLR9L/HIV-induced IFNα production and HIV-induced IDO activity. In contrast, pre-treatment with blocking BST2 Abs did not increase IFNα production or IDO activity. The lack of biological effect of BST2 was not due to inefficient αBST2 Ab binding, as PE-labelled αBST2 Ab efficiently stained BST2-transfected 293T cell lines. No change in IFNα production were observed using either a soluble BST2 protein or a co-culture system based on purified pDC and BST2
WT transfected 293T
cells. T cell receptor engagement resulted in maximum BST2 expression on T cells, but BST2-blocking mAbs did not affect IFNα release even when BST2 expression on T cell was enhanced. IL10 and TNFα inhibited TLR9L-induced IFNα production but BST2 blockade did not restored IFNα responses. Conclusions: Our data suggest that ILT7 cross-linking may acts as homeostatic mechanism on circulating pDC rather than a negative feedback for activated mature pDC, and argue against the role of BST2 as a biologically active ILT7 ligand.

IV
V
TABLE OF CONTENTS
LIST OF ABBREVIATIONS ........................................................................ 1
1 INTRODUCTION .................................................................................. 5
1.1 Human immunodeficiency Virus ................................................ 5
1.1.1 Historic overview ................................................................. 5
1.1.2 Epidemiology ....................................................................... 6
1.1.3 Genetic diversity .................................................................. 6
1.1.4 HIV genes and structure ...................................................... 7
1.1.5 HIV Life cycle and tropism .................................................. 9
1.1.6 Modalities of transmission ................................................ 11
1.1.7 The clinical course of HIV infection .................................. 11
1.1.8 The immune response against HIV ................................... 13
1.1.8.1 Cellular immune responses ..................................................... 13
1.1.8.2 Humoral immune responses ................................................... 14
1.1.8.3 Innate immune responses ....................................................... 15
1.1.9 Host immunity elusion and immune-suppression mechanisms ...................................................................................... 16
1.1.9.1 HIV variability and immune-avoidance ................................... 16
1.1.9.2 HIV mechanisms of immune system impairment .................. 16
1.1.10 Highly Active Antiretroviral Theraphy .............................. 17
1.2 The role of pDC in HIV infection: a new hypothesis of immunopathogenesis .......................................................................... 18
1.2.1 Plasmacytoid DC cell ......................................................... 18
1.2.2 Plasmacytoid DC and HIV immunopathogenesis ............ 20
1.3 ILT7 and BST2 interaction ........................................................ 25
1.3.1 ILT7 ..................................................................................... 25
1.3.2 BST2 ................................................................................... 27
1.3.3 ILT7 and BST2 interaction. ................................................ 30
2 HYPOTHESIS AND AIMS .................................................................. 33
3 MATERIALS AND METHODS ........................................................... 35
3.1 Cell culture media and buffers ................................................. 35
3.2 Samples ..................................................................................... 35
VI
3.3 Mononuclear leukocytes isolation and culture ....................... 35
3.4 Cell counts ................................................................................ 36
3.5 Isolation and culture of pDC .................................................... 36
3.6 Cell lines: description and culture ........................................... 37
3.7 Cryogenic storage of 293T cell lines ....................................... 37
3.8 Stimulation of PBMC ................................................................ 38
3.8.1 Stimulation of PBMC with TLRs agonist and HIV ............ 38
3.8.2 Stimulation of PBMC with cytokines ................................ 38
3.8.3 Stimulation of PBMC with T cell receptor agonists ......... 38
3.8.4 Stimulation of PBMC with anti-IFNI Receptor .................. 38
3.8.5 Stimulation of PBMC with soluble BST2-GST fusion protein ............................................................................................ 39
3.9 ILT7 cross-linking and BST2 blockade .................................... 39
3.10 Enzyme-Linked Immunoabsorbent Assay (ELISA) ................. 39
3.11 Tryptophan and kynurenine measurement ............................. 39
3.12 Phenotypic analysis ................................................................. 40
3.13 BST2 staining of IFNα- treated 293T-wt and 293T-ts cells ..... 40
3.14 pDC and 293T cell co-cultures ................................................. 40
3.15 Proliferation assay .................................................................... 41
3.16 Statistical analyses ................................................................... 42
4 RESULTS AND DISCUSSION ........................................................... 43
4.1 Overview .................................................................................... 43
4.2 ILT7 expression and modulation following in vitro culture ... 43
4.2.1 ILT7 expression is limited to pDC and is downregulated during in vitro culture ...................................................................... 43
4.2.2 ILT7 downregulation is associated with the differentiation of blood pDC precursors ................................................................. 48
4.2.3 Summary and discussion ................................................. 51
4.3 BST2 expression and regulation following in vitro culture ... 52
4.3.1 BST2 is upregulated in different cell types a consequence of IFNα stimulation via TLR- mediated pathway............................. 52
4.3.2 Effect of TLR- agonists titration on BST2 expression and pDC activation. ................................................................................. 56
VII
4.3.3 BST2 expression is not sufficient to suppress IFN-α production via ILT7 cross-linking. .................................................. 58
4.3.4 BST2 expression is not sufficient to inhibit IDO activity 62
4.3.5 BST2 antibody efficiency of binding ................................ 64
4.3.6 BST2 is not involved in the regulation of IFNα production by pDC ............................................................................................ 65
4.3.6.1 Soluble BST2 did not affect IFNα production ........................ 65
4.3.6.2 BST2 did not affect IFN-α production in an in vitro co-culture system .................................................................................................... 66
4.3.7 Summary and discussion ................................................. 68
4.4 BST2 expression on T cells ..................................................... 69
4.4.1 TLR9L-mediated BST2 expression is enhanced by T cell receptor engagement. ...................................................................... 70
4.4.2 Enhancement of TLR9L- mediated BST2 expression by T cell receptor engagement is not sufficient to suppress IFNα production via ILT7 cross-linking ................................................... 76
4.4.3 Summary and discussion ................................................. 79
4.5 BST2 expression may be modulated by cytokines involved in the regulation of inflammatory responses ......................................... 80
4.5.1 Modulation of BST2 expression on PBMC by pro- and anti-inflammatory cytokines ............................................................ 80
4.5.2 Inflammatory mediators affect IFNα production but not through the BST2/ILT7 pathway ...................................................... 82
4.5.3 Summary and discussion ................................................. 84
5 CONCLUSIONS ................................................................................. 85
REFERENCES ......................................................................................... 87
APPENDIX 1 .......................................................................................... 111
APPENDIX 2 .......................................................................................... 123
APPENDIX 3 .......................................................................................... 152
APPENDIX 4 .......................................................................................... 153

VIII

1
LIST OF ABBREVIATIONS
1-MT: 1-methyl-D-tryptophan 293T/ts-CM: 293T transfected cells culture medium 293T-CM: 293T cells culture medium Abs: Antibodies
ADCC: Antibody‑dependent cell‑mediated cytotoxicity
AIDS: Acquired immune deficiency syndrome APC: Antigen-presenting cells ART: Antiretroviral therapy AT-2: Aldrithiol-2 BLK: B lymphoid tyrosine kinase bnAb: Broadly neutralizing antibodies BST2: Bone marrow stromal antigen 2 CA: Capsid proteins CAF: CD8 antiviral factor CCR5: C-C chemokine receptor type 5 CDC: Centers for Disease Control and Prevention CM: Culture media CRFs: Circulating recombinant forms CTL: Cytotoxic CD8+ T cell CXCR4: C-X-C chemokine receptor type 4 DC: Dendritic cells DMEM: Dulbecco’s modified Eagle’s medium DMSO: Dimethylsulphoxide EDTA: Ethylenediamine tetra-acetic acid ER: Endoplasmic reticulum FasL: Fas ligand FBS: Foetal bovine serum FcRγ: Gamma chain of Fc receptors FcαR Fc: receptor for Igα FMO: Fluorescence minus one FSC: Forward Scatter GALT: Gut-associated lymphoid tissue GAPDH: Glyceraldehyde-3-phosphate dehydrogenase GFP: green fluorescence protein gp: Glycoprotein GPI: Glycosyl phosphatidyl inositol GST: Glutathione-S-tranferase HAART: Highly Active Antiretroviral Theraphy HEK: Human embryonic kidney HESN: HIV-exposed-seronegative individuals HEV: High endothelial venules HIV: Human immunodeficiency virus HIV-1: Human immunodeficiency virus type 1 HIV-2: Human immunodeficiency virus HIV type 2 HPLC: High performance liquid chromatography HRP: Horseradish peroxidase
2
HTLV: Human T cell leukemia virus IDO: Indoleamine-2,3-dioxygenase IFN I: Type I IFN IFN: Interferon IFNAR2: Interferon Alpha/Beta Receptor Chain 2 Ig: Immunoglobulin IL: Interleukin ILT: Immunoglobulin-like transcripts ILT7L: ILT7 ligand IN: Integrase IQRs: Interquartile ranges IRAK4: IL1 receptor-associated kinase 4 ITAMs: Immunoreceptor tyrosine-based activation motif ITIMs: Immunoreceptor tyrosine-based inhibitory motifs KP: Kaposi’s sarcoma KSHV: Kaposi’s sarcoma-associated herpes virus Kyn: Kynurenine LAIR: Leukocyte-associated inhibitory receptor LAV: Lymphadenopathy-associated virus LILR: Leukocyte Ig-like receptors LN: Lymph node LRSCs: Leukoreduction system chambers LTNP: Long term non progressors, LTR: Long terminal repeated regions MA: Matrix proteins mAb: Monoclonal Ab mDC: Myeloid DC mDDC: Monocyte-derived DC MFI: Mean Fluoresce Intensity MIR: Monocyte/macrophage Ig-like receptors mRNA: Messenger RNA M-tropic: Macrophage-tropic MyD88: Myeloid differentiation primary-response gene 88 nAbs: Neutralising antibodies NC: Nucleocapsid proteins Nef: Negative regulatory factor NFAT: Nuclear factor of activated T cells NFκB: Nuclear factor-κB NK: Natural killer cells NNRTI: Non nucleoside reverse transcriptase inhibitors NPIC: Natural type I interferon producing cells NRTI: Nucleoside/nucleotide reverse transcriptase inhibitors OD: Optical density ODN: Oligodeoxynucleotides PBMC: Peripheral blood mononuclear cells PBS: Phosphate-buffered saline PCP: Pneumocystis carinii pneumonia PCR: Polymerase chain reaction pDC: Plasmacytoid DC
3
PDL1: Programmed death ligand 1 PI: Protease inhibitors PIC: Pre-integration complex PKR: Protein kinase R PR: Viral protease PRR: Pattern recognition receptors r: Recombinant RCF: Relative Centrifuge Force RT: Reverse trascriptase RTC: Reverse transcription complex RT-PCR: Reverse transcription PCR SAGE: Serial analysis of gene expression SH2: Src homology 2 SIVs: Simian immunodeficiency viruses SSC: Side Scatter T reg: Regulatory T cells TCR: T cell receptor TGN: trans-Golgi network TH1: T helper type 1 TIR: Toll/IL1 receptor TLR: Toll-like receptors TLR7L: TLR9 ligand/ imiquimod TLR9L: TLR9 ligand/ CpG ODN TMB: Tetramethyl-benzidine TNF: Tumour necrosis factor TRAF6: TNF receptor-associated factor 6 TRAIL: TNF-related apoptosis-inducing ligand trp: Tryptophan ts: Transfected T-tropic: T-lymphocyte–tropic URFs: Unique recombinant forms Vif: Viral infectivity factor Vpr: Viral protein R Vpu: Viral protein U WHO: World Health Organization WT: Wild-type XL: Cross-linking XL-ILT7 Ab: Cross-linking ILT7 Ab αBST2 Ab: Anti/blocking BST2-specific Ab β-TrCP: β-transducin repeat containing protein

4
5
1 INTRODUCTION
1.1 Human immunodeficiency Virus
The Human immunodeficiency virus (HIV) is a member of the Lentiviridae subfamily of retroviruses affecting humans [1]. HIV has been identified as the causative agent of the acquired immune deficiency syndrome (AIDS) [2, 3] a disease characterized by variable clinical manifestations sharing an underlying state of severe immunodeficiency that accompanies the onset of opportunistic infections and cancers. No definitive cure or vaccine for AIDS is currently available.
1.1.1 Historic overview
The first clinical identification of AIDS dates back to 1981 when Gottlieb and co-workers reported the case of five young men affected by rare opportunistic infection, Pneumocystis carinii pneumonia (PCP), associated with a severe T cell depletion [4]. Shortly after, cases of another rare disease, skin cancer Kaposi’s sarcoma (KP), emerged [5]. Both PCP and KP were usually detected in people with a severe impairment of the immune system caused by cancer or immunosuppressive drugs [6]. As cases of PCP and KP were continuously increasing, the U.S. Centers for Disease Control and Prevention (CDC) set up a task force to monitor the outbreak of infections [7, 8]. Several other unusual anomalies were observed in the infected patients, such as generalized lymphadenopathy, low CD4
+ cell count, and high susceptibility to opportunistic
infections [1, 5, 7]. The disease was first associated to 4 risk groups, which were originally referred to as the “4 H’s” as they seemed to single out Haitians, homosexuals, hemophiliacs, and heroin users [9]. Soon, it became clear that also heterosexual individuals and other intravenous drug users could be affected by the disease which was thus named AIDS, a term officially used by the CDC in 1982 [10]. As the syndrome was defined, different research teams began to search for the causative agent. In 1983, two different groups reported that a new virus, with reverse trascriptase (RT) activity, was the causative agent of AIDS. The group led by Robert Gallo isolated a virus from the peripheral blood T cell of a patient diagnosed with AIDS presenting a similar morphology to the human T cell leukemia virus (HTLV) and recognised by antibodies (Abs) against the viral protein p19 and p24 [3]. Thus this virus was called HTLV-III. At the same time Barre-Sinoussi and Montagnier (Nobel Prize in Physiology or Medicine 2008) detected traces of RT activity, indicating the presence of a retrovirus, in the supernatants of T cells cultured with interleukin (IL) 2 and in cells isolated from the lymph node biopsy of a patient with generalised lymphadenopathy [2]. Moreover the labelled viral supernatants could not be immune precipitated with the HTLV antibodies; discarding the hypothesis that virus was a member of the HTLV family. Shortly after, the retroviral-like particles were identified by electron microscopy, and the virus was called lymphadenopathy-associated virus (LAV) [11]. HTLV-III and LAV were later recognized as being the same virus, known today as HIV. In the next few years Abs against HIV were indentified in individuals diagnosed with AIDS, and HIV was recognised as the causative agent of the syndrome. In 1984, the genome sequence finally defined HIV as a member of the genus Lentivirus of the family Retroviridae [1]. Since then, enormous progress has been made revealing the molecular basis of HIV infection, progression and transmission. Different drugs to
6
slow the disease progression are now available but further studies are carrying on in order to find a vaccine.
1.1.2 Epidemiology
Since 1981, the year of the first reported case of AIDS [4], over 60 million people have been affected and more than 25 million died of this disease [12].Thus, AIDS is now considered one of the greatest pandemic infections of our era. It is estimated that in 2010 approximately 34 million people were living with HIV, of whom about 23 million were in the sub-Saharan Africa. The number of newly infected people worldwide is gradually declining, from 3.4 million in 1997 to 2.7 million in 2010, but large differences exist between different regions. During the first decade of the new millennium, the incidence of HIV infection declined in 33 countries, of which 22 are in the sub-Saharan region of Africa. Indeed, an approximate reduction of 16% in the percentage of newly infected people was reported in sub-Saharan African countries in 2010 compared to 2001 and 26% compared to 1997, when the incidence of HIV peaked overall. A similar trend was observed in South-East Asia. However, not all countries fit in the overall trend. Between 2001 and 2010, an increase in newly infected people has been observed in the Middle East and North Africa; moreover the incidence of HIV infection has been accelerating again since 2008 in Eastern Europe and Central Asia [13]. Similarly, the global number of deaths due to AIDS is gradually declining, from the peak of 2.2 million observed in 2005 to 1.8 million in 2010. However, significant differences were observed between different regions. A reduction of AIDS-related deaths was reported in sub-Saharan Africa, South and South-East Asia and the Caribbean since 2005; which reflects the intensification of prevention efforts as well as increasing coverage of antiretroviral therapy (47% coverage of people eligible to treatment in low- middle income countries). Conversely, the number of people dying from AIDS increased of around 10 fold in Eastern Europe and Central Asia and of 60% the Middle East and North Africa between 2001 and 2010. Although there is a progressive global reduction in the incidence of new infections and AIDS-related deaths, the numbers still remain very high. Therefore the Joint United Nations Programme on HIV/AIDS (UNAIDS) and World Health Organization (WHO) released a five years strategy (2011-2015) that aims to reach zero new infections, zero discrimination and zero AIDS-related deaths for 2015. This strategy focuses on four main approaches: 1) optimizing prevention, diagnosis and treatment; 2) building sustainable health system; 3) leveraging broader health outcomes through HIV responses; and 4) removing vulnerability and structural barriers to accessing services [13].
1.1.3 Genetic diversity
The HIV acronym comprises two major types of the virus: HIV type one (HIV-1) and HIV type two (HIV-2). Both of these viruses originate from multiple cross-species transmissions of simian immunodeficiency viruses (SIVs) naturally infecting African primates [14]. Simian relatives of HIV-1 and 2 were respectively discovered in Chimpanzees (SIVspz) [15] and Sooty mangabeys (SIVsm) [16].
HIV-1 includes four lineages (M, O, N and P) generated by distinct cross-species transmission events. Group M (Main group) is the major group responsible for the HIV pandemic infection, virtually diffused in every country. Group O (Outlier group)
7
is responsible for less than 1% of the HIV-1 infection, concentrated in Cameroon, Gabon, and neighbouring countries. Group N (non-M, non-O group), has been documented since 1998 in only 13 individuals in Cameroon. Finally, group P, discovered by Plantier and colleagues in 2009 and detected so far in only two individuals in Cameroon. Additionally, group M can be divided into 9 subtypes, named with letters, and sub-subtypes denoted with numbers (A1, A2, A3, A4, B, C, D, F1, F2, G, H, J, and K). The subtypes (or Clades) are phylogenetically linked strains of HIV-1 that are approximately the same genetic distance from one another. Moreover, the recombination between subtypes within a dually infected person led to the generation of unique recombinant forms (URFs) or circulating recombinant forms (CRFs), so called when identified in three or more people with no direct epidemiologic linkage [17].
HIV-2 is mainly spread in West Africa, with the highest prevalence rate recorded in Guinea Bissau and Senegal. Similarly to HIV-1, HIV-2 is divided in lineages (A-H), but only Group A and B have spread in humans to a considerable level [14].
Critical differences exist between HIV-1 and HIV-2, which provide useful information about the evolution and pathogenesis of HIV. The main differences between the two strains lie in a lower disease severity induced by HIV-2 compared to HIV-1, a better immune control of HIV-2 infection and a certain level of independence from CD4 for infection [18].
The data presented in this dissertation refer to HIV-1, which will be simply named as HIV, from now on.
1.1.4 HIV genes and structure
The HIV virion has an approximately spherical shape with a diameter of 100-120 nm. The virion presents a lipid bilayer membrane (envelope) surrounding a dense truncated cone-shaped nucleocapside (core) that allocates the HIV genome, the viral protease (PR), the integrase (IN), the reverse transcriptase, and the viral accessory proteins Vif, Vpr and Nef (Figure 1.1A).The envelope is embedded with spikes of the viral Env glycoprotein, a heterodimer formed by the external glycoprotein (gp) 120 non covalently–linked to the transmembrane gp41 in a triangular symmetry [19]. Recent reports showed that the number of the Env spikes in HIV is about 14 ± 7 per particle (range 4 to 35) contrasting with the previous studies which reported a number of 72 spikes per virion [20]. The core is formed by 4 main structural proteins: 1) the matrix proteins (MA or p17), which create a shell directly associated with the internal side of the envelope thanks to the N terminal domains; 2) the capsid proteins (CA or p24), which are assembled in an hexameric ring via the N-terminus to form the capsid; 3) the nucleocapsid proteins (NC or p7), which stabilize the RNA dimers in the nucleocapsid assemblage; and 4) the protein p6 (domain of p55), which is involved in terminal steps of virion assembly and budding [19].
The viral genome consists of two copies of 9.2 kb single-strand RNA. Each strand consists of 2 long terminal repeated regions (LTR), involved in the integration of the viral genome in the infected cell and in the viral replication, plus 9 genes divided in 3 groups on the basis of the function of the encoded proteins. In particular Gag, Pol, Env are defined as structural genes; Tat, Rev and Nef as regulatory genes; and Vpu, Vpr, and Vif as accessory genes (Figure 1.1B). In details Gag encodes
8
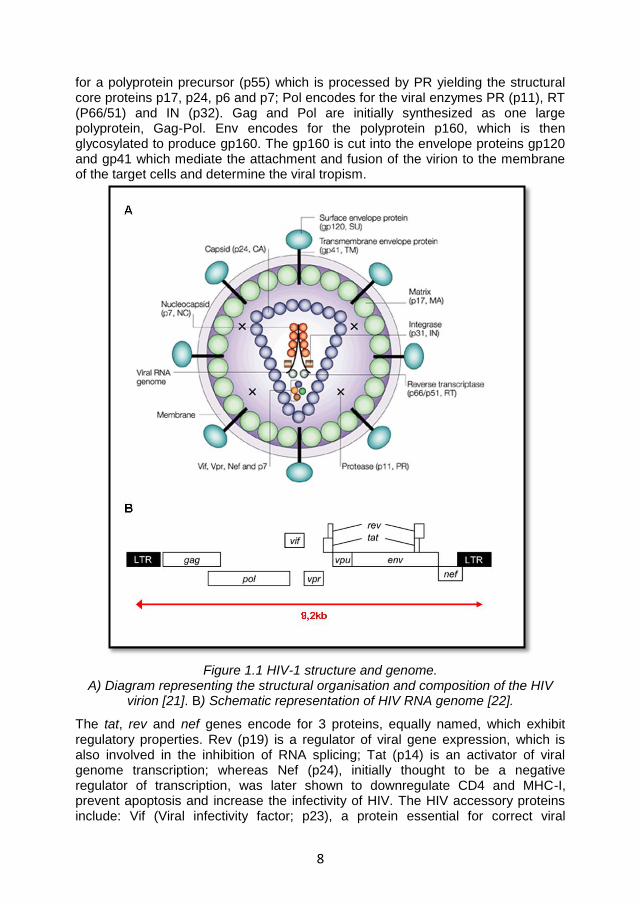
for a polyprotein precursor (p55) which is processed by PR yielding the structural core proteins p17, p24, p6 and p7; Pol encodes for the viral enzymes PR (p11), RT (P66/51) and IN (p32). Gag and Pol are initially synthesized as one large polyprotein, Gag-Pol. Env encodes for the polyprotein p160, which is then glycosylated to produce gp160. The gp160 is cut into the envelope proteins gp120 and gp41 which mediate the attachment and fusion of the virion to the membrane of the target cells and determine the viral tropism.
Figure 1.1 HIV-1 structure and genome. A) Diagram representing the structural organisation and composition of the HIV
virion [21]. B) Schematic representation of HIV RNA genome [22].
The tat, rev and nef genes encode for 3 proteins, equally named, which exhibit regulatory properties. Rev (p19) is a regulator of viral gene expression, which is also involved in the inhibition of RNA splicing; Tat (p14) is an activator of viral genome transcription; whereas Nef (p24), initially thought to be a negative regulator of transcription, was later shown to downregulate CD4 and MHC-I, prevent apoptosis and increase the infectivity of HIV. The HIV accessory proteins include: Vif (Viral infectivity factor; p23), a protein essential for correct viral
9
assembly and transmission; Vpr (Viral protein R; p15) which is mainly involved in the G2 cell-cycle arrest; and Vpu (Viral protein U), which induces CD4 downregulation and influences the release of the newly formed virions [23, 24]. The role of Vpu is important for the purposes of my research project and it will be further discussed later in this dissertation.
1.1.5 HIV Life cycle and tropism
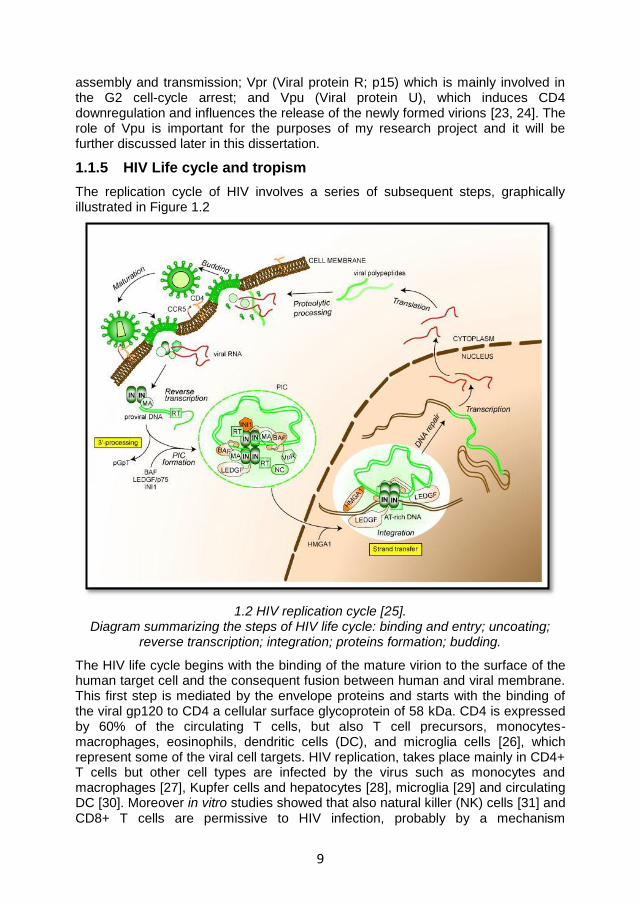
The replication cycle of HIV involves a series of subsequent steps, graphically illustrated in Figure 1.2
1.2 HIV replication cycle [25]. Diagram summarizing the steps of HIV life cycle: binding and entry; uncoating;
reverse transcription; integration; proteins formation; budding.
The HIV life cycle begins with the binding of the mature virion to the surface of the human target cell and the consequent fusion between human and viral membrane. This first step is mediated by the envelope proteins and starts with the binding of the viral gp120 to CD4 a cellular surface glycoprotein of 58 kDa. CD4 is expressed by 60% of the circulating T cells, but also T cell precursors, monocytes-macrophages, eosinophils, dendritic cells (DC), and microglia cells [26], which represent some of the viral cell targets. HIV replication, takes place mainly in CD4+ T cells but other cell types are infected by the virus such as monocytes and macrophages [27], Kupfer cells and hepatocytes [28], microglia [29] and circulating DC [30]. Moreover in vitro studies showed that also natural killer (NK) cells [31] and CD8+ T cells are permissive to HIV infection, probably by a mechanism
10
independent of CD4-gp120 interaction [32]. During HIV infection of CD4+ cells, the binding between gp120 and CD4 induces conformational changes in gp120 which expose co-receptor binding sites. The principal co-receptors used by HIV are the C-C chemokine receptor type 5 (CCR5) and C-X-C chemokine receptor type 4
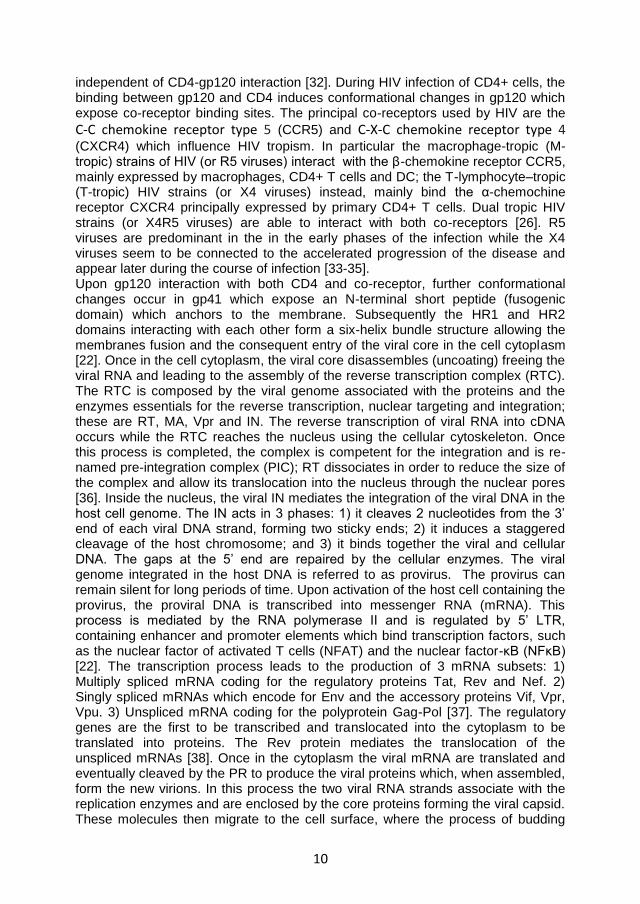
(CXCR4) which influence HIV tropism. In particular the macrophage-tropic (M-tropic) strains of HIV (or R5 viruses) interact with the β-chemokine receptor CCR5, mainly expressed by macrophages, CD4+ T cells and DC; the T-lymphocyte–tropic (T-tropic) HIV strains (or X4 viruses) instead, mainly bind the α-chemochine receptor CXCR4 principally expressed by primary CD4+ T cells. Dual tropic HIV strains (or X4R5 viruses) are able to interact with both co-receptors [26]. R5 viruses are predominant in the in the early phases of the infection while the X4 viruses seem to be connected to the accelerated progression of the disease and appear later during the course of infection [33-35]. Upon gp120 interaction with both CD4 and co-receptor, further conformational changes occur in gp41 which expose an N-terminal short peptide (fusogenic domain) which anchors to the membrane. Subsequently the HR1 and HR2 domains interacting with each other form a six-helix bundle structure allowing the membranes fusion and the consequent entry of the viral core in the cell cytoplasm [22]. Once in the cell cytoplasm, the viral core disassembles (uncoating) freeing the viral RNA and leading to the assembly of the reverse transcription complex (RTC). The RTC is composed by the viral genome associated with the proteins and the enzymes essentials for the reverse transcription, nuclear targeting and integration; these are RT, MA, Vpr and IN. The reverse transcription of viral RNA into cDNA occurs while the RTC reaches the nucleus using the cellular cytoskeleton. Once this process is completed, the complex is competent for the integration and is re-named pre-integration complex (PIC); RT dissociates in order to reduce the size of the complex and allow its translocation into the nucleus through the nuclear pores [36]. Inside the nucleus, the viral IN mediates the integration of the viral DNA in the host cell genome. The IN acts in 3 phases: 1) it cleaves 2 nucleotides from the 3’ end of each viral DNA strand, forming two sticky ends; 2) it induces a staggered cleavage of the host chromosome; and 3) it binds together the viral and cellular DNA. The gaps at the 5’ end are repaired by the cellular enzymes. The viral genome integrated in the host DNA is referred to as provirus. The provirus can remain silent for long periods of time. Upon activation of the host cell containing the provirus, the proviral DNA is transcribed into messenger RNA (mRNA). This process is mediated by the RNA polymerase II and is regulated by 5’ LTR, containing enhancer and promoter elements which bind transcription factors, such as the nuclear factor of activated T cells (NFAT) and the nuclear factor-κB (NFκB) [22]. The transcription process leads to the production of 3 mRNA subsets: 1) Multiply spliced mRNA coding for the regulatory proteins Tat, Rev and Nef. 2) Singly spliced mRNAs which encode for Env and the accessory proteins Vif, Vpr, Vpu. 3) Unspliced mRNA coding for the polyprotein Gag-Pol [37]. The regulatory genes are the first to be transcribed and translocated into the cytoplasm to be translated into proteins. The Rev protein mediates the translocation of the unspliced mRNAs [38]. Once in the cytoplasm the viral mRNA are translated and eventually cleaved by the PR to produce the viral proteins which, when assembled, form the new virions. In this process the two viral RNA strands associate with the replication enzymes and are enclosed by the core proteins forming the viral capsid. These molecules then migrate to the cell surface, where the process of budding
11
occurs for newly formed virions. When budding from the host cell, each virion incorporates part of the cellular membrane which will form the viral envelope and contains both viral and host cell proteins [26]. The new viruses are then ready to infect bystander cells thereby restarting the replication cycle. It has been shown that the HIV life cycle has a minimum duration of 1.2 days whilst the average generation time (time taken from a virion just released to infect another cell and produce the next generation of virions) is 2.6 days. Moreover it has been estimated that an average of 10.3x10
9 new virions are produced per day in an infected patient
[39].
1.1.6 Modalities of transmission
HIV has been isolated in different biological fluids, including blood [40, 41], semen [42], vaginal secretions [43], milk [44] and saliva [45] at various viral concentrations. The concentration of HIV in the body fluids, together with the biological properties of the virus and the host susceptibility, influence the viral transmission as well as the infection outcome (AIDS-long term survival) [26]. The most common modalities of HIV transmission are 1) sexual (by homo/heterosexual intercourses; accounting for the majority of HIV infections worldwide); 2) perinatal (in uterus, during delivery, or postnatally via breastfeeding), and 3) parenteral (by blood transfusion or blood exposure through re-use or share of needles or syringes, mainly among intravenous drug users or during occupational health accidents) [46].
1.1.7 The clinical course of HIV infection
Despite variations among individuals the clinical course of HIV infection seems to follow a common pattern of development that can be divided into 3 major stages [47]:
1. Primary infection 2. Clinical latency 3. AIDS
The typical course of HIV infection is shown in Figure 1.3
The first phase is characterised by the development of a monoclueosis-like syndrome (acute syndrome) that affects up to 70% of patients within 3-6 weeks post infection [48].The typical symptoms include fever (the most common), headache, exhaustion, myalgia, generalized lymphadenopathy and cutaneous rashes [49]. A considerable viral replication occurs in this period, during which high levels of plasma viremia are detected [50, 51]. The peak is reached between 6-15 days after the beginning of the acute syndrome, when the viral load varies approximately between 10
6 to 10
7 copies/ml [52].During this phase the virus also
settles in the lymphatic tissues, which constitute the principal reservoirs where HIV is produced and preserved in immune complexes bound by follicular DC and persists in lately infected resting CD4+ T cells [53]. Concomitant with the increase of plasma viremia, an abrupt decline in circulating CD4+ lymphocytes is observed, as a consequence of both HIV-mediated apoptosis and the re-trafficking of CD4 T cells to lymphoid tissues or other organs [50, 51, 54, 55]. Moreover recent studies showed that CD4+ CCR5+ memory T cells, which preferentially reside in the gastro–intestinal mucosa, are rapidly depleted during HIV/SIV primary infection.
12
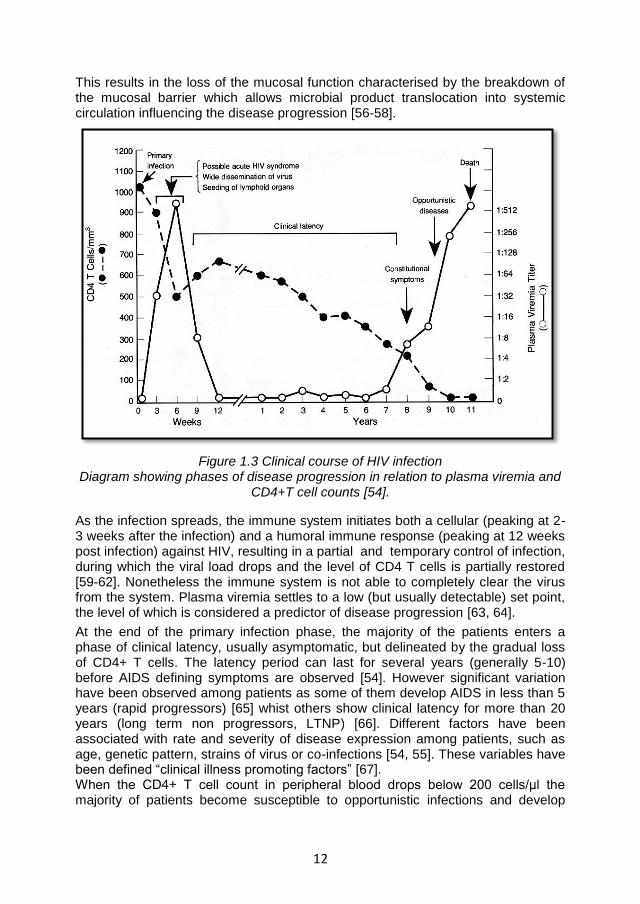
This results in the loss of the mucosal function characterised by the breakdown of the mucosal barrier which allows microbial product translocation into systemic circulation influencing the disease progression [56-58].
Figure 1.3 Clinical course of HIV infection Diagram showing phases of disease progression in relation to plasma viremia and
CD4+T cell counts [54].
As the infection spreads, the immune system initiates both a cellular (peaking at 2-3 weeks after the infection) and a humoral immune response (peaking at 12 weeks post infection) against HIV, resulting in a partial and temporary control of infection, during which the viral load drops and the level of CD4 T cells is partially restored [59-62]. Nonetheless the immune system is not able to completely clear the virus from the system. Plasma viremia settles to a low (but usually detectable) set point, the level of which is considered a predictor of disease progression [63, 64].
At the end of the primary infection phase, the majority of the patients enters a phase of clinical latency, usually asymptomatic, but delineated by the gradual loss of CD4+ T cells. The latency period can last for several years (generally 5-10) before AIDS defining symptoms are observed [54]. However significant variation have been observed among patients as some of them develop AIDS in less than 5 years (rapid progressors) [65] whist others show clinical latency for more than 20 years (long term non progressors, LTNP) [66]. Different factors have been associated with rate and severity of disease expression among patients, such as age, genetic pattern, strains of virus or co-infections [54, 55]. These variables have been defined “clinical illness promoting factors” [67]. When the CD4+ T cell count in peripheral blood drops below 200 cells/μl the majority of patients become susceptible to opportunistic infections and develop
13
AIDS-defining symptoms (ex. generalised lymphadenopathy, PC, KS, neurological disorders) [68] which lead to death usually within two years [69].
1.1.8 The immune response against HIV
After HIV- infection, a series of immune responses against the virus are induced in the vain attempt to eliminate the infection.
1.1.8.1 Cellular immune responses
Different studies revealed the existence of an HIV-specific cytotoxic CD8+ T cell (CTL) response in the early phase of infection, before the actual detection of antibodies. This response begins in correspondence with the peak of plasma viremia observed during primary infection, and reaches maximum efficiency one or two weeks later, when the viral load drops [70]. The CTL response seems more efficient than HIV-specific antibodies in controlling HIV infection, as an inverse correlation between viral load and the number of specific CTL has been demonstrated using quantitative techniques [71]. Further confirmations come from studies on SIV-infected rhesus monkeys in which depletion of CD8+ T cells in vivo, using monoclonal antibodies, dramatically increased SIV viremia; leading to rapid progression to simian AIDS when the length of the depletion was protracted beyond 28 days [72]. CTL response is HLA (MHC) restricted, antigen specific, requires cell-cell contact and involves the production of perforin and Fas/Fas ligand (FasL) interaction. In particular, the T cell receptor (TCR) on the surface of CTL binds the viral peptides expressed by HIV-infected cells in association with MHC class I molecules. This binding promotes the release of perforin, which generates holes in the membrane of the target cell, creating a passage for granzymes which promote apoptosis of the infected cells. Alternatively, the binding between Fas (on the infected cells) and its ligand (on CTL) may promote the apoptotic death of the HIV-infected cells. Several viral peptides may be recognised by CTL, which are able to induce the lysis of the infected cells [73, 74]. These include: RT, Env, Gag and some accessory proteins [75-78]. Additionally, it has been shown that CD8+ T cells are able to release β-chemokines, such as MIP-1α, MIP-1β and RANTES, which are natural ligands of the HIV coreceptor CCR5 and are able to inhibit by R5-tropic HIV strains [79, 80]. Similarly other non-cytotoxic antiviral molecules, including interferon (IFN)-γ, tumour necrosis factor (TNF)-α, TNF-β and the soluble CD8 antiviral factor (CAF) can be secreted by CTL which control HIV viral infection [73, 81]. Many indications supporting the importance of the CTL response in the control of HIV infection come from observations on LTNP and HIV-exposed-seronegative individuals (HESN). LTNP present qualitatively and quantitatively superior HIV- specific CTL responses compared to normal progressors, whereas HESN exhibit detectable levels of HIV- specific CD8+ T cells with no sign of infection or disease [82, 83].
At the same time, strong CTL responses seem to induce a selective pressure on the viral replication favouring the generation of virus escape mutants. The generation of these mutants results in a decline in the initial T cell response, which is followed by a second one against epitopes which escape slower or are invariant. This latter T cell response seems to be important for the maintenance of the already established viral set point [70, 84].
14
Because CD4+ T cells are the main target for HIV infection (Section 1.1.7), the role of CD4+ T cell responses in controlling viral replication and disease progression is less clear. Nonetheless an HIV-specific CD4 T-cell response, mainly directed against epitopes within the Gag and Nef proteins, is detected in infected patients [85, 86]. However this response seems to be lower in patients with AIDS compared to asymptomatic ones, and it appears to become dysfunctional over time in HIV-infected people [86, 87]. In 1997, Rosenberg and colleagues showed an inverse correlation between p24-specific CD4+ T cell proliferative responses and viral load suggesting a contribution of the CD4+T cells response in the immunological control of viremia [88]. Moreover, comparing non-progressive individuals and patients with progressive HIV infection, Wilson and colleagues, found a strong HIV-specific proliferative response in non progressing subjects. In contrast, the proliferative response was absent in progressing patients, despite the detection of IFN-γ producing HIV specific CD4+ T cells by flow cytometry. This suggests that the dysfunction observed in most HIV+ patients is likely correlated to inability of HIV specific CD4+ memory T cells to proliferate in response to HIV antigens, rather than an absolute loss of HIV specific CD4+ T cells [89].
1.1.8.2 Humoral immune responses
Humoral immune responses seem to have a minor influence in the control of HIV infection. Antibody responses, identified as immune-complexes, begin 8 days after the detection of the virus in the plasma. Non-neutralising antibodies specific for epitopes within the Env glycoprotein are the first to be produced. In particular 23 days after infection non neutralising Abs specific for the Env glycoprotein gp41 can be detected in the plasma of HIV-infected individuals. The production of non neutralising Abs against the Env glycoprotein gp120 require an additional 14 days. Neutralising antibodies (nAbs), which mediate the destruction of the virus by phagocytosis, start to appear only 12 weeks after HIV infection. However these nAbs often bind a narrow range of epitopes, usually restricted to certain virus isolates, favouring the generation of viral immune-escape mutants. Only later (30 months post- infection) and only in a minority of patients, there may appear broadly neutralizing antibodies (bnAb), which bind conserved regions of HIV, and are able to neutralize a wider range of isolates (from different subtypes or from diverse geographical regions). However, this response is usually not associated with the control of viremia [70, 90]. Thus only nAbs, rather than the total amount of the specific Abs produced, seem to play a role in the defence against viral infection. The humoral immune response mounted against HIV during primary infection does seem to be less efficient compared to that observed in response to other viral infections. This impairment may be due to a number of different reasons. First, the generation of nAbs against HIV is delayed, probably due to the B cell impairment induced by the virus itself. Thus, HIV has been shown to promote the lysis of follicular B cells, B cell apoptosis and loss of 50% of the germinal centres, therefore delaying the generation of nAbs [91, 92]. During this period, and before nAbs are generated, the initial burst of HIV viremia has already been contained [93]. Additionally, different studies showed that Abs in the sera of HIV infected individuals are not able to significantly diminish viral infectivity in vitro [94], probably due to the generation of viral escape mutation (usually in the conformation or in the glycosylation pattern of gp120) [95, 96]. Moreover no association has been identified between the amount of maternal HIV specific nAbs in infected pregnant
15
women and the rate of vertical transmission [97] However studies conducted in rhesus macaques and chimpanzees demonstrated the protection against chimeric SHIV by the passive transfer of HIV nAbs, debating the role of humoral responses in the control of HIV replication [98-100].
1.1.8.3 Innate immune responses
Recently, the role of the innate compartment of the immune system in the control of HIV infection has been reconsidered [101]. Thus, during primary infection, an increased level of acute phase proteins, such as serum amyloid A, has been detected. Acute phase proteins levels further increase in parallel with cytokine responses and viral replication [70]. The increase of viremia during acute HIV infection has been linked with the increase of some cytokines and chemokines such as IFNα, IL15, IL18, TNFα, and late-peaking rise in levels of the immunoregulatory cytokine IL10 [102]. The production of these cytokines, may participate in the control of viral replication during primary infection, but may contribute to HIV immunopathology during chronic infection and prolonged systemic inflammation. The cellular source of these cytokines has not been clearly identified, but may consist of a multitude of cell types including infected CD4+CCR5+ T cells, monocytes, activated DC, macrophages, NK cells, NKT cells
and HIV‑specific T cells [70].
In particular, DC and NK cells seem to play an important role in the control of HIV infection. The DC subset is particular important for the purpose of my research and it will be widely discussed in Section 1.2 of this chapter; the role of NK cells is briefly described below. During primary infection, NK cells are activated and seem to proliferate before the peak of viremia [103]. Similar to CTL, NK cells control viral replication through cytolytic or cytokine-mediated mechanisms. Furthermore, similar to CD8+ T cells, NK cells secrete β-chemokines (MIP-1α, MIP-1β and RANTES) which block HIV infection by competing for CCR5 [104]. Moreover, in vitro studies demonstrated the
ability of NK cells to kill HIV-infected cells directly or through antibody‑dependent
cell‑mediated cytotoxicity (ADCC) [105, 106]. ADCC, rely on HIV specific gp120
Abs present in the serum or at mucosal level, and it appears to negatively correlate with the progression of disease [107, 108]. The importance of NK cells in the control of primary HIV infection was established by the analyses of a cohort of intravenous drug users HESN, in whom NK cells showed both a higher cytolytic activity and an increased CC-chemokines production, compared to HIV infected patients and healthy controls [109]. However, several studies pointed out the quantitative and qualitative impairment of this cell subset during the course of HIV infection. In particular, it has been shown that CD4+, CXCR4+ and CCR5+ NK cells may constitute an important viral reservoir in chronically HIV infected individuals receiving antiretroviral therapy [110]. In addition, HIV replication and NK cells counts appear to be negatively correlated in HIV+ patients [111, 112]. Moreover, NK cells appear to be dysfunctional and unable to respond to stimulation with certain cytokines in HIV-infected individuals [113]. Finally, the expression of inhibitory (KIR2DL2, KIR2DL1, KIR3DL2, LIR1) and activating (ex. NKp30 and NKp44) receptors on NK cell surface was altered by HIV. NK cells from HIV+ patients seem to upregulate the expression of inhibitory receptors, whist a downmodulation of activating receptors has been described in untreated HIV-infected people [113-115].
16
1.1.9 Host immunity elusion and immune-suppression mechanisms
1.1.9.1 HIV variability and immune-avoidance
Despite the several mechanisms put to use by the human immune system in order to control and eliminate the viral infection, HIV is able to establish a chronic infection that gradually leads to the destruction of the immune system itself, eventually leading to the death of the infected individuals. The ability of HIV to overcome the host immune defence mechanisms is mainly related to its high variability. A property which is a result of 3 main HIV features: 1) the “error-prone” activity of the HIV RT, which lacks proof-reading property and introduces on average one mutation for each viral genome transcribed [116]; 2) the high rate of viral replication (average of 10.3x10
9 new virions/day per patient) [39]; and 3) the
chances of recombination events within 2 or more viral subtypes in the same individuals [17]. The genetic variability of HIV allows for the generation of viral mutants which escape the surveillance mediated by CTL [70, 84] or nAbs [95, 96]. However, many other mechanisms are used by HIV to elude the host immune surveillance. An example of these consists in the down regulation of MHC class I molecules from the surface of infected cells; which are necessary for the antigen presentation to CTL and the subsequent lysis of the infected cells. CTL avoidance by MHC class I downmodulation, is mainly mediated by the viral accessory protein Nef. Nef diverts the viral-peptide loaded to MHC I to the endosomal pathway, from where they are brought back to the trans-Golgi network, thus preventing the expression of the complex on the cell surface [117, 118]. Additionally, the accessory protein Tat may contribute to this process by reducing the transcription of MHC class I molecules in HIV infected cells [119]. HIV also escapes NK-mediated surveillance, usually enhanced by MHC class I downregulation, by selectively reducing the surface expression of HLA-A and HLA-B, but not the inhibitory ligands for NK receptors HLA-C and HLA-E [120]. Moreover, HIV establishes a lifelong latency in the host, which allows a prompt increase of viremia upon the interruption of therapy. Several cellular and anatomical reservoirs have been proposed in which continuous low level HIV replication may take place. Microglia cells, male urogenital tract, macrophages, follicular DC, memory or naïve T cells are some examples. Two forms of latency have been identified in resting CD4+ T cells: labile preintegration latency, and stable postintegration latency. Additionally, different studies have shown that viral replication might continue in patients on antiretroviral therapy, even when the HIV RNA levels in the plasma are below detectable levels. Recent studies have also demonstrated the persistence of HIV in the gut-associated lymphoid tissue (GALT) in patients on therapy for 10 years. Thus, the presence of virus reservoir constitutes the major barrier to virus eradication [121].
1.1.9.2 HIV mechanisms of immune system impairment
In parallel to the avoidance of immune surveillance, HIV gradually destroys the immune system inducing a strong CD4+ T cell depletion as well as a general dysfunction of the immune responses. HIV utilizes several direct and indirect mechanisms to induce immune dysfunction. The main ones include:
compromising the membrane integrity after the exposure of envelope fusogenic domains [122];
17
cytotoxicity caused by the accumulation of non integrated viral RNA or DNA [123, 124];
compromising the protein synthesis apparatus, which mainly produces viral proteins;
caspase-mediated apoptosis induced by the accessory protein Vpr [125];
bystander apoptosis mediated by the accessory protein Nef [126];
ADCC of non infected cells mediated by the Abs binding to soluble gp120 attached to CD4 receptor of non infected cells [47];
alteration of CD4+ T cell function and activation through TCR downregulation [127].
1.1.10 Highly Active Antiretroviral Theraphy
The association between viremia and disease progression led to the development of a series of drugs able to reduce viral replication. Potentially, all the phases of the viral life cycle constitute targets for antiretroviral therapy (ART). Currently six classes of antiretroviral drugs are available:
1. Nucleoside/nucleotide reverse transcriptase inhibitors (NRTI). These consist of nucleoside or nucleotide analogues lacking the hydroxyl group in 3’ of the ribose, which compete with natural nucleoside for RT and inhibit the reverse transcription of the viral genome (ex. Zivoudine, Didanosine, Abacavir, Tenofovir).
2. Non nucleoside reverse transcriptase inhibitors (NNRTI). These agents induce alteration in the RT active site, decreasing the binding of natural nucleotides (ex. Nevirapine, Delaviridine, Efavirenz).
3. Protease inhibitors (PI). They mimic the Gag-Pol cleavage site and compete with it for PR. This prevents the generation of mature and infectious virions (ex. Saquinavir, Ritonavir Atanazavir).
4. Fusion inhibitors. Binding the HR1 region of gp120, these peptides block the fusion of viral and cellular membrane (ex. Enfuvirdide).
5. CCR5 antagonists. They block entry of the virus in the CD4+ T cells by binding the co-receptor CCR5 (ex. Maraviroc).
6. Integrase inhibitors They block the action of the enzyme IN And prevent integration of the proviral DNA (ex. Raltegravir) [19, 22, 128]
The current therapeutic strategy, Highly Active Antiretroviral Theraphy (HAART), is based on the concurrent use of at least 3 drugs from 2 of the above categories. Several studies showed the efficiency of HAART in reducing plasma viremia and delaying disease progression and time to death. However, the development of severe side effects (ex. cardiovascular complication, lopodystrophy syndrome) and the development of drug resistance (mainly due to poor patient’s adherence, which favours the generation of escape mutants) highlight the urgency for the development of more efficient therapies, a cure and/or an effective vaccine. The genetic variability of HIV and the high number of strain variations represent considerable obstacles to the development of a vaccine. In the past decades,
18
several approaches have been considered (including live attenuate vaccines, subunit vaccines and live recombinant vaccines), however no vaccine has been produced which was able to induce a neutralizing humoral response against HIV [19, 128].
1.2 The role of pDC in HIV infection: a new hypothesis of immunopathogenesis
1.2.1 Plasmacytoid DC cell
Dendritic cells are bone marrow derived cells, which act as professional antigen-presenting cells (APC) with a particular ability to stimulate naïve T cells and initiate primary immune response [129]. In humans, two distinct DC subsets are found in peripheral blood: myeloid DC (mDC) and plasmacytoid DC (pDC), which differ on the basis of their origin, microbial pathogen identification, phenotypic markers expression and type of immune and adaptive response induced [130]. In particular, pDC were first identified in 1958 by Lennert and Remmel, who described a new cell population with plasma-cell morphology, but lacking of the B cell and plasma cell markers [131]. These newly characterized cells were particularly abundant in the T cell areas of the lymphoid organs, hence the name “T-cell associated plasma cells” [131]. Studies carried in the 1980s led then to the identification of a small group of cells (0.1-0.5% of blood mononuclear cells), which were MHC II positive but distinct from T cells, B cells, monocytes and NK cells. These cells were able to secrete a large amount of type I IFN, a known potent antiviral factor, in response to viruses, and were therefore denoted “natural type I interferon producing cells” (NPIC) [132-135]. In 1999, a number of studies suggested that T-cell associated plasma cells and NPIC were in reality the same cell type actually known as pDC [136, 137]. Thus, pDC play an important role in antiviral immune response and constitute a bridge between innate and adaptive immunity. They are phenotypically defined as positive for CD4, CD45RA, CD123 and ILT3 but negative for ILT1, CD11c and lineage markers including CD3, CD14, CD16, CD19, CD20, and CD56. Furthermore, two additional markers appear to be restricted to human pDC in peripheral blood and bone marrow: BDCA2, a C-type lectin transmembrane glycoprotein that can internalize antigen for presentation to T cells; and BDCA4, a neuronal receptor that is also a co-receptor for the vascular endothelial growth factor A [138]. Circulating pDC are immature lymphoid-derived DC which are able to capture and process antigens and present peptides to T cells in the context of MHC molecules [139]. Upon activation, they upregulate CCR7 and CD62L, and migrate through the high endothelial venules (HEV) to the lymph nodes. During this process they mature becoming able to act as proper APC [136, 140]. The ability of pDC to respond to viral pathogens is associated to the expression of specific pattern recognition receptors (PRR) known as Toll-like receptors (TLR). TLR are a family of conserved trans-membrane molecules composed by an ectodomain of leucine-rich repeats, a trans-membrane domain and intracellular domain, know as Toll/IL1 receptor (TIR) domain. In particular the expression of endosomal TLR7 and TLR9 confers pDC sensitivity to single-stranded RNA and unmethylated CpG-rich DNA respectively, which are characteristic of most viral genome [138, 141]. Following exposure to viruses or nucleic acid, these two receptors relocate from the endoplasmic reticulum (ER) of the pDC to the endosome where the interaction
19
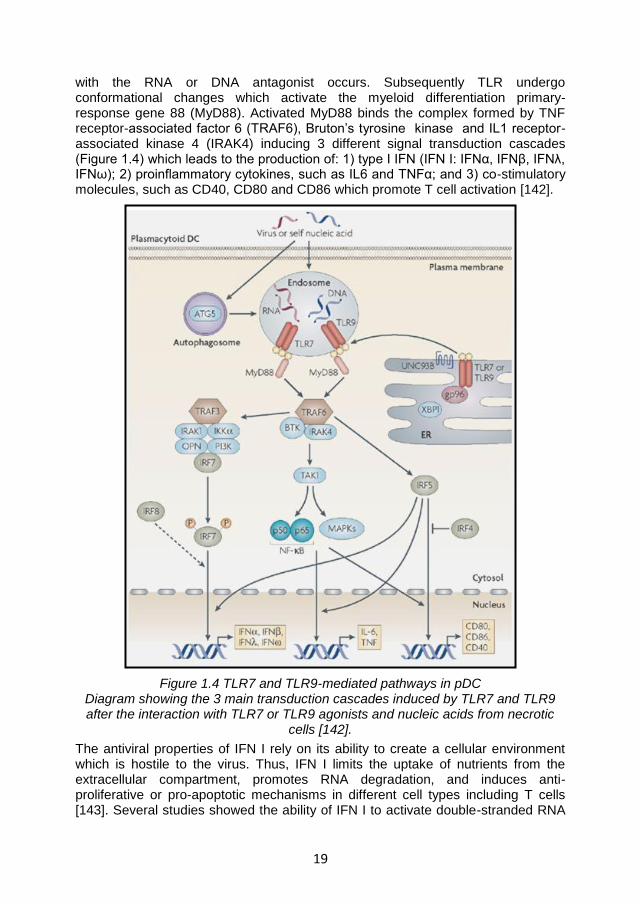
with the RNA or DNA antagonist occurs. Subsequently TLR undergo conformational changes which activate the myeloid differentiation primary-response gene 88 (MyD88). Activated MyD88 binds the complex formed by TNF receptor-associated factor 6 (TRAF6), Bruton’s tyrosine kinase and IL1 receptor-associated kinase 4 (IRAK4) inducing 3 different signal transduction cascades (Figure 1.4) which leads to the production of: 1) type I IFN (IFN I: IFNα, IFNβ, IFNλ, IFNω); 2) proinflammatory cytokines, such as IL6 and TNFα; and 3) co-stimulatory molecules, such as CD40, CD80 and CD86 which promote T cell activation [142].
Figure 1.4 TLR7 and TLR9-mediated pathways in pDC Diagram showing the 3 main transduction cascades induced by TLR7 and TLR9 after the interaction with TLR7 or TLR9 agonists and nucleic acids from necrotic
cells [142].
The antiviral properties of IFN I rely on its ability to create a cellular environment which is hostile to the virus. Thus, IFN I limits the uptake of nutrients from the extracellular compartment, promotes RNA degradation, and induces anti-proliferative or pro-apoptotic mechanisms in different cell types including T cells [143]. Several studies showed the ability of IFN I to activate double-stranded RNA
20
activated protein kinase R (PKR), which promotes cell death by blocking protein synthesis or acts in combination with NFκB to favour Fas/FasL interaction and increasing TNF-related apoptosis-inducing ligand (TRAIL) production [144]. The ability of pDC to produce large quantities of IFN I and cytokines makes them a key factor in the connection between innate and adaptive immunity. Thus, besides directly inhibiting viral replication, IFN I promotes the antiviral functions of NK cells, mDC, B and T cells. Several antiviral activities have been attributed to pDC-derived IFN I in the literature, which include: 1) activation of NK cell and CD8+ T cell cytotoxicity [132]; 2) maturation of mDC into APC [145]; 3) increased production of IL12, IL15, IL18 and IL23 by mDC [146]; 4) promotion of differentiation, maturation and immune-regulatory properties of DC [146]; 5) the regulation of T cell functions inducing the expression of the activation marker (CD69), long term survival, IFN-γ secretion and the differentiation of naïve T cells into T helper type 1 (TH1) cells) [147]; 6) induction of the nuclear protein p53 which regulates apoptosis in cycling cells [148, 149]; 7) the differentiation of B cells into immunoglobulin-producing plasma cells in combination with IL6 [150, 151].
Recently, it has been shown that pDC also exert a negative regulatory activity on T cells. Following TLR stimulation, pDC upregulates the expression of indoleamine-2,3-dioxygenase (IDO). IDO catabolises the essential amino acid tryptophan (trp) into N-formyl-kynurenine, which is rapidly converted into kynurenine (kyn). The combination of trp depletion and accumulation of downstream bioproducts of the kyn pathway exert a potent inhibitory effect on T cell proliferation and activity [152, 153]. IDO plays an important role in the maintenance of immune tolerance in particular conditions, for example by protecting the fetus from maternal T-cell immunity during mammalian gestation [153, 154], and as a protective negative regulator in autoimmune disorders[153, 155-157]. In chronic diseases, such as cancer or persistent infections, IDO appears to contribute to the maintenance of the chronic condition by preventing the development of an efficient immune response [158-161]. Moreover, IDO modulates the activation of regulatory T cells (Treg). In particular, Fallarino and colleagues showed bidirectional interplay between IDO and Treg. Thus, Treg activate IDO through the engagement of CTLA4 with B7 on APC,, thus suppressing immune reactions by inducing trp catabolism. Conversely, in conditions of Trp depletion and/or of high amounts of its catabolites, naïve CD4+T cell can be forced to differentiate into Treg rather than effector T helper cells [162, 163].
1.2.2 Plasmacytoid DC and HIV immunopathogenesis
According to the general accepted hypothesis of HIV immunopathogenesis, HIV induces a state of chronic immune activation, recognizable for example by the increase of some T cell activation markers (HLA-DR, CD38). This condition contributes to the depletion of CD4+ T cells and to the exhaustion of immune responses which characterizes the progression to AIDS [164-168]. In 2008, Boasso and Shearer proposed a new hypothesis of HIV-mediated-pathogenesis in which the virus leads firstly to a chronic activation of the host innate immune compartment which leads secondarily to the impairment of T cell function, despite the maintenance of the activated phenotype. Consequences of this process are the gradual depletion of the T cell compartment, as a result of pro-apoptotic cytokines,
21
and the gradual T cell dysfunction due to suppressive mechanisms. The role of pDC seems to be particularly relevant in this setting as they play an important role in the antiviral defence, but they may lead to the progressive T cell suppression when chronically activated, as observed during HIV infection, contributing to disease progression [164].
Different studies have shown that both frequencies and activity of pDC are reduced during HIV chronic infection; characteristics that correlate with disease progression [169-173]. However, it remains unclear whether the diminished proportion of circulating pDC in HIV positive individuals is due to HIV-mediated cytopathicity and apoptosis, or is secondary to their recruitment to lymph nodes [164]. There is evidence that pDC are susceptible to HIV infection. Thus, pDC express CD4, CXCR4 and CCR5 which are necessary for virus entry. Furthermore, it has been shown that pro-viral DNA can be detected in pDC cultured with X4 or R5 HIV, supernatants from infected pDC can infect CD4+ T lymphocytes [174]. Nonetheless, whether HIV infection of pDC occurs in vivo and causes cell death is still debated. Recent studies failed to detect efficient HIV replication, and consequent cell death, in purified pDC from healthy donors exposed to HIV, unless the cell were matured with CD40L [175]. Moreover Hardy et al demonstrated that both, infectious or inactivated HIV and IFNα have no cytopathic effect on pDC but rather induce metabolic activation and promote pDC survival [176]. Conversely, a study, conducted by Meyers et al, showed that pDC undergoes apoptosis when cultured in presence of HIV infected cell lines [177]. Additionally studies conducted in both humans and monkeys were not able to detect pDC markers in the lymph-nodes, arguing in favour of pDC depletion [178, 179]. In particular, Brown and colleagues showed a parallel loss of both mDC and pDC from blood and lymphoid tissue in simian AIDS [178]. Similarly Biancotto and co-workers reported a dramatic depletion of this cell subset in lymph nodes of HIV infected patients [179]. However, more recently, Sabado and colleagues provided direct in vivo evidence for the increase of pDC migration to secondary lymph nodes during primary HIV infection. In detail, the authors reported that both mDC and pDC rapidly decline during acute infection of HIV but those that remain in circulation keep their function, are able to induce allogeneic T cell responses, upregulate the expression of maturation markers (CCR7, associated with the migration to lymphoid tissues, CD40, and CD86 involved in the interaction with T cells) and produce different cytokine/chemokines (including IFNα) in response to stimulation with TLR7/8 agonists. The analysis of gene expression also confirmed the activation profile of pDC during HIV infection in vivo, suggesting a role for pDC in promoting chronic immune activation [180]. These data corroborate the well reported increase of IFNα, IDO activity and CCR7 expression following HIV-mediated pDC activation in vitro [145, 181, 182]. Furthermore, the two hallmarks of pDC activation IFNα and IDO activity can be measured in the serum of chronically infected individuals and in the lymphoid tissues during HIV/SIV infection [183-187]. The importance of chronic innate immune activation in the progression of disease during HIV infection is highlighted by studies on natural disease-resistant host of HIV/SIV. Thus, in the natural host of SIV (Sooty mangabeys or African green monkeys), infection does not results in simian AIDS despite the high level of viral load [164-166, 188-191]. In these animals the dynamics of the immune response follow a typical profile, with a transient activation of innate immune responses
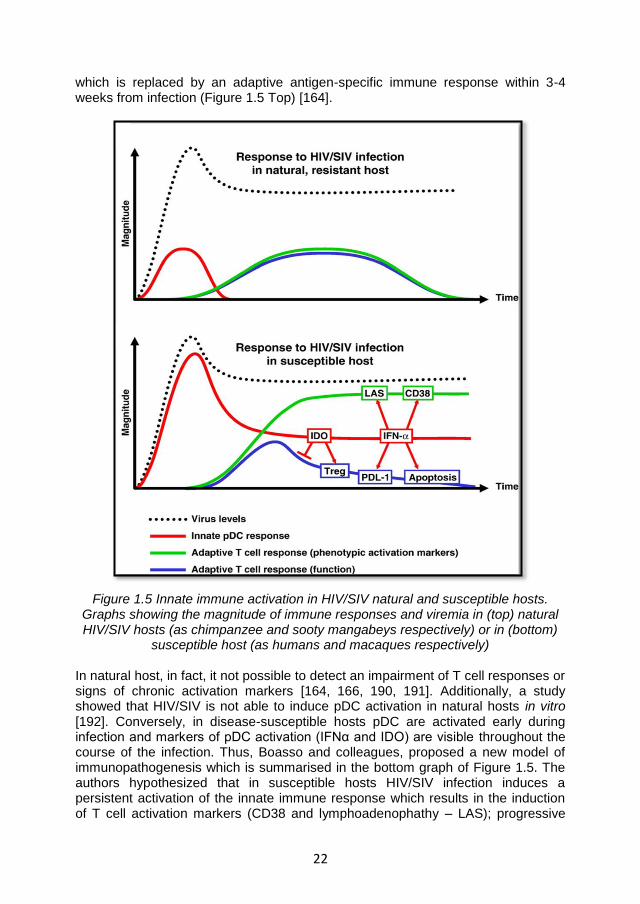
22
which is replaced by an adaptive antigen-specific immune response within 3-4 weeks from infection (Figure 1.5 Top) [164].
Figure 1.5 Innate immune activation in HIV/SIV natural and susceptible hosts. Graphs showing the magnitude of immune responses and viremia in (top) natural HIV/SIV hosts (as chimpanzee and sooty mangabeys respectively) or in (bottom)
susceptible host (as humans and macaques respectively)
In natural host, in fact, it not possible to detect an impairment of T cell responses or signs of chronic activation markers [164, 166, 190, 191]. Additionally, a study showed that HIV/SIV is not able to induce pDC activation in natural hosts in vitro [192]. Conversely, in disease-susceptible hosts pDC are activated early during infection and markers of pDC activation (IFNα and IDO) are visible throughout the course of the infection. Thus, Boasso and colleagues, proposed a new model of immunopathogenesis which is summarised in the bottom graph of Figure 1.5. The authors hypothesized that in susceptible hosts HIV/SIV infection induces a persistent activation of the innate immune response which results in the induction of T cell activation markers (CD38 and lymphoadenophathy – LAS); progressive
23
loss of T cell subsets due to apoptotic mechanisms; and functional T cell impairment through mechanisms mediated by IDO/Treg and programmed death ligand 1 (PDL1) [164]. When chronically activated by HIV, pDC can contribute to the detriment of the immune system and to the consequent progression of the disease in different ways. First, pDC continue to produce high amount of IFN I which has been shown to induce TRAIL-mediated apoptosis of CD4+ T cells in both HIV+ individuals and SIV+ macaques [193, 194]. IFN I has also been reported to enhance the expression of PDL1 on monocytes and T cells during HIV infection, thus favouring the induction of another mechanism which contributes to immune suppression [195]. Moreover IFN I upregulates T cell activation markers, such as CD69 and CD38 [196, 197]. CD38 expression, in particular is directly correlated with disease progression, showing a better prognostic value than plasma viremia [168]. Chronic activation of pDC may also contribute to HIV immunopathogenesis by increasing IDO activity, which mediates the suppression of T cell responses and the imbalance of the Th17/Treg equilibrium [182, 197, 198]. Different stimuli have been reported to contribute to IDO-mediated trp catabolism. The main ones include HIV virions as well as the viral accessory protein tat and nef, which upregulate IDO expression and activity in both pDC and macrophages. Similarly, the CTLA4/B7-mediated pathway stimulates the development of an IDO-dependent immunosuppressive phenotype in different cell subsets, including pDC and CD4+ T cells [199]. IDO+ pDC suppress both CD8 and CD4 T cell responses [199]; the importance of the immunosuppressive IDO activity during HIV infection, has been demonstrated in an animal model of HIV encephalitis, in which the inhibition of IDO by 1-methyl-D-tryptophan (1-MT) increases the generation of HIV-1-specific CTL and strongly reduces the frequency of HIV-1-infected monocyte-derived macrophages in the brain [200]. Interestingly, it has also been shown that IDO and CTLA4+ Treg co-localize in lymphoid tissues in both HIV+ individuals and SIV+ macaques, contributing to the impairment of antiviral immune responses [186, 187, 201-203]. The interplay between IDO and Treg suggested by Fallarino and colleagues [162, 163] (Section 1.2.1), may be enhanced during HIV infection [199]. Indeed, HIV directly induces Treg survival by interacting with CD4. At the same time, HIV promotes IDO expression in pDC and macrophages. Therefore HIV, IDO and Treg may interact with each other in a circle leading to inefficient antiviral responses characterized by the inability of T cell to respond to recall antigens, allo-antigens and mitogens [199]. Finally, a study performed in an SIV-macaque model showed that mucosal pDC contribute to recruit CD4+ T cells to the infection site through the production of CCR5+ cell-attracting chemokines. This phenomenon may be critical for the systemic spread of HIV in the host [204].
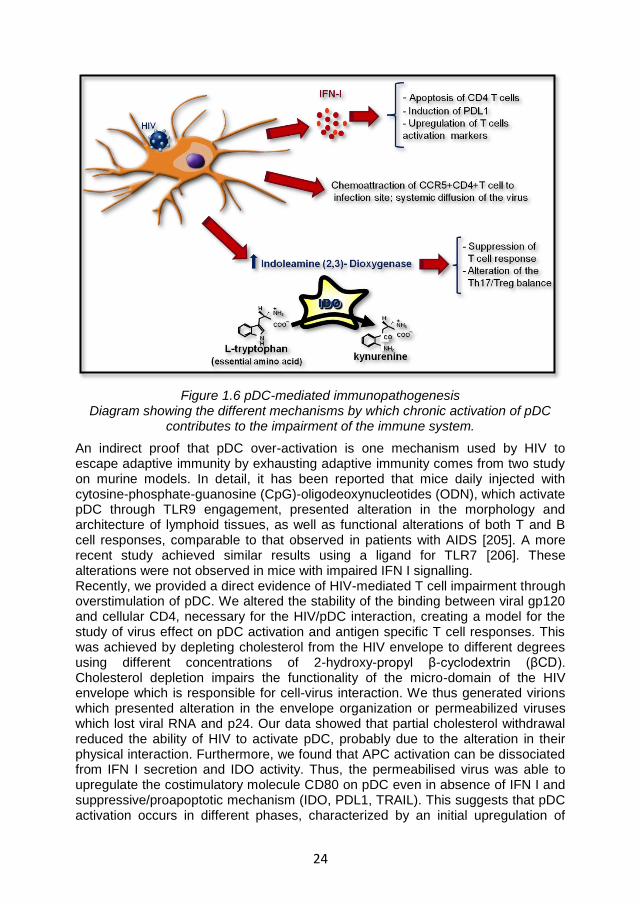
24
Figure 1.6 pDC-mediated immunopathogenesis Diagram showing the different mechanisms by which chronic activation of pDC
contributes to the impairment of the immune system.
An indirect proof that pDC over-activation is one mechanism used by HIV to escape adaptive immunity by exhausting adaptive immunity comes from two study on murine models. In detail, it has been reported that mice daily injected with cytosine-phosphate-guanosine (CpG)-oligodeoxynucleotides (ODN), which activate pDC through TLR9 engagement, presented alteration in the morphology and architecture of lymphoid tissues, as well as functional alterations of both T and B cell responses, comparable to that observed in patients with AIDS [205]. A more recent study achieved similar results using a ligand for TLR7 [206]. These alterations were not observed in mice with impaired IFN I signalling. Recently, we provided a direct evidence of HIV-mediated T cell impairment through overstimulation of pDC. We altered the stability of the binding between viral gp120 and cellular CD4, necessary for the HIV/pDC interaction, creating a model for the study of virus effect on pDC activation and antigen specific T cell responses. This was achieved by depleting cholesterol from the HIV envelope to different degrees using different concentrations of 2-hydroxy-propyl β-cyclodextrin (βCD). Cholesterol depletion impairs the functionality of the micro-domain of the HIV envelope which is responsible for cell-virus interaction. We thus generated virions which presented alteration in the envelope organization or permeabilized viruses which lost viral RNA and p24. Our data showed that partial cholesterol withdrawal reduced the ability of HIV to activate pDC, probably due to the alteration in their physical interaction. Furthermore, we found that APC activation can be dissociated from IFN I secretion and IDO activity. Thus, the permeabilised virus was able to upregulate the costimulatory molecule CD80 on pDC even in absence of IFN I and suppressive/proapoptotic mechanism (IDO, PDL1, TRAIL). This suggests that pDC activation occurs in different phases, characterized by an initial upregulation of
25
costimulatory molecules followed by induction of immunosuppressive mechanisms. Moreover, we showed that permeabilised, but not its intact counterpart, elicited memory CD8 T cell responses in HIV-exposed seronegative individuals, demonstrating that HIV directly inhibits antiviral T cell responses via pDC over-stimulation. We also proposed a double threshold model of pDC activation during viral infection. The first threshold, represented by upregulation of costimulatory molecules, is reached by basal stimulation. The second one is reached during acute infection, leading to full pDC activation, antiviral activity and promotion of primary T cell responses. Normally, pDC stimulation is rapidly reduced below the second threshold in order to maintain APC activity, thus favouring T cell responses and clearance or long term control of the infection. However, during HIV infection pDC activation is uncontrolled (preventing the contraction of the responses below the second threshold) thus undermining the preservation of memory T cell responses and promoting viral persistence [207]. Further details are available in Appendix 1.
1.3 ILT7 and BST2 interaction
1.3.1 ILT7
Immunoglobulin-like transcripts (ILT) are a superfamily of receptors which are differentially expressed on myeloid and lymphoid cell subsets. These receptors, also named leukocyte Ig-like receptors (LILR), or monocyte/macrophage Ig-like receptors (MIR), are encoded by genes mapping on human chromosome 19q13.4, in close linkage with cytogenetic loci for the KIR genes, the gene encoding for the Fc receptor for Igα (FcαR) and the one for leukocyte-associated inhibitory receptor (LAIR). All the ILT receptors present 2 or 4 homologous extracellular immunoglobulin (Ig)-like domains (C-2 type), but differ in the transmembrane and intracellular domains [208-210]. Thus, on the basis of the latter two, we can distinguish 3 main subsets of ILT receptors:
1. Inhibitory receptors (ILT2, ILT3, ILT4, ILT5 and LIR8), characterized by a long intracellular tail which presents 6-amino acid sequences known as immunoreceptor tyrosine-based inhibitory motifs (ITIMs). The consensus sequence for ITIM is (Ile/Val/Leu/Ser)-X-Tyr-X-X-(Leu/Val), where X indicates any amino acid. After the interaction with the ligand, the receptors cluster causing phosphorylation of tyrosine residues, usually by Src family kinases. Phosphorylated tyrosines form docking sites for Src homology 2 (SH2) domain-containing phosphatases such as SHP-1 and SHIP, which then transduce inhibitory signals [208-210].
2. Stimulatory receptors (ILT1, ILT1-like protein, ILT7, ILT8 and LIR6), characterised by a short cytoplasmic domain, thus lacking of the docking residues for the signal transduction. However, they present a positively charged arginine residue within the transmembrane domain, which allows the association of these receptors to the gamma chain of Fc receptors (FcRγ), containing immunoreceptor tyrosine-based activation motif
(ITAMs). Thus, in association with FcRγ, stimulatory ILT receptors
transduce signals by recruiting protein tyrosine kinases through ITAM (Tyr-X-X-Leu/Ile sequences spaced by 6-8 amino acids) [208-210].
3. Soluble receptors (ILT6), which lack of the transmembrane domain [208-210].
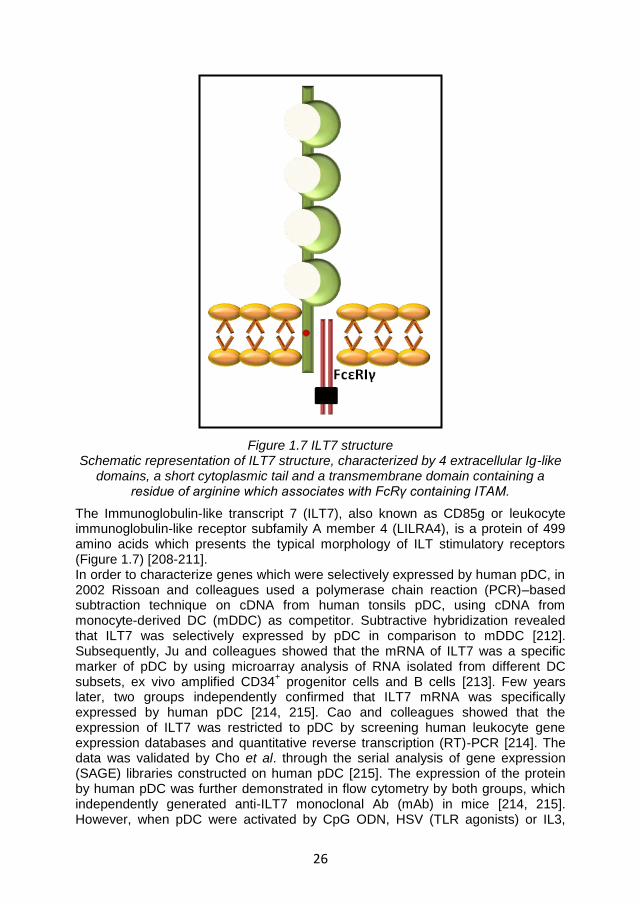
26
Figure 1.7 ILT7 structure Schematic representation of ILT7 structure, characterized by 4 extracellular Ig-like
domains, a short cytoplasmic tail and a transmembrane domain containing a residue of arginine which associates with FcRγ containing ITAM.
The Immunoglobulin-like transcript 7 (ILT7), also known as CD85g or leukocyte immunoglobulin-like receptor subfamily A member 4 (LILRA4), is a protein of 499 amino acids which presents the typical morphology of ILT stimulatory receptors (Figure 1.7) [208-211]. In order to characterize genes which were selectively expressed by human pDC, in 2002 Rissoan and colleagues used a polymerase chain reaction (PCR)–based subtraction technique on cDNA from human tonsils pDC, using cDNA from monocyte-derived DC (mDDC) as competitor. Subtractive hybridization revealed that ILT7 was selectively expressed by pDC in comparison to mDDC [212]. Subsequently, Ju and colleagues showed that the mRNA of ILT7 was a specific marker of pDC by using microarray analysis of RNA isolated from different DC subsets, ex vivo amplified CD34
+ progenitor cells and B cells [213]. Few years
later, two groups independently confirmed that ILT7 mRNA was specifically expressed by human pDC [214, 215]. Cao and colleagues showed that the expression of ILT7 was restricted to pDC by screening human leukocyte gene expression databases and quantitative reverse transcription (RT)-PCR [214]. The data was validated by Cho et al. through the serial analysis of gene expression (SAGE) libraries constructed on human pDC [215]. The expression of the protein by human pDC was further demonstrated in flow cytometry by both groups, which independently generated anti-ILT7 monoclonal Ab (mAb) in mice [214, 215]. However, when pDC were activated by CpG ODN, HSV (TLR agonists) or IL3,
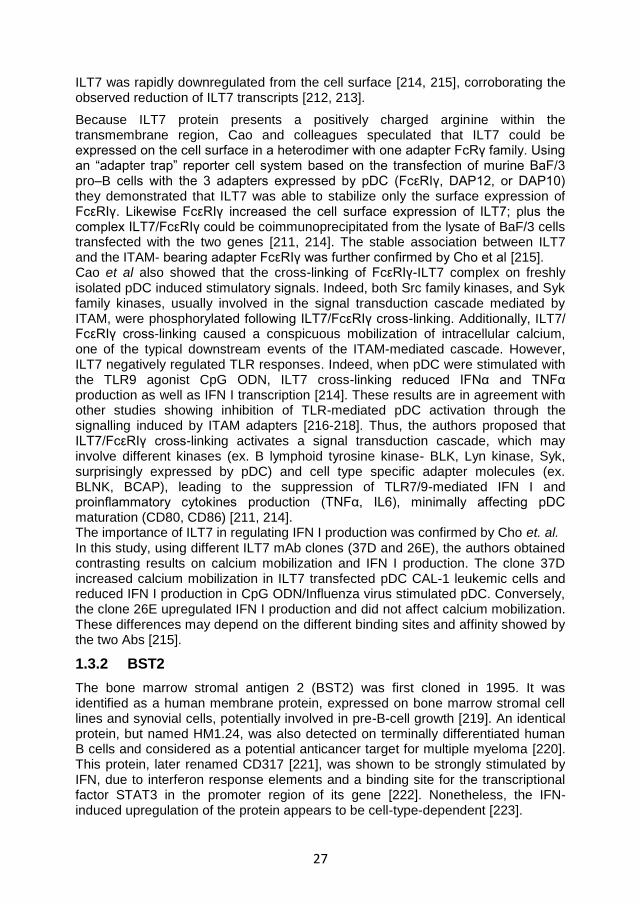
27
ILT7 was rapidly downregulated from the cell surface [214, 215], corroborating the observed reduction of ILT7 transcripts [212, 213].
Because ILT7 protein presents a positively charged arginine within the transmembrane region, Cao and colleagues speculated that ILT7 could be expressed on the cell surface in a heterodimer with one adapter FcRγ family. Using an “adapter trap” reporter cell system based on the transfection of murine BaF/3 pro–B cells with the 3 adapters expressed by pDC (FcεRIγ, DAP12, or DAP10) they demonstrated that ILT7 was able to stabilize only the surface expression of FcεRIγ. Likewise FcεRIγ increased the cell surface expression of ILT7; plus the complex ILT7/FcεRIγ could be coimmunoprecipitated from the lysate of BaF/3 cells transfected with the two genes [211, 214]. The stable association between ILT7 and the ITAM- bearing adapter FcεRIγ was further confirmed by Cho et al [215]. Cao et al also showed that the cross-linking of FcεRIγ-ILT7 complex on freshly isolated pDC induced stimulatory signals. Indeed, both Src family kinases, and Syk family kinases, usually involved in the signal transduction cascade mediated by ITAM, were phosphorylated following ILT7/FcεRIγ cross-linking. Additionally, ILT7/ FcεRIγ cross-linking caused a conspicuous mobilization of intracellular calcium, one of the typical downstream events of the ITAM-mediated cascade. However, ILT7 negatively regulated TLR responses. Indeed, when pDC were stimulated with the TLR9 agonist CpG ODN, ILT7 cross-linking reduced IFNα and TNFα production as well as IFN I transcription [214]. These results are in agreement with other studies showing inhibition of TLR-mediated pDC activation through the signalling induced by ITAM adapters [216-218]. Thus, the authors proposed that ILT7/FcεRIγ cross-linking activates a signal transduction cascade, which may involve different kinases (ex. B lymphoid tyrosine kinase- BLK, Lyn kinase, Syk, surprisingly expressed by pDC) and cell type specific adapter molecules (ex. BLNK, BCAP), leading to the suppression of TLR7/9-mediated IFN I and proinflammatory cytokines production (TNFα, IL6), minimally affecting pDC maturation (CD80, CD86) [211, 214]. The importance of ILT7 in regulating IFN I production was confirmed by Cho et. al. In this study, using different ILT7 mAb clones (37D and 26E), the authors obtained contrasting results on calcium mobilization and IFN I production. The clone 37D increased calcium mobilization in ILT7 transfected pDC CAL-1 leukemic cells and reduced IFN I production in CpG ODN/Influenza virus stimulated pDC. Conversely, the clone 26E upregulated IFN I production and did not affect calcium mobilization. These differences may depend on the different binding sites and affinity showed by the two Abs [215].
1.3.2 BST2
The bone marrow stromal antigen 2 (BST2) was first cloned in 1995. It was identified as a human membrane protein, expressed on bone marrow stromal cell lines and synovial cells, potentially involved in pre-B-cell growth [219]. An identical protein, but named HM1.24, was also detected on terminally differentiated human B cells and considered as a potential anticancer target for multiple myeloma [220]. This protein, later renamed CD317 [221], was shown to be strongly stimulated by IFN, due to interferon response elements and a binding site for the transcriptional factor STAT3 in the promoter region of its gene [222]. Nonetheless, the IFN-induced upregulation of the protein appears to be cell-type-dependent [223].
28
Only recently, BST2 has been identified as a new element of the innate immune response to enveloped viruses. The first indication of its antiviral activity came from a study which suggested that BST2 is targeted by the viral ubiquitin-ligase K5 of Kaposi’s sarcoma-associated herpes virus (KSHV) [224]. However, its role as proper host restriction factor (host defence proteins that directly inhibit viral replication) was demonstrated in 2008 when the ability of BST2 to inhibit the release of Vpu-defective HIV particles was shown [225, 226]. Thus, BST2 was renamed Tetherin because of its ability to tether nascent HIV-1 particles to the cell surface [225, 226]. It is now well known that Tetherin inhibits the release of different enveloped viruses by targeting the host cell-derived lipid bilayer [227].
In the present dissertation the term BST2 will be used to indicate the protein known as BST2, HM1.24, CD317 or Tetherin protein.
In humans, BST2 is encoded by a single copy of the bst-2 gene located on chromosome 19p13.2 [219, 228]. BST2 orthologues have been found in placental mammals [228]. Several cell types, such as monocytes/macrophages, B cells, T cells, pDC and cancer cell lines constitutively express BST2 [228, 229].
Figure 1.8 BST2 structure Schematic representation of BST2 monomer, characterized by a short cytoplasmic
tail and a transmebrane, an extracellular coil-coled domain and a GPI anchor
BST-2 is an atypical type II transmembrane protein which localizes to the lipid rafts of the plasma membrane, to the trans-Golgi network (TGN) and to early and recycling endosomes. It is characterized by a short N-terminus intracellular domain, a transmembrane region, an ectodomain (which forms coiled coil in BST2 dimers) and an extracellular C-terminus modified by a glycosyl phosphatidyl inositol (GPI) membrane anchor (Figure 1.8). The particular BST2 topology determines its antiviral activity. The double anchor is involved in the inhibition of viral particle release, possibly because one of the anchor is inserted in the cellular membrane whilst the other in the viral membrane; Three extracellular cysteines (C53, C63, C91) mediate disulphide bonds, resulting in the formation of BST2 dimers; alterations in this 3 residues has been shown to prevent dimer formation, reducing BST2 antiviral properties. The intracellular tail induces BST2 endocytic recycling, interacting with clathrin adaptors AP1 and AP2. In polarized epithelial cells,
29
instead, this cytoplasmic tail connects BST2 to subapical cortical actin filaments [227, 230]. BST2 is incorporated in the newly formed virions during HIV budding. However, the exact mechanism by which BST2 retains the virions on the cellular membrane is still unclear. Different models have been proposed. Biochemical and structural evidences suggest that parallel BST2 dimers form physical cross-links between either the cellular and viral membrane or the membranes of other virions thanks to the dual anchor, thus promoting the accumulation of virions on the cell surface and the consequent endocytic uptake, which potentially leads to the degradation of the viruses [227, 231]. In primates, the immunodeficiency viruses HIV-1, HIV-2 and SIV encode viral proteins which counteract BST2 activity. These proteins are Vpu, Env and Nef for HIV-1, HIV-2 and SIV, respectively [227]. Vpu is a 16 kDa protein translated from a Rev-dependent vpu–env bicistronic viral mRNA. Because it is translated during the late stage of HIV-1 infection, Vpu was originally thought to be carried into mature virions. However, studies investigating the presence of Vpu in cell-free virus have given contrasting results. Vpu consists of a 27 amino acid transmembrane domain at the N terminus, followed by a 54 amino acid intracellular region consisting of two α-helices [231]. The crystal structure of Vpu has not yet been deciphered; different biochemical and genetic evidence lead to the hypothesis that the transmembrane domain may be critical for Vpu multimerisation in order to form ion channels. However, the role played by the ion channel in the antiviral function of Vpu is still unclear [232]. Vpu is well known for its ability to downregulate CD4 expression on the endoplasmic reticulum, preventing the premature binding of viral gp160 with CD4. In particular, the intracellular tail of Vpu recruits the β-transducin repeat containing protein (β-TrCP), that is part of the E3 ubiquitin ligase complex, promoting polyubiquitination and proteasomal degradation of CD4 [233].
Through the interaction of the respective transmembrane domains, Vpu has been shown to downregulate BST2 from the plasma membrane. Similar to the mechanism of CD4 downregulation, Vpu recruits β-TrCP promoting the proteasomal degradation of BST2. Several studies also suggested that Vpu may induce lysosomal degradation of BST2, promoting the retention of the protein in the endolysosomal system. Finally, different studies reported that the inhibition of BST2 antiviral activity is achieved by Vpu even if BST2 is not degraded. Thus, the sequestration of BST2 to the endosomal compartment may be sufficient to withdraw BST2 from the plasma membrane where its activity is exerted. This may occur through trapping of newly synthesized BST2 proteins within the TGN or by preventing the return of endocytosed proteins to the cellular surface [228, 231].
Despite the important role of BST2 in preventing virus release, it seems unlikely that the only function of BST2 is related to its activity as host restriction factor. Recently, BST2 has been discovered as the natural ligand of ILT7, suggesting its possible involvement in the regulation of the innate immune response [234]. The scientific steps leading to this discovery and the importance of the pathway mediated by the interaction between BST2 and ILT7 will be discussed in the next section.
30
1.3.3 ILT7 and BST2 interaction.
In 2009 Cao and co-workers showed that the biological ligand for ILT7 is not a member of the MHC class I molecules, and rather corresponds to the host restrictor factor BST2. In this study, the authors co-cultured ILT7 reporter cell lines with different human breast carcinoma cell lines and several other cancer cell lines, in order to identify one or more ILT7 ligands (ILT7L). They found that T47D breast cancer line was the most efficient in triggering ILT7. Thus, they used the T47D-ILT7L+ cell line, plus the ILT7L- breast cancer line MDA- MB-231, to immunize mice, obtaining different hybridoma clones secreting mAbs able to bind exclusively to T47D cells. The screening of these clones on the basis of their ability to prevent the T47D-mediated ILT7 reporter activation lead to the identification of two mAbs clones which recognise ILT7L: 26F8 (IgG1) and 28G4 (IgG2a)[234]. A subsequent cDNA library screening revealed that both the mAbs were able to bind the BST2 protein. Additionally the researchers provided 3 main evidences in support of the idea that BST2 is ILT7 ligand [211, 234]:
1. The recombinant (r) ILT7 molecule was able to directly and exclusively engage rBST2- glutathione-S-tranferase (GST) fusion protein in a dose-dependent manner. Plus BST2-Fc/ILT7-Fc interaction presented an affinity of approximately 10
-6M, by surface plasma resonance measurement, and
was totally neutralized by 26F8 mAb. 2. rBST2-GST fusion protein was able to induce a vigorous activation of ILT7
reporter cells through BST2/ILT7 direct interaction 3. BST2 on HEK293 promoted the expression of GFP only in ILT7 NFAT-
GFP reporter cells and not in ILT7 negative reporter cells. Moreover, this effect was inhibited by blocking ILT7 or BST2 using specific antibodies.
Once determined that BST2 was able to bind ILT7, Cao and colleagues verified weather BST2/ILT7 interaction was able to mediate the biological effects observed following ILT7 cross-linking. First, they reported that rBST2 protein promoted calcium mobilization in primary pDC via an ITAM-mediated pathway, similar to what observed with anti-ILT7 mAb. Moreover, pDC stimulated with CpG ODN or influenza virus showed a reduction in the TLR7/9- mediated production of IFNα and TNFα when they were pre-incubated with plate-bound rBST2-Fc protein. A similar reduction was observed in the transcription of IFN I subtypes and IL6. Conversely, BST2 did not cause any change in the expression of co-stimulatory markers (CD80 and CD86). Additionally the authors showed that, when co-cultured with HEK293 cell expressing HA-tagged BST2, pDC stimulated with influenza virus produced less IFNα. Thus, BST2 interaction with ILT7 appeared to modulate TLR-mediated IFN I production by pDC [234]. Finally, corroborating the data in the literature [222, 223], an increase of BST2 on the surface of different cell lines (embryonic kidney, dermal fibroblast, umbilical vein endothelial and keratinocytes cell lines) was observed when the cells were treated with IFNα. Conversely, despite the high levels of BST2 transcripts, freshly isolated or TLR- stimulated pDC presented low levels of the protein. By transducing ILT7 and FcεRIγ in human Burkitt lymphoma cell lines, which express endogenous BST2, Cao et al. found that ILT7 and BST2 can also interact in cis, causing BST2 internalization [234].

31
Taken together these results suggest that BST2 induces ILT7 cross-linking in pDC, thereby activating a negative regulatory pathway which suppresses TLR-mediated production of IFN I and pro-inflammatory cytokines.
The negative feedback mediated by BST2 and ILT7 may be very important in the regulation of the immune response. Numerous disorders have been associated with an alteration of pDC activation and IFN I production. These include autoimmune diseases such as systemic lupus erythematosus and psoriasis, and chronic infections such as HIV, in which prolonged pDC activation and IFN I production have been observed [211, 235-237]. Moreover, pDC have been detected in several tumours where they can interact with cancer cells [211]. In breast cancer, for example, pDC infiltrates correlate with the progression of the disease. Thus, IFNα is known to inhibit the growth of primary tumours, however infiltrating pDC in breast cancer secrete less IFN in response to TLR agonists, [211, 238, 239], which may directly depend on BST2/ILT7 signalling. Concurrently, BST2 expression in cancer may contribute to the tumour invasion, as a consequence of NFkB induction [211].
Thus the dynamics and consequences of ILT7/BST2 interaction during innate immune responses need to be further investigated to determine the role and importance of this system in chronic conditions. In the present research work, the ILT7/BST2 negative feedback will be analysed in relation to HIV infection.

32
33
2 HYPOTHESIS AND AIMS
The persistent activation of pDC can paradoxically lead to harmful consequences for the immune system in both murine models [205, 206] and humans [153, 159, 164, 240]. In particular, during HIV-1 infection, pDC play an essential role in the transition between the acute and the chronic phase of the infection [164].
We hypothesise that upon activation, pDC produce high levels of IFN-I which may induce BST2 expression in surrounding cells. BST2 may then interact with ILT7-expressing pDC causing downregulation of IFN-I and return to the original resting condition, thereby providing a negative feedback for pDC activation. Alterations of these mechanisms may drive HIV-induced pDC over-activation.
Accordingly, the specific aims of this project are: 1. to test whether BST2/ILT7 expression in peripheral blood mononuclear
cells (PBMC) correlates with HIV- or TLR7/9L-mediated pDC activation; 2. to investigate which stimuli (pro or anti-inflammatory) can influence BST2
expression and modulate IFN-α production by PBMC 3. to evaluate whether pDC activation in response to HIV-1 and TLR7/9L is
directly modulated by BST2-expressing cells in vitro.
The finding of the present work are described and discussed in the Chapter 4, while conclusion and future works are presented in Chapter 5.

34
35
3 MATERIALS AND METHODS
3.1 Cell culture media and buffers
PBMC and pDC culture media (CM) consisted of RPMI 1640 (PAA Laboratories, UK) supplemented with 10% heat inactivated foetal bovine serum (FBS) (Sigma-Aldrich, Poole, UK) and 1% Penicillin-Streptomycin and 1% L-Glutamine (Sigma-Aldrich).
293T cells culture medium (293T-CM) consisted of Dulbecco’s modified Eagle’s medium (DMEM) high glucose (PAA) supplemented with 10% FBS and 1% Penicillin-Streptomycin.
293T transfected cells culture medium (293T/ts-CM) consisted of 293T-CM supplemented with Hygromycin B (Invitrogen, Paisley, UK) diluted 1:500.
FACS buffer was purchased from BD bioscience, Oxford, UK.
MACS buffer consisted of phosphate-buffered saline (PBS) (PAA Laboratories) with 2 mM ethylenediamine tetra-acetic acid (EDTA) (Invitrogen) and 2% FBS.
50% Percoll gradient solution was prepared according to the following steps: 1) A Percoll mix solution was prepared by mixing 60 ml of 10x PBS with 176 ml of sterile distilled water (Sigma-Aldrich) 2) A 70% Percoll solution was made by adding 145 ml of Percoll (Sigma-Aldrich) to 85 ml of Percoll mix. 3) A 50% Percoll solution was prepared by adding 107 ml of 70% Percoll to 43 ml of Hanks balanced salt solution (Sigma-Aldrich).
3.2 Samples
PBMC were isolated from blood samples obtained from healthy donors, aged 20 - 40 years old, after informed consent. Blood samples were collected in Vacutainer blood collection tubes (BD biosciences, Oxford, UK) containing Heparin as anticoagulant. Alternatively, PBMC were recovered from leukoreduction system chambers (LRSCs) of Trima Accel aphaeresis devices (Gambro BCT, Lakewood, CO) after routine donor plateletpheresis procedure [241]. LRSCs held approximately (1.88 ± 0.40) x10
9 fully functional and viable PBMC [242].LRSCs
were purchased from the North London Blood Transfusion Service (London, UK). The two source of PBMC were indiscriminately use for all the experiments as no significant differences were observed between them.
3.3 Mononuclear leukocytes isolation and culture
PBMC were separated from whole blood or LRSCs by density gradient centrifugation. Thus, whole blood obtained from healthy donors was diluted 1:3 in PBS; blood obtained from LRSCs, instead, was diluted 1:15 in PBS supplemented with 2% FBS, because as consequence of the plateletpheresis procedure the blood is more concentrated and free of serum. Subsequently, 35 ml of the diluted blood were under laid with 10 ml of Histopaque 1077(LSM; PAA laboratories) and centrifuged at 895 Relative Centrifuge Force (RCF) for 20 minutes with no brake. PBMC formed an opaque interface between the Histopaque 1077 layer and the plasma (Figure 3.1).
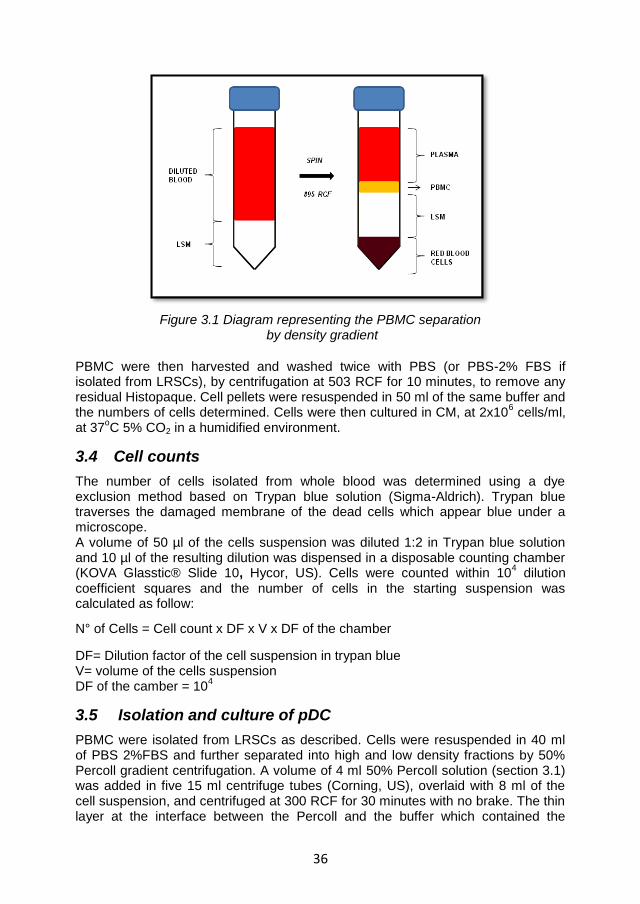
36
Figure 3.1 Diagram representing the PBMC separation by density gradient
PBMC were then harvested and washed twice with PBS (or PBS-2% FBS if isolated from LRSCs), by centrifugation at 503 RCF for 10 minutes, to remove any residual Histopaque. Cell pellets were resuspended in 50 ml of the same buffer and the numbers of cells determined. Cells were then cultured in CM, at 2x10
6 cells/ml,
at 37oC 5% CO2 in a humidified environment.
3.4 Cell counts
The number of cells isolated from whole blood was determined using a dye exclusion method based on Trypan blue solution (Sigma-Aldrich). Trypan blue traverses the damaged membrane of the dead cells which appear blue under a microscope. A volume of 50 µl of the cells suspension was diluted 1:2 in Trypan blue solution and 10 µl of the resulting dilution was dispensed in a disposable counting chamber (KOVA Glasstic® Slide 10, Hycor, US). Cells were counted within 10
4 dilution
coefficient squares and the number of cells in the starting suspension was calculated as follow:
N° of Cells = Cell count x DF x V x DF of the chamber
DF= Dilution factor of the cell suspension in trypan blue V= volume of the cells suspension DF of the camber = 10
4
3.5 Isolation and culture of pDC
PBMC were isolated from LRSCs as described. Cells were resuspended in 40 ml of PBS 2%FBS and further separated into high and low density fractions by 50% Percoll gradient centrifugation. A volume of 4 ml 50% Percoll solution (section 3.1) was added in five 15 ml centrifuge tubes (Corning, US), overlaid with 8 ml of the cell suspension, and centrifuged at 300 RCF for 30 minutes with no brake. The thin layer at the interface between the Percoll and the buffer which contained the
37
monocyte/DC enriched fractions, were harvested and washed twice in 10 ml MACS buffer (section 3.1) by centrifuging at 1500 rpm for 10 minutes, to remove any residual Percoll. Plasmacytoid DC were then magnetically isolated from the above fraction using a CD304 (BDCA-4/Neuropilin-1) MicroBead kit (Miltenyi Biotec, Germany) in accordance with the manufacturer’s protocol. Thus, the monocyte/DC enriched fraction pellet was resuspended in 300 µl of MACS buffer per 10
8 total
cells. A volume of 100 µl of FcR blocking reagent and an equivalent volume of BDCA-4 microbeads (Miltenyi Biotec) were added to the cell suspension and incubated for 15 minutes at 4
oC. Cells were washed in MACS buffer and
centrifuged at 300 g for 10 minutes (MSE Mistral 3000i). The pellet was resuspended in 500 µl of MACS buffer and added to an LS column (Miltenyi Biotec) pre-washed with MACS buffer and installed on a magnetic support. Cells were allowed to flow through the columns, which were then washed 3 times with 3ml of MACS buffer. Plasmacytoid DC retained in the column were eluted by removing the column from the magnetic field and flushing with 5 ml of buffer. This cell fraction was then passed through a pre-washed MS column (Miltenyi Biotec) to increase cell purity. This purified pDC fraction was eluted by removing the column from the magnetic field and flushing with 1 ml of CM. Isolated pDC were counted and used for the co-culture experiment with 293T cells described in the Results and Discussion chapter and in Section 4.3.6.2.
3.6 Cell lines: description and culture
pDC-293T cell co-culture and BST2 antibody affinity experiments, described in the Results and Discussion Chapter and in Section 4.3.6.2 and 4.3.5. respectively, were conducted using human embryonic kidney (HEK) 293T cell lines (from now on referred to as 293T cells for simplicity) kindly donated by Dr. Stuart Neil (King’s College, London, UK). We used 293T cells (CTRL) or 293T cells that were stably transfected (ts) with the human wild-type bst2 gene (BST2-293T) or bst2 bearing mutations in the extracellular coiled-coil region (L123P), in the extracellular anchor (ΔGPI), in the dimerisation site (3CA) or in the intracellular region (Y6,8A and 10-12A). 293T wt and 293T ts cells were cultured in 75 mm
2 flask (for maintenance) or
24/48 well cell culture cluster plates (for the experiments) in 293T-CM and 293T/ts-CM respectively. Cells were maintained in culture at 37
oC supplemented with 5%
CO2 in a humidified environment. Cells cultured in flasks were passaged two to three times a week depending on their confluence. During each passaging step, adherent 293T cells were washed twice with 5 ml of PBS; then treated with 2ml of the serin-protease Trypsin (Invitrogen) for 3 minutes at 37
oC, to allow cells to
disassociate from the plastic surface of the flask. When cells were detached, Trypsin was inactivated by adding 8 ml of the appropriate culture media. A volume of 2 ml of the suspension was then added into a new flask and cells were maintained in culture adding 8 ml of fresh 293T-CM or 293T/ts-CM. The cell lines were maintained in culture throughout the course of experiments and stored in liquid nitrogen when not needed.
3.7 Cryogenic storage of 293T cell lines
293T cells were trypsinised, washed twice in 293T-CM, counted and resuspended, at a concentration of 4x10
6 cells/ml, in FBS containing 10% dimethylsulphoxide
(DMSO, Sigma Aldrich). The cell suspension was then aliquoted into cryovials
38
(Fisher Scientific, UK). The cryovials were placed in a Nalgene cryofreezing container (Jencons, Leighton Buzzard, UK) containing 2-isopropanol (Sigma Aldrich) which was then placed in a -80
oC freezer overnight (o/n). The cryovials
were finally transported in dry ice and placed into liquid nitrogen for long term storage. Recovery of the cells was achieved by rapid thawing in a 37
oC water bath. Warm
293T-CM was then added in a drop-wise fashion. Cells were washed twice in the 293T-CM and resuspended in 293T-CM. Cells were then plated in 25 mm
2 flask
(Corning). When cells reached confluence, they were passaged in the 75 mm2
flask and cultured in the appropriated media (293T-CM or 293T/ts-CM).
3.8 Stimulation of PBMC
PBMC were cultured in presence or absence of specific stimuli for different periods of time, depending on the experimental setting, as described in the Results and Discussion Chapter.
3.8.1 Stimulation of PBMC with TLRs agonist and HIV
The TLR9 ligand (TLR9L) CpG ODN type A (InvivoGen, San Diego, CA, USA) was tested at different concentration (0.025-7.5 μM) and used at 0.75 µM final concentration.
The TLR7 ligand (TLR7L) R848 (Imiquimod; InvivoGen) was tested at different concentrations (0.16-5 μg/ml) and used at 5 µg/ml final concentration.
HIV-1MN/CEMx174 was originally obtained from the AIDS and Cancer Vaccine Program (SAIC-NCI at Frederick).HIV-1MN was inactivated with aldrithiol-2 (AT-2) as previously described by Rossio JL and colleagues [243] and kindly donated by Dr. D.Graham. AT-2 is an oxidizing reagent that renders HIV reverse transcription-deficient, thereby eliminating the infectivity of HIV while preserving its structure and ability to activate innate and adaptive immunity [243]. AT-2 HIV was tested at different concentration (3-1000 ng/ml p24 equivalents) and it was added to PBMC cultures at 100 ng/ml p24 equivalents final concentrations.
3.8.2 Stimulation of PBMC with cytokines
PBMC were stimulated for 2 hours by pre-incubation with the following cytokines: IFNγ, IL10, TNFα (all from Miltenyi Biotec) and IL-4 (R&D Systems, Abingdon, UK). TNFα and IL10 were used at 10 ng/ml final concentration, whereas IFNγ and IL4 were used at 1000 U/ml final concentrations.
3.8.3 Stimulation of PBMC with T cell receptor agonists
The CD3-specific antibody (Ab) HIT3a (BD biosciences, Oxford, UK) was used at 1 µg/ml final concentration as a mitogenic stimulus for T cells.
The CD28-specifc antibody CD28.2 (BD biosciences) was used as a control (1 µg/ml final concentration).
3.8.4 Stimulation of PBMC with anti-IFNI Receptor
Anti-Human Interferon Alpha/Beta Receptor Chain 2 (IFNAR2), Clone MMHAR-2 (PBL Interferonsource, Piscataway, NJ, USA) was used at 10 µg/ml final concentration.
39
3.8.5 Stimulation of PBMC with soluble BST2-GST fusion protein
Soluble BST2-GST fusion protein (Abnova, Taipei city, Taiwan) was used at 5 µg/ml final concentration.
Soluble Glyceraldehyde-3-phosphate dehydrogenase (GAPDH)-GST fusion protein (Abnova, Taipei city, Taiwan) was used as control (5 µg/ml final concentration)
3.9 ILT7 cross-linking and BST2 blockade
The effects of BST2 blockade and ILT7 cross-linking were tested using an anti/blocking-BST2 monoclonal antibody (αBST2 mAb; clone 26F8 eBioscience, California, USA) and a cross linking-ILT7 mAb (XL-ILT7, clone 17G10.2 eBioscience). PBMC were incubated with XL-ILT7 mAb at 10 μg/ml final concentration or with the αBST2 mAb at 1.25 µg/ml, 5 μg/ml or 10 μg/ml final concentration for 30 minutes before stimulation with TLR7/9L or AT-2 HIV. After o/n incubation the quantity of IFNα was evaluated by an immune-enzymatic assay as describe in Section 3.10
3.10 Enzyme-Linked Immunoabsorbent Assay (ELISA)
The levels of IFNα in cell culture supernatants were quantified by human IFNα multi subtype ELISA kit (PBL Interferonsource) following the manufacturer’s instruction. The kit is based on an ELISA with anti-secondary antibody conjugated to horseradish peroxidase (HRP) and Tetramethyl-benzidine (TMB) is the substrate. All the reagents, buffers antibodies and substrate, necessary to develop the assay, are included in the kit. Briefly, volumes of 100 μl of Human IFNα Standards, Samples (supernatants diluted 1:5 in the Dilution Buffer) and Blanks (Dilution Buffer alone) were plated in duplicate in the wells of a Pre-coated microtiter plate. The plate was then covered and incubated for 1 hour at room temperature. At the end of the incubation the contents of the plate were emptied and wells were washed one time with diluted Wash Buffer, using an automated plate washer (Asys Atlantis microplate washer, Biochrom, US). A volume of 100 μl of diluted antibody solution was then added to each well; the plate was covered and incubated for another hour at room temperature. After the incubation the contents of the plate were emptied and the wells washed 3 times with diluted Wash Buffer. A volume of 100 μl of diluted HRP solution was then added to all wells; the plate was covered and incubated for 1 hour at room temperature. At the end of the incubation the contents of the plate were emptied and the wells washed 4 times with diluted Wash Buffer. A volume of 100 μl of TMB substrate was finally added to the wells and the plate incubate in the dark for 15 minutes. A volume of 100 μl of STOP solution was then added to each well and the plate was read within 5 minutes using a microplate reader (Anthos microplate reader Biochrom, USA) set at 450 nm absorbance. Interferon titer (pg/ml) was calculated by plotting the optical densities (OD) using a 4-parameter fit for the standard curve.
3.11 Tryptophan and kynurenine measurement
Tryptophan and kynurenine were detected in culture supernatants using high performance liquid chromatography (HPLC) [244]. Volumes of 400 μl of
40
supernatants were frozen at -80ºC and shipped overnight in dry ice to the Innsbruck Medical University, Austria where the experiments were performed by Prof. Dietmar Fuchs and collaborators.
3.12 Phenotypic analysis
The surface phenotypic analysis was performed using anti-human monoclonal antibodies purchased from the following companies: eBioscience (Hatfield, UK), Biolegend (London, UK), BD Bioscience (Oxford, UK), or Miltenyi Biotec (Germany). The antibodies used are listed in the Table 3.1.
Cells were incubated for 20 min at room temperature with 3 µl of appropriate fluorochrome-conjugated antibodies according to the gating strategies described in the Result and Discussion Chapter. Cells were washed twice with 2 ml of staining buffer (BD Bioscience) and fixed with 200 μl of 1X BD cytofix buffer (BD Bioscience). FACS analysis was performed on an LSR-II flow cytometer using FACSDiva software (BD Bioscience). FlowJo software (Treestar, Ashland, OR) was used for data analysis. Fluorescence minus one (FMO) controls were used to establish positivity thresholds.
3.13 BST2 staining of IFNα- treated 293T-wt and 293T-ts cells
To verify the specificity of the 26F8 antibody for BST2, we used PE-conjugated 26F8 (Table 3.1) to stain confluent 293T cells which had been treated or not with 1 ng/ml of universal type I IFN (PBL Interferonsource) overnight and 293T cells which were stably transfected with the human wild-type bst2 gene or bst2 bearing mutations as described in section 3.6. Cells were cultured in 24 well cell culture plates until confluence in 293T-CM (293T wt) or 293T/ts-CM (293T ts). Confluent cells were treated with 200 µl of trypsin (Invitrogen) and washed twice. Staining and flow cytometry analysis were performed as described in Section 3.12.
3.14 pDC and 293T cell co-cultures
To test whether ILT7/ BST2 interaction may be induced in vitro, we set up a co-culture experiment between pDC and BST2-293T cells, using pDC alone and 293T wt as controls. BST2-293T and 293T wt cells were cultured in 250 µl of 293T-CM, in 48 well cell culture plates, until confluence. pDC were isolated as described in section 3.5 and resuspended in CM. A volume of 250 µl of the pDC suspension was then added to the 293T confluent cultures. The co-cultures (or the pDC alone) were then stimulated with TLR9L in the presence or absence of anti- BST2 blocking Ab as described in the Results and Discussion chapter. An IgG1 Isotype Ab was used as control for 26F8. After o/n incubation cell supernatants were collected and the IFNα levels were measured as described in Section 3.10
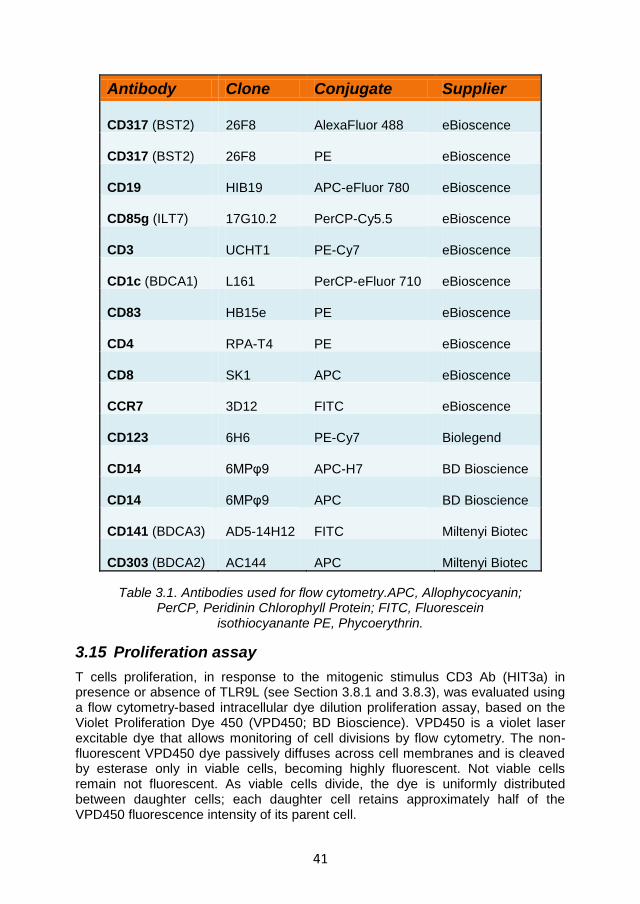
41
Antibody Clone Conjugate Supplier
CD317 (BST2) 26F8 AlexaFluor 488 eBioscence
CD317 (BST2) 26F8 PE eBioscence
CD19 HIB19 APC-eFluor 780 eBioscence
CD85g (ILT7) 17G10.2 PerCP-Cy5.5 eBioscence
CD3 UCHT1 PE-Cy7 eBioscence
CD1c (BDCA1) L161 PerCP-eFluor 710 eBioscence
CD83 HB15e PE eBioscence
CD4 RPA-T4 PE eBioscence
CD8 SK1 APC eBioscence
CCR7 3D12 FITC eBioscence
CD123 6H6 PE-Cy7 Biolegend
CD14 6MPφ9 APC-H7 BD Bioscience
CD14 6MPφ9 APC BD Bioscience
CD141 (BDCA3) AD5-14H12 FITC Miltenyi Biotec
CD303 (BDCA2) AC144 APC Miltenyi Biotec
Table 3.1. Antibodies used for flow cytometry.APC, Allophycocyanin; PerCP, Peridinin Chlorophyll Protein; FITC, Fluorescein
isothiocyanante PE, Phycoerythrin.
3.15 Proliferation assay
T cells proliferation, in response to the mitogenic stimulus CD3 Ab (HIT3a) in presence or absence of TLR9L (see Section 3.8.1 and 3.8.3), was evaluated using a flow cytometry-based intracellular dye dilution proliferation assay, based on the Violet Proliferation Dye 450 (VPD450; BD Bioscience). VPD450 is a violet laser excitable dye that allows monitoring of cell divisions by flow cytometry. The non-fluorescent VPD450 dye passively diffuses across cell membranes and is cleaved by esterase only in viable cells, becoming highly fluorescent. Not viable cells remain not fluorescent. As viable cells divide, the dye is uniformly distributed between daughter cells; each daughter cell retains approximately half of the VPD450 fluorescence intensity of its parent cell.
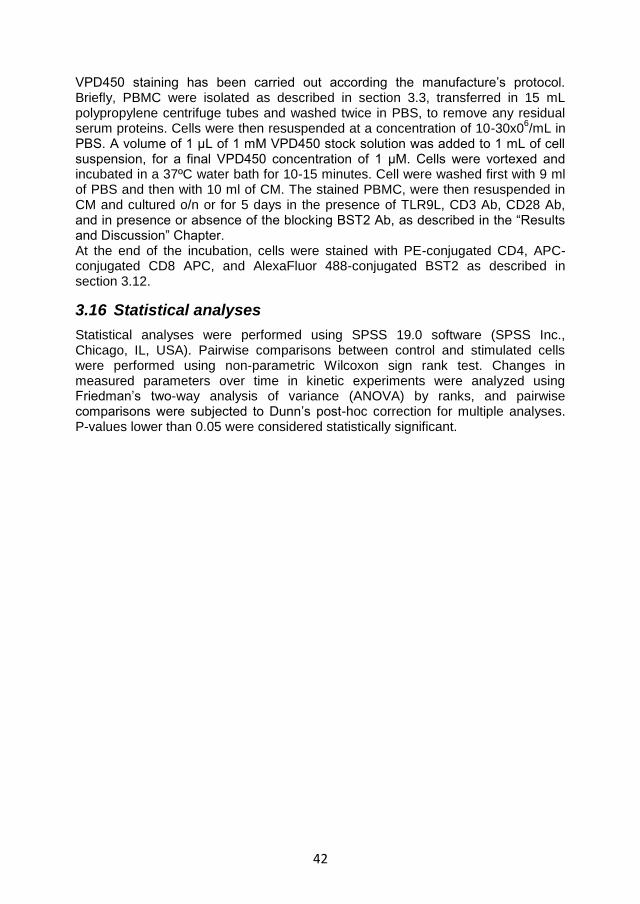
42
VPD450 staining has been carried out according the manufacture’s protocol. Briefly, PBMC were isolated as described in section 3.3, transferred in 15 mL polypropylene centrifuge tubes and washed twice in PBS, to remove any residual serum proteins. Cells were then resuspended at a concentration of 10-30x0
6/mL in
PBS. A volume of 1 μL of 1 mM VPD450 stock solution was added to 1 mL of cell suspension, for a final VPD450 concentration of 1 μM. Cells were vortexed and incubated in a 37ºC water bath for 10-15 minutes. Cell were washed first with 9 ml of PBS and then with 10 ml of CM. The stained PBMC, were then resuspended in CM and cultured o/n or for 5 days in the presence of TLR9L, CD3 Ab, CD28 Ab, and in presence or absence of the blocking BST2 Ab, as described in the “Results and Discussion” Chapter. At the end of the incubation, cells were stained with PE-conjugated CD4, APC-conjugated CD8 APC, and AlexaFluor 488-conjugated BST2 as described in section 3.12.
3.16 Statistical analyses
Statistical analyses were performed using SPSS 19.0 software (SPSS Inc., Chicago, IL, USA). Pairwise comparisons between control and stimulated cells were performed using non-parametric Wilcoxon sign rank test. Changes in measured parameters over time in kinetic experiments were analyzed using Friedman’s two-way analysis of variance (ANOVA) by ranks, and pairwise comparisons were subjected to Dunn’s post-hoc correction for multiple analyses. P-values lower than 0.05 were considered statistically significant.

43
4 RESULTS AND DISCUSSION
4.1 Overview
Plasmacytoid DC are IFN I producing cells that play a key role during viral infections, promoting innate and adaptive immune responses [138]. Activated pDC also exert a powerful immunoregulatory activity and are important in the in the maintenance of immune tolerance, through the expression IDO [152]. However, the persistent activation of pDC can paradoxically lead to harmful consequences for the immune system, resulting in inhibition of T cell proliferation and promotion of cell death. In particular, it has been recently shown that pDC overactivation contributes to the dysregulation of adaptive immunity and antiviral immune responses during HIV-1 infection [194-197]. Thus, studying the mechanisms that regulate IFN-I production by pDC is essential to understand the molecular basis of HIV-1 disease. Thus, we focused our attention on ILT7, a surface molecule selectively expressed by human pDC which potently suppress TLR7/9-induced IFN-I, and its ligand BST2, better known as Tetherin due to its ability to interfere with the release of enveloped viruses [211, 214, 225, 234, 245, 246]. Upon pDC activation, BST2 may be upregulated by IFN-I in the surrounding cells. This may favour BST2 interaction with ILT7, providing a negative feedback that may prevent deleterious pDC overactivation. Consequently, studying the regulation and activity of the ILT7/BST2 pathway may aid a better understanding of HIV immunopathogenesis.
4.2 ILT7 expression and modulation following in vitro culture
4.2.1 ILT7 expression is limited to pDC and is downregulated during in vitro culture
We evaluated the expression of ILT7 and BST2 in different cell types, in the presence or absence of HIV or TLR7/9L stimulation, in order to identify possible correlations with pDC activation. The phenotypic analysis was conduct by flow cytometry (Chapter 3, section 3.12) on freshly isolated primary PBMC from healthy donors or recovered from LRSCs (Chapter 3, section 3.3). Briefly 2x10
6 PBMC
were stained with the appropriate fluorochrome-conjugate antibodies and acquired on a flow cytometer. The gating strategy used to identify the different cell populations (pDC, mDC, monocytes, B cells and T cells) is indicated in Figure 4.1. The live gate was determinate on the basis of the combination of Forward Scatter (FSC) and Side Scatter (SSC) (Figure 4.1A and B). FSC is associated to the size of the cells, whereas SSC correlates with the granularity of cells, which varies depending on different cellular characteristics such as: the amount and type of cytoplasmic granules, the shape of the nucleus or the membrane roughness. As shown in panel A, monocytes were identified as CD14+ cells in the “Live gate”, whereas pDC were defined within the CD14- cells as BDCA2 and CD123 double+ cells. Panel B shows the gating strategy used to define B cells, T cells and mDC. In particular, B cells were selected within the CD14- and CD19+ population in the “Live gate”, then defined as CD19+ and CD3- cells; T cells were defined in the “Live gate” within the CD14 and CD19 double negative gate as CD14- and CD3+ cells; finally mDC were characterized by selecting the CD14 and CD19 double
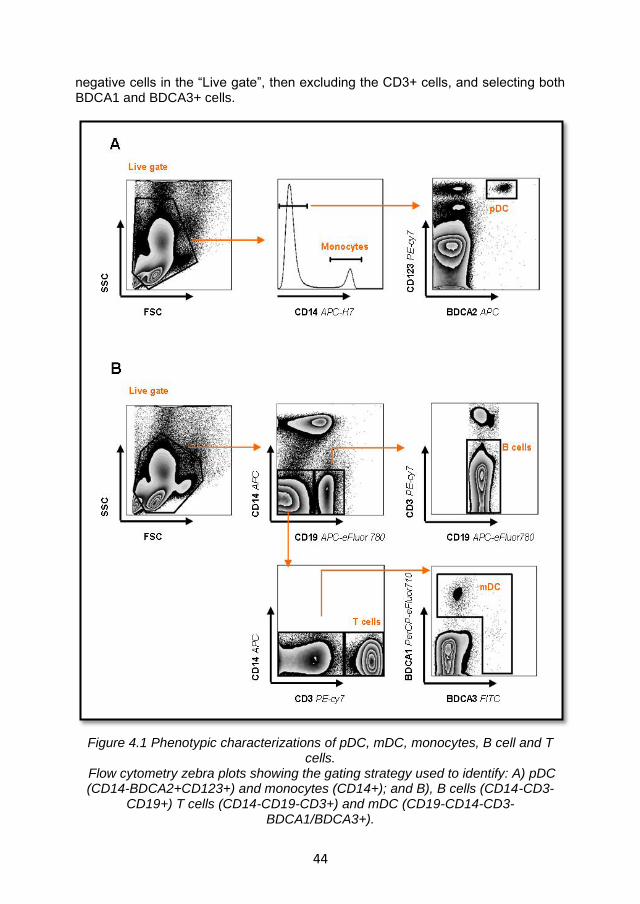
44
negative cells in the “Live gate”, then excluding the CD3+ cells, and selecting both BDCA1 and BDCA3+ cells.
Figure 4.1 Phenotypic characterizations of pDC, mDC, monocytes, B cell and T cells.
Flow cytometry zebra plots showing the gating strategy used to identify: A) pDC (CD14-BDCA2+CD123+) and monocytes (CD14+); and B), B cells (CD14-CD3-
CD19+) T cells (CD14-CD19-CD3+) and mDC (CD19-CD14-CD3-BDCA1/BDCA3+).
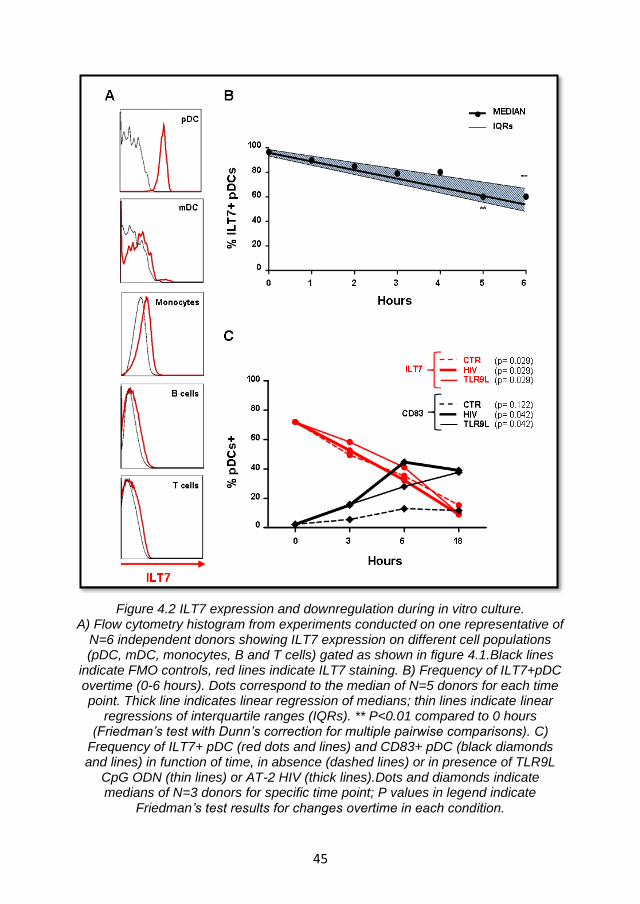
45
Figure 4.2 ILT7 expression and downregulation during in vitro culture. A) Flow cytometry histogram from experiments conducted on one representative of
N=6 independent donors showing ILT7 expression on different cell populations (pDC, mDC, monocytes, B and T cells) gated as shown in figure 4.1.Black lines
indicate FMO controls, red lines indicate ILT7 staining. B) Frequency of ILT7+pDC overtime (0-6 hours). Dots correspond to the median of N=5 donors for each time point. Thick line indicates linear regression of medians; thin lines indicate linear
regressions of interquartile ranges (IQRs). ** P<0.01 compared to 0 hours (Friedman’s test with Dunn’s correction for multiple pairwise comparisons). C)
Frequency of ILT7+ pDC (red dots and lines) and CD83+ pDC (black diamonds and lines) in function of time, in absence (dashed lines) or in presence of TLR9L
CpG ODN (thin lines) or AT-2 HIV (thick lines).Dots and diamonds indicate medians of N=3 donors for specific time point; P values in legend indicate
Friedman’s test results for changes overtime in each condition.
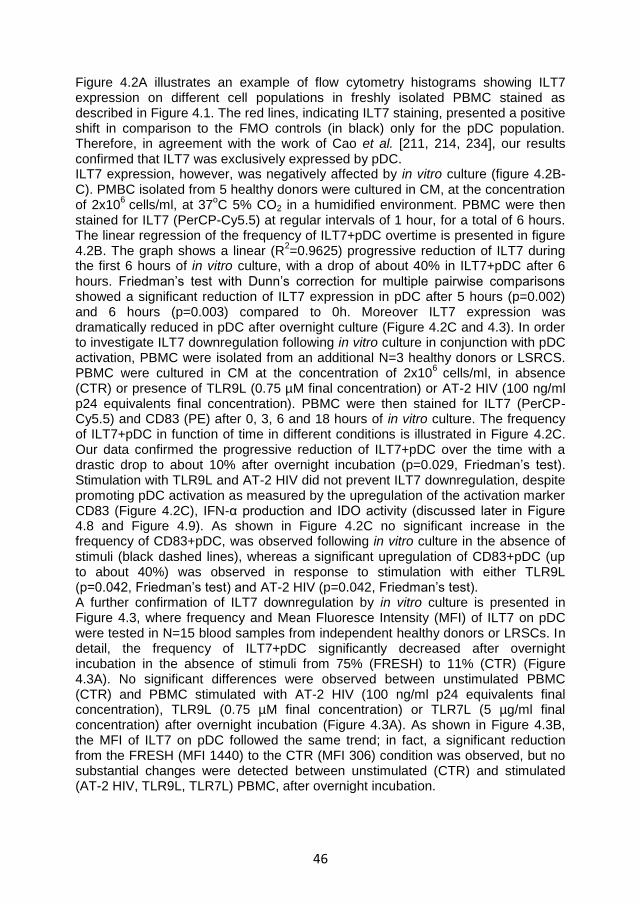
46
Figure 4.2A illustrates an example of flow cytometry histograms showing ILT7 expression on different cell populations in freshly isolated PBMC stained as described in Figure 4.1. The red lines, indicating ILT7 staining, presented a positive shift in comparison to the FMO controls (in black) only for the pDC population. Therefore, in agreement with the work of Cao et al. [211, 214, 234], our results confirmed that ILT7 was exclusively expressed by pDC. ILT7 expression, however, was negatively affected by in vitro culture (figure 4.2B-C). PMBC isolated from 5 healthy donors were cultured in CM, at the concentration of 2x10
6 cells/ml, at 37
oC 5% CO2 in a humidified environment. PBMC were then
stained for ILT7 (PerCP-Cy5.5) at regular intervals of 1 hour, for a total of 6 hours. The linear regression of the frequency of ILT7+pDC overtime is presented in figure 4.2B. The graph shows a linear (R
2=0.9625) progressive reduction of ILT7 during
the first 6 hours of in vitro culture, with a drop of about 40% in ILT7+pDC after 6 hours. Friedman’s test with Dunn’s correction for multiple pairwise comparisons showed a significant reduction of ILT7 expression in pDC after 5 hours (p=0.002) and 6 hours (p=0.003) compared to 0h. Moreover ILT7 expression was dramatically reduced in pDC after overnight culture (Figure 4.2C and 4.3). In order to investigate ILT7 downregulation following in vitro culture in conjunction with pDC activation, PBMC were isolated from an additional N=3 healthy donors or LSRCS. PBMC were cultured in CM at the concentration of 2x10
6 cells/ml, in absence
(CTR) or presence of TLR9L (0.75 µM final concentration) or AT-2 HIV (100 ng/ml p24 equivalents final concentration). PBMC were then stained for ILT7 (PerCP-Cy5.5) and CD83 (PE) after 0, 3, 6 and 18 hours of in vitro culture. The frequency of ILT7+pDC in function of time in different conditions is illustrated in Figure 4.2C. Our data confirmed the progressive reduction of ILT7+pDC over the time with a drastic drop to about 10% after overnight incubation (p=0.029, Friedman’s test). Stimulation with TLR9L and AT-2 HIV did not prevent ILT7 downregulation, despite promoting pDC activation as measured by the upregulation of the activation marker CD83 (Figure 4.2C), IFN-α production and IDO activity (discussed later in Figure 4.8 and Figure 4.9). As shown in Figure 4.2C no significant increase in the frequency of CD83+pDC, was observed following in vitro culture in the absence of stimuli (black dashed lines), whereas a significant upregulation of CD83+pDC (up to about 40%) was observed in response to stimulation with either TLR9L (p=0.042, Friedman’s test) and AT-2 HIV (p=0.042, Friedman’s test). A further confirmation of ILT7 downregulation by in vitro culture is presented in Figure 4.3, where frequency and Mean Fluoresce Intensity (MFI) of ILT7 on pDC were tested in N=15 blood samples from independent healthy donors or LRSCs. In detail, the frequency of ILT7+pDC significantly decreased after overnight incubation in the absence of stimuli from 75% (FRESH) to 11% (CTR) (Figure 4.3A). No significant differences were observed between unstimulated PBMC (CTR) and PBMC stimulated with AT-2 HIV (100 ng/ml p24 equivalents final concentration), TLR9L (0.75 µM final concentration) or TLR7L (5 µg/ml final concentration) after overnight incubation (Figure 4.3A). As shown in Figure 4.3B, the MFI of ILT7 on pDC followed the same trend; in fact, a significant reduction from the FRESH (MFI 1440) to the CTR (MFI 306) condition was observed, but no substantial changes were detected between unstimulated (CTR) and stimulated (AT-2 HIV, TLR9L, TLR7L) PBMC, after overnight incubation.
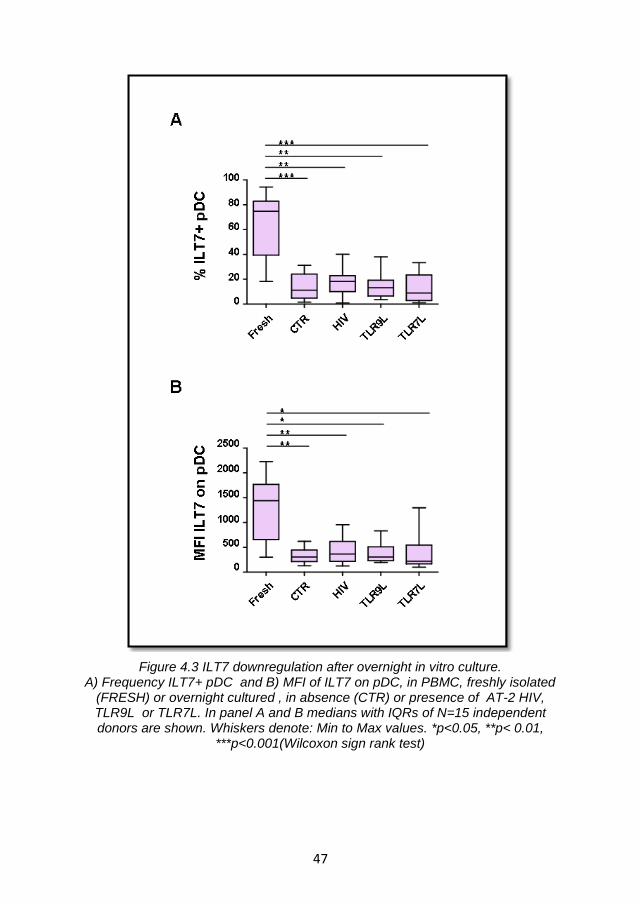
47
Figure 4.3 ILT7 downregulation after overnight in vitro culture. A) Frequency ILT7+ pDC and B) MFI of ILT7 on pDC, in PBMC, freshly isolated
(FRESH) or overnight cultured , in absence (CTR) or presence of AT-2 HIV, TLR9L or TLR7L. In panel A and B medians with IQRs of N=15 independent donors are shown. Whiskers denote: Min to Max values. *p<0.05, **p< 0.01,
***p<0.001(Wilcoxon sign rank test)
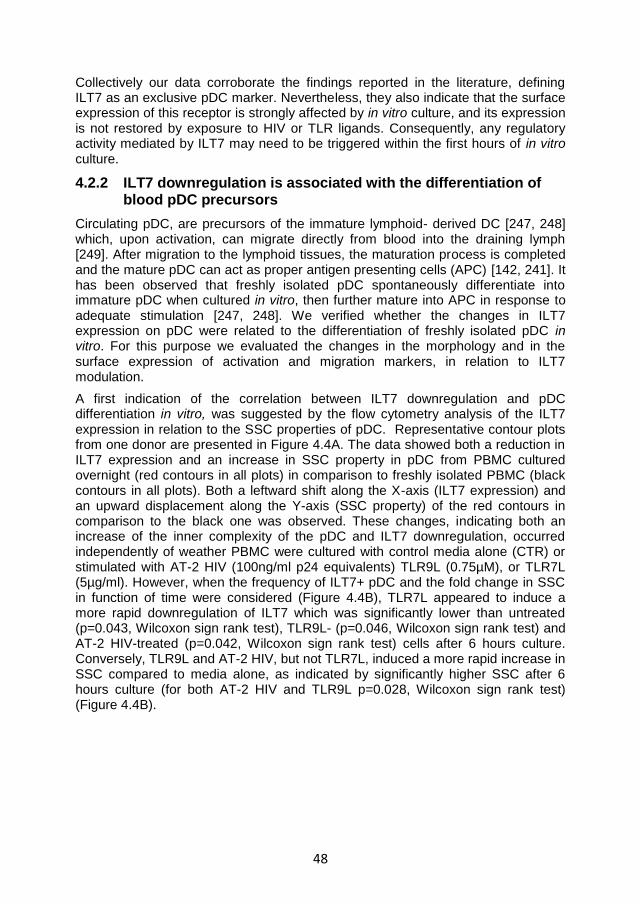
48
Collectively our data corroborate the findings reported in the literature, defining ILT7 as an exclusive pDC marker. Nevertheless, they also indicate that the surface expression of this receptor is strongly affected by in vitro culture, and its expression is not restored by exposure to HIV or TLR ligands. Consequently, any regulatory activity mediated by ILT7 may need to be triggered within the first hours of in vitro culture.
4.2.2 ILT7 downregulation is associated with the differentiation of blood pDC precursors
Circulating pDC, are precursors of the immature lymphoid- derived DC [247, 248] which, upon activation, can migrate directly from blood into the draining lymph [249]. After migration to the lymphoid tissues, the maturation process is completed and the mature pDC can act as proper antigen presenting cells (APC) [142, 241]. It has been observed that freshly isolated pDC spontaneously differentiate into immature pDC when cultured in vitro, then further mature into APC in response to adequate stimulation [247, 248]. We verified whether the changes in ILT7 expression on pDC were related to the differentiation of freshly isolated pDC in vitro. For this purpose we evaluated the changes in the morphology and in the surface expression of activation and migration markers, in relation to ILT7 modulation.
A first indication of the correlation between ILT7 downregulation and pDC differentiation in vitro, was suggested by the flow cytometry analysis of the ILT7 expression in relation to the SSC properties of pDC. Representative contour plots from one donor are presented in Figure 4.4A. The data showed both a reduction in ILT7 expression and an increase in SSC property in pDC from PBMC cultured overnight (red contours in all plots) in comparison to freshly isolated PBMC (black contours in all plots). Both a leftward shift along the X-axis (ILT7 expression) and an upward displacement along the Y-axis (SSC property) of the red contours in comparison to the black one was observed. These changes, indicating both an increase of the inner complexity of the pDC and ILT7 downregulation, occurred independently of weather PBMC were cultured with control media alone (CTR) or stimulated with AT-2 HIV (100ng/ml p24 equivalents) TLR9L (0.75µM), or TLR7L (5µg/ml). However, when the frequency of ILT7+ pDC and the fold change in SSC in function of time were considered (Figure 4.4B), TLR7L appeared to induce a more rapid downregulation of ILT7 which was significantly lower than untreated (p=0.043, Wilcoxon sign rank test), TLR9L- (p=0.046, Wilcoxon sign rank test) and AT-2 HIV-treated (p=0.042, Wilcoxon sign rank test) cells after 6 hours culture. Conversely, TLR9L and AT-2 HIV, but not TLR7L, induced a more rapid increase in SSC compared to media alone, as indicated by significantly higher SSC after 6 hours culture (for both AT-2 HIV and TLR9L p=0.028, Wilcoxon sign rank test) (Figure 4.4B).
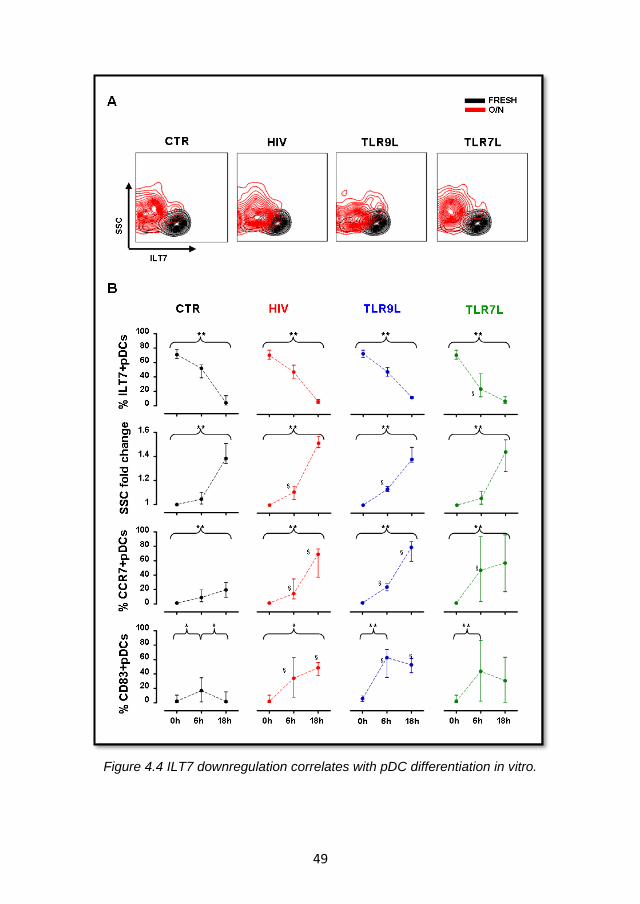
49
Figure 4.4 ILT7 downregulation correlates with pDC differentiation in vitro.
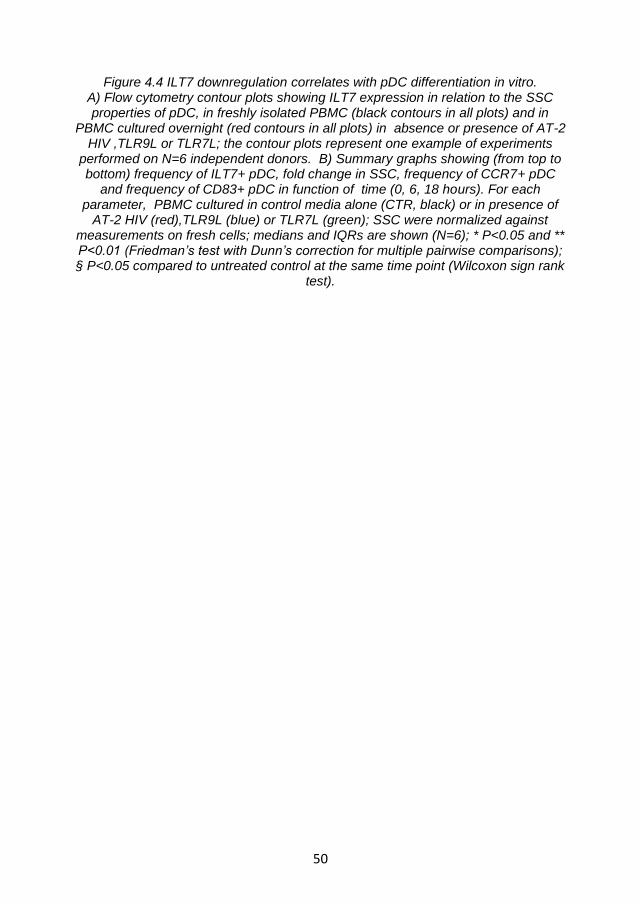
50
Figure 4.4 ILT7 downregulation correlates with pDC differentiation in vitro. A) Flow cytometry contour plots showing ILT7 expression in relation to the SSC properties of pDC, in freshly isolated PBMC (black contours in all plots) and in
PBMC cultured overnight (red contours in all plots) in absence or presence of AT-2 HIV ,TLR9L or TLR7L; the contour plots represent one example of experiments
performed on N=6 independent donors. B) Summary graphs showing (from top to bottom) frequency of ILT7+ pDC, fold change in SSC, frequency of CCR7+ pDC
and frequency of CD83+ pDC in function of time (0, 6, 18 hours). For each parameter, PBMC cultured in control media alone (CTR, black) or in presence of
AT-2 HIV (red),TLR9L (blue) or TLR7L (green); SSC were normalized against measurements on fresh cells; medians and IQRs are shown (N=6); * P<0.05 and ** P<0.01 (Friedman’s test with Dunn’s correction for multiple pairwise comparisons); § P<0.05 compared to untreated control at the same time point (Wilcoxon sign rank
test).
51
It has been shown that the expression of the chemokine receptor CCR7 on circulating lymphocytes represents an essential factor for lymph node (LN) entry via HEV [250, 251]. In the literature, there is contrasting evidence regarding CCR7 expression on human pDC. Some evidence suggests high level of CCR7 expression on circulating pDC, which however do not confer responsiveness to CCR7 ligands [140, 252]. Conversely, other reports showed low expression levels of CCR7 on resting pDC [253-255]. However, it has been observed that, upon stimulation with TLR ligands, both human and murine pDC upregulate CCR7 expression, resembling the mDC activation profile [252, 256, 257]. As shown in Figure 4.4B, our data confirmed a significant increase in the frequency of the CCR7+ pDC upon stimulation with AT-2 HIV, TLR9L and TLR7L compared to control after 6 hours incubation. Similar results were observed after 18 hours incubation, with the only exception that the increase in CCR7+ pDC compared to control remained significant only for AT-2 HIV and TLR9L, but not TLR7L. Nevertheless, when PBMC were cultured in media alone (CTR), we noticed a spontaneous significant increase of CCR7 on pDC (up to 20%; 0h-18h p=0.004, Friedman’s test, with Dunn’s correction for multiple pairwise comparisons), albeit lower than what observed in presence of stimuli. Conversely, when analysing the frequency of pDC expressing the activation marker CD83 over time, we observed only a transient increase (up to 17%) after 6h incubation in unstimulated PBMC (CTR) (0h-6h;6h-18h p=0.028 Friedman’s test, with Dunn’s correction for multiple pairwise comparisons). The increase in CD83 expression was instead higher and persistent in pDC stimulated with AT-2 HIV (100 ng/ml p24 equivalents), TLR9L (0.75 µM) and TLR7L (5 µg/ml). After 18 hours, we observed a significant increase in the frequency of CD83+ pDC (up to 49%, 0h-18h p= 0.012 Friedman’s test, with Dunn’s correction for multiple pairwise comparisons) in AT-2 HIV treated PBMC; whilst TLR9L- and TLR7L- treated PBMC showed a significant upregulation to 63% and 44%, respectively (0h-6h p= 0.004 Friedman’s test, with Dunn’s correction for multiple pairwise comparisons) (Figure 4.4B).
In summary, our results suggest that ILT7 downregulation is associated with differentiation of circulating pDC, characterized by increased morphological complexity and CCR7 expression, but not with activation and full maturation, epitomized by increased CD83 expression, which occur only following TLR stimulation.
4.2.3 Summary and discussion
ILT7 is a surface molecule selectively expressed by human pDC. The cross linking of this receptor activates a signal transduction cascade which potently suppresses TLR7/9-mediated IFN-I production by pDC [214]. Therefore, achieving a more detailed knowledge of ILT7 expression, modulation and interaction with its ligand, may help understanding the function of a new pathway involved in the negative regulation of pDC activation. In this result section we confirmed that ILT7 is exclusively express by human pDC, as previously described by Cao and colleagues [211, 214, 234]. However, we also showed that ILT7 is rapidly downregulated upon in vitro culture, decreasing of about 40% within the first 6 hours, independently of stimulation with AT-2 HIV or TLR7/9L. A possible explanation for ILT7 downmodulation may be the differentiation of freshly isolated pDC in immature pDC. In 1994, O'Doherty et al [247] defined the CD11c
-
52
peripheral blood (PB)-DC, known today as pDC, as functionally immature cells that required monocyte-derived cytokines in order to develop into typical DC. A few years later, Kohrgruber and colleagues [248] demonstrated that CD11c
- PB-DC
resembled the pDC previously identified in T cell-rich areas of tonsils and lymph nodes, not only by their surface Ag expression profile but also by their peculiar ultramorphology. Moreover, they showed that IL3 and TNFα controlled some of the CD11c
- PB-DC functions (i.e. survival and maturation), in the transition from
circulating precursors to an advanced maturational stage, such as: induction of a highly dendritic phenotype; MHC class II relocation to the plasma membrane; upregulation of costimulatory molecules and switch from a high Ag-processing to a low Ag-processing/potent accessory cell mode. Therefore, when cultured in an in vitro system, the circulating pDC differentiate into immature pDC, before they develop into fully functional APC in presence of adequate stimulation [257]. Our data corroborate these findings and suggest that the downregulation of ILT7 is part of the freshly isolated pDC differentiation process. We observed that ILT7 downregulation was indeed accompanied by an increase in both SSC property and CCR7 expression. The enhancement of SSC reflects the changes in the cells morphology, related to an increase in their granularity; whilst the upregulation of CCR7 indicate an increase of the lymph node homing properties. These characteristics together seem to support the hypothesis of a partial PB-pDC in vitro maturation. The expression of CCR7 is known to increase on pDC in response to appropriate stimuli via TLRs pathway, a process which in vivo is responsible for driving pDC migration to the T cells area within secondary lymphoid tissues [247-249]. However, flow cytometry analysis of CD83, a surface marker that differentiates immature and mature human dendritic cell populations [258, 259], showed only a transient increase on the pDC surface when PBMC were cultured in media only. Conversely, the frequency of CD83+ pDC was highly increased when pDC were activated by TLR ligands or HIV. Therefore, circulating pDC appears to be subject to a two step differentiation process in vitro. The first one, characterized by spontaneous changes in the morphology and partial acquisition of lymph node homing properties, leading to the generation of immature pDC; the second step, triggered by TLR7/9 stimulation, promotes full maturation and IFN-α production.
4.3 BST2 expression and regulation following in vitro culture
4.3.1 BST2 is upregulated in different cell types a consequence of IFNα stimulation via TLR- mediated pathway
Hitherto the only natural ligand known for ILT7 is BST2, also known as Tetherin [211, 234]. BST2 a protein encoded by an IFN-I-stimulated gene [234, 245]and it is better known for its ability to prevent the release of newly formed virus; activity counteracted by the HIV-1 accessory protein Vpu [225, 226, 246]. We hypothesised that, following pDC activation, BST2 may be upregulated in PBMC as a consequence of IFNα production, thus favouring BST2-ILT7 interaction that may negatively regulate pDC activation. Consequently, we tested the expression of BST2 on PBMC which were freshly isolated or cultured overnight in presence or absence (CTR) of AT-2 HIV (100ng/ml p24 equivalents), TLR9L (0.75µM) or TLR7L (5µg/ml). AT-2 HIV and TLR7/9 ligands directly activate pDC causing the secretion of IFNα [138, 142]. As illustrated in Figure 4.5A, the highest frequency of
53
BST2+ cells among freshly isolated PBMC was observed in monocytes; approximately 90% of monocytes were BST2+. To follow, 64 % of mDC and 44 % of B cells were BST2+, whereas less than 20% pDC and T cells tested BST2+. However, looking at PE-MFI of anti-BST2 Ab staining (Figure 4.5B), mDC showed the highest BST2 expression levels (MFI=4218) followed by monocytes (MFI=2046), B cells (MFI=1419), pDC (MFI=527) and T cells (MFI=715). This data suggested that, despite a lower frequency of BST2+ cells, mDC expressed a higher number of BST2 molecules per- cell on their surface compared to monocytes. However we cannot exclude that mDC are simply more auto-fluorescent and that the higher BST2 MFI is an artefact due to higher fluorescence background. Therefore, the frequency of positive cells, which takes into account a cell-specific background, may be a more reliable parameter to compare BST2 expression in different cell types.
Differently from ILT7, BST2 expression was generally unaffected by in vitro culture in the absence of stimuli; only mDC showed a significant reduction from 64% to 16% (p=0.025 Friedman’s test) of BST2 expression when PBMC where cultured overnight in absence of stimuli (compare Figure 4.5A and C). Moreover, a significant upregulation of BST2 was observed after o/n culture of PBMC with AT-2 HIV or TLR7/9L, at different degrees, in all cell types (Figure 4.5C). In particular, the frequency of BST2+ pDC increased from 32% in absence of stimuli (black bars), to 77-78% after overnight stimulation with TLR9L (blue bars) and AT-2 HIV (red bars) (p=0.0002 and p=0.0001, Wilcoxon sign rank test) and to 92% after overnight stimulation with TLR7L (green bars, p=0.0001, Wilcoxon sign rank test) (Figure 4.5C). Despite showing a reduction in BST2 expression following in vitro
culture in the absence of stimulation, mDC also showed a high significant upregulation of BST2 expression after overnight culture in the presence of AT-2 HIV, TLR9L and TLR7L, compared to the untreated control (for all p=0.043, Wilcoxon sign rank test; Figure 4.5C). B cells modestly upregulated BST2 (of approximately 35-40%) when PBMC were treated with either AT-2 HIV or TLR7/9L (for both p=0.043, Wilcoxon sign rank test; Figure 4.5C). T cells, instead, showed minor alterations of BST2 expression, which tested significant only after stimulation with AT-2 HIV or TLR9L (p=0.025 and p=0.05 respectively, Wilcoxon sign rank test) (Figure 4.5C). The frequency of BST2+ monocytes approached 100% in both freshly isolated and overnight cultured PBMC even in the absence of stimulation (Figure 4.5A and C). Consequently, when the frequency of BST2+ cells was considered, no differences could be revealed in the presence or absences of different TLR agonists (Figure 4.5C). However, by analysing the PE- MFI of anti-BST2 Ab staining, we observed a significant increase in BST2 expression per-cell on monocytes following PBMC treatment with AT-2 HIV (p=0.022, Wilcoxon sign rank test) or TLR7/9L (p=0.007 and p=0.005 respectively, Wilcoxon sign rank test) (Figure 4.5D). In all other cell types the changes in MFI followed the same trends described for the frequencies of BST2+ cells (Figure 4.5A and C). These data are consistent with the regulation of BST2 expression by IFN-I produced by TLR7/9-stimulated pDC [234, 245].
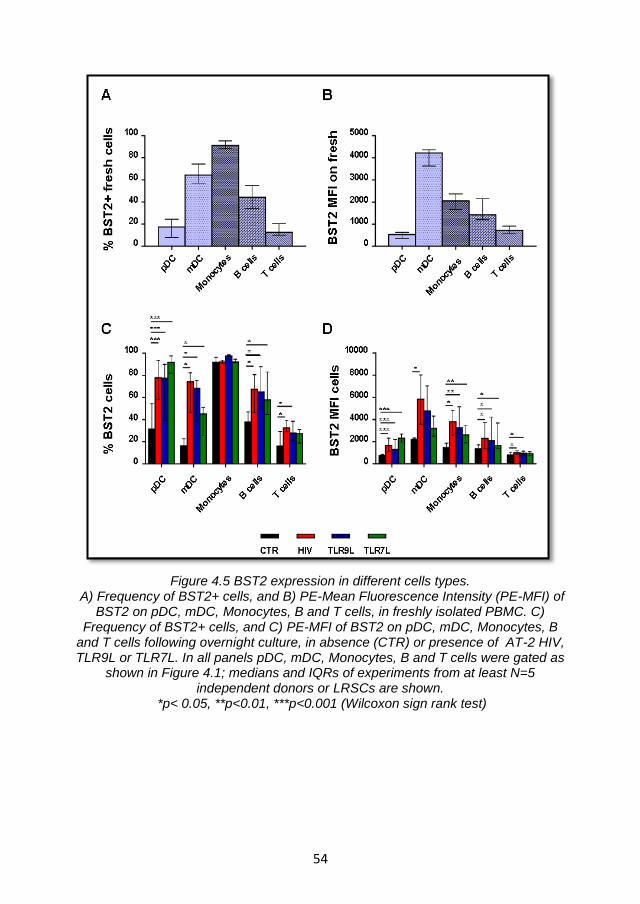
54
Figure 4.5 BST2 expression in different cells types. A) Frequency of BST2+ cells, and B) PE-Mean Fluorescence Intensity (PE-MFI) of
BST2 on pDC, mDC, Monocytes, B and T cells, in freshly isolated PBMC. C) Frequency of BST2+ cells, and C) PE-MFI of BST2 on pDC, mDC, Monocytes, B
and T cells following overnight culture, in absence (CTR) or presence of AT-2 HIV, TLR9L or TLR7L. In all panels pDC, mDC, Monocytes, B and T cells were gated as
shown in Figure 4.1; medians and IQRs of experiments from at least N=5 independent donors or LRSCs are shown.
*p< 0.05, **p<0.01, ***p<0.001 (Wilcoxon sign rank test)
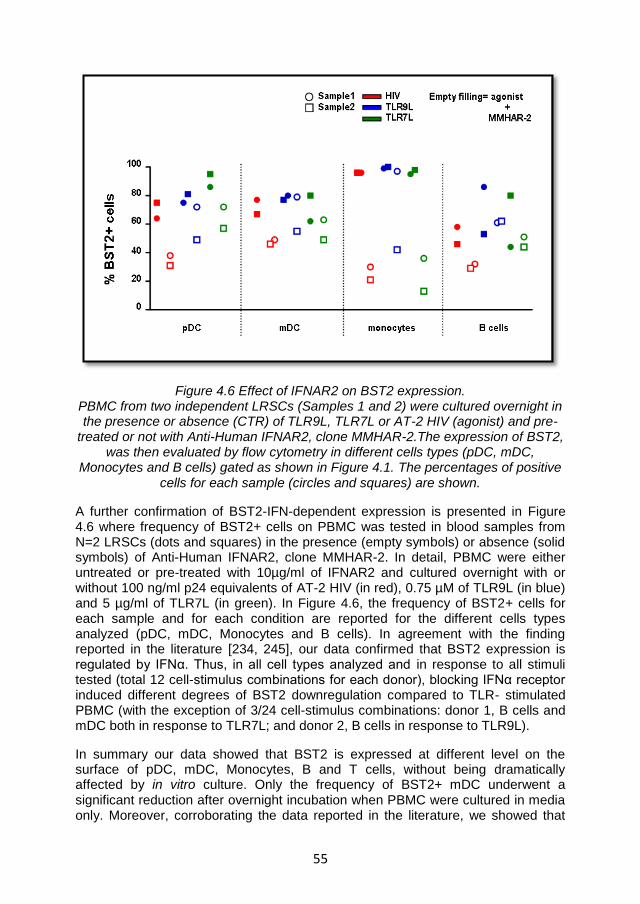
55
Figure 4.6 Effect of IFNAR2 on BST2 expression. PBMC from two independent LRSCs (Samples 1 and 2) were cultured overnight in the presence or absence (CTR) of TLR9L, TLR7L or AT-2 HIV (agonist) and pre-
treated or not with Anti-Human IFNAR2, clone MMHAR-2.The expression of BST2, was then evaluated by flow cytometry in different cells types (pDC, mDC,
Monocytes and B cells) gated as shown in Figure 4.1. The percentages of positive cells for each sample (circles and squares) are shown.
A further confirmation of BST2-IFN-dependent expression is presented in Figure 4.6 where frequency of BST2+ cells on PBMC was tested in blood samples from N=2 LRSCs (dots and squares) in the presence (empty symbols) or absence (solid symbols) of Anti-Human IFNAR2, clone MMHAR-2. In detail, PBMC were either untreated or pre-treated with 10µg/ml of IFNAR2 and cultured overnight with or without 100 ng/ml p24 equivalents of AT-2 HIV (in red), 0.75 µM of TLR9L (in blue) and 5 µg/ml of TLR7L (in green). In Figure 4.6, the frequency of BST2+ cells for each sample and for each condition are reported for the different cells types analyzed (pDC, mDC, Monocytes and B cells). In agreement with the finding reported in the literature [234, 245], our data confirmed that BST2 expression is regulated by IFNα. Thus, in all cell types analyzed and in response to all stimuli tested (total 12 cell-stimulus combinations for each donor), blocking IFNα receptor induced different degrees of BST2 downregulation compared to TLR- stimulated PBMC (with the exception of 3/24 cell-stimulus combinations: donor 1, B cells and mDC both in response to TLR7L; and donor 2, B cells in response to TLR9L).
In summary our data showed that BST2 is expressed at different level on the surface of pDC, mDC, Monocytes, B and T cells, without being dramatically affected by in vitro culture. Only the frequency of BST2+ mDC underwent a significant reduction after overnight incubation when PBMC were cultured in media only. Moreover, corroborating the data reported in the literature, we showed that
56
BST2 expression is IFNα-dependent, showing increases in the frequency of BST2+ cells and/or in BST2 MFI in all the cell types after stimulation with TLR agonist, which could be reversed by blocking IFNAR2 receptor.
4.3.2 Effect of TLR- agonists titration on BST2 expression and pDC activation.
In the previous section we reported that pDC, similar to other PBMC, express and can upregulate BST2 in response to TLR-stimulation (Figure 4.5 and 4.6). This suggests that ILT7 and BST2 interaction may happen not only in trans between pDC and other cells, but also in cis within the pDC population, depending on the pDC activation status. Therefore, we tested the effect of pDC overstimulation or suboptimal stimulation on the dynamics of BST2 expression by pDC. In Figure 4.7, PBMC from 6 independent donors or LRSCs were stimulated overnight with different concentrations of AT-2 HIV (in red) TLR9L (in blue) or TLR7L (in green) and the MFI of BST2 (top) was measured and compared to other pDC activation markers such as (from top to bottom) CD83 expression, IFNα production and IDO activity. We observed a significant up-regulation of BST2 expression by pDC after stimulation of PBMC with low-medium concentrations of HIV (p=0.028 for 100 ng/ml p24 equivalents; Friedman’s test with Dunn’s correction for multiple pairwise comparisons) and a similar trend was noted after TLR7L stimulation, despite not reaching statistical significance. Conversely, when high concentrations of HIV or TLR7L were used, we observed only a modest increase in BST2 expression (Figure 4.7). Conversely, when cells were stimulated with TLR9L, a significant upregulation of BST2 on pDC was observed in response to high doses of TLR9L (with 15 and 50 µg/ml of TLR9L, p=0.044 and p<0.001 respectively; Friedman’s test with Dunn’s correction for multiple pairwise comparisons). The profile of BST2 up-regulation by pDC observed after HIV and TLR7L stimulation generally followed that of CD83 and IFN-α production. Indeed, CD83 expression on pDC significantly increased when PBMC were stimulated with 100 ng/ml p24 equivalents HIV (p=0.004; Friedman’s test with Dunn’s correction for multiple pairwise comparisons) or with 0.075 μM and 0.25 μM TLR7L (p=0.018, p=0.044 respectively; Friedman’s test with Dunn’s correction for multiple pairwise comparisons). Similarly, IFNα concentration was higher in the supernatants of PBMC treated with 100 or 300 ng/ml HIV p24 equivalents (p=0.02; Friedman’s test with Dunn’s correction for multiple pairwise comparisons), with 1.6 and 5μg/ml TLR9L (p=0.018, p=0.01 respectively; Friedman’s test with Dunn’s correction for multiple pairwise comparisons) or with 0.075 μM TLR7L (p=0.022; Friedman’s test with Dunn’s correction for multiple pairwise comparisons). Whist, only modest levels were observed when PBMC were treated with high concentration of the abovementioned stimuli (Figure 4.7).
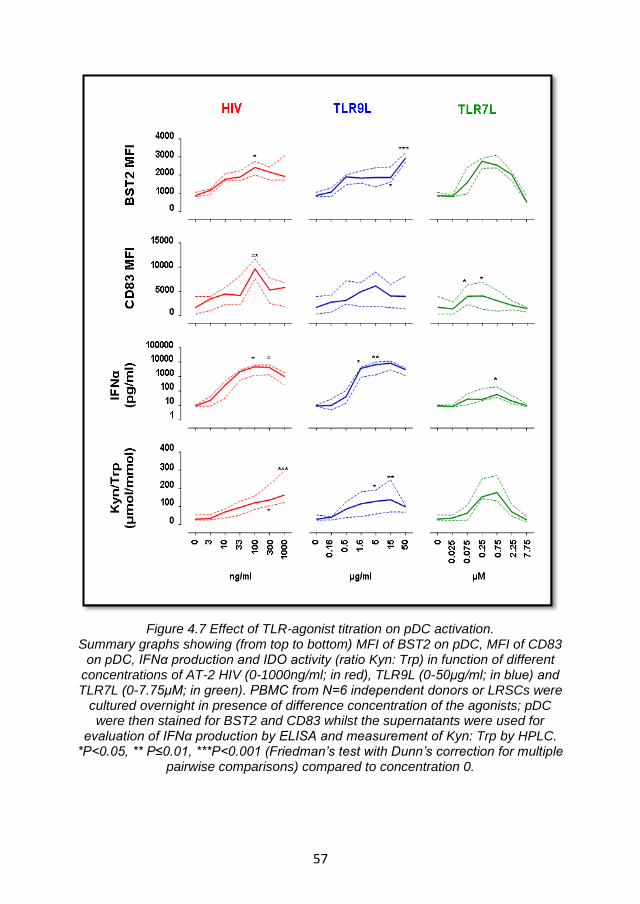
57
Figure 4.7 Effect of TLR-agonist titration on pDC activation. Summary graphs showing (from top to bottom) MFI of BST2 on pDC, MFI of CD83
on pDC, IFNα production and IDO activity (ratio Kyn: Trp) in function of different concentrations of AT-2 HIV (0-1000ng/ml; in red), TLR9L (0-50μg/ml; in blue) and TLR7L (0-7.75μM; in green). PBMC from N=6 independent donors or LRSCs were
cultured overnight in presence of difference concentration of the agonists; pDC were then stained for BST2 and CD83 whilst the supernatants were used for
evaluation of IFNα production by ELISA and measurement of Kyn: Trp by HPLC. *P<0.05, ** P≤0.01, ***P<0.001 (Friedman’s test with Dunn’s correction for multiple
pairwise comparisons) compared to concentration 0.
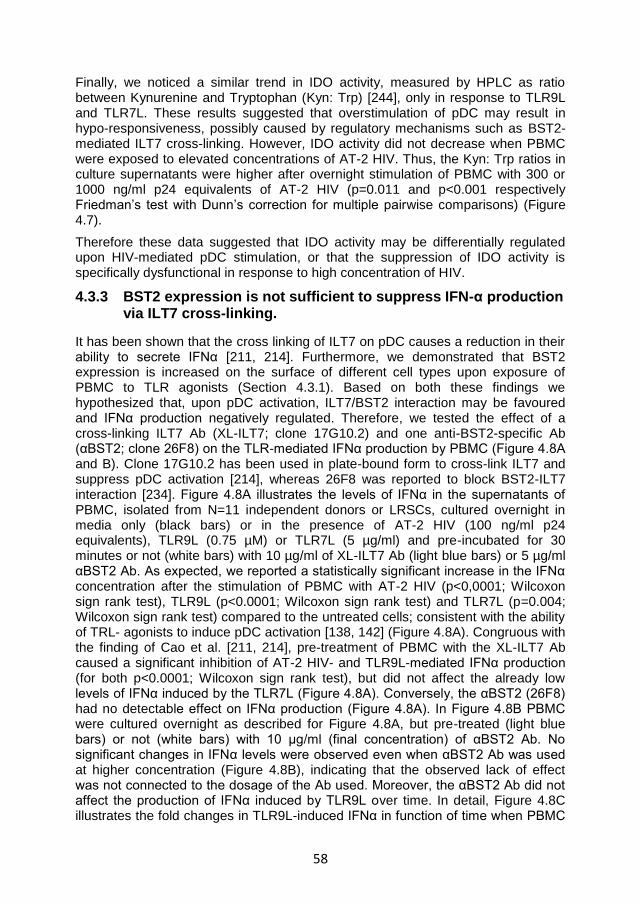
58
Finally, we noticed a similar trend in IDO activity, measured by HPLC as ratio between Kynurenine and Tryptophan (Kyn: Trp) [244], only in response to TLR9L and TLR7L. These results suggested that overstimulation of pDC may result in hypo-responsiveness, possibly caused by regulatory mechanisms such as BST2-mediated ILT7 cross-linking. However, IDO activity did not decrease when PBMC were exposed to elevated concentrations of AT-2 HIV. Thus, the Kyn: Trp ratios in culture supernatants were higher after overnight stimulation of PBMC with 300 or 1000 ng/ml p24 equivalents of AT-2 HIV (p=0.011 and p<0.001 respectively Friedman’s test with Dunn’s correction for multiple pairwise comparisons) (Figure 4.7).
Therefore these data suggested that IDO activity may be differentially regulated upon HIV-mediated pDC stimulation, or that the suppression of IDO activity is specifically dysfunctional in response to high concentration of HIV.
4.3.3 BST2 expression is not sufficient to suppress IFN-α production via ILT7 cross-linking.
It has been shown that the cross linking of ILT7 on pDC causes a reduction in their ability to secrete IFNα [211, 214]. Furthermore, we demonstrated that BST2 expression is increased on the surface of different cell types upon exposure of PBMC to TLR agonists (Section 4.3.1). Based on both these findings we hypothesized that, upon pDC activation, ILT7/BST2 interaction may be favoured and IFNα production negatively regulated. Therefore, we tested the effect of a cross-linking ILT7 Ab (XL-ILT7; clone 17G10.2) and one anti-BST2-specific Ab (αBST2; clone 26F8) on the TLR-mediated IFNα production by PBMC (Figure 4.8A and B). Clone 17G10.2 has been used in plate-bound form to cross-link ILT7 and suppress pDC activation [214], whereas 26F8 was reported to block BST2-ILT7 interaction [234]. Figure 4.8A illustrates the levels of IFNα in the supernatants of PBMC, isolated from N=11 independent donors or LRSCs, cultured overnight in media only (black bars) or in the presence of AT-2 HIV (100 ng/ml p24 equivalents), TLR9L (0.75 µM) or TLR7L (5 µg/ml) and pre-incubated for 30 minutes or not (white bars) with 10 µg/ml of XL-ILT7 Ab (light blue bars) or 5 µg/ml αBST2 Ab. As expected, we reported a statistically significant increase in the IFNα concentration after the stimulation of PBMC with AT-2 HIV (p<0,0001; Wilcoxon sign rank test), TLR9L (p<0.0001; Wilcoxon sign rank test) and TLR7L (p=0.004; Wilcoxon sign rank test) compared to the untreated cells; consistent with the ability of TRL- agonists to induce pDC activation [138, 142] (Figure 4.8A). Congruous with the finding of Cao et al. [211, 214], pre-treatment of PBMC with the XL-ILT7 Ab caused a significant inhibition of AT-2 HIV- and TLR9L-mediated IFNα production (for both p<0.0001; Wilcoxon sign rank test), but did not affect the already low levels of IFNα induced by the TLR7L (Figure 4.8A). Conversely, the αBST2 (26F8) had no detectable effect on IFNα production (Figure 4.8A). In Figure 4.8B PBMC were cultured overnight as described for Figure 4.8A, but pre-treated (light blue bars) or not (white bars) with 10 µg/ml (final concentration) of αBST2 Ab. No significant changes in IFNα levels were observed even when αBST2 Ab was used at higher concentration (Figure 4.8B), indicating that the observed lack of effect was not connected to the dosage of the Ab used. Moreover, the αBST2 Ab did not affect the production of IFNα induced by TLR9L over time. In detail, Figure 4.8C illustrates the fold changes in TLR9L-induced IFNα in function of time when PBMC
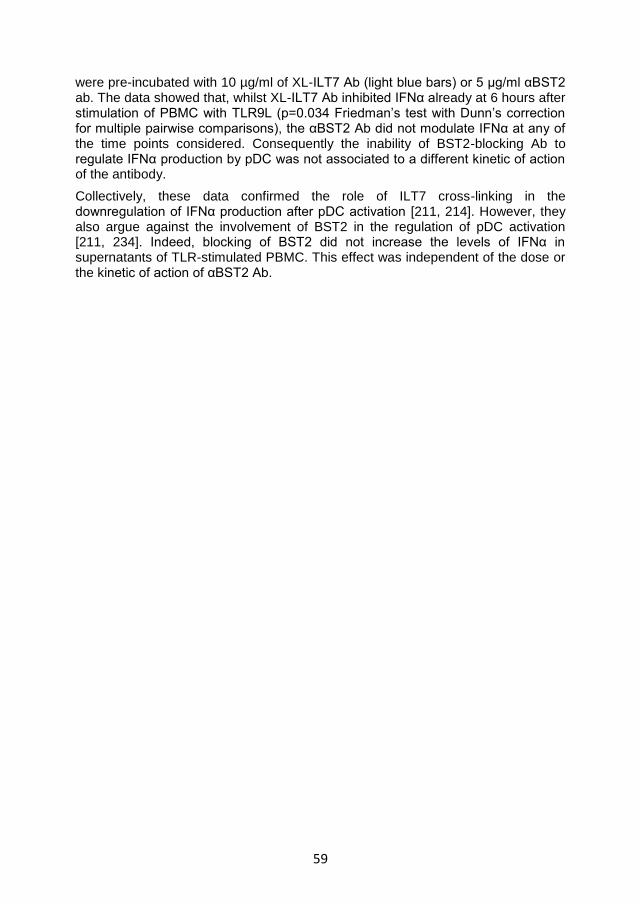
59
were pre-incubated with 10 µg/ml of XL-ILT7 Ab (light blue bars) or 5 µg/ml αBST2 ab. The data showed that, whilst XL-ILT7 Ab inhibited IFNα already at 6 hours after stimulation of PBMC with TLR9L (p=0.034 Friedman’s test with Dunn’s correction for multiple pairwise comparisons), the αBST2 Ab did not modulate IFNα at any of the time points considered. Consequently the inability of BST2-blocking Ab to regulate IFNα production by pDC was not associated to a different kinetic of action of the antibody.
Collectively, these data confirmed the role of ILT7 cross-linking in the downregulation of IFNα production after pDC activation [211, 214]. However, they also argue against the involvement of BST2 in the regulation of pDC activation [211, 234]. Indeed, blocking of BST2 did not increase the levels of IFNα in supernatants of TLR-stimulated PBMC. This effect was independent of the dose or the kinetic of action of αBST2 Ab.
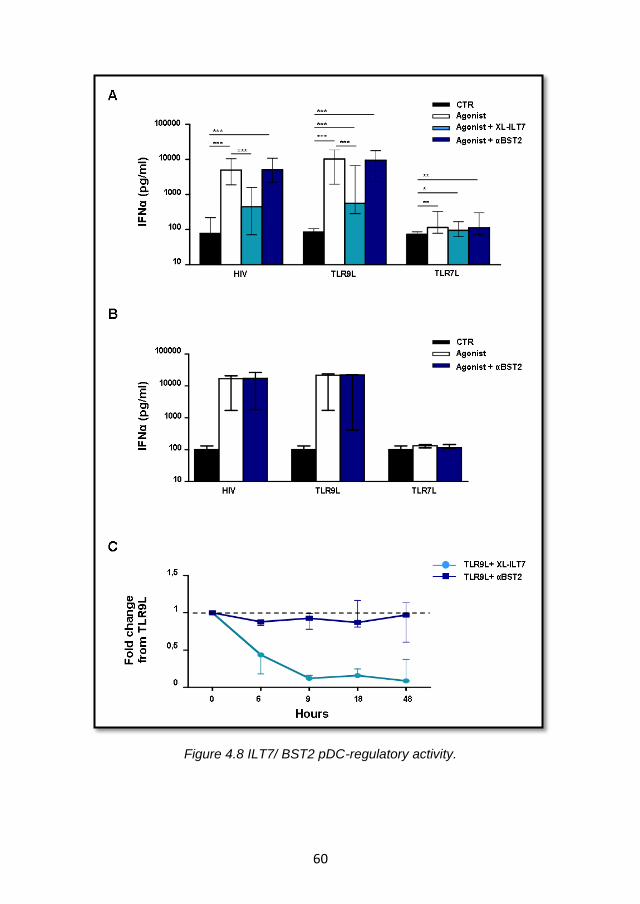
60
Figure 4.8 ILT7/ BST2 pDC-regulatory activity.
61
Figure 4.8 ILT7/ BST2 pDC-regulatory activity. A) ELISA measurement of IFNα production in culture supernatants from PBMC
cultured overnight in the presence or absence (CTR) of TLR9L, TLR7L or AT-2 HIV (agonist) and pre-treated or not with 10 µg/ml XL-ILT7 Ab (17G10.2) or 5 µg/ml
αBST2 (26F8); medians and IQRs of experiments from N=11 independent donors or LRSCs are shown. *p< 0.05, **p<0.01, ***p<0.001 (Wilcoxon sign rank test) B)
ELISA measurement of IFNα production in culture supernatants from PBMC cultured overnight as in A, but pre-incubated or not with 10 µg/ml of αBST2 (26F8);
medians and IQRs of experiments from N=3 independent LRSCs are shown. C) Fold changes in TLR9L-induced IFNα in PBMC cultures after pre-treatment with
XL-ILT7 (light blue dots and lines)or αBST2 (blue squares and lines) over time (6, 9, 18 or 48 hours); all values were normalized against TLR9L-stimulated cells,
indicated by the black dashed line; For each time point, medians (dots/squares) and IQRs of experiments from N=3 independent donors or LRSCs are shown.

62
4.3.4 BST2 expression is not sufficient to inhibit IDO activity
It is known that activated pDC, besides secreting type I IFN, also upregulate the expression of IDO, an immunosuppressive enzyme which inhibits cell proliferation by catabolising the essential amino acid tryptophan into kynurenine [152, 153, 182]. Therefore, we verified whether ILT7 cross-linking or BST2 blockade were involved in the regulation of TLR7/9L- and AT-2 HIV-induced IDO activity.
Figure 4.9 IDO regulation by the ILT7/BST2 pathway. Ratio between Kyn and Trp measured by HPLC in supernatants from
PBMC cultured overnight in the presence or absence (CTR) of TLR9L, or AT-2 HIV (agonist) and pre-treated or not with the XL-
ILT7(17G10.2) or the αBST2 (26F8); medians and IQRs of experiments from N=11 independent donors are shown. *p<0.05, **p<0.01, ***p<0.001 (Wilcoxon sign rank test)
Figure 4.9 shows the results obtained for IDO enzymatic activity when PBMC were cultured overnight in the presence or absence (black bars) of HIV (100 ng/ml p24 equivalents), TLR9L (0.75 µM) or TLR7L (5 µg/ml). After being pre-treated or not (white bars) with 10 µg/ml of XL-ILT7 Ab (light blue bars) or 5 µg/ml αBST2 Ab. The ratio between Kyn and Trp (Kyn: Trp), a well accepted marker of IDO activity [244], was then measured by HPLC in culture supernatants. Similar to what observed for IFNα, we found statistically significant increases in IDO activity after stimulation with AT-2 HIV (p=0.004, Wilcoxon sign rank test), TLR9L (p=0.028, Wilcoxon sign rank test) and TLR7L (p=0.003, Wilcoxon sign rank test). Interestingly, XL-ILT7 Ab pre-treatment induced a significant downregulation of AT-2 HIV-induced IDO activity (p=0.01, Wilcoxon sign rank test), whereas no significant change was observed in TLR9/7L-induced IDO activity.
63
Moreover, no effect on IDO activity was reported after pre-incubation with 5µg/ml (final concentration) of αBST2 Ab.
We conclude that whilst the cross-linking of ILT7 was partially capable to regulate IDO activity, at least in response to AT-2 HIV-, BST2 did not affect IDO enzymatic activity. These findings support the hypothesis that BST2 is not involved in the regulation of pDC activity.
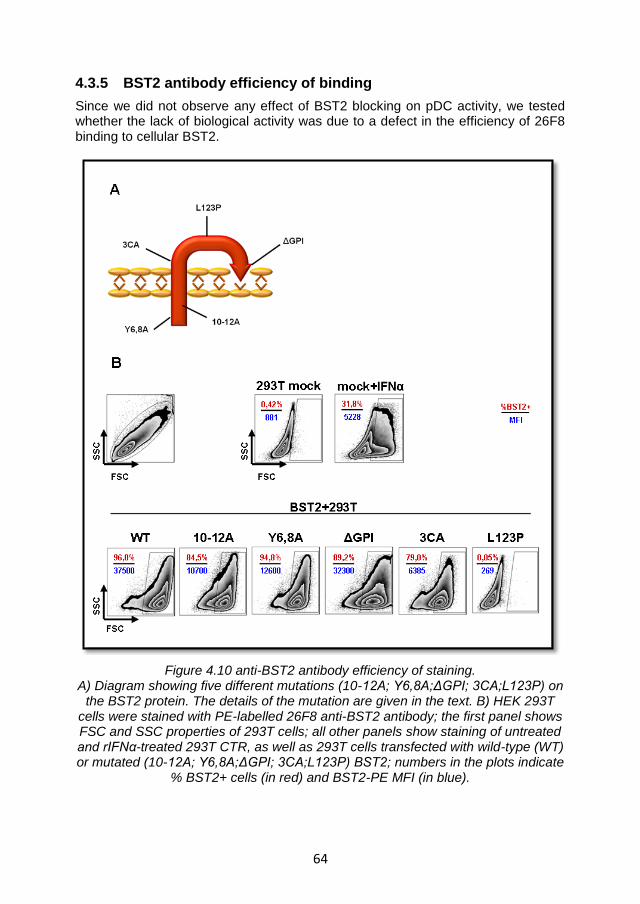
64
4.3.5 BST2 antibody efficiency of binding
Since we did not observe any effect of BST2 blocking on pDC activity, we tested whether the lack of biological activity was due to a defect in the efficiency of 26F8 binding to cellular BST2.
Figure 4.10 anti-BST2 antibody efficiency of staining. A) Diagram showing five different mutations (10-12A; Y6,8A;ΔGPI; 3CA;L123P) on
the BST2 protein. The details of the mutation are given in the text. B) HEK 293T cells were stained with PE-labelled 26F8 anti-BST2 antibody; the first panel shows FSC and SSC properties of 293T cells; all other panels show staining of untreated and rIFNα-treated 293T CTR, as well as 293T cells transfected with wild-type (WT) or mutated (10-12A; Y6,8A;ΔGPI; 3CA;L123P) BST2; numbers in the plots indicate
% BST2+ cells (in red) and BST2-PE MFI (in blue).
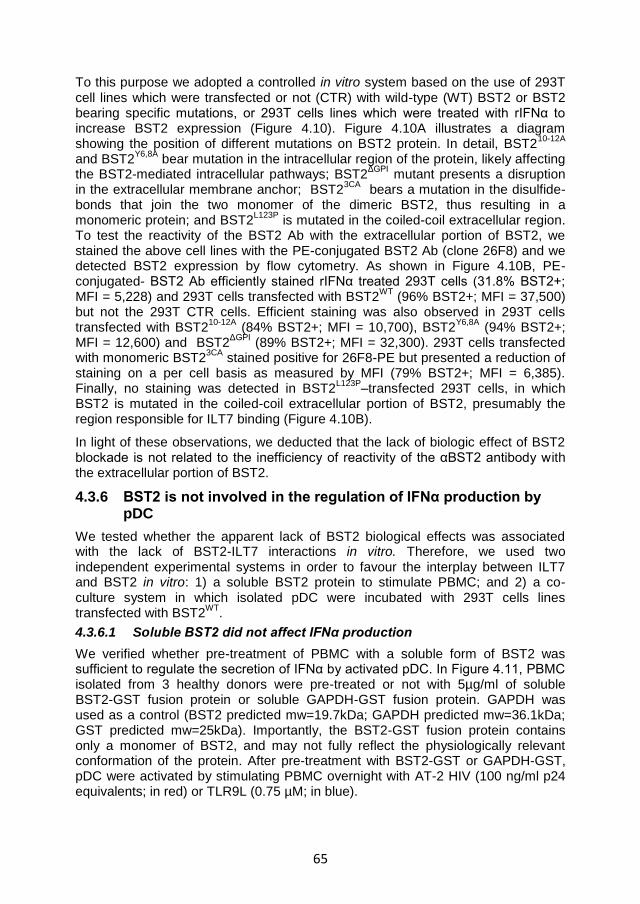
65
To this purpose we adopted a controlled in vitro system based on the use of 293T cell lines which were transfected or not (CTR) with wild-type (WT) BST2 or BST2 bearing specific mutations, or 293T cells lines which were treated with rIFNα to increase BST2 expression (Figure 4.10). Figure 4.10A illustrates a diagram showing the position of different mutations on BST2 protein. In detail, BST2
10-12A
and BST2Y6,8A
bear mutation in the intracellular region of the protein, likely affecting the BST2-mediated intracellular pathways; BST2
ΔGPI mutant presents a disruption
in the extracellular membrane anchor; BST23CA
bears a mutation in the disulfide-bonds that join the two monomer of the dimeric BST2, thus resulting in a monomeric protein; and BST2
L123P is mutated in the coiled-coil extracellular region.
To test the reactivity of the BST2 Ab with the extracellular portion of BST2, we stained the above cell lines with the PE-conjugated BST2 Ab (clone 26F8) and we detected BST2 expression by flow cytometry. As shown in Figure 4.10B, PE-conjugated- BST2 Ab efficiently stained rIFNα treated 293T cells (31.8% BST2+; MFI = 5,228) and 293T cells transfected with BST2
WT (96% BST2+; MFI = 37,500)
but not the 293T CTR cells. Efficient staining was also observed in 293T cells transfected with BST2
10-12A (84% BST2+; MFI = 10,700), BST2
Y6,8A (94% BST2+;
MFI = 12,600) and BST2ΔGPI
(89% BST2+; MFI = 32,300). 293T cells transfected with monomeric BST2
3CA stained positive for 26F8-PE but presented a reduction of
staining on a per cell basis as measured by MFI (79% BST2+; MFI = 6,385). Finally, no staining was detected in BST2
L123P–transfected 293T cells, in which
BST2 is mutated in the coiled-coil extracellular portion of BST2, presumably the region responsible for ILT7 binding (Figure 4.10B).
In light of these observations, we deducted that the lack of biologic effect of BST2 blockade is not related to the inefficiency of reactivity of the αBST2 antibody with the extracellular portion of BST2.
4.3.6 BST2 is not involved in the regulation of IFNα production by pDC
We tested whether the apparent lack of BST2 biological effects was associated with the lack of BST2-ILT7 interactions in vitro. Therefore, we used two independent experimental systems in order to favour the interplay between ILT7 and BST2 in vitro: 1) a soluble BST2 protein to stimulate PBMC; and 2) a co-culture system in which isolated pDC were incubated with 293T cells lines transfected with BST2
WT.
4.3.6.1 Soluble BST2 did not affect IFNα production
We verified whether pre-treatment of PBMC with a soluble form of BST2 was sufficient to regulate the secretion of IFNα by activated pDC. In Figure 4.11, PBMC isolated from 3 healthy donors were pre-treated or not with 5µg/ml of soluble BST2-GST fusion protein or soluble GAPDH-GST fusion protein. GAPDH was used as a control (BST2 predicted mw=19.7kDa; GAPDH predicted mw=36.1kDa; GST predicted mw=25kDa). Importantly, the BST2-GST fusion protein contains only a monomer of BST2, and may not fully reflect the physiologically relevant conformation of the protein. After pre-treatment with BST2-GST or GAPDH-GST, pDC were activated by stimulating PBMC overnight with AT-2 HIV (100 ng/ml p24 equivalents; in red) or TLR9L (0.75 µM; in blue).
66
Figure 4.11 Effect of soluble BST2 protein on IFNα production. IFNα levels in supernatants from PBMC isolated from N=3 independent donors,
cultured overnight in the presence or absence (CTR) of AT-2 HIV (in red) or TLR9L (in blue) and pre-treated or not with soluble BST2-GST soluble GAPDH-GST fusion proteins. IFNα concentrations for each donor (circles, diamonds and stars) in each
condition are shown.
Consistent with our previous observations, we did not find any change in the IFNα production by pDC in the presence of soluble BST2-GST protein (Figure 4.11), supporting the notion that BST2 may not be involved in the regulation of pDC activation.
4.3.6.2 BST2 did not affect IFN-α production in an in vitro co-culture system
BST2 is normally expressed on the surface of cells as a homodimer [260, 261]. However the soluble protein used in the experiment described in Section 4.3.6.1 was in a monomeric form; thus it could be argued that the lack of effect of BST2-GST was due to its non-natural monomeric form. For this reason, we used a model in which the effect of cell-bound dimeric BST2 could be analysed. Isolated pDC were co-cultured with 293T cells transfected with BST2
WT as described in section
3.14 of the Material and Methods Chapter. In this system, BST2-ILT7 interaction may be facilitated as ILT7-expressing pDC, isolated from the total PBMC, may interact with BST2 dimers which are abundantly and stably expressed by the 293T cell lines. Figure 4.12 shows the levels of IFNα in the supernatants of pDC co-cultured alone (in orange) or with BST2
wt–transfected 293T cells (in green) or 293T
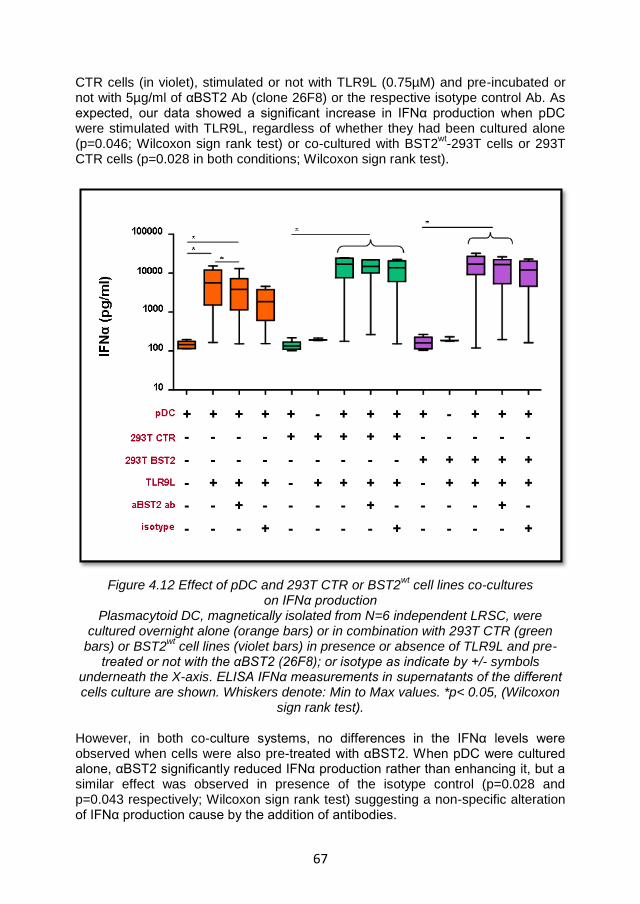
67
CTR cells (in violet), stimulated or not with TLR9L (0.75µM) and pre-incubated or not with 5µg/ml of αBST2 Ab (clone 26F8) or the respective isotype control Ab. As expected, our data showed a significant increase in IFNα production when pDC were stimulated with TLR9L, regardless of whether they had been cultured alone (p=0.046; Wilcoxon sign rank test) or co-cultured with BST2
wt-293T cells or 293T
CTR cells (p=0.028 in both conditions; Wilcoxon sign rank test).
Figure 4.12 Effect of pDC and 293T CTR or BST2wt
cell lines co-cultures on IFNα production
Plasmacytoid DC, magnetically isolated from N=6 independent LRSC, were cultured overnight alone (orange bars) or in combination with 293T CTR (green
bars) or BST2wt
cell lines (violet bars) in presence or absence of TLR9L and pre-treated or not with the αBST2 (26F8); or isotype as indicate by +/- symbols
underneath the X-axis. ELISA IFNα measurements in supernatants of the different cells culture are shown. Whiskers denote: Min to Max values. *p< 0.05, (Wilcoxon
sign rank test).
However, in both co-culture systems, no differences in the IFNα levels were observed when cells were also pre-treated with αBST2. When pDC were cultured alone, αBST2 significantly reduced IFNα production rather than enhancing it, but a similar effect was observed in presence of the isotype control (p=0.028 and p=0.043 respectively; Wilcoxon sign rank test) suggesting a non-specific alteration of IFNα production cause by the addition of antibodies.
68
Taken together, these data suggest that BST2 was not able to modulated IFNα secretion. This inefficacy was likely not due to technical issues related to the in vitro culture system, but more likely to the intrinsic inability of BST2 to negatively modulate pDC activation.
4.3.7 Summary and discussion
Cao and colleagues showed that XL-ILT7 Ab (clone 17G10.2), suppressed pDC activation when used in plate-bound form [214]; they also demonstrated that αBST2 Ab (clone 26F8) inhibited green fluorescence protein (GFP) induction, in ILT7 reporter cell lines in response to the ILT7 surface ligation induced by co-culture with human breast cancer cell lines [234]. Moreover they observed a reduction in the TLR9L- mediated IFNα production when pDC where pre-incubated with plate-bound rBST2-Fc protein; which was prevented by blocking anti-ILT7 mAb [234]. These findings led to the idea that when BST2 interacts with ILT7, an intracellular signal cascade is triggered, which negatively regulates pDC activation. To verify this hypothesis we tested the expression of BST2 in circulating PBMC and we tried to induce the cross-linking of ILT7 and to block the interaction with its ligand using the same clones of Ab used by Cao and colleagues in more physiological setting, represented by unsorted human PBMC.
Corroborating the findings presented in the literature, our data confirmed the presence of BST2, on the surface of untreated PBMC, albeit with different levels depending on the cell types, and with the most prominent expression on monocytes [229]. With the exception of mDC, BST2 expression was not affected by in vitro culture, different from what reported for ILT7 (Section 4.2.1). Furthermore, in agreement with data reported in the literature, BST2 expression was found to be modulated by IFNα [234, 245]. A significant upregulation of BST2 was observed in all cell types after TLR7/9L stimulation of PBMC, especially in pDC with the highest increases at low and medium concentration of HIV and TLR7L, rather than at the highest concentration tested. A profile of expression, that followed that of CD83 and IFNα, suggesting that the overstimulation of pDC may results in hyporesponsiveness, possibly caused by BST2-mediated ILT7 cross-linking. However, IDO activity was found to be higher after stimulation with the maximum doses of HIV, suggesting a different modulation or a dysregulation of IDO activity at high concentration of HIV
Nevertheless, our findings collectively cast doubt on the role of BST2 in regulating pDC activity. Thus, we were unable to increase IFNα production and IDO activity by blocking BST2 in primary human leukocytes with the αBST2 Ab (clone 26F8) as shown by Cao and colleagues in an ILT7-reporter system [234]. Different hypotheses were considered to explain this absence of biological effect. We excluded the possibility of poor efficiency of αBST2 Ab binding, as 96% of cells in (BST2
WT) – HEK 293T transfected cell lines showed positive staining for PE-
labelled 26F8 αBST2 Ab. Moreover, the lack of staining in BST2L123P3
-293T cells, confirmed the binding of the αBST2 Ab to the extracellular coiled-coil region of the molecule, which is likely the region of interaction with ILT7. We also discarded the idea that deficit in the biological effect of BST2 was related to poor BST2-ILT7 interactions in vitro. Indeed, no changes in the production of IFNα were revealed even when the possibility of interaction between ILT7 and BST2 were optimized using either a soluble BST2 protein or a co-culture system using purified pDC and
69
HEK 293T cells expressing BST2WT.
Therefore, it is likely that BST2 is not involved the negative regulation of pDC activation in primary leukocytes.
On the other hand, in agreement with the findings of Cao and colleagues [214], pre-treatment of PBMC with XL-ILT7 Ab (clone17G10.2) inhibited IFNα production and IDO activity of AT-2 HIV and/or TLR9L- stimulated pDC. These data, combined with the previous results showing ILT7 downregulation in vitro as part of the pDC differentiation process (Section 4.2), led us to speculate that ILT7 cross-linking may act as a homeostatic mechanism on immature circulating pDC rather than a negative feedback for activated mature pDC. This could be particularly relevant for HIV pathogenesis, during which partial or incomplete pDC maturation is observed [247, 248]. It has been recently shown that ILT7 expression on circulating pDC is reduced in HIV-infected patients in which viral replication is not efficiently controlled by HAART [262]. Therefore it is possible that ILT7 downregulation is a consequence of the partial or incomplete pDC differentiation caused by chronic stimulation during HIV infection. Accordingly Sabado et al. reported that pDC and mDC may relocate to lymphoid tissues already during primary HIV infection, and this redistribution persists throughout the course of disease [180]. However, whether and how ILT7 downregulation may contribute to chronic pDC activation during HIV infection remains unknown.
4.4 BST2 expression on T cells
In Section 4.3, we showed that BST2 is unlikely to be involved in the regulation of pDC activation as we were unable to alter IFNα production and IDO activity using a specific αBST2 Ab (clone 26F8). We postulated that the absence of BST2 biological effect may have been associated with the difficulty to favour the BST2-ILT7 interaction in vitro. However, we were unable to inhibit IFNα secretion by pDC using either a soluble BST2 protein or a co-culture system based on purified pDC and HEK293T cells expressing BST2
WT.
Nevertheless, it can be argued that both systems described above do not represent the physiological conditions in which BST2 may be expressed on the surface of PBMC. Thus, these artificial in vitro systems may lack additional complementary signals between cells that may influence BST2 activity. Therefore, we tested whether other signals may influence BST2 expression and its interaction with ILT7 in a more physiological system. In particular, T cells interact closely with pDC during the immune response, and pDC can either induce T cell tolerance or contribute to the initiation and modulation of T cell responses [263, 264]. T cells showed the lowest expression of BST2 among the cell subsets considered in PBMC, even after stimulation with AT-2 HIV or TLR7/9 agonists (Figure 4.5). Thus, we hypothesised that, during antigen (Ag) presentation to T cells by activated pDC, the combination of signals triggered by IFNα and TCR may induce BST2 upregulation and subsequent ILT7-mediated pDC suppression. Therefore, we tested whether BST2 expression on T cells was regulated by T cell activation via TCR engagement, and whether T cell activation may affect pDC-mediated IFNα production in a BST2-dependent manner.
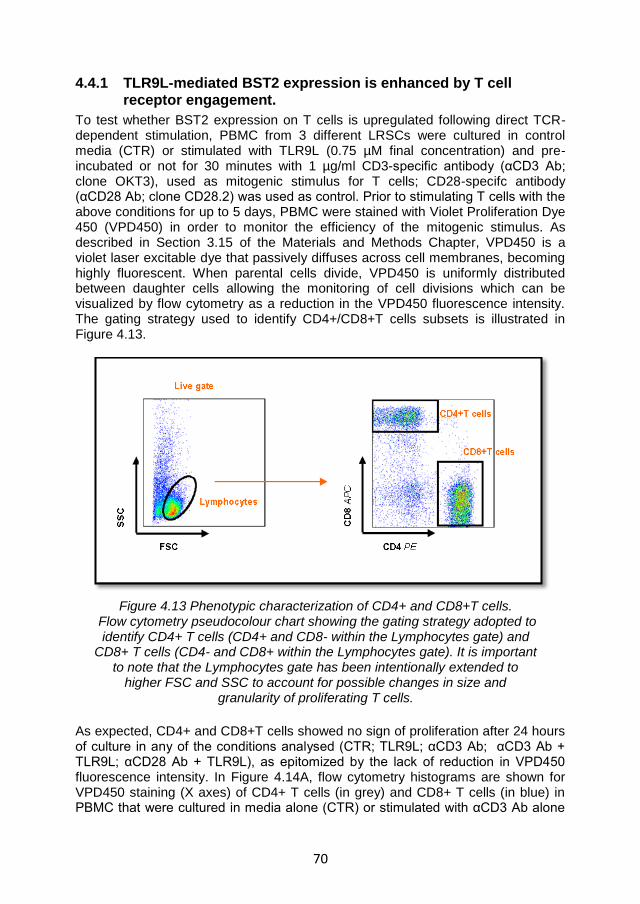
70
4.4.1 TLR9L-mediated BST2 expression is enhanced by T cell receptor engagement.
To test whether BST2 expression on T cells is upregulated following direct TCR-dependent stimulation, PBMC from 3 different LRSCs were cultured in control media (CTR) or stimulated with TLR9L (0.75 µM final concentration) and pre-incubated or not for 30 minutes with 1 µg/ml CD3-specific antibody (αCD3 Ab; clone OKT3), used as mitogenic stimulus for T cells; CD28-specifc antibody (αCD28 Ab; clone CD28.2) was used as control. Prior to stimulating T cells with the above conditions for up to 5 days, PBMC were stained with Violet Proliferation Dye 450 (VPD450) in order to monitor the efficiency of the mitogenic stimulus. As described in Section 3.15 of the Materials and Methods Chapter, VPD450 is a violet laser excitable dye that passively diffuses across cell membranes, becoming highly fluorescent. When parental cells divide, VPD450 is uniformly distributed between daughter cells allowing the monitoring of cell divisions which can be visualized by flow cytometry as a reduction in the VPD450 fluorescence intensity. The gating strategy used to identify CD4+/CD8+T cells subsets is illustrated in Figure 4.13.
Figure 4.13 Phenotypic characterization of CD4+ and CD8+T cells. Flow cytometry pseudocolour chart showing the gating strategy adopted to
identify CD4+ T cells (CD4+ and CD8- within the Lymphocytes gate) and CD8+ T cells (CD4- and CD8+ within the Lymphocytes gate). It is important
to note that the Lymphocytes gate has been intentionally extended to higher FSC and SSC to account for possible changes in size and
granularity of proliferating T cells.
As expected, CD4+ and CD8+T cells showed no sign of proliferation after 24 hours of culture in any of the conditions analysed (CTR; TLR9L; αCD3 Ab; αCD3 Ab + TLR9L; αCD28 Ab + TLR9L), as epitomized by the lack of reduction in VPD450 fluorescence intensity. In Figure 4.14A, flow cytometry histograms are shown for VPD450 staining (X axes) of CD4+ T cells (in grey) and CD8+ T cells (in blue) in PBMC that were cultured in media alone (CTR) or stimulated with αCD3 Ab alone
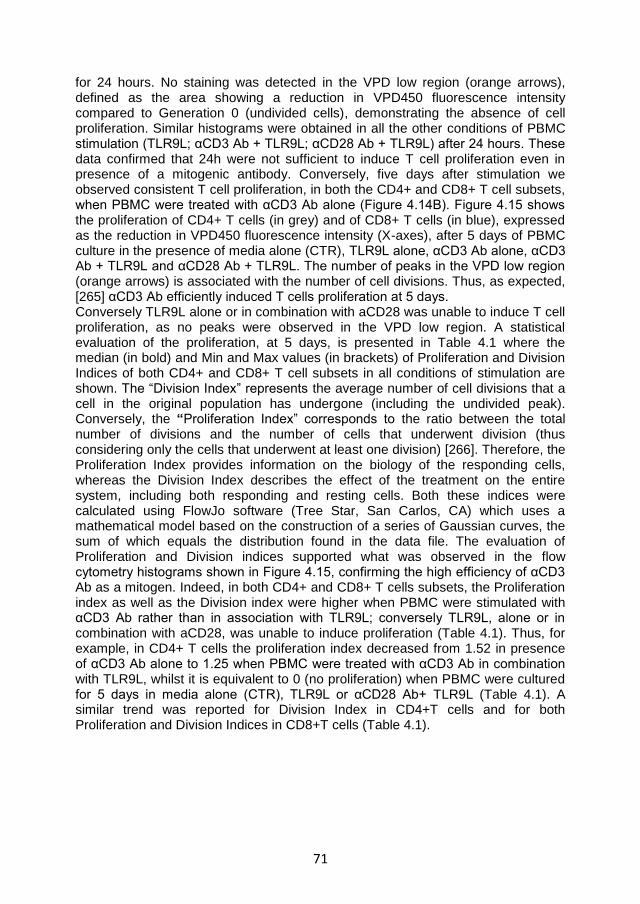
71
for 24 hours. No staining was detected in the VPD low region (orange arrows), defined as the area showing a reduction in VPD450 fluorescence intensity compared to Generation 0 (undivided cells), demonstrating the absence of cell proliferation. Similar histograms were obtained in all the other conditions of PBMC stimulation (TLR9L; αCD3 Ab + TLR9L; αCD28 Ab + TLR9L) after 24 hours. These data confirmed that 24h were not sufficient to induce T cell proliferation even in presence of a mitogenic antibody. Conversely, five days after stimulation we observed consistent T cell proliferation, in both the CD4+ and CD8+ T cell subsets, when PBMC were treated with αCD3 Ab alone (Figure 4.14B). Figure 4.15 shows the proliferation of CD4+ T cells (in grey) and of CD8+ T cells (in blue), expressed as the reduction in VPD450 fluorescence intensity (X-axes), after 5 days of PBMC culture in the presence of media alone (CTR), TLR9L alone, αCD3 Ab alone, αCD3 Ab + TLR9L and αCD28 Ab + TLR9L. The number of peaks in the VPD low region (orange arrows) is associated with the number of cell divisions. Thus, as expected, [265] αCD3 Ab efficiently induced T cells proliferation at 5 days. Conversely TLR9L alone or in combination with aCD28 was unable to induce T cell proliferation, as no peaks were observed in the VPD low region. A statistical evaluation of the proliferation, at 5 days, is presented in Table 4.1 where the median (in bold) and Min and Max values (in brackets) of Proliferation and Division Indices of both CD4+ and CD8+ T cell subsets in all conditions of stimulation are shown. The “Division Index” represents the average number of cell divisions that a cell in the original population has undergone (including the undivided peak). Conversely, the “Proliferation Index” corresponds to the ratio between the total number of divisions and the number of cells that underwent division (thus considering only the cells that underwent at least one division) [266]. Therefore, the Proliferation Index provides information on the biology of the responding cells, whereas the Division Index describes the effect of the treatment on the entire system, including both responding and resting cells. Both these indices were calculated using FlowJo software (Tree Star, San Carlos, CA) which uses a mathematical model based on the construction of a series of Gaussian curves, the sum of which equals the distribution found in the data file. The evaluation of Proliferation and Division indices supported what was observed in the flow cytometry histograms shown in Figure 4.15, confirming the high efficiency of αCD3 Ab as a mitogen. Indeed, in both CD4+ and CD8+ T cells subsets, the Proliferation index as well as the Division index were higher when PBMC were stimulated with αCD3 Ab rather than in association with TLR9L; conversely TLR9L, alone or in combination with aCD28, was unable to induce proliferation (Table 4.1). Thus, for example, in CD4+ T cells the proliferation index decreased from 1.52 in presence of αCD3 Ab alone to 1.25 when PBMC were treated with αCD3 Ab in combination with TLR9L, whilst it is equivalent to 0 (no proliferation) when PBMC were cultured for 5 days in media alone (CTR), TLR9L or αCD28 Ab+ TLR9L (Table 4.1). A similar trend was reported for Division Index in CD4+T cells and for both Proliferation and Division Indices in CD8+T cells (Table 4.1).
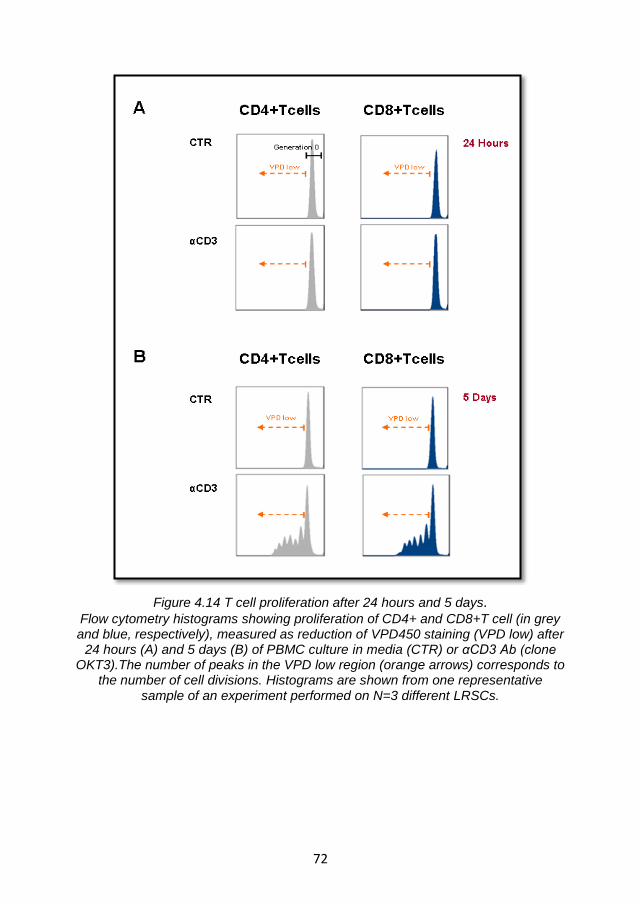
72
Figure 4.14 T cell proliferation after 24 hours and 5 days. Flow cytometry histograms showing proliferation of CD4+ and CD8+T cell (in grey and blue, respectively), measured as reduction of VPD450 staining (VPD low) after
24 hours (A) and 5 days (B) of PBMC culture in media (CTR) or αCD3 Ab (clone OKT3).The number of peaks in the VPD low region (orange arrows) corresponds to
the number of cell divisions. Histograms are shown from one representative sample of an experiment performed on N=3 different LRSCs.
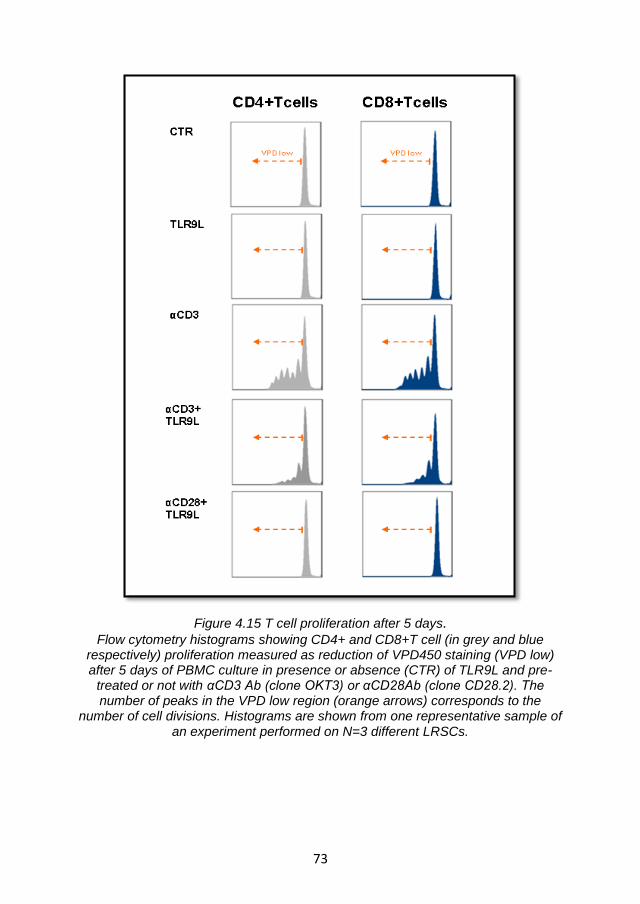
73
Figure 4.15 T cell proliferation after 5 days. Flow cytometry histograms showing CD4+ and CD8+T cell (in grey and blue
respectively) proliferation measured as reduction of VPD450 staining (VPD low) after 5 days of PBMC culture in presence or absence (CTR) of TLR9L and pre-
treated or not with αCD3 Ab (clone OKT3) or αCD28Ab (clone CD28.2). The number of peaks in the VPD low region (orange arrows) corresponds to the
number of cell divisions. Histograms are shown from one representative sample of an experiment performed on N=3 different LRSCs.
74
CTR
TLR9L
αCD3
αCD3+ TLR9L
αCD28+ TLR9L
CD4 Prolif. index
0
0
1.52 (1.36-1.63)
1.25 (1.25-1.51)
0
CD4 Division index
0
0
0.42 (0.27-0.43)
0.20 (0.17-0.39)
0
CD8 Prolif. index
0
0
1.59 (1.58-1.67)
1.56 (1.27-1.66)
0
CD8 Division index
0
0
0.53 (0.39-0.54)
0.51 (0.23-0.25)
0
Table 4.1 Proliferation and Division Indices in CD4+ and CD8+T cells. PBMC isolated from N=3 LRSCs were stained with Violet Proliferation Dye 450
(VPD450) and cultured for 5 days in media alone (CTR) or stimulated with TLR9L. Cells were also pre-treated or not with αCD3 Ab (clone OKT3) or αCD28Ab. The
table shows Median (in bold) and Min and Max value (in brackets) of the Proliferation and Division Indices, calculated using FlowJo software, in CD4+ and
CD8+T cells after 5 days of culture in the different conditions of stimulation.
Once the efficiency of αCD3 Ab (clone OKT3) to stimulate TCR and induce T cell proliferation was confirmed, we verified whether it also influenced the expression of BST2 on T cells, and whether its expression was associated with the degree of T cell proliferation itself. Therefore we measured BST2 expression on T cells in the same experiments described to monitor the proliferation at 24h and 5 days after different stimulation conditions. Cells were stained with AlexaFluor488-conjugate BST2 antibody, in order to evaluate the expression of BST2 on both CD4+ and CD8+ T cells subsets (Figure 4.16). In detail, Figure 4.16 illustrates the frequencies of BST2+ cells in CD4+ T cells (in grey) and in CD8+ T cells (in blue) after 24 hours (Figure 4.16A) and after 5 days (Figure 4.16B) of stimulation in the conditions described above. Confirming the previous data (Figure 4.5C), BST2 expression was found to be very low in unstimulated T cells (CTR) (1% and 2% in CD4+T cells and CD8+T cells, respectively) and was modestly upregulated after overnight incubation with TLR9L, increasing up to 7% and 25% in CD4+T cells and CD8+T cells respectively (Figure 4.16A). Interestingly, after 24 hours, even in the absence of detectable T cell proliferation (Figure 4.14A), αCD3 stimulation was sufficient to induce partial upregulation of BST2 expression, on both T cell subsets.
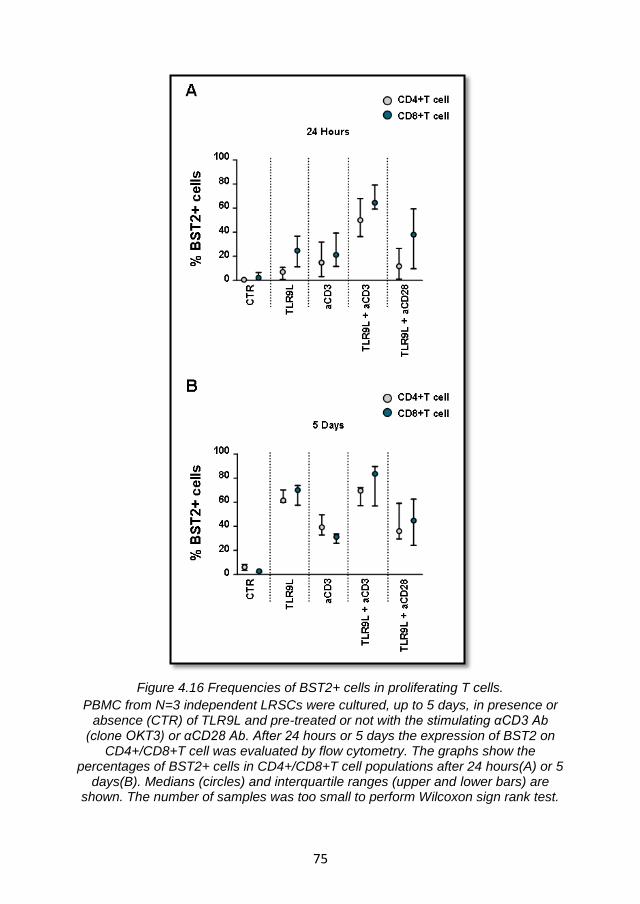
75
Figure 4.16 Frequencies of BST2+ cells in proliferating T cells.
PBMC from N=3 independent LRSCs were cultured, up to 5 days, in presence or absence (CTR) of TLR9L and pre-treated or not with the stimulating αCD3 Ab
(clone OKT3) or αCD28 Ab. After 24 hours or 5 days the expression of BST2 on CD4+/CD8+T cell was evaluated by flow cytometry. The graphs show the
percentages of BST2+ cells in CD4+/CD8+T cell populations after 24 hours(A) or 5 days(B). Medians (circles) and interquartile ranges (upper and lower bars) are
shown. The number of samples was too small to perform Wilcoxon sign rank test.
76
Similar to what observed after TLR9L stimulation, αCD3 caused an increase in the frequencies of BST2+ cells to 15% and 21% in CD4+ T cells and CD8+ T cells respectively (Figure 4.16A). Moreover, when TLR9L and αCD3 Ab were used together, we observed a higher upregulation of BST2 expression by both CD4+ and CD8+ T cells after 24h than with either stimulus alone (50% and 65% respectively). These data suggest a synergistic effect of TCR stimulation and TLR7/9L-induced IFN-I signalling. αCD28 Ab, used as control, did not synergize with TLR9L (Figure 4.16A). After 5 days the effect on BST2 expression, of both TLR9L and αCD3 Ab used alone, was higher in comparison to 24 hours. Following TLR9L stimulation, the frequencies of BST2+ cells increased up to 62% and 70% in CD4+T cells and CD8+T cells subset, respectively. Following αCD3 Ab stimulation, BST2+ T cells raised up to 39% and 31% in CD4+T cells and CD8+T cells, respectively (Figure 4.16B). These increases may be associated to other IFNα-independent TLR9-mediated pathways or a consequence of T cell proliferation after TCR-engagement. Nonetheless, when TLR9L and αCD3 Ab were used together, they further increased the frequencies of BST2+ cells (70% and 84% in CD4+ T cells and CD8+ T cells subset respectively), even though this synergic effect was less striking than that observed at 24 hours.
Collectively these data suggest that TLR9L-mediated BST2 expression is enhanced by TCR engagement, as after 24 hours of stimulation we observed a synergist effect of TLR9L and αCD3 Ab, resulting in elevated frequencies of BST2+ cells in both CD4+ and CD8+ T cells. However, after 5 days of stimulation, it is possible that BST2 increases may be also a result of IFNα-independent mechanisms. Another possible explanation is that the engagement of TCR may accelerate the TLR9L- induced upregulation of BST2. When TLR9L was used alone, indeed, we observed an increase up to 62% and 70% in CD4+ T cells and CD8+ T cells subset respectively, only after 5 days of culture; comparable levels of BST2 upregulation (50% and 65% CD4+ T cells and CD8+ T cells subset, respectively) were instead observed already after 24 hours of TLR9L stimulation when PBMC were pre-treated with αCD3 Ab
4.4.2 Enhancement of TLR9L- mediated BST2 expression by T cell receptor engagement is not sufficient to suppress IFNα production via ILT7 cross-linking
In order to confirm the synergistic effect of TCR and TLR9 engagement on BST2 expression on T cells after 24 hours of stimulation, we repeated the previous experiment using a different clone of the αCD3 Ab, the clone HIT3a also known for its mitogenic properties. Therefore PBMC isolated from N=6 independent donors were cultured overnight, in media alone (CTR) or stimulated with TLR9L (0.75 µM final concentration) or αCD3 Ab clone HIT3a (1µg/ml final concentration) alone or in combination. CD28-specific antibody (αCD28 Ab; 1µg/ml final concentration) was used as control. As expected both TLR9L and αCD3 Ab-clone HIT3a used alone induced a partial but statistically significant upregulation of BST2 expression in both CD4+ and CD8+ T cells compared to unstimulated PBMC (Figure 4.17A). The frequencies of the BST2+ cells rose from 1% to 24% and 39% in CD4+ T cells and CD8+ T cells respectively following TLR9L stimulation (p=0.028 Wilcoxon sign rank test), and up to 36% and 32% in CD4+ T cells and CD8+ T cells subsets respectively following αCD3 Ab stimulation (for both p=0.028 Wilcoxon sign rank
77
test) (Figure 4.17A). Moreover when used together, a further upregulation in BST2+ cells frequencies was observed, reaching 73% and 78% in CD4+T cell and CD8+T cells, respectively. BST2 upregulation in response to TLR9L + αCD3 Ab-clone HIT3a was significantly higher compared to either TLR9L or αCD3 Ab-clone HIT3a used alone (in all p=0.028 Wilcoxon sign rank test); αCD28 Ab did not synergize with TLR9L (Figure 4.17A).
Since we demonstrated that the incubation of PBMC with TLR9L and TCR- stimulating αCD3 Ab (clone OKT3 or HIT3a; Figure 4.16A and Figure 4.17A) significantly enhanced BST2, we tested whether TLR9L-induced IFNα production may be inhibited in these conditions. Consequently, PBMC isolated from N=6 independent donors were cultured overnight in presence or absence (CTR) of TLR9L (0.75 µM final concentration) or αCD3 Ab (clone HIT3a; 1µg/ml final concentration) alone or in combination, and pre-treated or not with αBST2 Ab (clone 26F8) for 30 minutes before stimulation. The levels of IFNα in culture supernatants were tested by ELISA after 24h culture. As shown in Figure 4.17B, TLR9L induced a significant increase in IFNα production compared to untreated cells (p=0.028 Wilcoxon sign rank test). Surprisingly, a significant increase in IFNα secretion, albeit of modest intensity compared to TLR9L, was observed also after TCR stimulation by αCD3 Ab (HIT3a) (p=0.027 Wilcoxon sign rank test). However, when TLR9L and αCD3 Ab were used together, the effect of TLR9L on IFNα production was predominant, and no differences were observed compared to TLR9L alone (Figure 4.17B). Moreover the αBST2 Ab did not affect IFNα level, as no differences were observed compared to TLR9L alone (Figure 4.17B). These data support our previous observations indicating that BST2 is not involved in the negative regulation of pDC activation.
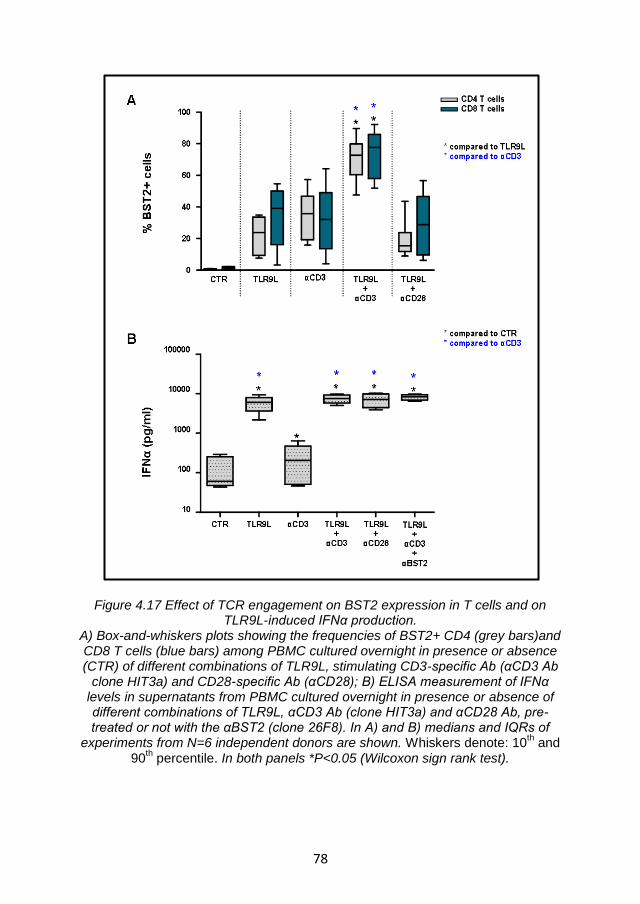
78
Figure 4.17 Effect of TCR engagement on BST2 expression in T cells and on TLR9L-induced IFNα production.
A) Box-and-whiskers plots showing the frequencies of BST2+ CD4 (grey bars)and CD8 T cells (blue bars) among PBMC cultured overnight in presence or absence (CTR) of different combinations of TLR9L, stimulating CD3-specific Ab (αCD3 Ab
clone HIT3a) and CD28-specific Ab (αCD28); B) ELISA measurement of IFNα levels in supernatants from PBMC cultured overnight in presence or absence of different combinations of TLR9L, αCD3 Ab (clone HIT3a) and αCD28 Ab, pre-treated or not with the αBST2 (clone 26F8). In A) and B) medians and IQRs of
experiments from N=6 independent donors are shown. Whiskers denote: 10th and
90th percentile. In both panels *P<0.05 (Wilcoxon sign rank test).
79
In summary our data confirm the role of TCR engagement in BST2 expression but, as no reduction of IFNα was detected in any condition analyzed (Fig. 4.17B), we conclude that even under conditions of maximum BST2 expression, T lymphocytes do not downregulate pDC activation by engaging ILT7.
4.4.3 Summary and discussion
It has been recently shown that BST2, interacting with ILT7, may play an important role in the negative regulation of pDC activation [211, 234]. However, our findings collectively ague against this hypothesis, since we were unable to increase IFNα production and IDO activity by blocking BST2 with the αBST2 Ab (clone 26F8) as described in Section 4.3 of the Results Chapter. We considered the possibility that BST2-ILT7 interactions may not be favoured in the in vitro culture system studied. However, using a soluble BST2 protein or a co-culture system with BST2-transfected cells, we were still incapable of detecting changes in IFNα levels (Section 4.3.6), supporting the idea that BST2 may not be involved in the downregulation of pDC activation. Nevertheless, we wanted to test whether other signals may influence BST2 expression on PBMC therefore favouring its interaction with ILT7 in a more physiological system. The interaction between pDC and T cells plays an important role during the initiation and modulation of the immune response. Therefore, we focused our attention on the T cell population, which we previously found to express the lowest level of BST2 among PBMC, even after TLR7/9 stimulation (Figure 4.5). In particular we verified whether T cell activation via TCR engagement affected BST2 expression and favoured its interaction with ILT7, therefore suppressing pDC activation. In order to stimulate TCR, we incubated total PBMC with either of two clones of αCD3 Ab, OKT3 or HIT3a, both well known for their ability to interact with the TCR resulting in cell proliferation [265, 267]. Interestingly, we found that the frequency of BST2+ cells significantly increased as a consequence of TCR engagement. This effect was amplified in the presence of TLR9 stimulation, especially after 24 hours of stimulation, indicating a synergic effect between TLR9L-induced IFNα and TCR engagement on BST2 expression by both CD4+ and CD8+ T cells. After 5 days of stimulation, BST2 expression was further increased compared to 24h even when TLR9L and αCD3 Ab were used alone, possibly as a consequence of other TLR9L mediate pathways and T cell proliferation. Therefore, the synergistic effect between TLR9L and αCD3 Ab, even if visible, was less intense. However, although BST2 expression was maximum after 24h of stimulation due to the effects of TCR and TLR9 engagement, αBST2 Ab (clone 26F8) showed no effect IFNα production. Hence, BST2 did not downregulate pDC activation by engaging ILT7 even when expressed at high levels in T cells in a mixed leukocyte culture. These data provide additional argument against the hypothesis suggested by Cao and colleagues [211, 234].
80
4.5 BST2 expression may be modulated by cytokines involved in the regulation of inflammatory responses
Based on the data presented in Section 4.4.1, we hypothesized that signals other than IFNα may affect BST2 expression. Therefore, we verified whether the suppression of BST2-mediated pDC activation may rely on secondary signals, provided by proinflammatory or immunoregulatory cytokines present in the microenvironment. Accordingly, we first investigated the direct effects of different cytokines on BST2 expression in PBMC and their effects on TLR9L-induced BST2 upregulation. Second, we tested whether these cytokines influenced IFNα production through a BST2-ILT7 mediated pathway. For this purpose we chose four cytokines: one involved in the response against virus and intracellular pathogen (IFNγ) [268], one promoting the differentiation of naive CD4
+ T cells into
helper Th2 cells (IL4) [269], one proinflammatory (TNFα) [270], and one immunosuppressive (IL10) [271] as example of cytokines involved in the regulation of inflammatory responses in different conditions.
4.5.1 Modulation of BST2 expression on PBMC by pro- and anti-inflammatory cytokines
In order to test whether BST2 expression may be regulated by signals implicated in inflammatory responses, PBMC isolated from 6 independent LRSCs were pre-incubated for two hours with, or without (none), one of the following cytokines: IFNγ (1000 U/ml), IL4 (1000 U/ml), IL10 (10 ng/ml) or TNFα (10 ng/ml). After two hours, PBMC were stimulated or not (CTR) with TLR9L (0.75µM final concentration). After overnight incubation the frequency of BST2+ cells and BST2 MFI in the different cell subsets were evaluated by flow cytometry (Figure 4.18). In the absence of TLR9L stimulation we observed significant changes in the frequency of BST2+ cells only in the pDC subset. In particular, the frequency of BST2+ pDC significantly increased, from a median of 29% (CTR) to median of 62% and 57% in presence of IFNγ and TNFα respectively.(p=0.028 for IFNγ and p=0.027 for TNFα, Wilcoxon sign rank test; Figure 4.18A). However, these increases were overcome by TLR9L stimulation (Figure 4.18A). Indeed, in all the cell types analysed (pDC, mDC, monocytes, B and T cells), no significant differences in the frequency of BST2+ cells was observed in TLR9L-stimulated PBMC subsets in presence or absence (white bars) of different cytokines (Figure 4.18A showing the frequency of BST2+ pDC after TLR9L stimulation as a representative example). Nevertheless, analysing the MFI of anti-BST2 Ab staining, we noticed significant alterations in the number of BST2 proteins per-cell in some of the cell populations that were pre-incubated with cytokines. In detail, pre-treatment with IL4 significantly reduced the TLR9L-induced upregulation of BST2 in mDC by approximately 20% (p=0.028; Wilcoxon sign rank test; Figure 4.18B). A similar trend was observed in monocytes, in which pre-incubation with IFNγ, IL4 and TNFα significantly reduced the TLR9L-induced upregulation of BST2 by approximately 50%, 40% and 10% respectively (in all p=0.028; Wilcoxon sign rank test ; Figure 4.18B).Surprisingly, pre-incubation with IL-10 further enhanced TLR9L-mediated BST2 upregulation on monocytes (Figure 4.18B). In all the other considered cell types (pDC, B and T cells), pre-treatment with any of the cytokines tested did not affect BST2 MFI on TLR9L-stimulated PBMC subsets (Figure 4.18B).
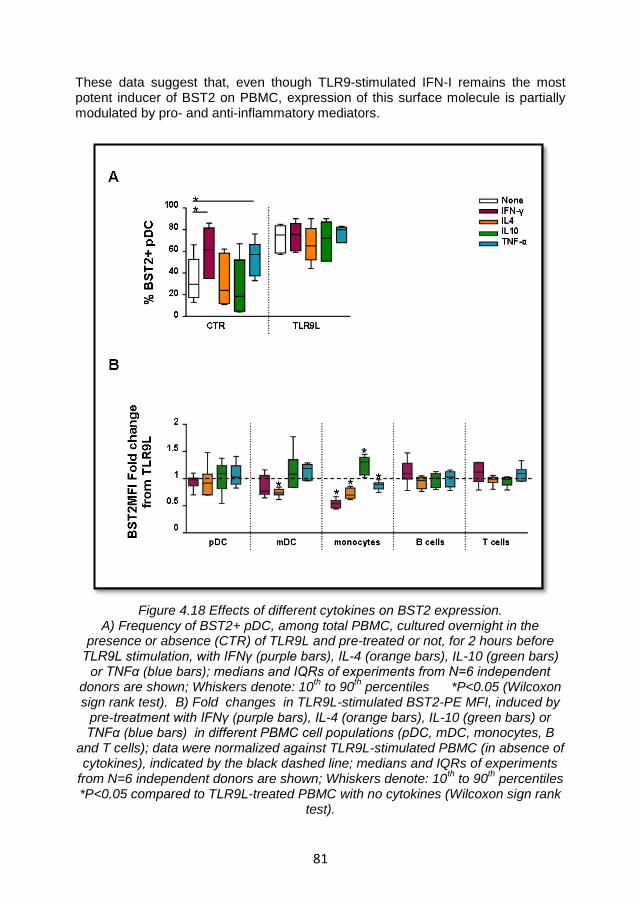
81
These data suggest that, even though TLR9-stimulated IFN-I remains the most potent inducer of BST2 on PBMC, expression of this surface molecule is partially modulated by pro- and anti-inflammatory mediators.
Figure 4.18 Effects of different cytokines on BST2 expression. A) Frequency of BST2+ pDC, among total PBMC, cultured overnight in the
presence or absence (CTR) of TLR9L and pre-treated or not, for 2 hours before TLR9L stimulation, with IFNγ (purple bars), IL-4 (orange bars), IL-10 (green bars)
or TNFα (blue bars); medians and IQRs of experiments from N=6 independent donors are shown; Whiskers denote: 10
th to 90
th percentiles *P<0.05 (Wilcoxon
sign rank test). B) Fold changes in TLR9L-stimulated BST2-PE MFI, induced by pre-treatment with IFNγ (purple bars), IL-4 (orange bars), IL-10 (green bars) or TNFα (blue bars) in different PBMC cell populations (pDC, mDC, monocytes, B
and T cells); data were normalized against TLR9L-stimulated PBMC (in absence of cytokines), indicated by the black dashed line; medians and IQRs of experiments
from N=6 independent donors are shown; Whiskers denote: 10th to 90
th percentiles
*P<0.05 compared to TLR9L-treated PBMC with no cytokines (Wilcoxon sign rank test).
82
4.5.2 Inflammatory mediators affect IFNα production but not through the BST2/ILT7 pathway
Since BST2 MFI on monocytes was higher when cells were pre-treated with IL-10
before TLR9L stimulation compared to TLR9L stimulation alone (Figure 4.18B), we questioned whether ILT7/BST2-mediated suppression of IFNα would be favoured in presence of IL-10. Consequently, we tested IFNα production in the supernatants of the cell cultures described in section 4.5.1; i.e. PBMC isolated from N=6 independent LRSCs, pre-treated or not with IFNγ, TNFα, IL4 and IL10 and cultured overnight in presence or absence of TLR9L. In addition, the same cultures were all conducted with PBMC pre-incubated (30 min before TLR9L stimulation) or not with the αBST2 Ab (5 µg/ml final concentration) or isotype control antibody (5 µg/ml final concentration). At the end of the incubation we measured the levels of IFNα in culture supernatants by ELISA (Figure 4.19). As shown in Figure 4.19A, no IFNα production was observed in the absence of TLR9L stimulation (below the detection threshold of the ELISA kit). Conversely, stimulation with TLR9L induced statistically significant IFNα production in both untreated and cytokines-pre-treated PBMC (in all p=0.028 Wilcoxon sign rank test; Figure 4.19A). Interestingly, IFNα production in response to TLR9L was significantly lower when PBMC were pre-treated with IL-10 and TNFα (reduction of approximately 70% and 20% respectively, for both p=0.028 Wilcoxon sign rank test) compared to cells that were stimulated with TLR9L only (Figure 4.19A and 4.19B). However the inhibitory effects of IL10 and TNFα did not appear to be mediated by BST2-ILT7 interaction as the levels of IFNα were not restored in presence of αBST2 Ab (Figure 4.19A and 4.19B). In detail, no significant differences in IFNα production were observed when IL-10 pre-treated PBMC were stimulated with TLR9 alone or pre-incubated with αBST2 Ab or the isotype control Ab (Figure 4.19B). Instead, pre-incubation with αBST2 Ab and TNFα significantly reduced the levels of IFNα when compared to the cells simulated with TLR9L and TNFα only (p=0.028 Wilcoxon sign rank test). This effect appeared not to be BST2 specific, because, a similar trend was observed in the presence of the isotype control Ab, even though it did not reach statistical significance.
In conclusion, these data indicate that both immunosuppressive and proinflammatory cytokines, IL10 and TNFα respectively, exert an inhibitory effect on TLR9L-stimulated pDC-mediated IFNα production. However they act through a mechanism that is not related to the pathway mediated by BST2 and ILT7.
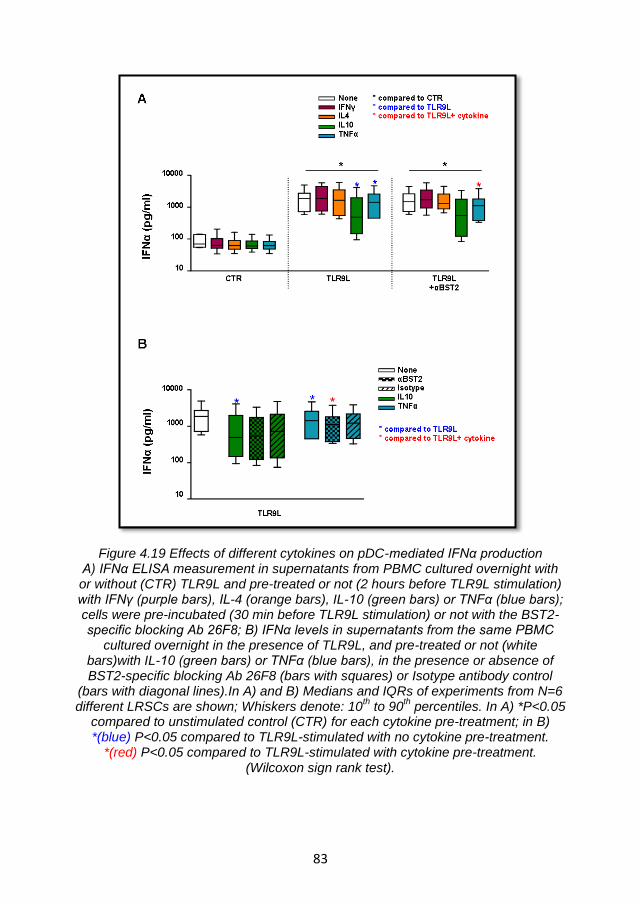
83
Figure 4.19 Effects of different cytokines on pDC-mediated IFNα production A) IFNα ELISA measurement in supernatants from PBMC cultured overnight with or without (CTR) TLR9L and pre-treated or not (2 hours before TLR9L stimulation) with IFNγ (purple bars), IL-4 (orange bars), IL-10 (green bars) or TNFα (blue bars); cells were pre-incubated (30 min before TLR9L stimulation) or not with the BST2-specific blocking Ab 26F8; B) IFNα levels in supernatants from the same PBMC
cultured overnight in the presence of TLR9L, and pre-treated or not (white bars)with IL-10 (green bars) or TNFα (blue bars), in the presence or absence of BST2-specific blocking Ab 26F8 (bars with squares) or Isotype antibody control
(bars with diagonal lines).In A) and B) Medians and IQRs of experiments from N=6 different LRSCs are shown; Whiskers denote: 10
th to 90
th percentiles. In A) *P<0.05
compared to unstimulated control (CTR) for each cytokine pre-treatment; in B) *(blue) P<0.05 compared to TLR9L-stimulated with no cytokine pre-treatment.
*(red) P<0.05 compared to TLR9L-stimulated with cytokine pre-treatment. (Wilcoxon sign rank test).
84
4.5.3 Summary and discussion
All the data collected and presented in the previous Results sections indicated that BST2 may not be involved in the suppression of pDC activation. However it remains plausible that secondary signals may be necessary to induce the inhibition of pDC activation by BST2/ILT7. In Section 4.4.1, we showed that other IFNα independent signals may affect BST2 expression on T cells. Therefore, we tested whether inflammatory mediators, involved in the modulation of innate immune responses, may provide the secondary signals required for the BST2-mediated inhibition of pDC activation. In particular, we selected four cytokines involved in different aspects of immune regulation: IL4, a cytokine involved in the differentiation and function of CD4+ Th2 cells [269]; IFNγ, produced by NK cells,
Th1 cells and CD8 cytotoxic T lymphocytes and involved in the immune response against viruses and intracellular pathogens [268]; TNFα, a pro-inflammatory cytokine which is produced by macrophages, CD4 T cells and NK cells and stimulates the acute phase reaction [270]; and IL10, a cytokine mainly produced by monocytes and lymphocytes, with pleitropic effects in the immune response but known especially for its immunosuppressive properties [271]. We found that BST2 expression following TLR9L stimulation was partially modulated by the above cytokines in some cell subsets. In particular, IL10 enhanced the number of BST2 molecules per cell in TLR9L-stimulated monocytes. Nonetheless, IFNα produced by activated pDC remained the main inducer of BST2 expression on PBMC. Moreover, IL10 suppressed IFNα production induced by TLR9L in activated pDC. The anti-inflammatory properties of IL10, combined with its ability to increase BST2 expression on monocytes and suppress IFNα production suggested that the BST2/ILT7 pathway might have been involved in the modulation of IFNα production. However, the blocking of BST2 using the BST2-specific Ab (clone 26F8) did not revert the inhibitory effect on IFNα responses mediated by IL10. Therefore, it is likely that IL10 inhibits IFNα production through a mechanism that is independent of the BST2/ILT7–mediated pathway. TNFα also caused a reduction in TLR9L-induced IFNα responses, albeit to a lower degree than what observed for IL10. However, different from IL10, TNFα caused a mild reduction in the expression of BST2 on monocytes. These data suggest that BST2 is not involved in the negative regulation of pDC activation by TNFα, as confirmed by the fact that the blocking of BST2 did not affect the TNFα-mediated reduction of IFNα production. Finally the inability of BST2 to suppress pDC activation was confirmed by the fact that while IFNγ reduced TLR9L-induced BST2 on mDC, and IL4 reduced BST2 on both mDC and monocytes, none of these cytokines was able to inhibit TLR9L-induced production of IFNα. In conclusion, our data indicate that even in presence of cytokines which regulate immune responses and modulate BST2 expression on PBMC, BST2 was not involved in the suppression of pDC activation and IFNα production. These data are in clear contrast with the findings reported by Cao and colleagues [234].
85
5 CONCLUSIONS
Our data confirmed that ILT7 is exclusively expressed by pDC, among freshly isolated PBMC. However, it is rapidly downregulated upon in vitro culture as part of the differentiation process of pDC, independently of stimulation with AT-2 HIV or TLR7/9L. Indeed, the downregulation of ILT7 coincided with increased morphological complexity and upregulation of the homing marker CCR7 in cultured pDC; even though their full activation and maturation, epitomized by increased CD83 expression, only occurred following TLR stimulation. Thus the differentiation of freshly isolated pDC in vitro may be defined as a two step process: a first spontaneous step characterized by ILT7 downmodulation, changes in the morphology and partial acquisition of lymph node homing properties, leading to the generation of immature pDC; and a second step, triggered by TLR7/9 stimulation, which promotes full maturation and IFN-α production.
BST2 expression is not affected by in vitro culture. It is expressed, at different degrees, on the surface of all PBMC subsets analyzed and it is mainly modulated by TLR7/9-mediate IFNα production. In pDC, BST2 expression peaks at intermediate stimuli concentrations but is modestly increased at maximum concentrations, following the same profile of CD83 expression and IFNα production. This suggests that overstimulation of pDC may result in hyporesponsiveness, which we initially hypothesized may be at least in part due to BST2-mediated ILT7 cross-linking. Following stimulation with higher HIV doses, instead, IDO activity still increased suggesting the involvement of a different pathway of modulation or the dysregulation of IDO at high doses of HIV.
Our data argue against the role of the ILT7/BST2-mediated pathway in the negative regulation of activated pDC. On one side we were able to inhibit TLR9L- and HIV-induced IFNα production as well as HIV-induced IDO activity by pre-treating PBMC with an ILT7 cross-linking antibody (17G10.2). On the other side, however, we were unable to increase either IFNα production or IDO activity by blocking BST2 in the same cell cultures with the αBST2 Ab (clone 26F8). We considered and tested different hypotheses for the lack of biological effect of BST2. We first discarded the possibility that our negative results were due to poor efficiency of αBST2 Ab binding. We verified and confirmed the antibody-binding efficiency using PE-labelled 26F8 αBST2 Ab to stain BST2-transfected HEK 293T cell lines. In the same experimental setting, we demonstrated that the αBST2 Ab binds the extracellular coiled-coil region of the BST2 (the region likely involved in the interaction with ILT7). Moreover, when we optimized ILT7-BST2 interactions using either a soluble BST2 protein or a co-culture system based on purified pDC and BST2
WT transfected HEK 293T cells, we were unable to produce any change
in IFNα production. These results argue against the possibility that the observed lack of BST2-mediated regulation of pDC is due to poor or inefficient BST2-ILT7 interaction in vitro.
Thus, our data indicated that BST2 is not sufficient to suppress of pDC activation. Therefore, we investigated the possibility that complementary signals may be involved in the regulation of BST2 expression and activity. During a viral infection, pDC may act both as IFN-producing cells and as antigen-presenting cells. When antigen specific -T cells come in contact with activated pDC, they may upregulate
86
BST2 following TCR engagement and IFNα signalling, thus suppressing pDC activation thought ILT7 interaction. We showed that direct TCR engagement in addition to TLR9L-mediated IFNα production, is required to achieve maximum BST2 expression on T cells. However, even when BST2 was expressed at high levels on T cells, we were unable to enhance IFNα responses using the BST2-blocking antibody in a mixed leukocyte culture. Similarly, we showed that BST2 did not exert negative regulation of pDC activation even in the presence of second signals provided by cytokines involved in the regulation of innate and adaptive immune responses. Although BST2 expression was mildly modulated by IL4, IL10, IFNγ and TNFα, particularly in monocytes, we found that only IL10 and, albeit modestly, TNFα, inhibited TLR9L-induced IFNα production. However, even in this case, BST2 blockade was ineffective to restore IFNα responses.
We cannot exclude that the interaction between ILT7 and BST2 occurs in vivo, maybe in the lymph node compartments, and that this interaction may not be reproducible in vitro. However, in light of our finding, it is tempting to speculate that ILT7 cross-linking may act as a homeostatic mechanism on circulating pDC rather than a negative feedback for activated mature pDC. This could be particularly relevant for HIV pathogenesis, during which partial or incomplete pDC maturation is observed. Reduction of ILT7 expression as a consequence of partial or incomplete pDC maturation could affect BST2-ILT7 homeostasis and favour chronic and uncontrolled pDC activation in HIV+ patients. Thus, the exploitation of this regulatory system for therapeutic purposes is an intriguing possibility that needs to be evaluated. Biological immunotherapy is the treatment of diseases with antibodies specific for ligands which modulate immune responses, such as infliximab (anti-TFN-a Ab). This approach is showing increasing success in the treatment of chronic diseases such as cancers and chronic inflammatory diesease. Thus, antibodies promoting the cross-linking of ILT7, which reduce pDC activation, may be employed for immunotherapy in HIV+ patients.
Further studies need to be conducted in order to test the effective role of BST2 in regulating pDC activation. It is possible that other unknown ligands may induce the cross-linking of ILT7. Other studies are necessary to evaluate whether the expression of ILT7 varies among pDC in different anatomic locations, such as mucosal and lymphoid tissues, and whether ILT7 cross-linking may differentially regulate IFN-α production and IDO activity during HIV infection. Finally, should a role for BST2 in cross-linking ILT7 be confirmed in other experimental systems or in vivo, it would be important to investigate how the ILT7/BST2 homeostasis may be altered during HIV-1 infection by testing the ability of Vpu to prevent BST2- mediated pDC downregulation.
87
REFERENCES
1. Wain-Hobson S., Sonigo P., Danos O., Cole S., Alizon M., "Nucleotide sequence of the AIDS virus, LAV", Cell, Vol. 40, no. 1, 1985, pp. 9-17.
2. Barre-Sinoussi F., Chermann J.C., Rey F., Nugeyre M.T., Chamaret S., Gruest J., Dauguet C., Axler-Blin C., Vezinet-Brun F., Rouzioux C., Rozenbaum W., Montagnier L., "Isolation of a T-lymphotropic retrovirus from a patient at risk for acquired immune deficiency syndrome (AIDS)", Science, Vol. 220, no. 4599, 1983, pp. 868-871.
3. Gallo R.C., Sarin P.S., Gelmann E.P., Robert-Guroff M., Richardson E., Kalyanaraman V.S., Mann D., Sidhu G.D., Stahl R.E., Zolla-Pazner S., Leibowitch J., Popovic M., "Isolation of human T-cell leukemia virus in acquired immune deficiency syndrome (AIDS)", Science, Vol. 220, no. 4599, 1983, pp. 865-867.
4. Gottlieb M.S., Schroff R., Schanker H.M., Weisman J.D., Fan P.T., Wolf R.A., Saxon A.,"Pneumocystis carinii pneumonia and mucosal candidiasis in previously healthy homosexual men: evidence of a new acquired cellular immunodeficiency", New England Journal of Medicine, Vol. 305, no. 24, 1981, pp. 1425-1431.
5. " Kaposi's sarcoma and Pneumocystis pneumonia among homosexual men--New York City and California", MMWR Morbidity and Mortality Weekly Report, Vol. 30, no. 25, 1981, pp. 305-308.
6. Varthalitis I., Meunier F., "Pneumocystis carinii pneumonia in cancer patients", Cancer Treatment Reviews, Vol. 19, no. 4, 1993, pp. 387-413.
7. "Pneumocystis pneumonia--Los Angeles", MMWR Morbidity and Mortality Weekly Report, Vol. 30, no. 21, 1981, pp. 250-252.
8. "Epidemiologic aspects of the current outbreak of Kaposi's sarcoma and opportunistic infections", New England Journal of Medicine, Vol. 306, no. 4, 1982, pp. 248-252.
9. Gallo R.C., "A reflection on HIV/AIDS research after 25 years", Retrovirology, Vol. 3, 2006, pp. 72.
10. "Update on acquired immune deficiency syndrome (AIDS)--United States", MMWR Morbidity and Mortality Weekly Report, Vol. 31, no. 37, 1982, pp. 507-4.
11. Montagnier L., "Historical essay. A history of HIV discovery", Science, Vol. 298, no. 5599, 2002, pp. 1727-1728.
12. Merson M.H., O'Malley J., Serwadda D., Apisuk C., "The history and challenge of HIV prevention", Lancet, Vol. 372, no. 9637, 2008, pp. 475-488.
13. UNAIDS REPORT 2011. GLOBAL HIV/AIDS RESPONSE Epidemic update and health sector progress towards Universal Access
88
(http://www.unaids.org/en/media/unaids/contentassets/documents/unaidspublication/2011/20111130_UA_Report_en.pdf).
14. Sharp P.M., Hahn B.H., "Origins of HIV and the AIDS Pandemic", Cold Spring Harbor Perspectives in Medicine, Vol. 1, no. 1, 2011, pp. a006841.
15. Huet T., Cheynier R., Meyerhans A., Roelants G., Wain-Hobson S., "Genetic organization of a chimpanzee lentivirus related to HIV-1", Nature, Vol. 345, no. 6273, 1990, pp. 356-359.
16. Hirsch V.M., Olmsted R.A., Murphey-Corb M., Purcell R.H., Johnson P.R., "An African primate lentivirus (SIVsm) closely related to HIV-2", Nature, Vol. 339, no. 6223, 1989, pp. 389-392.
17. Taylor B.S., Sobieszczyk M.E., McCutchan F.E., Hammer S.M., "The challenge of HIV-1 subtype diversity", New England Journal of Medicine, Vol. 358, no. 15, 2008, pp. 1590-1602.
18. Reeves J.D., Doms R.W., "Human immunodeficiency virus type 2", Journal of General Virology, Vol. 83, no. Pt 6, 2002, pp. 1253-1265.
19. Sierra S., Kupfer B., Kaiser R., "Basics of the virology of HIV-1 and its replication", Journal of Clinical Virology, Vol. 34, no. 4, 2005, pp. 233-244.
20. Zhu P., Liu J., Bess J., Jr., Chertova E., Lifson J.D., Grise H., Ofek G.A., Taylor K.A., Roux K.H., "Distribution and three-dimensional structure of AIDS virus envelope spikes", Nature, Vol. 441, no. 7095, 2006, pp. 847-852.
21. Robinson H.L., "New hope for an AIDS vaccine", Nature Reviews Immunology, Vol. 2, no. 4, 2002, pp. 239-250.
22. Krogstad P., "Molecular biology of the human immunodeficiency virus: current and future targets for intervention", Seminars in Pediatric Infectious Diseases, Vol. 14, no. 4, 2003, pp. 258-268.
23. Greene W.C., Peterlin B.M., "Charting HIV's remarkable voyage through the cell: Basic science as a passport to future therapy", Nature Medicine, Vol. 8, no. 7, 2002, pp. 673-680.
24. Tang H., Kuhen K.L., Wong-Staal F., "Lentivirus replication and regulation", Annual Review of Genetics, Vol. 33, 1999, pp. 133-170.
25. Marchand C., Johnson A.A., Semenova E., Pommier Y., "Mechanisms and inhibition of HIV integration", Drug Discovery Today Disease Mechanisms, Vol. 3, no. 2, 2006, pp. 253-260.
26. Fanales-Belasio E., Raimondo M., Suligoi B., Butto S., "HIV virology and pathogenetic mechanisms of infection: a brief overview", Annali dell Istituto Superiore di Sanita, Vol. 46, no. 1, 2010, pp. 5-14.
27. Ho D.D., Rota T.R., Hirsch M.S., "Infection of monocyte/macrophages by human T lymphotropic virus type III", Journal of Clinical Investigation, Vol. 77, no. 5, 1986, pp. 1712-1715.
28. Cao Y.Z., Dieterich D., Thomas P.A., Huang Y.X., Mirabile M., Ho D.D., "Identification and quantitation of HIV-1 in the liver of patients with AIDS", AIDS, Vol. 6, no. 1, 1992, pp. 65-70.
89
29. Donaldson Y.K., Bell J.E., Holmes E.C., Hughes E.S., Brown H.K., Simmonds P., "In vivo distribution and cytopathology of variants of human immunodeficiency virus type 1 showing restricted sequence variability in the V3 loop", Journal of Virology, Vol. 68, no. 9, 1994, pp. 5991-6005.
30. Patterson S., Roberts M.S., English N.R., Macatonia S.E., Gompels M.N., Pinching A.J., Knight S.C., "Detection of HIV DNA in peripheral blood dendritic cells of HIV-infected individuals", Research in Virology, Vol. 145, no. 3-4, 1994, pp. 171-176.
31. Chehimi J., Bandyopadhyay S., Prakash K., Perussia B., Hassan N.F., Kawashima H., Campbell D., Kornbluth J., Starr S.E., "In vitro infection of natural killer cells with different human immunodeficiency virus type 1 isolates", Journal of Virology, Vol. 65, no. 4, 1991, pp. 1812-1822.
32. De M.A., Pantaleo G., Schnittman S.M., Greenhouse J.J., Baseler M., Orenstein J.M., Fauci A.S., "Infection of CD8+ T lymphocytes with HIV. Requirement for interaction with infected CD4+ cells and induction of infectious virus from chronically infected CD8+ cells", Journal of Immunology, Vol. 146, no. 7, 1991, pp. 2220-2226.
33. Feng Y., Broder C.C., Kennedy P.E., Berger E.A., "HIV-1 entry cofactor: functional cDNA cloning of a seven-transmembrane, G protein-coupled receptor", Science, Vol. 272, no. 5263, 1996, pp. 872-877.
34. Connor R.I., Sheridan K.E., Ceradini D., Choe S., Landau N.R., "Change in coreceptor use correlates with disease progression in HIV-1--infected individuals", Journal of Experimental Medicine, Vol. 185, no. 4, 1997, pp. 621-628.
35. Schuitemaker H., Koot M., Kootstra N.A., Dercksen M.W., de Goede R.E., van Steenwijk R.P., Lange J.M., Schattenkerk J.K., Miedema F., Tersmette M., "Biological phenotype of human immunodeficiency virus type 1 clones at different stages of infection: progression of disease is associated with a shift from monocytotropic to T-cell-tropic virus population", Journal of Virology, Vol. 66, no. 3, 1992, pp. 1354-1360.
36. Bukrinsky M., "A hard way to the nucleus", Molecular Medicine, Vol. 10, no. 1-6, 2004, pp. 1-5.
37. Stoltzfus C.M., Madsen J.M., "Role of viral splicing elements and cellular RNA binding proteins in regulation of HIV-1 alternative RNA splicing", Current HIV Research, Vol. 4, no. 1, 2006, pp. 43-55.
38. Powell D.M., Amaral M.C., Wu J.Y., Maniatis T., Greene W.C., "HIV Rev-dependent binding of SF2/ASF to the Rev response element: possible role in Rev-mediated inhibition of HIV RNA splicing", Proceedings of the National Academy of Sciences of the United States of America, Vol. 94, no. 3, 1997, pp. 973-978.
39. Perelson A.S., Neumann A.U., Markowitz M., Leonard J.M., Ho D.D., "HIV-1 dynamics in vivo: virion clearance rate, infected cell life-span, and viral generation time", Science, Vol. 271, no. 5255, 1996, pp. 1582-1586.
90
40. Coombs R.W., Collier A.C., Allain J.P., Nikora B., Leuther M., Gjerset G.F., Corey L., "Plasma viremia in human immunodeficiency virus infection", New England Journal of Medicine, Vol. 321, no. 24, 1989, pp. 1626-1631.
41. Michaelis B.A., Levy J.A., "Recovery of human immunodeficiency virus from serum", JAMA, Vol. 257, no. 10, 1987, pp. 1327.
42. Ho D.D., Schooley R.T., Rota T.R., Kaplan J.C., Flynn T., Salahuddin S.Z., Gonda M.A., Hirsch M.S., "HTLV-III in the semen and blood of a healthy homosexual man", Science, Vol. 226, no. 4673, 1984, pp. 451-453.
43. Wofsy C.B., Cohen J.B., Hauer L.B., Padian N.S., Michaelis B.A., Evans L.A., Levy J.A., "Isolation of AIDS-associated retrovirus from genital secretions of women with antibodies to the virus", Lancet, Vol. 1, no. 8480, 1986, pp. 527-529.
44. Semba R.D., Kumwenda N., Hoover D.R., Taha T.E., Quinn T.C., Mtimavalye L., Biggar R.J., Broadhead R., Miotti P.G., Sokoll L.J., van der Hoeven L., Chiphangwi J.D., "Human immunodeficiency virus load in breast milk, mastitis, and mother-to-child transmission of human immunodeficiency virus type 1", Journal of Infectious Diseases, Vol. 180, no. 1, 1999, pp. 93-98.
45. Levy J.A., Greenspan D., "HIV in saliva", Lancet, Vol. 2, no. 8622, 1988, pp. 1248.
46. Quinn T.C., "Global burden of the HIV pandemic", Lancet, Vol. 348, no. 9020, 1996, pp. 99-106.
47. Fauci A.S., Schnittman S.M., Poli G., Koenig S., Pantaleo G., "NIH conference. Immunopathogenic mechanisms in human immunodeficiency virus (HIV) infection", Annals of Internal Medicine, Vol. 114, no. 8, 1991, pp. 678-693.
48. Tindall B., Cooper D.A., "Primary HIV infection: host responses and intervention strategies", AIDS, Vol. 5, no. 1, 1991, pp. 1-14.
49. Vanhems P., Dassa C., Lambert J., Cooper D.A., Perrin L., Vizzard J., Hirschel B., Kinloch-de L.S., Carr A., Allard R., "Comprehensive classification of symptoms and signs reported among 218 patients with acute HIV-1 infection", Journal of Acquired Immune Deficiency Syndromes, Vol. 21, no. 2, 1999, pp. 99-106.
50. Daar E.S., Moudgil T., Meyer R.D., Ho D.D., "Transient high levels of viremia in patients with primary human immunodeficiency virus type 1 infection", New England Journal of Medicine, Vol. 324, no. 14, 1991, pp. 961-964.
51. Clark S.J., Saag M.S., Decker W.D., Campbell-Hill S., Roberson J.L., Veldkamp P.J., Kappes J.C., Hahn B.H., Shaw G.M., "High titers of cytopathic virus in plasma of patients with symptomatic primary HIV-1 infection", New England Journal of Medicine, Vol. 324, no. 14, 1991, pp. 954-960.
52. Piatak M., Jr., Saag M.S., Yang L.C., Clark S.J., Kappes J.C., Luk K.C., Hahn B.H., Shaw G.M., Lifson J.D.,"High levels of HIV-1 in plasma during all stages of infection determined by competitive PCR", Science, Vol. 259, no. 5102, 1993, pp. 1749-1754.
91
53. Pope M., Haase A.T., "Transmission, acute HIV-1 infection and the quest for strategies to prevent infection", Nature Medicine, Vol. 9, no. 7, 2003, pp. 847-852.
54. Pantaleo G., Graziosi C., Fauci A.S., "New concepts in the immunopathogenesis of human immunodeficiency virus infection", New England Journal of Medicine, Vol. 328, no. 5, 1993, pp. 327-335.
55. Fauci A.S., "Multifactorial nature of human immunodeficiency virus disease: implications for therapy", Science, Vol. 262, no. 5136, 1993, pp. 1011-1018.
56. Mattapallil J.J., Douek D.C., Hill B., Nishimura Y., Martin M., Roederer M., "Massive infection and loss of memory CD4+ T cells in multiple tissues during acute SIV infection", Nature, Vol. 434, no. 7037, 2005, pp. 1093-1097.
57. Brenchley J.M., Schacker T.W., Ruff L.E., Price D.A., Taylor J.H., Beilman G.J., Nguyen P.L., Khoruts A., Larson M., Haase A.T., Douek D.C., "CD4+ T cell depletion during all stages of HIV disease occurs predominantly in the gastrointestinal tract", Journal of Experimental Medicine, Vol. 200, no. 6, 2004, pp. 749-759.
58. Paiardini M., Frank I., Pandrea I., Apetrei C., Silvestri G., "Mucosal immune dysfunction in AIDS pathogenesis", AIDS Reviews, Vol. 10, no. 1, 2008, pp. 36-46.
59. Ho D.D., Sarngadharan M.G., Resnick L., Dimarzoveronese F., Rota T.R., Hirsch M.S., "Primary human T-lymphotropic virus type III infection", Annals of Internal Medicine, Vol. 103, no. 6 ( Pt 1), 1985, pp. 880-883.
60. Cooper D.A., Imrie A.A., Penny R., "Antibody response to human immunodeficiency virus after primary infection", Journal of Infectious Diseases, Vol. 155, no. 6, 1987, pp. 1113-1118.
61. Pantaleo G., Demarest J.F., Soudeyns H., Graziosi C., Denis F., Adelsberger J.W., Borrow P., Saag M.S., Shaw G.M., Sekaly R.P.,"Major expansion of CD8+ T cells with a predominant V beta usage during the primary immune response to HIV", Nature, Vol. 370, no. 6489, 1994, pp. 463-467.
62. Koup R.A., Safrit J.T., Cao Y., Andrews C.A., McLeod G., Borkowsky W., Farthing C., Ho D.D., "Temporal association of cellular immune responses with the initial control of viremia in primary human immunodeficiency virus type 1 syndrome", Journal of Virology, Vol. 68, no. 7, 1994, pp. 4650-4655.
63. Mellors J.W., Munoz A., Giorgi J.V., Margolick J.B., Tassoni C.J., Gupta P., Kingsley L.A., Todd J.A., Saah A.J., Detels R., Phair J.P., Rinaldo C.R., Jr., "Plasma viral load and CD4+ lymphocytes as prognostic markers of HIV-1 infection", Annals of Internal Medicine, Vol. 126, no. 12, 1997, pp. 946-954.
64. Mellors J.W., Rinaldo C.R., Jr., Gupta P., White R.M., Todd J.A., Kingsley L.A., "Prognosis in HIV-1 infection predicted by the quantity of virus in plasma", Science, Vol. 272, no. 5265, 1996, pp. 1167-1170.
65. Phair J., Jacobson L., Detels R., Rinaldo C., Saah A., Schrager L., Munoz A., "Acquired immune deficiency syndrome occurring within 5 years of
92
infection with human immunodeficiency virus type-1: the Multicenter AIDS Cohort Study", Journal of Acquired Immune Deficiency Syndromes, Vol. 5, no. 5, 1992, pp. 490-496.
66. Sheppard H.W., Lang W., Ascher M.S., Vittinghoff E., Winkelstein W., "The characterization of non-progressors: long-term HIV-1 infection with stable CD4+ T-cell levels", AIDS, Vol. 7, no. 9, 1993, pp. 1159-1166.
67. Evans A.S., "The clinical illness promotion factor: a third ingredient", Yale Journal of Biology and Medicine, Vol. 55, no. 3-4, 1982, pp. 193-199.
68. Pantaleo G., Fauci A.S., "Immunopathogenesis of HIV infection", Annual Review of Microbiology, Vol. 50, 1996, pp. 825-854.
69. Lemp G.F., Payne S.F., Neal D., Temelso T., Rutherford G.W., "Survival trends for patients with AIDS", JAMA, Vol. 263, no. 3, 1990, pp. 402-406.
70. McMichael A.J., Borrow P., Tomaras G.D., Goonetilleke N., Haynes B.F., "The immune response during acute HIV-1 infection: clues for vaccine development", Nature Reviews Immunology, Vol. 10, no. 1, 2010, pp. 11-23.
71. Ogg G.S., Jin X., Bonhoeffer S., Dunbar P.R., Nowak M.A., Monard S., Segal J.P., Cao Y., Rowland-Jones S.L., Cerundolo V., Hurley A., Markowitz M., Ho D.D., Nixon D.F., McMichael A.J., "Quantitation of HIV-1-specific cytotoxic T lymphocytes and plasma load of viral RNA", Science, Vol. 279, no. 5359, 1998, pp. 2103-2106.
72. Schmitz J.E., Kuroda M.J., Santra S., Sasseville V.G., Simon M.A., Lifton M.A., Racz P., Tenner-Racz K., Dalesandro M., Scallon B.J., Ghrayeb J., Forman M.A., Montefiori D.C., Rieber E.P., Letvin N.L., Reimann K.A., "Control of viremia in simian immunodeficiency virus infection by CD8+ lymphocytes", Science, Vol. 283, no. 5403, 1999, pp. 857-860.
73. Walker C.M., Moody D.J., Stites D.P., Levy J.A., "CD8+ lymphocytes can control HIV infection in vitro by suppressing virus replication", Science, Vol. 234, no. 4783, 1986, pp. 1563-1566.
74. Hadida F., Vieillard V., Mollet L., Clark-Lewis I., Baggiolini M., Debre P., "Cutting edge: RANTES regulates Fas ligand expression and killing by HIV-specific CD8 cytotoxic T cells", Journal of Immunology, Vol. 163, no. 3, 1999, pp. 1105-1109.
75. Kundu S.K., Merigan T.C., "Equivalent recognition of HIV proteins, Env, Gag and Pol, by CD4+ and CD8+ cytotoxic T-lymphocytes", AIDS, Vol. 6, no. 7, 1992, pp. 643-649.
76. Riviere Y., Tanneau-Salvadori F., Regnault A., Lopez O., Sansonetti P., Guy B., Kieny M.P., Fournel J.J., Montagnier L., "Human immunodeficiency virus-specific cytotoxic responses of seropositive individuals: distinct types of effector cells mediate killing of targets expressing gag and env proteins", Journal of Virology, Vol. 63, no. 5, 1989, pp. 2270-2277.
77. Clerici M., Lucey D.R., Zajac R.A., Boswell R.N., Gebel H.M., Takahashi H., Berzofsky J.A., Shearer G.M., "Detection of cytotoxic T lymphocytes specific for synthetic peptides of gp160 in HIV-seropositive individuals", Journal of Immunology, Vol. 146, no. 7, 1991, pp. 2214-2219.
93
78. Culmann-Penciolelli B., Lamhamedi-Cherradi S., Couillin I., Guegan N., Levy J.P., Guillet J.G., Gomard E., "Identification of multirestricted immunodominant regions recognized by cytolytic T lymphocytes in the human immunodeficiency virus type 1 Nef protein", Journal of Virology, Vol. 68, no. 11, 1994, pp. 7336-7343.
79. Wagner L., Yang O.O., Garcia-Zepeda E.A., Ge Y., Kalams S.A., Walker B.D., Pasternack M.S., Luster A.D., "Beta-chemokines are released from HIV-1-specific cytolytic T-cell granules complexed to proteoglycans", Nature, Vol. 391, no. 6670, 1998, pp. 908-911.
80. Cocchi F., DeVico A.L., Garzino-Demo A., Arya S.K., Gallo R.C., Lusso P., "Identification of RANTES, MIP-1 alpha, and MIP-1 beta as the major HIV-suppressive factors produced by CD8+ T cells", Science, Vol. 270, no. 5243, 1995, pp. 1811-1815.
81. Jassoy C., Harrer T., Rosenthal T., Navia B.A., Worth J., Johnson R.P., Walker B.D., "Human immunodeficiency virus type 1-specific cytotoxic T lymphocytes release gamma interferon, tumor necrosis factor alpha (TNF-alpha), and TNF-beta when they encounter their target antigens", Journal of Virology, Vol. 67, no. 5, 1993, pp. 2844-2852.
82. Migueles S.A., Laborico A.C., Shupert W.L., Sabbaghian M.S., Rabin R., Hallahan C.W., Van B.D., Kostense S., Miedema F., McLaughlin M., Ehler L., Metcalf J., Liu S., Connors M., "HIV-specific CD8+ T cell proliferation is coupled to perforin expression and is maintained in nonprogressors", Nature Immunology, Vol. 3, no. 11, 2002, pp. 1061-1068.
83. Bernard N.F., Yannakis C.M., Lee J.S., Tsoukas C.M., "Human immunodeficiency virus (HIV)-specific cytotoxic T lymphocyte activity in HIV-exposed seronegative persons", Journal of Infectious Diseases, Vol. 179, no. 3, 1999, pp. 538-547.
84. Goonetilleke N., Liu M.K., Salazar-Gonzalez J.F., Ferrari G., Giorgi E., Ganusov V.V., Keele B.F., Learn G.H., Turnbull E.L., Salazar M.G., Weinhold K.J., Moore S., Letvin N., Haynes B.F., Cohen M.S., Hraber P., Bhattacharya T., Borrow P., Perelson A.S., Hahn B.H., Shaw G.M., Korber B.T., McMichael A.J., "The first T cell response to transmitted/founder virus contributes to the control of acute viremia in HIV-1 infection", Journal of Experimental Medicine, Vol. 206, no. 6, 2009, pp. 1253-1272.
85. Kaufmann D.E., Bailey P.M., Sidney J., Wagner B., Norris P.J., Johnston M.N., Cosimi L.A., Addo M.M., Lichterfeld M., Altfeld M., Frahm N., Brander C., Sette A., Walker B.D., Rosenberg E.S., "Comprehensive analysis of human immunodeficiency virus type 1-specific CD4 responses reveals marked immunodominance of gag and nef and the presence of broadly recognized peptides", Journal of Virology, Vol. 78, no. 9, 2004, pp. 4463-4477.
86. Schrier R.D., Gnann J.W., Jr., Landes R., Lockshin C., Richman D., McCutchan A., Kennedy C., Oldstone M.B., Nelson J.A., "T cell recognition of HIV synthetic peptides in a natural infection", Journal of Immunology, Vol. 142, no. 4, 1989, pp. 1166-1176.
94
87. Clerici M., Stocks N.I., Zajac R.A., Boswell R.N., Lucey D.R., Via C.S., Shearer G.M., "Detection of three distinct patterns of T helper cell dysfunction in asymptomatic, human immunodeficiency virus-seropositive patients. Independence of CD4+ cell numbers and clinical staging", Journal of Clinical Investigation, Vol. 84, no. 6, 1989, pp. 1892-1899.
88. Rosenberg E.S., Billingsley J.M., Caliendo A.M., Boswell S.L., Sax P.E., Kalams S.A., Walker B.D., "Vigorous HIV-1-specific CD4+ T cell responses associated with control of viremia", Science, Vol. 278, no. 5342, 1997, pp. 1447-1450.
89. Wilson J.D., Imami N., Watkins A., Gill J., Hay P., Gazzard B., Westby M., Gotch F.M., "Loss of CD4+ T cell proliferative ability but not loss of human immunodeficiency virus type 1 specificity equates with progression to disease", Journal of Infectious Diseases, Vol. 182, no. 3, 2000, pp. 792-798.
90. Alter G., Moody M.A., "The humoral response to HIV-1: new insights, renewed focus", Journal of Infectious Diseases, Vol. 202 Suppl 2, 2010, pp. S315-S322.
91. Alam S.M., Scearce R.M., Parks R.J., Plonk K., Plonk S.G., Sutherland L.L., Gorny M.K., Zolla-Pazner S., Vanleeuwen S., Moody M.A., Xia S.M., Montefiori D.C., Tomaras G.D., Weinhold K.J., Karim S.A., Hicks C.B., Liao H.X., Robinson J., Shaw G.M., Haynes B.F., "Human immunodeficiency virus type 1 gp41 antibodies that mask membrane proximal region epitopes: antibody binding kinetics, induction, and potential for regulation in acute infection", Journal of Virology, Vol. 82, no. 1, 2008, pp. 115-125.
92. Muro-Cacho C.A., Pantaleo G., Fauci A.S., "Analysis of apoptosis in lymph nodes of HIV-infected persons. Intensity of apoptosis correlates with the general state of activation of the lymphoid tissue and not with stage of disease or viral burden", Journal of Immunology, Vol. 154, no. 10, 1995, pp. 5555-5566.
93. Pilgrim A.K., Pantaleo G., Cohen O.J., Fink L.M., Zhou J.Y., Zhou J.T., Bolognesi D.P., Fauci A.S., Montefiori D.C., "Neutralizing antibody responses to human immunodeficiency virus type 1 in primary infection and long-term-nonprogressive infection", Journal of Infectious Diseases, Vol. 176, no. 4, 1997, pp. 924-932.
94. Kostrikis L.G., Cao Y., Ngai H., Moore J.P., Ho D.D., "Quantitative analysis of serum neutralization of human immunodeficiency virus type 1 from subtypes A, B, C, D, E, F, and I: lack of direct correlation between neutralization serotypes and genetic subtypes and evidence for prevalent serum-dependent infectivity enhancement", Journal of Virology, Vol. 70, no. 1, 1996, pp. 445-458.
95. Wrin T., Crawford L., Sawyer L., Weber P., Sheppard H.W., Hanson C.V., "Neutralizing antibody responses to autologous and heterologous isolates of human immunodeficiency virus", Journal of Acquired Immune Deficiency Syndromes, Vol. 7, no. 3, 1994, pp. 211-219.
96. Wei X., Decker J.M., Wang S., Hui H., Kappes J.C., Wu X., Salazar-Gonzalez J.F., Salazar M.G., Kilby J.M., Saag M.S., Komarova N.L., Nowak
95
M.A., Hahn B.H., Kwong P.D., Shaw G.M., "Antibody neutralization and escape by HIV-1", Nature, Vol. 422, no. 6929, 2003, pp. 307-312.
97. Hengel R.L., Kennedy M.S., Steketee R.W., Thea D.M., Abrams E.J., Lambert G., McDougal J.S., "Neutralizing antibody and perinatal transmission of human immunodeficiency virus type 1. New York City Perinatal HIV Transmission Collaborative Study Group", AIDS Research and Human Retroviruses, Vol. 14, no. 6, 1998, pp. 475-481.
98. Mascola J.R., Stiegler G., VanCott T.C., Katinger H., Carpenter C.B., Hanson C.E., Beary H., Hayes D., Frankel S.S., Birx D.L., Lewis M.G., "Protection of macaques against vaginal transmission of a pathogenic HIV-1/SIV chimeric virus by passive infusion of neutralizing antibodies", Nature Medicine, Vol. 6, no. 2, 2000, pp. 207-210.
99. Prince A.M., Reesink H., Pascual D., Horowitz B., Hewlett I., Murthy K.K., Cobb K.E., Eichberg J.W., "Prevention of HIV infection by passive immunization with HIV immunoglobulin", AIDS Research and Human Retroviruses, Vol. 7, no. 12, 1991, pp. 971-973.
100. Conley A.J., Kessler J.A., Boots L.J., McKenna P.M., Schleif W.A., Emini E.A., Mark G.E., III, Katinger H., Cobb E.K., Lunceford S.M., Rouse S.R., Murthy K.K.," The consequence of passive administration of an anti-human immunodeficiency virus type 1 neutralizing monoclonal antibody before challenge of chimpanzees with a primary virus isolate", Journal of Virology, Vol. 70, no. 10, 1996, pp. 6751-6758.
101. Levy J.A.," The importance of the innate immune system in controlling HIV infection and disease", Trends in Immunology, Vol. 22, no. 6, 2001, pp. 312-316.
102. Stacey A.R., Norris P.J., Qin L., Haygreen E.A., Taylor E., Heitman J., Lebedeva M., DeCamp A., Li D., Grove D., Self S.G., Borrow P.," Induction of a striking systemic cytokine cascade prior to peak viremia in acute human immunodeficiency virus type 1 infection, in contrast to more modest and delayed responses in acute hepatitis B and C virus infections", Journal of Virology, Vol. 83, no. 8, 2009, pp. 3719-3733.
103. Alter G., Teigen N., Ahern R., Streeck H., Meier A., Rosenberg E.S., Altfeld M., "Evolution of innate and adaptive effector cell functions during acute HIV-1 infection", Journal of Infectious Diseases, Vol. 195, no. 10, 2007, pp. 1452-1460.
104. Kottilil S., Chun T.W., Moir S., Liu S., McLaughlin M., Hallahan C.W., Maldarelli F., Corey L., Fauci A.S., "Innate immunity in human immunodeficiency virus infection: effect of viremia on natural killer cell function", Journal of Infectious Diseases, Vol. 187, no. 7, 2003, pp. 1038-1045.
105. Bandyopadhyay S., Ziegner U., Campbell D.E., Miller D.S., Hoxie J.A., Starr S.E., "Natural killer cell-mediated lysis of T cell lines chronically infected with HIV-1", Clinical and Experimental Immunology, Vol. 79, no. 3, 1990, pp. 430-435.
96
106. Fortis C., Biswas P., Soldini L., Veglia F., Careddu A.M., Delfanti F., Mantelli B., Murone M., Lazzarin A., Poli G., "Dual role of TNF-alpha in NK/LAK cell-mediated lysis of chronically HIV-infected U1 cells. Concomitant enhancement of HIV expression and sensitization of cell-mediated lysis", European Journal of Immunology, Vol. 29, no. 11, 1999, pp. 3654-3662.
107. Baum L.L., Cassutt K.J., Knigge K., Khattri R., Margolick J., Rinaldo C., Kleeberger C.A., Nishanian P., Henrard D.R., Phair J., "HIV-1 gp120-specific antibody-dependent cell-mediated cytotoxicity correlates with rate of disease progression", Journal of Immunology, Vol. 157, no. 5, 1996, pp. 2168-2173.
108. Battle-Miller K., Eby C.A., Landay A.L., Cohen M.H., Sha B.E., Baum L.L., "Antibody-dependent cell-mediated cytotoxicity in cervical lavage fluids of human immunodeficiency virus type 1--infected women", Journal of Infectious Diseases, Vol. 185, no. 4, 2002, pp. 439-447.
109. Scott-Algara D., Truong L.X., Versmisse P., David A., Luong T.T., Nguyen N.V., Theodorou I., Barre-Sinoussi F., Pancino G., "Cutting edge: increased NK cell activity in HIV-1-exposed but uninfected Vietnamese intravascular drug users", Journal of Immunology, Vol. 171, no. 11, 2003, pp. 5663-5667.
110. Valentin A., Rosati M., Patenaude D.J., Hatzakis A., Kostrikis L.G., Lazanas M., Wyvill K.M., Yarchoan R., Pavlakis G.N., "Persistent HIV-1 infection of natural killer cells in patients receiving highly active antiretroviral therapy", Proceedings of the National Academy of Sciences of the United States of America, Vol. 99, no. 10, 2002, pp. 7015-7020.
111. Douglas S.D., Durako S.J., Tustin N.B., Houser J., Muenz L., Starr S.E., Wilson C., "Natural killer cell enumeration and function in HIV-infected and high-risk uninfected adolescents", AIDS Research and Human Retroviruses, Vol. 17, no. 6, 2001, pp. 543-552.
112. Hu P.F., Hultin L.E., Hultin P., Hausner M.A., Hirji K., Jewett A., Bonavida B., Detels R., Giorgi J.V., "Natural killer cell immunodeficiency in HIV disease is manifest by profoundly decreased numbers of CD16+CD56+ cells and expansion of a population of CD16dim", Journal of Acquired Immune Deficiency Syndromes and Human Retrovirology, Vol. 10, no. 3, 1995, pp. 331-340.
113. Mavilio D., Benjamin J., Daucher M., Lombardo G., Kottilil S., Planta M.A., Marcenaro E., Bottino C., Moretta L., Moretta A., Fauci A.S., "Natural killer cells in HIV-1 infection: dichotomous effects of viremia on inhibitory and activating receptors and their functional correlates", Proceedings of the National Academy of Sciences of the United States of America, Vol. 100, no. 25, 2003, pp. 15011-15016.
114. Kottilil S., Shin K., Planta M., McLaughlin M., Hallahan C.W., Ghany M., Chun T.W., Sneller M.C., Fauci A.S., "Expression of chemokine and inhibitory receptors on natural killer cells: effect of immune activation and HIV viremia", Journal of Infectious Diseases, Vol. 189, no. 7, 2004, pp. 1193-1198.
115. Parato K.G., Kumar A., Badley A.D., Sanchez-Dardon J.L., Chambers K.A., Young C.D., Lim W.T., Kravcik S., Cameron D.W., Angel J.B.,
97
"Normalization of natural killer cell function and phenotype with effective anti-HIV therapy and the role of IL-10", AIDS, Vol. 16, no. 9, 2002, pp. 1251-1256.
116. Clavel F., Hance A.J., "HIV drug resistance", New England Journal of Medicine, Vol. 350, no. 10, 2004, pp. 1023-1035.
117. Collins K.L., Chen B.K., Kalams S.A., Walker B.D., Baltimore D., "HIV-1 Nef protein protects infected primary cells against killing by cytotoxic T lymphocytes", Nature, Vol. 391, no. 6665, 1998, pp. 397-401.
118. Swann S.A., Williams M., Story C.M., Bobbitt K.R., Fleis R., Collins K.L., "HIV-1 Nef blocks transport of MHC class I molecules to the cell surface via a PI 3-kinase-dependent pathway", Virology, Vol. 282, no. 2, 2001, pp. 267-277.
119. Matsui M., Warburton R.J., Cogswell P.C., Baldwin A.S., Jr., Frelinger J.A., "Effects of HIV-1 Tat on expression of HLA class I molecules", Journal of Acquired Immune Deficiency Syndromes and Human Retrovirology, Vol. 11, no. 3, 1996, pp. 233-240.
120. Cohen G.B., Gandhi R.T., Davis D.M., Mandelboim O., Chen B.K., Strominger J.L., Baltimore D., "The selective downregulation of class I major histocompatibility complex proteins by HIV-1 protects HIV-infected cells from NK cells", Immunity, Vol. 10, no. 6, 1999, pp. 661-671.
121. Graci J.D., Colacino J.M., Peltz S.W., Dougherty J.P., Gu Z., "HIV type-1 latency: targeted induction of proviral reservoirs", Antiviral Chemistry and Chemotherapy, Vol. 19, no. 5, 2009, pp. 177-187.
122. Lifson J.D., Feinberg M.B., Reyes G.R., Rabin L., Banapour B., Chakrabarti S., Moss B., Wong-Staal F., Steimer K.S., Engleman E.G.," Induction of CD4-dependent cell fusion by the HTLV-III/LAV envelope glycoprotein", Nature, Vol. 323, no. 6090, 1986, pp. 725-728.
123. Bell P., Montaner L.J., Maul G.G., "Accumulation and intranuclear distribution of unintegrated human immunodeficiency virus type 1 DNA", Journal of Virology, Vol. 75, no. 16, 2001, pp. 7683-7691.
124. Panther L.A., Coombs R.W., Zeh J.E., Collier A.C., Corey L., "Unintegrated circular HIV-1 DNA in the peripheral mononuclear cells of HIV-1-infected subjects: association with high levels of plasma HIV-1 RNA, rapid decline in CD4 count, and clinical progression to AIDS", Journal of Acquired Immune Deficiency Syndromes and Human Retrovirology, Vol. 17, no. 4, 1998, pp. 303-313.
125. Stewart S.A., Poon B., Song J.Y., Chen I.S., "Human immunodeficiency virus type 1 vpr induces apoptosis through caspase activation", Journal of Virology, Vol. 74, no. 7, 2000, pp. 3105-3111.
126. Stevenson M., "HIV-1 pathogenesis", Nature Medicine, Vol. 9, no. 7, 2003, pp. 853-860.
127. Trimble L.A., Shankar P., Patterson M., Daily J.P., Lieberman J., "Human immunodeficiency virus-specific circulating CD8 T lymphocytes have down-modulated CD3zeta and CD28, key signaling molecules for T-cell activation", Journal of Virology, Vol. 74, no. 16, 2000, pp. 7320-7330.
98
128. Klimas N., Koneru A.O., Fletcher M.A., "Overview of HIV", Psychosomatic Medicine, Vol. 70, no. 5, 2008, pp. 523-530.
129. Liu Y.J., Kanzler H., Soumelis V., Gilliet M.," Dendritic cell lineage, plasticity and cross-regulation", Nature Immunology, Vol. 2, no. 7, 2001, pp. 585-589.
130. Kadowaki N.," The divergence and interplay between pDC and mDC in humans", Frontiers in Bioscience, Vol. 14, 2009, pp. 808-817.
131. Lennert K., Remmele W.,"Karyometric research on lymph node cells in man. I. Germinoblasts, lymphoblasts & lymphocytes", Acta Haematologica, Vol. 19, no. 2, 1958, pp. 99-113.
132. Trinchieri G., Santoli D., Dee R.R., Knowles B.B., "Anti-viral activity induced by culturing lymphocytes with tumor-derived or virus-transformed cells. Identification of the anti-viral activity as interferon and characterization of the human effector lymphocyte subpopulation", Journal of Experimental Medicine, Vol. 147, no. 5, 1978, pp. 1299-1313.
133. Perussia B., Fanning V., Trinchieri G., "A leukocyte subset bearing HLA-DR antigens is responsible for in vitro alpha interferon production in response to viruses", Natural Immunity and Cell Growth Regulation, Vol. 4, no. 3, 1985, pp. 120-137.
134. Fitzgerald-Bocarsly P., Feldman M., Mendelsohn M., Curl S., Lopez C., "Human mononuclear cells which produce interferon-alpha during NK(HSV-FS) assays are HLA-DR positive cells distinct from cytolytic natural killer effectors", Journal of Leukocyte Biology, Vol. 43, no. 4, 1988, pp. 323-334.
135. Ronnblom L., Ramstedt U., Alm G.V., "Properties of human natural interferon-producing cells stimulated by tumor cell lines", European Journal of Immunology, Vol. 13, no. 6, 1983, pp. 471-476.
136. Cella M., Jarrossay D., Facchetti F., Alebardi O., Nakajima H., Lanzavecchia A., Colonna M., "Plasmacytoid monocytes migrate to inflamed lymph nodes and produce large amounts of type I interferon", Nature Medicine, Vol. 5, no. 8, 1999, pp. 919-923.
137. Siegal F.P., Kadowaki N., Shodell M., Fitzgerald-Bocarsly P.A., Shah K., Ho S., Antonenko S., Liu Y.J., "The nature of the principal type 1 interferon-producing cells in human blood", Science, Vol. 284, no. 5421, 1999, pp. 1835-1837.
138. Colonna M., Trinchieri G., Liu Y.J., "Plasmacytoid dendritic cells in immunity", Nature Immunology, Vol. 5, no. 12, 2004, pp. 1219-1226.
139. Jiang W., Swiggard W.J., Heufler C., Peng M., Mirza A., Steinman R.M., Nussenzweig M.C., "The receptor DEC-205 expressed by dendritic cells and thymic epithelial cells is involved in antigen processing", Nature, Vol. 375, no. 6527, 1995, pp. 151-155.
140. De la Rosa G., Longo N., Rodriguez-Fernandez J.L., Puig-Kroger A., Pineda A., Corbi A.L., Sanchez-Mateos P., "Migration of human blood dendritic cells across endothelial cell monolayers: adhesion molecules and
99
chemokines involved in subset-specific transmigration", Journal of Leukocyte Biology, Vol. 73, no. 5, 2003, pp. 639-649.
141. Reis e Sousa, "Toll-like receptors and dendritic cells: for whom the bug tolls", Seminars in Immunology, Vol. 16, no. 1, 2004, pp. 27-34.
142. Gilliet M., Cao W., Liu Y.J., "Plasmacytoid dendritic cells: sensing nucleic acids in viral infection and autoimmune diseases", Nature Reviews Immunology, Vol. 8, no. 8, 2008, pp. 594-606.
143. Boasso A., Shearer G.M., Chougnet C., "Immune dysregulation in human immunodeficiency virus infection: know it, fix it, prevent it?", Journal of Internal Medicine, Vol. 265, no. 1, 2009, pp. 78-96.
144. Grandvaux N., tenOever B.R., Servant M.J., Hiscott J., "The interferon antiviral response: from viral invasion to evasion", Current Opinion in Infectious Diseases, Vol. 15, no. 3, 2002, pp. 259-267.
145. Fonteneau J.F., Larsson M., Beignon A.S., McKenna K., Dasilva I., Amara A., Liu Y.J., Lifson J.D., Littman D.R., Bhardwaj N., "Human immunodeficiency virus type 1 activates plasmacytoid dendritic cells and concomitantly induces the bystander maturation of myeloid dendritic cells", Journal of Virology, Vol. 78, no. 10, 2004, pp. 5223-5232.
146. Santini S.M., Lapenta C., Logozzi M., Parlato S., Spada M., Di P.T., Belardelli F., "Type I interferon as a powerful adjuvant for monocyte-derived dendritic cell development and activity in vitro and in Hu-PBL-SCID mice", Journal of Experimental Medicine, Vol. 191, no. 10, 2000, pp. 1777-1788.
147. Agnello D., Lankford C.S., Bream J., Morinobu A., Gadina M., O'Shea J.J., Frucht D.M., "Cytokines and transcription factors that regulate T helper cell differentiation: new players and new insights", Journal of Clinical Immunology, Vol. 23, no. 3, 2003, pp. 147-161.
148. Takaoka A., Hayakawa S., Yanai H., Stoiber D., Negishi H., Kikuchi H., Sasaki S., Imai K., Shibue T., Honda K., Taniguchi T., "Integration of interferon-alpha/beta signalling to p53 responses in tumour suppression and antiviral defence", Nature, Vol. 424, no. 6948, 2003, pp. 516-523.
149. Vilcek J., " Boosting p53 with interferon and viruses", Nature Immunology, Vol. 4, no. 9, 2003, pp. 825-826.
150. Jego G., Palucka A.K., Blanck J.P., Chalouni C., Pascual V., Banchereau J., "Plasmacytoid dendritic cells induce plasma cell differentiation through type I interferon and interleukin 6", Immunity, Vol. 19, no. 2, 2003, pp. 225-234.
151. Poeck H., Wagner M., Battiany J., Rothenfusser S., Wellisch D., Hornung V., Jahrsdorfer B., Giese T., Endres S., Hartmann G., "Plasmacytoid dendritic cells, antigen, and CpG-C license human B cells for plasma cell differentiation and immunoglobulin production in the absence of T-cell help", Blood, Vol. 103, no. 8, 2004, pp. 3058-3064.
152. Fallarino F., Gizzi S., Mosci P., Grohmann U., Puccetti P., "Tryptophan catabolism in IDO+ plasmacytoid dendritic cells", Current Drug Metabolism, Vol. 8, no. 3, 2007, pp. 209-216.
100
153. Mellor A.L., Munn D.H., "IDO expression by dendritic cells: tolerance and tryptophan catabolism", Nature Reviews Immunology, Vol. 4, no. 10, 2004, pp. 762-774.
154. Kudo Y., Boyd C.A., "Human placental indoleamine 2,3-dioxygenase: cellular localization and characterization of an enzyme preventing fetal rejection", Biochimica et Biophysica Acta, Vol. 1500, no. 1, 2000, pp. 119-124.
155. Sakurai K., Zou J.P., Tschetter J.R., Ward J.M., Shearer G.M., "Effect of indoleamine 2,3-dioxygenase on induction of experimental autoimmune encephalomyelitis", Journal of Neuroimmunology, Vol. 129, no. 1-2, 2002, pp. 186-196.
156. Gurtner G.J., Newberry R.D., Schloemann S.R., McDonald K.G., Stenson W.F., "Inhibition of indoleamine 2,3-dioxygenase augments trinitrobenzene sulfonic acid colitis in mice", Gastroenterology, Vol. 125, no. 6, 2003, pp. 1762-1773.
157. Swanson K.A., Zheng Y., Heidler K.M., Mizobuchi T., Wilkes D.S., "CDllc+ cells modulate pulmonary immune responses by production of indoleamine 2,3-dioxygenase", American Journal of Respiratory Cell and Molecular Biology, Vol. 30, no. 3, 2004, pp. 311-318.
158. Friberg M., Jennings R., Alsarraj M., Dessureault S., Cantor A., Extermann M., Mellor A.L., Munn D.H., Antonia S.J., "Indoleamine 2,3-dioxygenase contributes to tumor cell evasion of T cell-mediated rejection", International Journal of Cancer, Vol. 101, no. 2, 2002, pp. 151-155.
159. Munn D.H., Mellor A.L., "IDO and tolerance to tumors", Trends in Molecular Medicine, Vol. 10, no. 1, 2004, pp. 15-18.
160. Cozzi A., Zignego A.L., Carpendo R., Biagiotti T., Aldinucci A., Monti M., Giannini C., Rosselli M., Laffi G., Moroni F., "Low serum tryptophan levels, reduced macrophage IDO activity and high frequency of psychopathology in HCV patients", Journal of Viral Hepatitis, Vol. 13, no. 6, 2006, pp. 402-408.
161. Schrocksnadel K., Wirleitner B., Winkler C., Fuchs D., "Monitoring tryptophan metabolism in chronic immune activation", Clinica Chimica Acta, Vol. 364, no. 1-2, 2006, pp. 82-90.
162. Fallarino F., Grohmann U., You S., McGrath B.C., Cavener D.R., Vacca C., Orabona C., Bianchi R., Belladonna M.L., Volpi C., Santamaria P., Fioretti M.C., Puccetti P., "The combined effects of tryptophan starvation and tryptophan catabolites down-regulate T cell receptor zeta-chain and induce a regulatory phenotype in naive T cells", Journal of Immunology, Vol. 176, no. 11, 2006, pp. 6752-6761.
163. Fallarino F., Grohmann U., Hwang K.W., Orabona C., Vacca C., Bianchi R., Belladonna M.L., Fioretti M.C., Alegre M.L., Puccetti P., "Modulation of tryptophan catabolism by regulatory T cells", Nature Immunology, Vol. 4, no. 12, 2003, pp. 1206-1212.
164. Boasso A., Shearer G.M., "Chronic innate immune activation as a cause of HIV-1 immunopathogenesis", Clinical Immunology, Vol. 126, no. 3, 2008, pp. 235-242.
101
165. Derdeyn C.A., Silvestri G., "Viral and host factors in the pathogenesis of HIV infection", Current Opinion in Immunology, Vol. 17, no. 4, 2005, pp. 366-373.
166. Moanna A., Dunham R., Paiardini M., Silvestri G., "CD4+ T-cell depletion in HIV infection: killed by friendly fire?", Current HIV/AIDS Reports, Vol. 2, no. 1, 2005, pp. 16-23.
167. Giorgi J.V., Hultin L.E., McKeating J.A., Johnson T.D., Owens B., Jacobson L.P., Shih R., Lewis J., Wiley D.J., Phair J.P., Wolinsky S.M., Detels R., "Shorter survival in advanced human immunodeficiency virus type 1 infection is more closely associated with T lymphocyte activation than with plasma virus burden or virus chemokine coreceptor usage", Journal of Infectious Diseases, Vol. 179, no. 4, 1999, pp. 859-870.
168. Liu Z., Cumberland W.G., Hultin L.E., Prince H.E., Detels R., Giorgi J.V., "Elevated CD38 antigen expression on CD8+ T cells is a stronger marker for the risk of chronic HIV disease progression to AIDS and death in the Multicenter AIDS Cohort Study than CD4+ cell count, soluble immune activation markers, or combinations of HLA-DR and CD38 expression", Journal of Acquired Immune Deficiency Syndromes and Human Retrovirology, Vol. 16, no. 2, 1997, pp. 83-92.
169. Barron M.A., Blyveis N., Palmer B.E., MaWhinney S., Wilson C.C., "Influence of plasma viremia on defects in number and immunophenotype of blood dendritic cell subsets in human immunodeficiency virus 1-infected individuals", Journal of Infectious Diseases, Vol. 187, no. 1, 2003, pp. 26-37.
170. Chehimi J., Azzoni L., Farabaugh M., Creer S.A., Tomescu C., Hancock A., Mackiewicz A., D'Alessandro L., Ghanekar S., Foulkes A.S., Mounzer K., Kostman J., Montaner L.J., "Baseline viral load and immune activation determine the extent of reconstitution of innate immune effectors in HIV-1-infected subjects undergoing antiretroviral treatment", Journal of Immunology, Vol. 179, no. 4, 2007, pp. 2642-2650.
171. Donaghy H., Pozniak A., Gazzard B., Qazi N., Gilmour J., Gotch F., Patterson S., "Loss of blood CD11c(+) myeloid and CD11c(-) plasmacytoid dendritic cells in patients with HIV-1 infection correlates with HIV-1 RNA virus load", Blood, Vol. 98, no. 8, 2001, pp. 2574-2576.
172. Donaghy H., Gazzard B., Gotch F., Patterson S., "Dysfunction and infection of freshly isolated blood myeloid and plasmacytoid dendritic cells in patients infected with HIV-1", Blood, Vol. 101, no. 11, 2003, pp. 4505-4511.
173. Lichtner M., Rossi R., Rizza M.C., Mengoni F., Sauzullo I., Massetti A.P., Luzi G., Hosmalin A., Mastroianni C.M., Vullo V., "Plasmacytoid dendritic cells count in antiretroviral-treated patients is predictive of HIV load control independent of CD4+ T-cell count", Current HIV Research, Vol. 6, no. 1, 2008, pp. 19-27.
174. Benlahrech A., Patterson S., "HIV-1 infection and induction of interferon alpha in plasmacytoid dendritic cells", Current Opinion in HIV and AIDS, Vol. 6, no. 5, 2011, pp. 373-378.
102
175. Fong L., Mengozzi M., Abbey N.W., Herndier B.G., Engleman E.G., "Productive infection of plasmacytoid dendritic cells with human immunodeficiency virus type 1 is triggered by CD40 ligation", Journal of Virology, Vol. 76, no. 21, 2002, pp. 11033-11041.
176. Hardy A.W., Graham D.R., Shearer G.M., Herbeuval J.P., "HIV turns plasmacytoid dendritic cells (pDC) into TRAIL-expressing killer pDC and down-regulates HIV coreceptors by Toll-like receptor 7-induced IFN-alpha", Proceedings of the National Academy of Sciences of the United States of America, Vol. 104, no. 44, 2007, pp. 17453-17458.
177. Meyers J.H., Justement J.S., Hallahan C.W., Blair E.T., Sun Y.A., O'Shea M.A., Roby G., Kottilil S., Moir S., Kovacs C.M., Chun T.W., Fauci A.S., "Impact of HIV on cell survival and antiviral activity of plasmacytoid dendritic cells", PLoS One, Vol. 2, no. 5, 2007, pp. e458.
178. Brown K.N., Trichel A., Barratt-Boyes S.M.," Parallel loss of myeloid and plasmacytoid dendritic cells from blood and lymphoid tissue in simian AIDS", Journal of Immunology, Vol. 178, no. 11, 2007, pp. 6958-6967.
179. Biancotto A., Grivel J.C., Iglehart S.J., Vanpouille C., Lisco A., Sieg S.F., Debernardo R., Garate K., Rodriguez B., Margolis L.B., Lederman M.M., "Abnormal activation and cytokine spectra in lymph nodes of people chronically infected with HIV-1", Blood, Vol. 109, no. 10, 2007, pp. 4272-4279.
180. Sabado R.L., O'Brien M., Subedi A., Qin L., Hu N., Taylor E., Dibben O., Stacey A., Fellay J., Shianna K.V., Siegal F., Shodell M., Shah K., Larsson M., Lifson J., Nadas A., Marmor M., Hutt R., Margolis D., Garmon D., Markowitz M., Valentine F., Borrow P., Bhardwaj N., "Evidence of dysregulation of dendritic cells in primary HIV infection", Blood, Vol. 116, no. 19, 2010, pp. 3839-3852.
181. Yonezawa A., Morita R., Takaori-Kondo A., Kadowaki N., Kitawaki T., Hori T., Uchiyama T., "Natural alpha interferon-producing cells respond to human immunodeficiency virus type 1 with alpha interferon production and maturation into dendritic cells", Journal of Virology, Vol. 77, no. 6, 2003, pp. 3777-3784.
182. Boasso A., Herbeuval J.P., Hardy A.W., Anderson S.A., Dolan M.J., Fuchs D., Shearer G.M., "HIV inhibits CD4+ T-cell proliferation by inducing indoleamine 2,3-dioxygenase in plasmacytoid dendritic cells", Blood, Vol. 109, no. 8, 2007, pp. 3351-3359.
183. Abel K., Alegria-Hartman M.J., Rothaeusler K., Marthas M., Miller C.J., "The relationship between simian immunodeficiency virus RNA levels and the mRNA levels of alpha/beta interferons (IFN-alpha/beta) and IFN-alpha/beta-inducible Mx in lymphoid tissues of rhesus macaques during acute and chronic infection", Journal of Virology, Vol. 76, no. 16, 2002, pp. 8433-8445.
184. Grundstrom S., Andersson J., "Studies of HIV-associated immune responses in lymphoid compartments", Current HIV/AIDS Reports, Vol. 3, no. 1, 2006, pp. 32-38.
185. Herbeuval J.P., Nilsson J., Boasso A., Hardy A.W., Kruhlak M.J., Anderson S.A., Dolan M.J., Dy M., Andersson J., Shearer G.M., "Differential
103
expression of IFN-alpha and TRAIL/DR5 in lymphoid tissue of progressor versus nonprogressor HIV-1-infected patients", Proceedings of the National Academy of Sciences of the United States of America, Vol. 103, no. 18, 2006, pp. 7000-7005.
186. Andersson J., Boasso A., Nilsson J., Zhang R., Shire N.J., Lindback S., Shearer G.M., Chougnet C.A., "The prevalence of regulatory T cells in lymphoid tissue is correlated with viral load in HIV-infected patients", Journal of Immunology, Vol. 174, no. 6, 2005, pp. 3143-3147.
187. Nilsson J., Boasso A., Velilla P.A., Zhang R., Vaccari M., Franchini G., Shearer G.M., Andersson J., Chougnet C., "HIV-1-driven regulatory T-cell accumulation in lymphoid tissues is associated with disease progression in HIV/AIDS", Blood, Vol. 108, no. 12, 2006, pp. 3808-3817.
188. Jacquelin B., Mayau V., Targat B., Liovat A.S., Kunkel D., Petitjean G., Dillies M.A., Roques P., Butor C., Silvestri G., Giavedoni L.D., Lebon P., Barre-Sinoussi F., Benecke A., Muller-Trutwin M.C., "Nonpathogenic SIV infection of African green monkeys induces a strong but rapidly controlled type I IFN response", Journal of Clinical Investigation, Vol. 119, no. 12, 2009, pp. 3544-3555.
189. Bosinger S.E., Li Q., Gordon S.N., Klatt N.R., Duan L., Xu L., Francella N., Sidahmed A., Smith A.J., Cramer E.M., Zeng M., Masopust D., Carlis J.V., Ran L., Vanderford T.H., Paiardini M., Isett R.B., Baldwin D.A., Else J.G., Staprans S.I., Silvestri G., Haase A.T., Kelvin D.J., "Global genomic analysis reveals rapid control of a robust innate response in SIV-infected sooty mangabeys", Journal of Clinical Investigation, Vol. 119, no. 12, 2009, pp. 3556-3572.
190. Hirsch V.M., "What can natural infection of African monkeys with simian immunodeficiency virus tell us about the pathogenesis of AIDS?", AIDS Reviews, Vol. 6, no. 1, 2004, pp. 40-53.
191. Silvestri G., "Naturally SIV-infected sooty mangabeys: are we closer to understanding why they do not develop AIDS?", Journal of Medical Primatology, Vol. 34, no. 5-6, 2005, pp. 243-252.
192. Heeney J.L., Plotkin S.A., "Immunological correlates of protection from HIV infection and disease", Nature Immunology, Vol. 7, no. 12, 2006, pp. 1281-1284.
193. Herbeuval J.P., Hardy A.W., Boasso A., Anderson S.A., Dolan M.J., Dy M., Shearer G.M., "Regulation of TNF-related apoptosis-inducing ligand on primary CD4+ T cells by HIV-1: role of type I IFN-producing plasmacytoid dendritic cells", Proceedings of the National Academy of Sciences of the United States of America, Vol. 102, no. 39, 2005, pp. 13974-13979.
194. Stary G., Klein I., Kohlhofer S., Koszik F., Scherzer T., Mullauer L., Quendler H., Kohrgruber N., Stingl G., "Plasmacytoid dendritic cells express TRAIL and induce CD4+ T-cell apoptosis in HIV-1 viremic patients", Blood, Vol. 114, no. 18, 2009, pp. 3854-3863.
104
195. Boasso A., Hardy A.W., Landay A.L., Martinson J.L., Anderson S.A., Dolan M.J., Clerici M., Shearer G.M., "PDL-1 upregulation on monocytes and T cells by HIV via type I interferon: restricted expression of type I interferon receptor by CCR5-expressing leukocytes", Clinical Immunology, Vol. 129, no. 1, 2008, pp. 132-144.
196. Rodriguez B., Lederman M.M., Jiang W., Bazdar D.A., Garate K., Harding C.V., Sieg S.F., "Interferon-alpha differentially rescues CD4 and CD8 T cells from apoptosis in HIV infection", AIDS, Vol. 20, no. 10, 2006, pp. 1379-1389.
197. Boasso A., Hardy A.W., Anderson S.A., Dolan M.J., Shearer G.M., "HIV-induced type I interferon and tryptophan catabolism drive T cell dysfunction despite phenotypic activation", PLoS One, Vol. 3, no. 8, 2008, pp. e2961.
198. Favre D., Mold J., Hunt P.W., Kanwar B., Loke P., Seu L., Barbour J.D., Lowe M.M., Jayawardene A., Aweeka F., Huang Y., Douek D.C., Brenchley J.M., Martin J.N., Hecht F.M., Deeks S.G., McCune J.M., "Tryptophan catabolism by indoleamine 2,3-dioxygenase 1 alters the balance of TH17 to regulatory T cells in HIV disease", Science Translational Medicine, Vol. 2, no. 32, 2010, pp. 32ra36.
199. Boasso A., Shearer G.M., "How does indoleamine 2,3-dioxygenase contribute to HIV-mediated immune dysregulation", Current Drug Metabolism, Vol. 8, no. 3, 2007, pp. 217-223.
200. Potula R., Poluektova L., Knipe B., Chrastil J., Heilman D., Dou H., Takikawa O., Munn D.H., Gendelman H.E., Persidsky Y., "Inhibition of indoleamine 2,3-dioxygenase (IDO) enhances elimination of virus-infected macrophages in an animal model of HIV-1 encephalitis", Blood, Vol. 106, no. 7, 2005, pp. 2382-2390.
201. Epple H.J., Loddenkemper C., Kunkel D., Troger H., Maul J., Moos V., Berg E., Ullrich R., Schulzke J.D., Stein H., Duchmann R., Zeitz M., Schneider T., "Mucosal but not peripheral FOXP3+ regulatory T cells are highly increased in untreated HIV infection and normalize after suppressive HAART", Blood, Vol. 108, no. 9, 2006, pp. 3072-3078.
202. Estes J.D., Li Q., Reynolds M.R., Wietgrefe S., Duan L., Schacker T., Picker L.J., Watkins D.I., Lifson J.D., Reilly C., Carlis J., Haase A.T., "Premature induction of an immunosuppressive regulatory T cell response during acute simian immunodeficiency virus infection", Journal of Infectious Diseases, Vol. 193, no. 5, 2006, pp. 703-712.
203. Fauci A.S., Mavilio D., Kottilil S., "NK cells in HIV infection: paradigm for protection or targets for ambush", Nature Reviews Immunology, Vol. 5, no. 11, 2005, pp. 835-843.
204. Li Q., Estes J.D., Schlievert P.M., Duan L., Brosnahan A.J., Southern P.J., Reilly C.S., Peterson M.L., Schultz-Darken N., Brunner K.G., Nephew K.R., Pambuccian S., Lifson J.D., Carlis J.V., Haase A.T., "Glycerol monolaurate prevents mucosal SIV transmission", Nature, Vol. 458, no. 7241, 2009, pp. 1034-1038.
105
205. Heikenwalder M., Polymenidou M., Junt T., Sigurdson C., Wagner H., Akira S., Zinkernagel R., Aguzzi A., "Lymphoid follicle destruction and immunosuppression after repeated CpG oligodeoxynucleotide administration", Nature Medicine, Vol. 10, no. 2, 2004, pp. 187-192.
206. Baenziger S., Heikenwalder M., Johansen P., Schlaepfer E., Hofer U., Miller R.C., Diemand S., Honda K., Kundig T.M., Aguzzi A., Speck R.F., "Triggering TLR7 in mice induces immune activation and lymphoid system disruption, resembling HIV-mediated pathology", Blood, Vol. 113, no. 2, 2009, pp. 377-388.
207. Boasso A., Royle C.M., Doumazos S., Aquino V.N., Biasin M., Piacentini L., Tavano B., Fuchs D., Mazzotta F., Lo C.S., Shearer G.M., Clerici M., Graham D.R., "Overactivation of plasmacytoid dendritic cells inhibits antiviral T-cell responses: a model for HIV immunopathogenesis", Blood, Vol. 118, no. 19, 2011, pp. 5152-5162.
208. Colonna M., Nakajima H., Cella M., "A family of inhibitory and activating Ig-like receptors that modulate function of lymphoid and myeloid cells", Seminars in Immunology, Vol. 12, no. 2, 2000, pp. 121-127.
209. Borges L., Cosman D., "LIRs/ILTs/MIRs, inhibitory and stimulatory Ig-superfamily receptors expressed in myeloid and lymphoid cells", Cytokine and Growth Factor Reviews, Vol. 11, no. 3, 2000, pp. 209-217.
210. Ravetch J.V., Lanier L.L., "Immune inhibitory receptors", Science, Vol. 290, no. 5489, 2000, pp. 84-89.
211. Cao W., Bover L., "Signaling and ligand interaction of ILT7: receptor-mediated regulatory mechanisms for plasmacytoid dendritic cells", Immunological Reviews, Vol. 234, no. 1, 2010, pp. 163-176.
212. Rissoan M.C., Duhen T., Bridon J.M., Bendriss-Vermare N., Peronne C., de S., V, Briere F., Bates E.E., "Subtractive hybridization reveals the expression of immunoglobulin-like transcript 7, Eph-B1, granzyme B, and 3 novel transcripts in human plasmacytoid dendritic cells", Blood, Vol. 100, no. 9, 2002, pp. 3295-3303.
213. Ju X.S., Hacker C., Scherer B., Redecke V., Berger T., Schuler G., Wagner H., Lipford G.B., Zenke M., " Immunoglobulin-like transcripts ILT2, ILT3 and ILT7 are expressed by human dendritic cells and down-regulated following activation", Gene, Vol. 331, 2004, pp. 159-164.
214. Cao W., Rosen D.B., Ito T., Bover L., Bao M., Watanabe G., Yao Z., Zhang L., Lanier L.L., Liu Y.J., "Plasmacytoid dendritic cell-specific receptor ILT7-Fc epsilonRI gamma inhibits Toll-like receptor-induced interferon production", Journal of Experimental Medicine, Vol. 203, no. 6, 2006, pp. 1399-1405.
215. Cho M., Ishida K., Chen J., Ohkawa J., Chen W., Namiki S., Kotaki A., Arai N., Arai K., Kamogawa-Schifter Y., "SAGE library screening reveals ILT7 as a specific plasmacytoid dendritic cell marker that regulates type I IFN production", International Immunology, Vol. 20, no. 1, 2008, pp. 155-164.
106
216. Schroeder J.T., Bieneman A.P., Xiao H., Chichester K.L., Vasagar K., Saini S., Liu M.C., "TLR9- and FcepsilonRI-mediated responses oppose one another in plasmacytoid dendritic cells by down-regulating receptor expression", Journal of Immunology, Vol. 175, no. 9, 2005, pp. 5724-5731.
217. Novak N., Allam J.P., Hagemann T., Jenneck C., Laffer S., Valenta R., Kochan J., Bieber T., "Characterization of FcepsilonRI-bearing CD123 blood dendritic cell antigen-2 plasmacytoid dendritic cells in atopic dermatitis", Journal of Allergy and Clinical Immunology, Vol. 114, no. 2, 2004, pp. 364-370.
218. Fuchs A., Cella M., Kondo T., Colonna M., "Paradoxic inhibition of human natural interferon-producing cells by the activating receptor NKp44", Blood, Vol. 106, no. 6, 2005, pp. 2076-2082.
219. Ishikawa J., Kaisho T., Tomizawa H., Lee B.O., Kobune Y., Inazawa J., Oritani K., Itoh M., Ochi T., Ishihara K., "Molecular cloning and chromosomal mapping of a bone marrow stromal cell surface gene, BST2, that may be involved in pre-B-cell growth", Genomics, Vol. 26, no. 3, 1995, pp. 527-534.
220. Goto T., Kennel S.J., Abe M., Takishita M., Kosaka M., Solomon A., Saito S., "A novel membrane antigen selectively expressed on terminally differentiated human B cells", Blood, Vol. 84, no. 6, 1994, pp. 1922-1930.
221. Vidal-Laliena M., Romero X., March S., Requena V., Petriz J., Engel P., "Characterization of antibodies submitted to the B cell section of the 8th Human Leukocyte Differentiation Antigens Workshop by flow cytometry and immunohistochemistry", Cellular Immunology, Vol. 236, no. 1-2, 2005, pp. 6-16.
222. Blasius A.L., Giurisato E., Cella M., Schreiber R.D., Shaw A.S., Colonna M., "Bone marrow stromal cell antigen 2 is a specific marker of type I IFN-producing cells in the naive mouse, but a promiscuous cell surface antigen following IFN stimulation", Journal of Immunology, Vol. 177, no. 5, 2006, pp. 3260-3265.
223. Miyagi E., Andrew A.J., Kao S., Strebel K., "Vpu enhances HIV-1 virus release in the absence of Bst-2 cell surface down-modulation and intracellular depletion", Proceedings of the National Academy of Sciences of the United States of America, Vol. 106, no. 8, 2009, pp. 2868-2873.
224. Bartee E., McCormack A., Fruh K., "Quantitative membrane proteomics reveals new cellular targets of viral immune modulators", PLoS Pathogens, Vol. 2, no. 10, 2006, pp. e107.
225. Neil S.J., Zang T., Bieniasz P.D., "Tetherin inhibits retrovirus release and is antagonized by HIV-1 Vpu", Nature, Vol. 451, no. 7177, 2008, pp. 425-430.
226. Van D.N., Goff D., Katsura C., Jorgenson R.L., Mitchell R., Johnson M.C., Stephens E.B., Guatelli J., "The interferon-induced protein BST-2 restricts HIV-1 release and is downregulated from the cell surface by the viral Vpu protein", Cell Host Microbe, Vol. 3, no. 4, 2008, pp. 245-252.
227. Martin-Serrano J., Neil S.J., "Host factors involved in retroviral budding and release", Nature Reviews Microbiology, Vol. 9, no. 7, 2011, pp. 519-531.
107
228. Evans D.T., Serra-Moreno R., Singh R.K., Guatelli J.C., "BST-2/tetherin: a new component of the innate immune response to enveloped viruses", Trends in Microbiology, Vol. 18, no. 9, 2010, pp. 388-396.
229. Homann S., Smith D., Little S., Richman D., Guatelli J., "Upregulation of BST-2/Tetherin by HIV infection in vivo", Journal of Virology, Vol. 85, no. 20, 2011, pp. 10659-10668.
230. Hammonds J., Wang J.J., Spearman P., "Restriction of Retroviral Replication by Tetherin/BST-2", Molecular Biology International, Vol. 2012, 2012, pp. 424768.
231. Kuhl B.D., Cheng V., Wainberg M.A., Liang C., "Tetherin and its viral antagonists", Journal of Neuroimmune Pharmacology, Vol. 6, no. 2, 2011, pp. 188-201.
232. Dube M., Bego M.G., Paquay C., Cohen E.A.,"Modulation of HIV-1-host interaction: role of the Vpu accessory protein", Retrovirology, Vol. 7, 2010, pp. 114.
233. Margottin F., Bour S.P., Durand H., Selig L., Benichou S., Richard V., Thomas D., Strebel K., Benarous R., "A novel human WD protein, h-beta TrCp, that interacts with HIV-1 Vpu connects CD4 to the ER degradation pathway through an F-box motif", Molecular Cell, Vol. 1, no. 4, 1998, pp. 565-574.
234. Cao W., Bover L., Cho M., Wen X., Hanabuchi S., Bao M., Rosen D.B., Wang Y.H., Shaw J.L., Du Q., Li C., Arai N., Yao Z., Lanier L.L., Liu Y.J., "Regulation of TLR7/9 responses in plasmacytoid dendritic cells by BST2 and ILT7 receptor interaction", Journal of Experimental Medicine, Vol. 206, no. 7, 2009, pp. 1603-1614.
235. Lande R., Gregorio J., Facchinetti V., Chatterjee B., Wang Y.H., Homey B., Cao W., Wang Y.H., Su B., Nestle F.O., Zal T., Mellman I., Schroder J.M., Liu Y.J., Gilliet M., "Plasmacytoid dendritic cells sense self-DNA coupled with antimicrobial peptide", Nature, Vol. 449, no. 7162, 2007, pp. 564-569.
236. Blanco P., Palucka A.K., Gill M., Pascual V., Banchereau J.,"Induction of dendritic cell differentiation by IFN-alpha in systemic lupus erythematosus", Science, Vol. 294, no. 5546, 2001, pp. 1540-1543.
237. Marshak-Rothstein A., Rifkin I.R.,"Immunologically active autoantigens: the role of toll-like receptors in the development of chronic inflammatory disease", Annual Review of Immunology, Vol. 25, 2007, pp. 419-441.
238. Wenzel J., Bekisch B., Uerlich M., Haller O., Bieber T., Tuting T., "Type I interferon-associated recruitment of cytotoxic lymphocytes: a common mechanism in regressive melanocytic lesions", American Journal of Clinical Pathology, Vol. 124, no. 1, 2005, pp. 37-48.
239. Dunn G.P., Koebel C.M., Schreiber R.D., "Interferons, immunity and cancer immunoediting", Nature Reviews Immunology, Vol. 6, no. 11, 2006, pp. 836-848.
108
240. Jegalian A.G., Facchetti F., Jaffe E.S., "Plasmacytoid dendritic cells: physiologic roles and pathologic states", Advances in Anatomic Pathology, Vol. 16, no. 6, 2009, pp. 392-404.
241. Neron S., Thibault L., Dussault N., Cote G., Ducas E., Pineault N., Roy A., "Characterization of mononuclear cells remaining in the leukoreduction system chambers of apheresis instruments after routine platelet collection: a new source of viable human blood cells", Transfusion, Vol. 47, no. 6, 2007, pp. 1042-1049.
242. Dietz A.B., Bulur P.A., Emery R.L., Winters J.L., Epps D.E., Zubair A.C., Vuk-Pavlovic S., "A novel source of viable peripheral blood mononuclear cells from leukoreduction system chambers", Transfusion, Vol. 46, no. 12, 2006, pp. 2083-2089.
243. Rossio J.L., Esser M.T., Suryanarayana K., Schneider D.K., Bess J.W., Jr., Vasquez G.M., Wiltrout T.A., Chertova E., Grimes M.K., Sattentau Q., Arthur L.O., Henderson L.E., Lifson J.D., "Inactivation of human immunodeficiency virus type 1 infectivity with preservation of conformational and functional integrity of virion surface proteins", Journal of Virology, Vol. 72, no. 10, 1998, pp. 7992-8001.
244. Widner B., Werner E.R., Schennach H., Wachter H., Fuchs D., "Simultaneous measurement of serum tryptophan and kynurenine by HPLC", Clinical Chemistry, Vol. 43, no. 12, 1997, pp. 2424-2426.
245. Neil S.J., Sandrin V., Sundquist W.I., Bieniasz P.D., "An interferon-alpha-induced tethering mechanism inhibits HIV-1 and Ebola virus particle release but is counteracted by the HIV-1 Vpu protein", Cell Host Microbe, Vol. 2, no. 3, 2007, pp. 193-203.
246. Nomaguchi M., Fujita M., Adachi A., "Role of HIV-1 Vpu protein for virus spread and pathogenesis", Microbes and Infection, Vol. 10, no. 9, 2008, pp. 960-967.
247. O'Doherty U., Peng M., Gezelter S., Swiggard W.J., Betjes M., Bhardwaj N., Steinman R.M., "Human blood contains two subsets of dendritic cells, one immunologically mature and the other immature", Immunology, Vol. 82, no. 3, 1994, pp. 487-493.
248. Kohrgruber N., Halanek N., Groger M., Winter D., Rappersberger K., Schmitt-Egenolf M., Stingl G., Maurer D., "Survival, maturation, and function of CD11c- and CD11c+ peripheral blood dendritic cells are differentially regulated by cytokines", Journal of Immunology, Vol. 163, no. 6, 1999, pp. 3250-3259.
249. Yoneyama H., Matsuno K., Zhang Y., Nishiwaki T., Kitabatake M., Ueha S., Narumi S., Morikawa S., Ezaki T., Lu B., Gerard C., Ishikawa S., Matsushima K., "Evidence for recruitment of plasmacytoid dendritic cell precursors to inflamed lymph nodes through high endothelial venules", International Immunology, Vol. 16, no. 7, 2004, pp. 915-928.
250. Forster R., Schubel A., Breitfeld D., Kremmer E., Renner-Muller I., Wolf E., Lipp M., "CCR7 coordinates the primary immune response by establishing
109
functional microenvironments in secondary lymphoid organs", Cell, Vol. 99, no. 1, 1999, pp. 23-33.
251. Seth S., Oberdorfer L., Hyde R., Hoff K., Thies V., Worbs T., Schmitz S., Forster R., "CCR7 essentially contributes to the homing of plasmacytoid dendritic cells to lymph nodes under steady-state as well as inflammatory conditions", Journal of Immunology, Vol. 186, no. 6, 2011, pp. 3364-3372.
252. Penna G., Sozzani S., Adorini L., "Cutting edge: selective usage of chemokine receptors by plasmacytoid dendritic cells", Journal of Immunology, Vol. 167, no. 4, 2001, pp. 1862-1866.
253. Krug A., Uppaluri R., Facchetti F., Dorner B.G., Sheehan K.C., Schreiber R.D., Cella M., Colonna M., "IFN-producing cells respond to CXCR3 ligands in the presence of CXCL12 and secrete inflammatory chemokines upon activation", Journal of Immunology, Vol. 169, no. 11, 2002, pp. 6079-6083.
254. Vanbervliet B., Bendriss-Vermare N., Massacrier C., Homey B., de B.O., Briere F., Trinchieri G., Caux C., "The inducible CXCR3 ligands control plasmacytoid dendritic cell responsiveness to the constitutive chemokine stromal cell-derived factor 1 (SDF-1)/CXCL12", Journal of Experimental Medicine, Vol. 198, no. 5, 2003, pp. 823-830.
255. Kohrgruber N., Groger M., Meraner P., Kriehuber E., Petzelbauer P., Brandt S., Stingl G., Rot A., Maurer D., "Plasmacytoid dendritic cell recruitment by immobilized CXCR3 ligands", Journal of Immunology, Vol. 173, no. 11, 2004, pp. 6592-6602.
256. Ohl L., Mohaupt M., Czeloth N., Hintzen G., Kiafard Z., Zwirner J., Blankenstein T., Henning G., Forster R., "CCR7 governs skin dendritic cell migration under inflammatory and steady-state conditions", Immunity, Vol. 21, no. 2, 2004, pp. 279-288.
257. Schmid M.A., Takizawa H., Baumjohann D.R., Saito Y., Manz M.G., "Bone marrow dendritic cell progenitors sense pathogens via Toll-like receptors and subsequently migrate to inflamed lymph nodes", Blood, Vol. 118, no. 18, 2011, pp. 4829-4840.
258. Zhou L.J., Tedder T.F., "CD14+ blood monocytes can differentiate into functionally mature CD83+ dendritic cells", Proceedings of the National Academy of Sciences of the United States of America, Vol. 93, no. 6, 1996, pp. 2588-2592.
259. Berchtold S., Muhl-Zurbes P., Heufler C., Winklehner P., Schuler G., Steinkasserer A., "Cloning, recombinant expression and biochemical characterization of the murine CD83 molecule which is specifically upregulated during dendritic cell maturation", FEBS Letters, Vol. 461, no. 3, 1999, pp. 211-216.
260. Ohtomo T., Sugamata Y., Ozaki Y., Ono K., Yoshimura Y., Kawai S., Koishihara Y., Ozaki S., Kosaka M., Hirano T., Tsuchiya M., "Molecular cloning and characterization of a surface antigen preferentially overexpressed on multiple myeloma cells", Biochemical and Biophysical Research Communications, Vol. 258, no. 3, 1999, pp. 583-591.
110
261. Hinz A., Miguet N., Natrajan G., Usami Y., Yamanaka H., Renesto P., Hartlieb B., McCarthy A.A., Simorre J.P., Gottlinger H., Weissenhorn W., "Structural basis of HIV-1 tethering to membranes by the BST-2/tetherin ectodomain", Cell Host Microbe, Vol. 7, no. 4, 2010, pp. 314-323.
262. Benlahrech A., Yasmin A., Westrop S.J., Coleman A., Herasimtschuk A., Page E., Kelleher P., Gotch F., Imami N., Patterson S., "Dysregulated immunophenotypic attributes of plasmacytoid but not myeloid dendritic cells in HIV-1 infected individuals in the absence of highly active anti-retroviral therapy", Clinical and Experimental Immunology, Vol. 170, no. 2, 2012, pp. 212-221.
263. Zhang Z., Wang F.S., "Plasmacytoid dendritic cells act as the most competent cell type in linking antiviral innate and adaptive immune responses", Cellular & Molecular Immunology, Vol. 2, no. 6, 2005, pp. 411-417.
264. Matta B.M., Castellaneta A., Thomson A.W., "Tolerogenic plasmacytoid DC", European Journal of Immunology, Vol. 40, no. 10, 2010, pp. 2667-2676.
265. Manzo C., Ruggiero G., del V.L., Racioppi L., Pirozzi G., Temponi M., Ferrone S., Fontana S., Zappacosta S., "Monoclonal antibody OKT3-induced T cell proliferation: differential role of HLA class II determinants expressed by T cells and monocytes", Cellular Immunology, Vol. 125, no. 1, 1990, pp. 79-91.
266. FlowJo website. http://www.flowjo.com/home/tutorials/TN/proliferationweb2010.pdf. 2012.
267. Shen D., "A high affinity CD3 monoclonal antibody HIT3a. I. Production and identification", Zhongguo Yi Xue Ke Xue Yuan Xue Bao, Vol. 15, no. 3, 1993, pp. 157-162.
268. Schoenborn J.R., Wilson C.B., "Regulation of interferon-gamma during innate and adaptive immune responses", Advances in Immunology, Vol. 96, 2007, pp. 41-101.
269. Amsen D., Spilianakis C.G., Flavell R.A., "How are T(H)1 and T(H)2 effector cells made?", Current Opinion in Immunology, Vol. 21, no. 2, 2009, pp. 153-160.
270. Vogel S.N., Kaufman E.N., Tate M.D., Neta R., "Recombinant interleukin-1 alpha and recombinant tumor necrosis factor alpha synergize in vivo to induce early endotoxin tolerance and associated hematopoietic changes", Infection and Immunity, Vol. 56, no. 10, 1988, pp. 2650-2657.
271. Moore K.W., O'Garra A., de Waal M.R., Vieira P., Mosmann T.R., "Interleukin-10", Annual Review of Immunology, Vol. 11, 1993, pp. 165-190.
111
APPENDIX 1
112
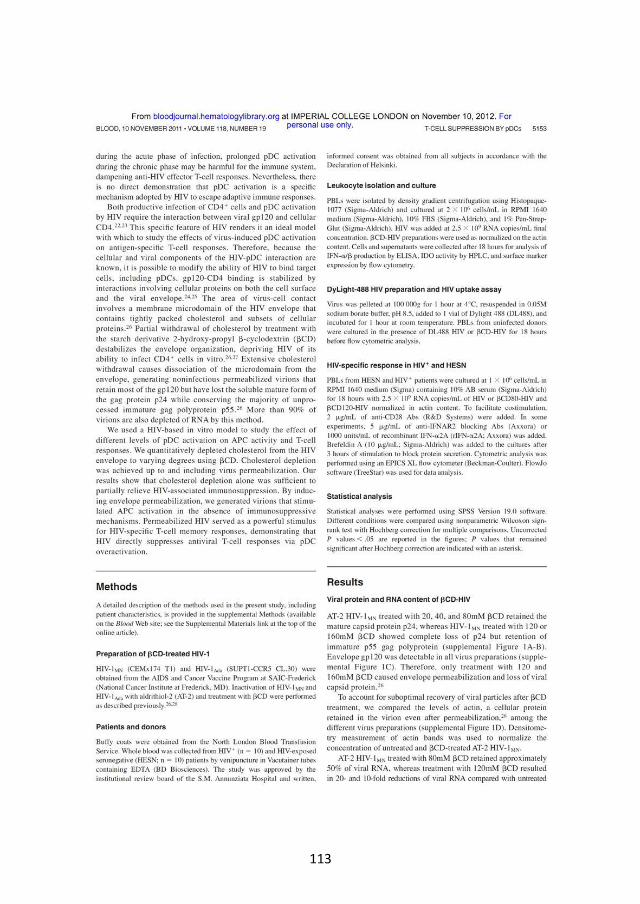
113
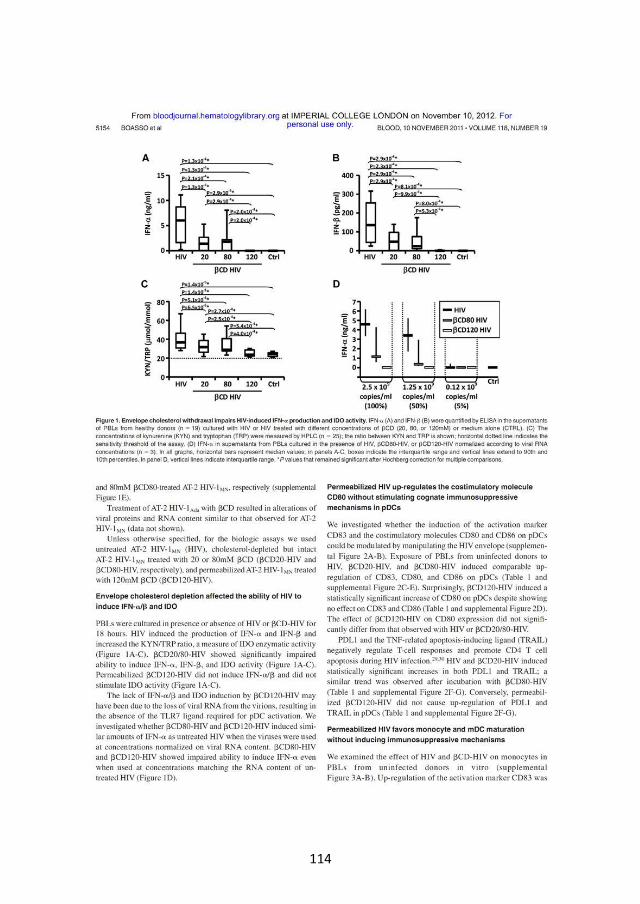
114
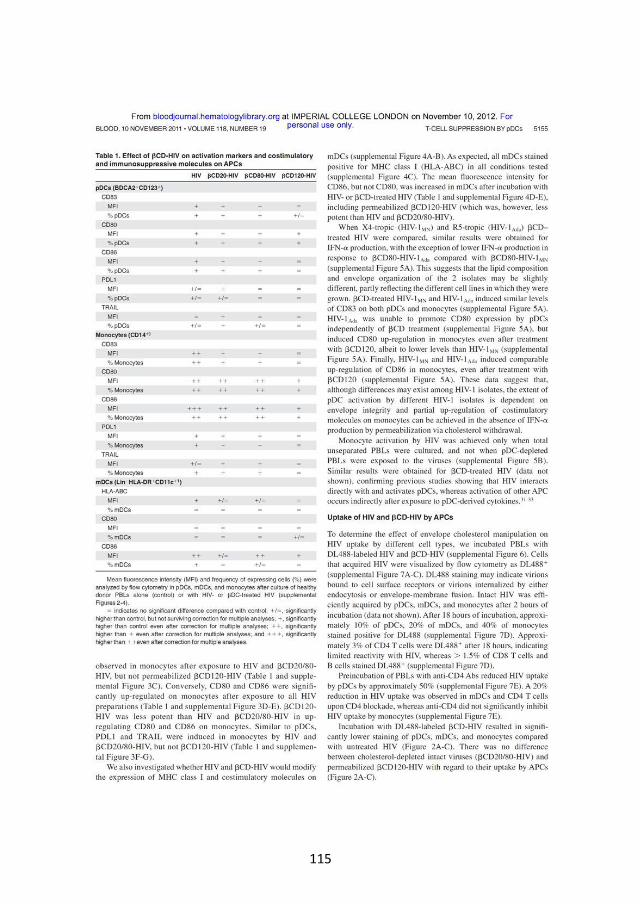
115
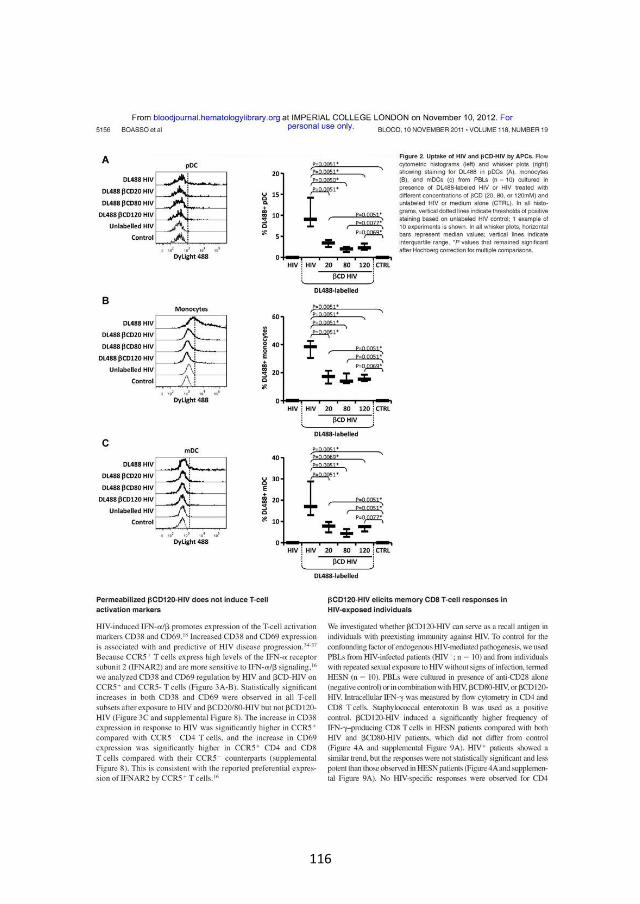
116
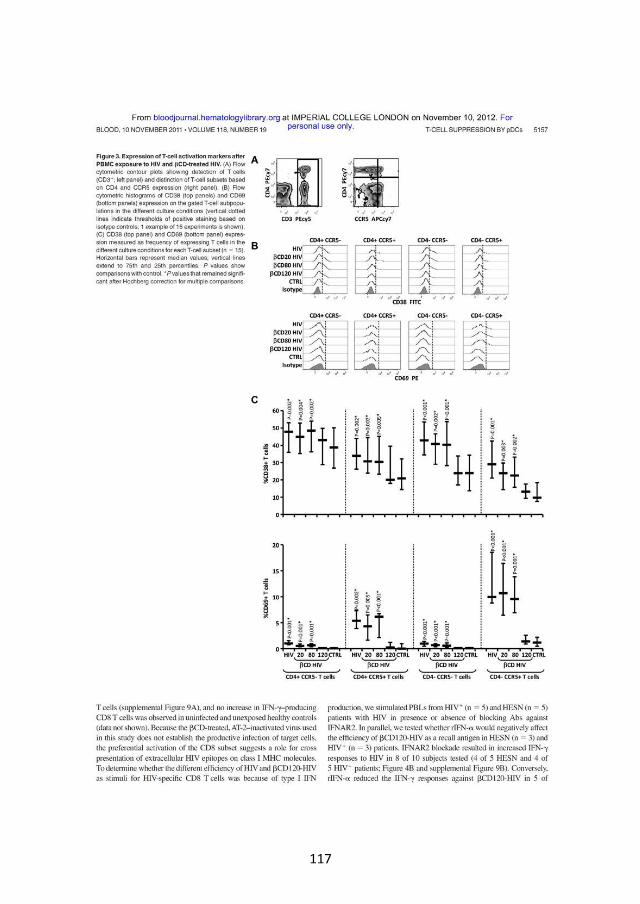
117

118
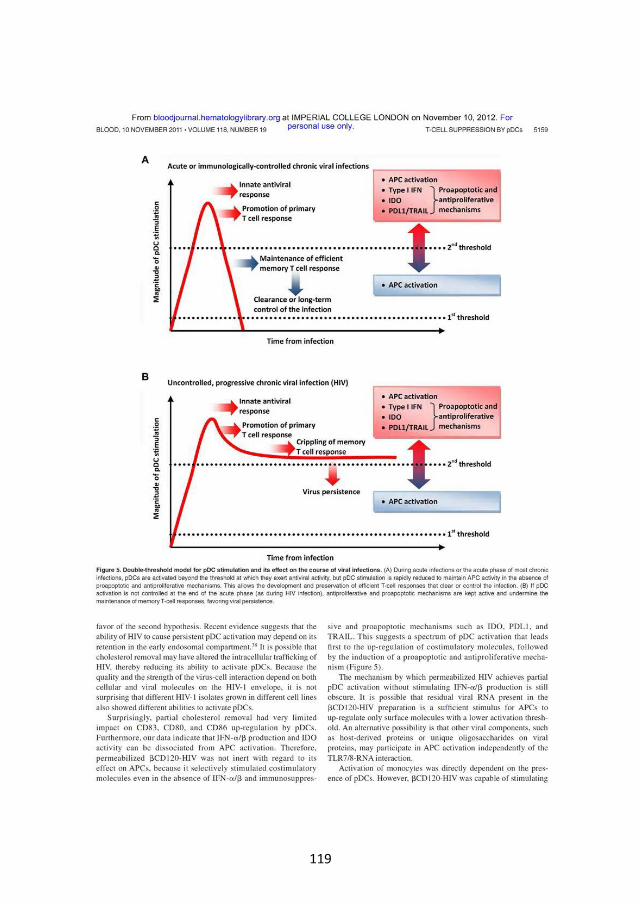
119
120
121
122
123
APPENDIX 2
Under Review - Journal of Immunology
MS 12-02391-FL, submitted 27-08-2012, returned for revision 03-10-2012
MS 12-02391-FLR, submitted 07-11-2012
Immunoglobulin-like transcript 7 (ILT7) but not bone marrow stromal cell antigen 2
(BST2, aka HM1.24, tetherin or CD317) modulates plasmacytoid dendritic cell function
(pDC) in primary human blood leukocytes
Barbara Tavano*†, Rui Pedro Galao‡, David R Graham§, Stuart JD Neil‡, Veronica N Aquino§,
Dietmar Fuchs¶, Adriano Boasso*
* Immunology Section, Chelsea and Westminster Hospital, Division of Infectious Diseases,
Department of Medicine, Faculty of Medicine, Imperial College, London SW10 9NH, UK.
* Cattedra di Immunologia, Università degli Studi di Milano, Milan 20157, Italy.
‡ Department of Infectious Disease, King's College London School of Medicine, Guy's
Hospital, London, UK.
§ Retrovirus Laboratory, Department of Molecular and Comparative Pathobiology, Johns
Hopkins University School of Medicine, Baltimore, MD 21205, USA.
¶ Division of Biological Chemistry, Biocenter, Medical University, 6020 Innsbruck, Austria.
Corresponding author: Dr. Adriano Boasso
Immunology Section, Chelsea and Westminster Hospital
369 Fulham Road, London, SW10 9NH, UK
Tel. +44 (0) 2033155993
Fax. +44 (0) 2033155997
e-mail: [email protected]
Running title: ILT7 and BST2 in primary blood leukocytes
Footnote. This work was supported by the Wellcome Trust (awards n. 085164/Z/08/Z
and 085164/Z/08/A for AB and BT; WT082274MA for SJDN).
124
ABSTRACT
The immunoglobulin-like transcript (ILT) 7 is a surface molecule selectively expressed by
human plasmacytoid dendritic cells (pDCs). ILT7 cross-linking suppresses pDC activation
and type I interferon (IFN-I) secretion following Toll-like receptors (TLR)7/9 engagement.
The bone marrow stromal cell antigen 2 (BST2, aka HM1.24, tetherin or CD317) is
expressed by different cell types upon exposure to IFN-I and is a natural ligand for ILT7.
Here we show that ILT7 expression decreased spontaneously in pDCs upon in vitro culture,
which correlates with pDC differentiation measured as increased side scatter properties
and CCR7 expression. TLR7/9 Ligands , as well as HIV, induced BST2 upregulation on all
tested cell types except T cells, which required TCR stimulation to respond to TLR9L-
induced IFN-I. IFN-, IL-4, IL-10 and TNF- had only marginal effects on BST2 expression in
blood leukocytes compared to TLR9L. Pre-incubation with ILT7-crosslinking Ab inhibited
IFN-I production in PBMCs treated with TLR7/9L or HIV, whereas BST2 blockade did not
affect IFN-I responses even when BST2 upregulation was further boosted with TCR
agonists or immunoregulatory cytokines. Our data indicate that BST2-mediated ILT7 cross-
linking may act as a homeostatic regulatory mechanism on immature circulating pDC
precursors, rather than a negative feedback for activated mature pDCs which have
downregulated ILT7.
125
INTRODUCTION
Plasmacytoid dendritic cells (pDCs) are a subpopulation of blood leukocytes which play a
key role in the innate immune response against viral infections. Blood pDCs are precursors
of the immature pDCs which patrol tissues and mucosal area for the presence of
pathogens, and which can mature into fully functional pDCs upon recognition of
pathogen-associated molecular patterns (PAMPs) (1, 2). Plasmacytoid DCs express
endosomal toll-like receptors (TLR) 7 and 9 (1, 2). TLR7 and TLR9 are respectively triggered
by single-stranded RNA and unmethylated CpG-rich DNA, which are characteristic of most
viral genomes (2). Thus, pDC are directly activated by the engulfed viral pathogens and
they produce large amounts of type I interferon (IFN-I; IFN- and IFN-) in response to
viral stimuli (1). IFN-I exert antiviral activity by inducing intracellular restriction factors
which interfere with viral replication (3), and by promoting apoptosis of potentially
infected cells (4). Furthermore, IFN-I contribute to shape the adaptive immune response
by promoting maturation of other antigen-presenting cells (APCs) and favouring the
differentiation of CD4 T cells toward a T helper type 1 (Th1) phenotype. Activated pDC also
express high levels of the tryptophan-catabolizing enzyme indoleamine 2,3 dioxygenase
(IDO), which exerts powerful immunoregulatory activity and plays a critical role in the
maintenance of immune tolerance (5).
The tight regulation of pDC responses is critical to allow the smooth transition from an
innate immune response to an antigen (Ag)-specific T cell-mediated immune response (1,
6). Studies conducted in murine models have shown that T cell responses to immunization
can be enhanced if the TLR9 ligand (TLR9L) CpG oligodeoxynucleotide (ODN) is
administered locally at the site of immunization (7); whereas Ag-specific T cell responses
are inhibited by an IDO-dependent mechanism upon systemic administration of TLR9L in
the same immunization setting (7). Furthermore, prolonged pDC stimulation with TLR9L or
TLR7L had deleterious effects on lymphoid tissue architecture, lymphocyte populations
and both cell-mediated and humoral immune responses in mice (8, 9). In humans,
dysregulated pDC activation contributes to suppress immune responses during chronic
pathologic conditions, such as cancer and chronic infections (10-13). In particular, during
pathogenic HIV infection, pDC activation is thought to contribute to several aspects of
chronic immune activation and immune exhaustion, such as T cells apoptosis, dysfunction
and phenotypic activation (14-18); systemic diffusion of the infection via chemoattraction
of CCR5+ CD4 T cells (19); and alteration of the Th17/regulatory T cells balance (18, 20,
21). Additionally, in non-human primate (NHP) models of simian immunodeficiency virus
(SIV) infection, persistent upregulation of IFN-stimulated genes (ISGs) beyond the acute
phase is observed only in pathogenic infection of non-natural hosts (Rhesus macaques),
and not in non-pathogenic infection of natural host NHPs (Sooty mangabeys and African
green monkeys) (22, 23). Thus, physiologic mechanisms that limit IFN-I production may be
126
dysfunctional during HIV infection, and fail to drive the contraction of innate immune
responses.
The immunoglobulin-like transcript 7 (ILT7; CD85g; LILRA4) was identified as a surface
molecule selectively expressed by pDC (24). ILT7 is expressed in association with the
FcRI chain, and cross-linking of ILT7 results in a FcRI-transduced circuit, involving Src
and Syk kinases and activation of ITAM signalling, which limits pDC activation following
TLR7 or TLR9 engagement (25). The bone marrow stromal cell antigen 2 (BST2, HM1.24,
tetherin, CD317) has been recently identified as a natural ligand for ILT7 (26). BST2 is a
homodimeric surface protein encoded by an ISG, and its expression can be induced in
several different cell types (27, 28). In vivo expression profiling studies have revealed that
BST2 is expressed at different levels in specialized cells in a variety of human tissues,
including hepatocytes, pneumocytes, plasma cells, monocytes and vascular endothelium
(29). BST2 is also known as tetherin, due to its ability to interfere with the release of
enveloped viruses, such as HIV-1, by binding newly formed virions (tethering action) and
promoting their endocytosis and degradation in intracellular compartments (30, 31). In
addition, mouse studies have shown that BST2 can be used as a target for antigen delivery
to pDC, which can induce efficient T cell immunity after TLR stimulation (32). Engagement
of ILT7 by BST2 has been suggested to suppress pDC activation (26). Thus, BST2 may play a
critical role in the physiologic regulation of pDC-mediated IFN-I responses. Upon
activation, pDCs produce high levels of IFN-I which may induce BST2 upregulation in
surrounding cells; BST2 may then interact with ILT7-expressing pDCs causing
downregulation of IFN-I and return to the original resting condition.
We tested the dynamics of BST2 and ILT7 expression and regulation in primary human
blood leukocytes and their role in modulating pDC activation. We found that ILT7 is rapidly
downregulated in pDCs upon in vitro culture and differentiation, and that ILT7 cross-
linking inhibits IFN- production following stimulation with TLR9L or HIV. However, BST2
blockade did not enhance IFN- responses in vitro, even when BST2 upregulation was
induced in virtually all circulating leukocytes, raising doubts on the physiologic relevance
of BST2/ILT7 interactions. Based on our findings we propose that ILT7 may exert its
immunomodulatory activity only on immature circulating pDCs, therefore providing a
basic homeostatic mechanism rather than a negative feedback control on activated pDCs.
127
METHODS
Leukocytes isolation and culture. Leukoreduction system chambers (LRSCs) from healthy
blood-bank donors were obtained from the North London Blood Transfusion Service.
Peripheral blood mononuclear cells (PBMCs) were isolated by density gradient
centrifugation using Histopaque-1077 (Sigma-Aldrich, Poole, UK) and cultured at 2x10⁶
cells/ml in RPMI 1640 (PAA Laboratories GmbH, Pasching, Austria), 10% fetal bovine
serum (Sigma-Aldrich) and 1% Pen-Strep-Glut (Sigma-Aldrich).
Stimulation of PBMCs with TLR ligands, HIV, cytokines and T cell receptor agonist.
PBMCs were cultured in presence or absence of specific stimuli for different periods of
time, depending on the experimental setting, as described in the Results section. The TLR9
ligand (TLR9L) CpG oligodeoxyribonucleotide (ODN) type A (Invivogen, San Diego, CA, USA)
was used at 0.75uM final concentration. The TLR7 ligand (TLR7L) R848 (Imiquimod;
Invivogen) was used at 5ug/ml final concentration. HIV-1MN/CEMx174 was obtained from
the AIDS and Cancer Vaccine Program (SAIC-NCI at Frederick). Inactivation of HIV-1MN with
aldrithiol-2 (AT-2) was performed as previously described (33). AT-2 HIV (referred to as
HIV from now on) was added to PBMC cultures at 9x10⁸ RNA copies/ml final
concentration. IFN-, interleukin (IL)-10, tumor necrosis factor (TNF)- (all from Miltenyi
Biotec, Surrey, UK) and IL-4 (R&D Systems, Abingdon, UK) were used at 10 ng/ml (TNF-,
IL10) or 1000 U/ml (IFN- and IL-4) final concentrations. The CD3-specific antibody (Ab)
HIT3a (BD biosciences, Oxford, UK) was used at 1 g/ml final concentration as mitogenic
stimulus for T cells; the CD28-specifc antibody CD28.2 (BD biosciences) was used as
control (1 g/ml) final concentration.
ILT7 cross-linking and BST2 blockade. PBMCs were incubated with the cross-linking ILT7-
specific antibody 17G10.2 (eBioscence, Hatfield, UK) at 10g/ml final concentration or
with the blocking BST2-specific antibody 26F8 (eBioscence) at 1.25g/ml or 5g/ml final
concentration for 30 minutes before stimulation with TLR7/9L or HIV. Blocking antibodies
against IFN- receptor subunit 2 (IFNAR2; PBL Interferon Source, Piscataway, NJ, USA) and
IFN- receptor subunit 1 (IFNGR1; R&D Systems) were both used at 10g/ml final
concentration.
IFN- and - ELISA. IFN- was quantified in culture supernatants using the human IFN-
multi subtype ELISA kit (PBL Interferon Source) following manufacturer’s instruction.
Tryptophan and kynurenine measurement. Tryptophan and kynurenine were detected in
culture supernatants using high performance liquid chromatography (HPLC) (34).
Flow cytometry. Cells were incubated for 20 min at room temperature with different
combinations of the following anti-human antibodies: BST2 (CD317) AlexaFluor 488 clone
128
26F8, CD317 Phycoerythrin (PE) clone 26F8, CD19 Allophycyanin (APC)-eFluor 780 clone
HIB19, ILT7 (CD85g) Peridinin Chlorophyll Protein Complex (PerCP)-Cy5.5 clone 17G10.2,
CD3 PE-Cy7 clone UCHT1, BDCA1 (CD1c) PerCP-eFluor 710 clone L161, CD80 Fluorescein
isothiocyanate (FITC) clone 2D10.4, CD83 PE clone HB15e, CD8 APC clone SK1, CD40 PE
clone 5c3 all purchased from eBioscence;- CD123 PE-Cy7 clone 6H6, CD4 Pacific blue clone
SK3, CD86 pacific blue IT2.2 purchased from Biolegend, London, UK; CD14 APC-H7 clone
6MPφ9, CD14 APC clone 6MPφ9 purchased from BD Bioscience; BDCA3 (CD141) FITC
clone AD5-14H12, BDCA2 (CD303) APC clone AC144 purchased from Miltenyi Biotec. Cells
were washed twice with staining buffer (BD Bioscience) and fixed with BD cytofix buffer
(BD Bioscience). FACS analysis was performed on a LSR-II flow cytometer using FACSDiva
software (BD Bioscience). FlowJo software (Treestar, Ashland, OR) was used for data
analysis. Fluorescence minus one (FMO) controls were used to establish positivity
thresholds.
BST2 staining of IFN--treated and BST2-transfected 293T cells. To verify the specificity
of the 26F8 antibody for BST2, we used PE-conjugated 26F8 to stain confluent 293T cells
which had been treated or not with recombinant IFN- (PBL Interferon Source) overnight
and 293T cells which were stably transfected with the human wild-type bst2 gene or bst2
bearing the following mutations: a) L123P, disrupted in the third heptad repeat in the
extracellular coiled; b) ΔGPI, mutated in the extracellular anchor; c) 3CA, lacking the
dimerization site; and d) Y6,8A and 10-12A, both mutated in the intracellular region. Cells
were cultured in 24 well cell culture clusters until confluence in DMEM high glucose (PAA),
10% fetal bovine serum (Sigma-Aldrich) and 1% Pen-Strep (Sigma-Aldrich). Transfected
cells were maintained by adding Hygromycin B (invitrogen, Paisley, UK) diluited 1:500 in
media. Confluent cells were treated with trypsin (Invitrogen) and washed twice. Staining
and flow cytometry analysis were performed as described above.
Statistical analysis. Statistical analyses were performed using SPSS 19.0 software (SPSS
Inc., Chicago, IL, USA). Pairwise comparisons between control and stimulated cells were
performed using non-parametric Wilcoxon sign rank test. Changes in measured
parameters over time in kinetic experiments were analyzed using Friedman’s two-way
analysis of variance (ANOVA) by ranks, and pairwise comparisons were subjected to
Dunn’s post-hoc correction for multiple analyses. P values lower than 0.05 were
considered statistically significant.
129
RESULTS
ILT7 expression is limited to pDCs and is downregulated during in vitro culture. As
expected, overnight culture resulted in partial loss of pDCs (Supplemental Fig. 1A), and
reduction of BDCA2 expression (Supplemental Fig. 1A). Expression of ILT7 has been
reported to be strictly limited to pDCs (24). Our analysis of freshly isolated primary PBMCs
from healthy donors confirmed the selective expression of ILT7 by pDCs (Fig. 1A and 1B).
ILT7 expression decreased progressively during in vitro culture, following a linear profile
during the first six hours of culture (R2=0.9625; Fig. 1C), and was dramatically reduced
after overnight culture (Fig. 1D). The decrease in ILT7 was observed both when the
frequency of ILT7+ pDCs (Fig. 1C and 1D) and ILT7 MFI (Supplemental Fig. 1B and 1C) were
considered. ILT7 downregulation appeared to be due to a generalized decrease of surface
expression on all pDCs, rather than the selective reduction in one subpopulation of pDCs
(Supplemental Fig. 1B). Stimulation with TLR9L or HIV did not prevent ILT7
downregulation, despite promoting pDC activation as measured by upregulation of the
activation marker CD83 (Fig. 1D).
ILT7 downregulation is associated with morphologic and phenotypic changes consistent
with differentiation of blood pDC precursors. In vitro culture results in spontaneous
differentiation of pDC precursors into immature pDCs, which can be activated in presence
of adequate stimulation. We tested whether ILT7 downregulation was associated with
changes in the morphology and surface molecule expression pattern of pDCs. The
reduction in ILT7 expression was associated with an increase in side scatter properties
(SSC) of pDCs after overnight culture of unsorted PBMCs (Fig. 2A and 2B), indicating
augmented intracellular complexity, granularity and dendritic morphology. TLR7L
appeared to induce a more rapid downregulation of ILT7 which was expressed at
significantly lower levels compare to untreated and TLR9L- and HIV-treated cells after 6
hours culture. Conversely, TLR9L and HIV, but not TLR7L, induced a more rapid increase in
SSC compared to media alone, as indicated by significantly higher SSC after 6 hours
culture. The change in pDC morphology occurred independent of whether PBMCs were
cultured in media only or with TLR7/9L or HIV (Fig. 2A and 2B). Furthermore, expression of
the chemokine receptor CCR7, associated with homing to secondary lymphoid tissues such
as lymph nodes, spontaneously increased in pDCs during in vitro culture (Fig. 2B) in media
alone, and was further enhanced when PBMCs were cultured in presence of TLR7/9L or
HIV (Fig. 2B). Conversely, a mild increase in the expression of the pDC activation marker
CD83 was observed only transiently at 6 hours culture in unstimulated PBMCs, whereas it
was higher and persistent in pDCs from TLR7/9L- or HIV-treated PBMCs (Fig. 2A and 2B).
ILT7 downregulation was also associated with increased expression of the costimulatory
molecules CD40, CD80 and CD86 in pDCs after overnight incubation with TLR9L, but not in
media alone (Supplemental Fig. 1D and 1E).
130
These data collectively suggest that ILT7 downregulation is associated with a process of
pDC differentiation, characterized by increased morphological complexity and CCR7
expression, but not with activation and full maturation, epitomized by increased
expression of the activation marker CD83 and costimulatory molecules (CD80, CD86 and
CD40), which occurred only following TLR stimulation.
BST2 expression is upregulated following PBMC incubation with TLR7/9L, but is not
sufficient to suppress IFN- production via ILT7 cross-linking. We tested the expression
of BST2 on freshly isolated PBMCs and on leukocytes cultured overnight in presence or
absence of TLR7/9L or HIV. TLR9L, TLR7L and HIV directly activate pDC and induce IFN-
production, which is a known inducer of BST2 (28). Among freshly isolated PBMCs, only
monocytes (CD14+) expressed constitutively high levels of BST2, intermediate levels were
observed in mDCs and B cells, whereas a minor portion of pDCs and T cells tested positive
for BST2 (Fig. 3A and Supplemental Fig. 2A). In vitro overnight culture of PBMCs with
TLR7L, TLR9L or HIV induced different degrees of BST2 upregulation depending on the cell
types analyzed (Fig. 3B and Supplemental Fig. 2B). Thus, pDCs became highly positive for
BST2 when PBMCs were cultured with TLR7L, TLR9L or HIV (Fig. 3B and Supplemental Fig.
2B). Myeloid DC showed a reduction of BST2 expression after overnight culture in the
absence of stimuli (p=0.0001; compare Fig. 3A and 3B), but treatment of PBMCs with
TLR7/9L or HIV resulted in a significant upregulation of BST2 on mDCs compared to
untreated control (Fig. 3B and Supplemental Fig. 2B). B cells partially upregulated BST2
when PBMCs were treated with either TLR7/9L or HIV (Fig. 3B and Supplemental Fig. 2B). T
cells showed minor alterations of BST2 expression, which tested significant only after
stimulation with TLR7L or HIV (Fig. 3B and Supplemental Fig. 2B). Because the frequency
of BST2+ monocytes approached 100% even in the absence of stimulation (Fig. 3A, 3B and
Supplemental Fig. 2A, 2B), we investigated whether BST2 expression was upregulated on
monocytes on a per-cell basis by analyzing the mean fluorescence intensity (MFI) of anti-
BST2 Ab staining. BST2 expression was increased in monocytes following PBMCs
treatment with TLR7/9L or HIV (Fig. 3C and Supplemental Fig. 2B). As expected, BST2
upregulation was inhibited on all cell types when the subunit 2 of the IFN- receptor
(IFNAR2) was blocked by pre-incubation of PBMCs with 5g/ml anti-IFNAR2 Ab for 30min
before stimulation with TLR7/9L or HIV (data not shown). These data are consistent with
the regulation of BST2 expression by IFN-I produced by TLR7/9-stimulated pDC, and
corroborate the findings by Homann et al. and Bego et al. showing BST2 regulation by TLR
agonists and IRF7, respectively (35, 36).
We tested the effect of one ILT7-specific (17G10.2) and one BST2-specific Ab (26F8) on
TLR9L-induced IFN- production in PBMCs. Clone 17G10.2 has been used in plate-bound
form to cross-link ILT7 and suppress pDC activation (25), whereas 26F8 was reported to
block BST2-ILT7 interaction (26). Based on the observed upregulation of BST2 on different
131
cell types upon exposure of PBMCs to TLR7/9L and HIV, we expected 26F8 to increase IFN-
responses by inhibiting BST2-ILT7 interactions. Stimulation with TLR9L, TLR7L and HIV
induced statistically significant increases in IFN- measured in culture supernatants after
overnight culture (Fig. 3D). Pre-incubation (30 minutes before stimulation) with the ILT7-
cross-linking Ab 17G10.2 significantly inhibited TLR9L- and HIV-induced IFN- production,
but did not affect the already low levels of TLR7L-induced IFN-. Conversely, the BST2-
blocking Ab 26F8 had no detectable effect on IFN- production (Fig. 3D). The inhibitory
effect of 17G10.2 was detectable already 6 hours after stimulation of PBMCs with TLR9L,
whereas 26F8 did not show any effect on TLR9L-induced IFN- production at any of the
time points considered (Fig. 3E). 26F8 and 17G10.2 are both mouse IgG1 isotype, and no
effect was observed when isotype control antibodies were used (data not shown).
Because pDC activation leads to upregulation of the immunosuppressive enzyme
indoleamine 2,3 dioxygenase (IDO) and increased catabolism of the essential amino acid
tryptophan (Trp) into the kynurenine (Kyn) pathways (5, 12, 20), we tested whether ILT7
cross-linking or BST2 blockade influenced TLR7/9L- and HIV-induced IDO activity. The ratio
between Kyn and Trp (Kyn:Trp), a well accepted marker of IDO activity (34), was measured
by HPLC in culture supernatants. Similar to IFN-, TLR9L, TLR7L and HIV all induced
statistically significant increases in Kyn:Trp (Fig. 3F). Interestingly, cross-linking of ILT7 by
pre-incubation with 17G10.2 did not reduce TLR9/7L-induced Kyn:Trp, but resulted in a
statistically significant inhibition of HIV-induced IDO activity.
No effect on IFN- production or IDO activity was observed after pre-incubation with 26F8
even when the antibody was used at concentrations up to 10g/ml.
The complete lack of biologic effect of 26F8 prompted us to test its reactivity with the
extracellular portion of BST2 in a controlled in vitro system. We used fluorescently-
labelled (PE) 26F8 to detect BST2 expression by flow cytometry on 293T cells which were
transfected or not with wild-type (wt) BST2 or BST2 bearing specific mutations, as well as
mock-transfected 293T cells which were treated with rIFN-. Efficient staining was
observed using as little as 3g/ml 26F8-PE in rIFN--treated 293T cells and 293T cells
transfected with wild-type BST2 (BST2WT
), but not in mock-transfected untreated cells (Fig.
3G). Furthermore, 26F8-PE efficiently stained 293T cells transfected with BST210-12A
and
BST2Y6,8A
, which bear mutations in the intracellular region of BST2, as well as BST2GPI,
which lacks the extracellular membrane anchor (Fig. 3G). 293T cells transfected with
monomeric BST23CA
also stained positive for 26F8-PE, albeit showing reduced staining on a
per cell basis as measured by MFI. Finally, BST2L123P
mutated in the coiled-coil extracellular
region, presumably the region responsible for ILT7 binding, showed no reactivity
whatsoever with 26F8-PE.
132
Collectively, these data indicate that BST2 blockade does not affect pDC activation in
unsorted PBMC cultures stimulated with either TLR7/9L or HIV, and that this
ineffectiveness is not due to lack of reactivity of the 26F8 antibody with the extracellular
portion of BST2.
T cell receptor engagement enhances TLR9L-induced BST2 expression on T cells, but is
not sufficient to suppress IFN- production via ILT7 cross-linking. To test whether BST2
expression on T cells could be upregulated following direct TCR-dependent stimulation,
we cultured PBMCs with stimulating anti-CD3 Ab (HIT3a) in presence or absence of TLR9L.
When used alone, TLR9L and HIT3a induced a limited increase in BST2 expression on CD4
and CD8 T cells, which tested statistically significant only for CD4 T cells (Fig. 4A).
Interestingly, when TLR9L and HIT3a were used together, we observed a significant
upregulation of BST2 expression by both CD4 and CD8 T cells, indicating a synergistic
effect of TCR stimulation and TLR7/9L-induced IFN-I signalling (Fig. 4A). Activating Ab
specific for CD28 (CD28.2), used as control, did not synergize with TLR9L.
We investigated the mechanism responsible for the synergy between HIT3a and TLR9L.
We first tested whether PBMC stimulation with HIT3a increased the expression of IFNAR2
on T cells, and found no increase in the receptor’s expression following TCR stimulation
(data not shown). Because TCR stimulation activates cytokine production by T cells, we
tested whether the combination of IFN- and IFN- contributed to the upregulation of
BST2 observed on T cells in presence of HIT3a and TLR9L. Preincubation (30min before
stimulation) of PBMCs with anti-IFNAR2 partially prevented TLR9L-induced BST2
upregulation on both CD4 and CD8 T cells, whereas anti-IFNGR1 interfered with the
modest increase in BST2 induced by HIT3a alone (Fig. 4B). When used separately, both
anti-IFNAR2 and anti-IFNGR1 partially inhibited BST2 upregulation on T cells in PBMCs
simultaneously stimulated with TLR9L and HIT3a, and a more potent inhibition was
observed when the two antibodies were used together (Fig. 4B). These data suggest that
both IFN- and IFN- participate to BST2 upregulation on TCR-stimulated T cells in
presence of TLR9L, but do not exclude the contribution of other immune mediators.
Because incubation of PBMCs with TLR9L and TCR-activating HIT3a antibodies induced
high BST2 expression on T cells (Fig. 4C), we tested whether TLR9L-induced IFN-
production may be inhibited in these conditions. PBMCs were cultured overnight with
different combinations of HIT3a, TLR9L and 26F8 (CD28.2 was used as a control for HIT3a),
and IFN- was measured in culture supernatants by ELISA. No reduction of TLR9L-induced
IFN- was observed in any condition analyzed (Fig. 4C), suggesting that even under
conditions of maximum BST2 expression, T lymphocytes do not downregulate pDC
activation by engaging ILT7.
133
IL-10 downregulates IFN- production in response to TLR9L in a BST2/ILT7-independent
manner. We investigated the effect of a panel of cytokines on BST2 expression on
different cell types and their effect on TLR9L-induced BST upregulation. We chose IFN-,
IL-4, IL-10 and TNF- as examples of Th1, Th2, immunosuppressive and proinflammatory
cytokines, respectively. PBMCs from healthy donors were incubated with each cytokine
and cultured overnight; TLR9L was added 2 hours after the cytokine. Incubation with IFN-
or TNF- induced a statistically significant increase in BST2+ pDC even in the absence of
TLR9L (Fig. 5A). IFN- induced a modest, yet significant increase in BST2+ T cells even in
the absence of TLR9L (control median 0.7%, IQR 0.5%-1.2% vs. IFN- median 1.1%, IQR
0.8%-2.2%; P=0.027). No significant increase in BST2 expression was observed in other cell
types after incubation of PBMCs with any cytokine in the absence of TLR9L (data not
shown). Pre-incubation with IL-4 reduced TLR9L-induced upregulation of BST2 in mDC of
approximately 20% (Fig. 5B). Significant reductions of TLR9L-induced upregulation of BST2
were also observed in monocytes after incubation with IFN-, IL-4 and TNF-
(approximately 50%, 40% and 10%, respectively; Fig. 5B). Unexpectedly, pre-incubation
with IL-10 further enhanced the positive effect of TLR9L on BST2 upregulation on
monocytes (Fig. 5B). Pre-incubation of PBMCs with any of the cytokines tested did not
affect BST2 upregulation in other cell types after stimulation of PBMCs with TLR9L (Fig.
5B).
Because we observed an enhancement of TLR9L-mediated BST2 upregulation in
monocytes after pre-treatment with IL-10, we tested whether BST2/ILT7-mediated
suppression of IFN- production would be favoured in presence of IL-10. Stimulation with
TLR9L induced statistically significant IFN- production in untreated PBMCs or PBMCs
which were pre-treated with IFN-, IL-4 or TNF-, but not IL-10 (Fig. 5C). In addition, IFN-
production in response to TLR9L was significantly lower in cells pre-treated with IL-10 or
TNF- compared to untreated cells, but the defects were not corrected by pre-incubation
with 26F8 (Fig. 5C). These data indicated that both the immunosuppressive cytokine IL-10
and the proinflammatory TNF- exert inhibitory activity on IFN- production by TLR9L-
stimulated pDC, but this inhibitory activity is not mediated by BST2-ILT7 interaction.
134
DISCUSSION
The critical function played by pDCs in the early phases of antiviral immune responses
bears the risk of an excessive and uncontrolled activation of IFN-I and IDO, and
subsequent immune dysregulation. Persistent pDC overactivation has been shown to have
deleterious effects on the immune function in murine models (8, 9), and is thought to be a
key contributor to the immunopathogenesis of HIV infection (11). ILT7 is a pDC-specific
surface receptor which, when cross-linked, exerts potent inhibitory activity on pDC
activation (25). The only known natural ligand for ILT7 is the IFN-I-regulated surface
protein BST2, better known for its ability to prevent the release of HIV particles from
infected cells, which is counteracted by the HIV-1 accessory protein Vpu (26, 31). It has
been hypothesized that, upon production of IFN-I by pDCs, surrounding cells may
upregulate BST2 which may in turn suppress pDC activation by cross-linking ILT7, providing
the negative feedback necessary to prevent potentially deleterious pDC overactivation
(26, 27).
Our data collectively argue against a role for BST2 in regulating pDC activity, particularly
IFN- production. Thus, we were unable to enhance pDC responses by blocking BST2 using
the 26F8 antibody. This same antibody has been used to successfully inhibit BST2/ILT7
interactions in other experimental settings, such as ILT7-reporter systems (26), but not in
unsorted human PBMCs, which represent a more physiologically relevant setting.
Conversely, our data indicate that pre-incubation with the ILT7 cross-linking antibody
17G10.2 exerted inhibitory activity on TLR9L- and HIV-induced IFN- production, as well as
HIV-induced IDO activity. One possible explanation for the lack of biologic effect of 26F8
may be the incomplete blocking of BST2. However, in BST2-transfected HEK 293T cell
lines, fluorescently-labelled 26F8 stained 96% of cells, indicating efficient binding to the
vast majority of expressed protein. Furthermore, by using HEK 293T cells transfected with
a panel of BST2 mutants, we confirmed that 26F8 binds to the extracellular coiled-coil
region of the molecule, which is likely the region of interaction with ILT7.
An alternative explanation for the inability of 26F8 to enhance IFN- responses is that
BST2 expression levels in PBMCs are insufficient to cause ILT7 cross-linking. Ligand-
receptor interaction involving pDCs are more likely to occur either in trans with T cells or
in cis within the pDC itself, rather than with other APCs. However, we found that only
monocytes, among freshly isolated PBMCs, express constitutively high levels of BST2.
Upon stimulation of IFN- production with TLR7/9L or HIV, all cell types analyzed, showed
upregulation of BST2 to high levels, with the exception of T cells. Conversely, T cells
required direct TCR engagement and subsequent IFN- production in addition to TLR9L-
induced IFN- to achieve maximum BST2 expression. However, even in conditions in
which BST2 expression was induced in virtually all major cell types, we were unable to
enhance IFN- responses using the BST2-blocking antibody 26F8.
135
Because innate immune responses may be modulated by secreted cytokines present in
the environment, we tested whether BST2-mediated inhibition of pDC activation may rely
on secondary signals provided by proinflammatory or immunoregulatory cytokines. We
found that only IL-10 and, to a much lesser extent, TNF- exerted inhibitory activity on
TLR9L-induced IFN- production. This effect was consistent with both the well known anti-
inflammatory activity of IL-10 (37-39), and with our surprising observation that IL-10
enhanced TLR9L-induced upregulation of BST2 on monocytes. However, BST2 blockade
with 26F8 was ineffective at either improving or fully restoring IL-10-inhibited IFN-
responses. The lack of BST2-mediated pDC regulation in this setting is also supported by
the fact that IFN- inhibited BST2 expression on monocytes, whereas IL-4 inhibited BST2
expression on both monocytes and mDC. However, neither IFN- nor IL-4 affected TLR9L-
induced IFN- production. Finally, TNF- inhibited IFN- production, albeit very mildly,
despite causing a slight reduction in BST2 expression in monocytes.
We cannot exclude that ILT7/BST2 interactions occur in vivo, possibly in lymphoid tissues,
and that such interactions are simply not reproducible in culture in vitro. However, our
data showed that ILT7, albeit exclusively expressed by pDCs among freshly isolated
PBMCs, is rapidly downregulated upon in vitro culture, independently of stimulation with
HIV or TLR7/9L. Our results only partially resemble the decrease in ILT7 expression
observed by Cao et al., who described a slow reduction in ILT7 MFI in human pDCs, even in
presence of IL-3 or TLR9L, but retention of a large population of ILT7+ pDCs after up to 72
hours of in vitro culture (25). Conversely, we found that ILT7 downregulation is extremely
rapid, and results in a pDC population which is homogeneously negative for ILT7,
independent of whether pDC were activated or not. The reasons for this discrepancy
remain unclear. However, our data suggest that ILT7 downregulation is not a consequence
of pDC activation, but rather a spontaneous change occurring during blood pDC
differentiation. Thus, circulating blood pDCs are in an immature state and have the
potential to differentiate into the mature pDCs with full antigen-presenting function which
can be found in lymphoid tissues (40, 41). When cultured in vitro, freshly isolated blood
pDCs differentiate into immature pDCs, which can then mature into fully competent APCs
in response to adequate stimulation (1, 2, 40, 41). Furthermore, pDCs can directly migrate
from blood to inflamed lymph nodes through high endothelial venules (42). The observed
downregulation of ILT7 appears to be part of the blood pDCs differentiation process and
was indeed accompanied by an increase in the cellular morphological complexity,
epitomized by augmented side scatter properties, and by increased expression of the
lymph node homing marker CCR7. Conversely, expression of the activation marker CD83
showed only a modest and transient increase after 6 hours of culture in media alone, and
returned to the original level unless the pDC activating stimuli TLR7/9L or HIV were added
to the culture. Thus, the differentiation of freshly isolated blood pDCs in vitro appears to
occur in two phases: an initial spontaneous step characterized by a morphological change,
136
expression of homing receptors and ILT7 downregulation, and a second step triggered by
TLR7/9 stimulation which promotes full maturation and IFN- production. In light of these
findings, it is tempting to speculate that ILT7 may act as a control mechanism to prevent
or limit the activation of immature pDCs in the peripheral blood, rather than as a negative
feedback on mature activated pDCs.
Benlahrech and colleagues have recently shown that ILT7 expression is reduced in pDCs
from HIV-infected patients when viral replication is not efficiently controlled by therapy
(43). Based on our findings, it is possible that the downregulation of ILT7 observed during
HIV infection is symptomatic of partial or incomplete pDC differentiation due to chronic
stimulation. Consistent with this hypothesis, Sabado and colleagues reported that pDC and
mDC relocation to lymphoid tissues may occur already during primary HIV infection, and
persists throughout the course of disease (44). However, reports on IFN- secretion by
pDCs in lymphoid tissues during chronic HIV infection showed contrasting results. For
example, although IFN- and upregulation of ISGs has been reported in tissues from HIV+
patients (45, 46), Nascimbeni and colleagues showed that pDCs in the spleen of HIV-
infected patients have an immature phenotype and do not contribute to the increased
IFN- production (47). The question may be raised as to whether ILT7 downregulation
may contribute to chronic pDC activation during HIV infection by allowing a lower
activation threshold or an enhanced response to chronic stimulation.
A number of questions arise and remain to be answered. Further studies are required to
test whether ILT7 expression varies among pDCs in different anatomic locations, including
mucosal and lymphoid tissues. Also, the role of BST2 in regulating pDC activation via ILT7
remains unclear, and it is possible that other unidentified ligands promote ILT7 cross-
linking on circulating pDCs. Finally, the potential contribution of the ILT7 impairment to
chronic viral infections or inflammatory disease, as well as the exploitation of this
regulatory system for therapeutic purposes needs to be further evaluated.
137
REFERENCES
1. Colonna, M., G. Trinchieri, and Y. J. Liu. 2004. Plasmacytoid dendritic cells in immunity. Nat Immunol 5:1219-1226.
2. Gilliet, M., W. Cao, and Y. J. Liu. 2008. Plasmacytoid dendritic cells: sensing nucleic acids in viral infection and autoimmune diseases. Nat Rev Immunol 8:594-606.
3. Samuel, C. E. 2001. Antiviral actions of interferons. Clin Microbiol Rev 14:778-809, table of contents.
4. Vilcek, J. 2003. Boosting p53 with interferon and viruses. Nat Immunol 4:825-826. 5. Fallarino, F., S. Gizzi, P. Mosci, U. Grohmann, and P. Puccetti. 2007. Tryptophan
catabolism in IDO+ plasmacytoid dendritic cells. Curr Drug Metab 8:209-216. 6. Steinman, R. M., and H. Hemmi. 2006. Dendritic cells: translating innate to
adaptive immunity. Curr Top Microbiol Immunol 311:17-58. 7. Wingender, G., N. Garbi, B. Schumak, F. Jungerkes, E. Endl, D. von Bubnoff, J.
Steitz, J. Striegler, G. Moldenhauer, T. Tuting, A. Heit, K. M. Huster, O. Takikawa, S. Akira, D. H. Busch, H. Wagner, G. J. Hammerling, P. A. Knolle, and A. Limmer. 2006. Systemic application of CpG-rich DNA suppresses adaptive T cell immunity via induction of IDO. Eur J Immunol 36:12-20.
8. Baenziger, S., M. Heikenwalder, P. Johansen, E. Schlaepfer, U. Hofer, R. C. Miller, S. Diemand, K. Honda, T. M. Kundig, A. Aguzzi, and R. F. Speck. 2008. Triggering TLR7 in mice induces immune activation and lymphoid system disruption, resembling HIV-mediated pathology. Blood.
9. Heikenwalder, M., M. Polymenidou, T. Junt, C. Sigurdson, H. Wagner, S. Akira, R. Zinkernagel, and A. Aguzzi. 2004. Lymphoid follicle destruction and immunosuppression after repeated CpG oligodeoxynucleotide administration. Nat Med 10:187-192.
10. Jegalian, A. G., F. Facchetti, and E. S. Jaffe. 2009. Plasmacytoid dendritic cells: physiologic roles and pathologic states. Adv Anat Pathol 16:392-404.
11. Boasso, A., and G. M. Shearer. 2008. Chronic innate immune activation as a cause of HIV-1 immunopathogenesis. Clin Immunol 126:235-242.
12. Mellor, A. L., and D. H. Munn. 2004. IDO expression by dendritic cells: tolerance and tryptophan catabolism. Nat Rev Immunol 4:762-774.
13. Munn, D. H., and A. L. Mellor. 2004. IDO and tolerance to tumors. Trends Mol Med 10:15-18.
14. Herbeuval, J. P., A. W. Hardy, A. Boasso, S. A. Anderson, M. J. Dolan, M. Dy, and G. M. Shearer. 2005. Regulation of TNF-related apoptosis-inducing ligand on primary CD4+ T cells by HIV-1: role of type I IFN-producing plasmacytoid dendritic cells. Proc Natl Acad Sci U S A 102:13974-13979.
15. Stary, G., I. Klein, S. Kohlhofer, F. Koszik, T. Scherzer, L. Mullauer, H. Quendler, N. Kohrgruber, and G. Stingl. 2009. Plasmacytoid dendritic cells express TRAIL and induce CD4+ T-cell apoptosis in HIV-1 viremic patients. Blood 114:3854-3863.
16. Boasso, A., A. W. Hardy, A. L. Landay, J. L. Martinson, S. A. Anderson, M. J. Dolan, M. Clerici, and G. M. Shearer. 2008. PDL-1 upregulation on monocytes and T cells by HIV via type I interferon: Restricted expression of type I interferon receptor by CCR5-expressing leukocytes. Clin Immunol.
138
17. Rodriguez, B., M. M. Lederman, W. Jiang, D. A. Bazdar, K. Garate, C. V. Harding, and S. F. Sieg. 2006. Interferon-alpha differentially rescues CD4 and CD8 T cells from apoptosis in HIV infection. Aids 20:1379-1389.
18. Boasso, A., A. W. Hardy, S. A. Anderson, M. J. Dolan, and G. M. Shearer. 2008. HIV-induced type I interferon and tryptophan catabolism drive T cell dysfunction despite phenotypic activation. PLoS ONE 3:e2961.
19. Li, Q., J. D. Estes, P. M. Schlievert, L. Duan, A. J. Brosnahan, P. J. Southern, C. S. Reilly, M. L. Peterson, N. Schultz-Darken, K. G. Brunner, K. R. Nephew, S. Pambuccian, J. D. Lifson, J. V. Carlis, and A. T. Haase. 2009. Glycerol monolaurate prevents mucosal SIV transmission. Nature 458:1034-1038.
20. Boasso, A., J. P. Herbeuval, A. W. Hardy, S. A. Anderson, M. J. Dolan, D. Fuchs, and G. M. Shearer. 2007. HIV inhibits CD4+ T-cell proliferation by inducing indoleamine 2,3-dioxygenase in plasmacytoid dendritic cells. Blood 109:3351-3359.
21. Favre, D., J. Mold, P. W. Hunt, B. Kanwar, P. Loke, L. Seu, J. D. Barbour, M. M. Lowe, A. Jayawardene, F. Aweeka, Y. Huang, D. C. Douek, J. M. Brenchley, J. N. Martin, F. M. Hecht, S. G. Deeks, and J. M. McCune. Tryptophan catabolism by indoleamine 2,3-dioxygenase 1 alters the balance of TH17 to regulatory T cells in HIV disease. Sci Transl Med 2:32ra36.
22. Bosinger, S. E., Q. Li, S. N. Gordon, N. R. Klatt, L. Duan, L. Xu, N. Francella, A. Sidahmed, A. J. Smith, E. M. Cramer, M. Zeng, D. Masopust, J. V. Carlis, L. Ran, T. H. Vanderford, M. Paiardini, R. B. Isett, D. A. Baldwin, J. G. Else, S. I. Staprans, G. Silvestri, A. T. Haase, and D. J. Kelvin. 2009. Global genomic analysis reveals rapid control of a robust innate response in SIV-infected sooty mangabeys. J Clin Invest 119:3556-3572.
23. Jacquelin, B., V. Mayau, B. Targat, A. S. Liovat, D. Kunkel, G. Petitjean, M. A. Dillies, P. Roques, C. Butor, G. Silvestri, L. D. Giavedoni, P. Lebon, F. Barre-Sinoussi, A. Benecke, and M. C. Muller-Trutwin. 2009. Nonpathogenic SIV infection of African green monkeys induces a strong but rapidly controlled type I IFN response. J Clin Invest 119:3544-3555.
24. Ju, X. S., C. Hacker, B. Scherer, V. Redecke, T. Berger, G. Schuler, H. Wagner, G. B. Lipford, and M. Zenke. 2004. Immunoglobulin-like transcripts ILT2, ILT3 and ILT7 are expressed by human dendritic cells and down-regulated following activation. Gene 331:159-164.
25. Cao, W., D. B. Rosen, T. Ito, L. Bover, M. Bao, G. Watanabe, Z. Yao, L. Zhang, L. L. Lanier, and Y. J. Liu. 2006. Plasmacytoid dendritic cell-specific receptor ILT7-Fc epsilonRI gamma inhibits Toll-like receptor-induced interferon production. J Exp Med 203:1399-1405.
26. Cao, W., L. Bover, M. Cho, X. Wen, S. Hanabuchi, M. Bao, D. B. Rosen, Y. H. Wang, J. L. Shaw, Q. Du, C. Li, N. Arai, Z. Yao, L. L. Lanier, and Y. J. Liu. 2009. Regulation of TLR7/9 responses in plasmacytoid dendritic cells by BST2 and ILT7 receptor interaction. J Exp Med 206:1603-1614.
27. Cao, W., and L. Bover. 2010. Signaling and ligand interaction of ILT7: receptor-mediated regulatory mechanisms for plasmacytoid dendritic cells. Immunol Rev 234:163-176.
139
28. Neil, S. J., V. Sandrin, W. I. Sundquist, and P. D. Bieniasz. 2007. An interferon-alpha-induced tethering mechanism inhibits HIV-1 and Ebola virus particle release but is counteracted by the HIV-1 Vpu protein. Cell Host Microbe 2:193-203.
29. Erikson, E., T. Adam, S. Schmidt, J. Lehmann-Koch, B. Over, C. Goffinet, C. Harter, I. Bekeredjian-Ding, S. Sertel, F. Lasitschka, and O. T. Keppler. 2011. In vivo expression profile of the antiviral restriction factor and tumor-targeting antigen CD317/BST-2/HM1.24/tetherin in humans. Proc Natl Acad Sci U S A 108:13688-13693.
30. Nomaguchi, M., M. Fujita, and A. Adachi. 2008. Role of HIV-1 Vpu protein for virus spread and pathogenesis. Microbes Infect 10:960-967.
31. Neil, S. J., T. Zang, and P. D. Bieniasz. 2008. Tetherin inhibits retrovirus release and is antagonized by HIV-1 Vpu. Nature 451:425-430.
32. Loschko, J., A. Schlitzer, D. Dudziak, I. Drexler, N. Sandholzer, C. Bourquin, W. Reindl, and A. B. Krug. 2011. Antigen delivery to plasmacytoid dendritic cells via BST2 induces protective T cell-mediated immunity. J Immunol 186:6718-6725.
33. Rossio, J. L., M. T. Esser, K. Suryanarayana, D. K. Schneider, J. W. Bess, Jr., G. M. Vasquez, T. A. Wiltrout, E. Chertova, M. K. Grimes, Q. Sattentau, L. O. Arthur, L. E. Henderson, and J. D. Lifson. 1998. Inactivation of human immunodeficiency virus type 1 infectivity with preservation of conformational and functional integrity of virion surface proteins. J Virol 72:7992-8001.
34. Widner, B., E. R. Werner, H. Schennach, H. Wachter, and D. Fuchs. 1997. Simultaneous measurement of serum tryptophan and kynurenine by HPLC. Clin Chem 43:2424-2426.
35. Bego, M. G., J. Mercier, and E. A. Cohen. 2012. Virus-activated interferon regulatory factor 7 upregulates expression of the interferon-regulated BST2 gene independently of interferon signaling. J Virol 86:3513-3527.
36. Homann, S., D. Smith, S. Little, D. Richman, and J. Guatelli. 2011. Upregulation of BST-2/Tetherin by HIV infection in vivo. J Virol 85:10659-10668.
37. Duramad, O., K. L. Fearon, J. H. Chan, H. Kanzler, J. D. Marshall, R. L. Coffman, and F. J. Barrat. 2003. IL-10 regulates plasmacytoid dendritic cell response to CpG-containing immunostimulatory sequences. Blood 102:4487-4492.
38. Gary-Gouy, H., P. Lebon, and A. H. Dalloul. 2002. Type I interferon production by plasmacytoid dendritic cells and monocytes is triggered by viruses, but the level of production is controlled by distinct cytokines. J Interferon Cytokine Res 22:653-659.
39. Waibler, Z., M. Anzaghe, A. Konur, S. Akira, W. Muller, and U. Kalinke. 2008. Excessive CpG 1668 stimulation triggers IL-10 production by cDC that inhibits IFN-alpha responses by pDC. Eur J Immunol 38:3127-3137.
40. O'Doherty, U., M. Peng, S. Gezelter, W. J. Swiggard, M. Betjes, N. Bhardwaj, and R. M. Steinman. 1994. Human blood contains two subsets of dendritic cells, one immunologically mature and the other immature. Immunology 82:487-493.
41. Kohrgruber, N., N. Halanek, M. Groger, D. Winter, K. Rappersberger, M. Schmitt-Egenolf, G. Stingl, and D. Maurer. 1999. Survival, maturation, and function of CD11c- and CD11c+ peripheral blood dendritic cells are differentially regulated by cytokines. J Immunol 163:3250-3259.
140
42. Cella, M., D. Jarrossay, F. Facchetti, O. Alebardi, H. Nakajima, A. Lanzavecchia, and M. Colonna. 1999. Plasmacytoid monocytes migrate to inflamed lymph nodes and produce large amounts of type I interferon. Nat Med 5:919-923.
43. Benlahrech, A., A. Yasmin, S. J. Westrop, A. Coleman, A. Herasimtschuk, E. Page, P. Kelleher, F. Gotch, N. Imami, and S. Patterson. 2012. Dysregulated immunophenotypic attributes of plasmacytoid but not myeloid dendritic cells in HIV-1 infected individuals in the absence of highly active anti-retroviral therapy. Clin Exp Immunol 170:212-221.
44. Sabado, R. L., M. O'Brien, A. Subedi, L. Qin, N. Hu, E. Taylor, O. Dibben, A. Stacey, J. Fellay, K. V. Shianna, F. Siegal, M. Shodell, K. Shah, M. Larsson, J. Lifson, A. Nadas, M. Marmor, R. Hutt, D. Margolis, D. Garmon, M. Markowitz, F. Valentine, P. Borrow, and N. Bhardwaj. 2010. Evidence of dysregulation of dendritic cells in primary HIV infection. Blood 116:3839-3852.
45. Herbeuval, J. P., J. Nilsson, A. Boasso, A. W. Hardy, M. Vaccari, V. Cecchinato, V. Valeri, G. Franchini, J. Andersson, and G. M. Shearer. 2009. HAART reduces death ligand but not death receptors in lymphoid tissue of HIV-infected patients and simian immunodeficiency virus-infected macaques. Aids 23:35-40.
46. Herbeuval, J. P., J. Nilsson, A. Boasso, A. W. Hardy, M. J. Kruhlak, S. A. Anderson, M. J. Dolan, M. Dy, J. Andersson, and G. M. Shearer. 2006. Differential expression of IFN-alpha and TRAIL/DR5 in lymphoid tissue of progressor versus nonprogressor HIV-1-infected patients. Proc Natl Acad Sci U S A 103:7000-7005.
47. Nascimbeni, M., L. Perie, L. Chorro, S. Diocou, L. Kreitmann, S. Louis, L. Garderet, B. Fabiani, A. Berger, J. Schmitz, J. P. Marie, T. J. Molina, J. Pacanowski, J. P. Viard, E. Oksenhendler, S. Beq, O. Abehsira-Amar, R. Cheynier, and A. Hosmalin. 2009. Plasmacytoid dendritic cells accumulate in spleens from chronically HIV-infected patients but barely participate in interferon-alpha expression. Blood 113:6112-6119.
141
FIGURE LEGENDS
Figure 1. ILT7 expression is limited to pDCs and is downregulated following in vitro
culture. A) Flow cytometry dot-plots showing the gating strategy used to identify pDC
(CD14- BDCA2+ CD123+), monocytes (CD14+), mDC (CD19- CD14- CD3- BDCA1/BDCA3+), B
cells (CD14- CD3- CD19+) and T cells (CD14- CD19- CD3+). B) Flow cytometry histograms
showing ILT7 expression on different cell populations gated as in panel A; thin lines
indicated fluorescence minus one (FMO) controls and thick lines indicate ILT7 staining; for
both panels A and B one example of experiments performed on N=6 independent donors
is shown. C) Frequency of ILT7+ pDCs in function of time; each dot represents median of
N=5 donors for a specific time point; lines indicate linear regressions of medians and IQRs;
** P<0.01 compared to 0 hours (Friedman’s test with Dunn’s correction for multiple
pairwise comparisons). D) Change in the frequency of ILT7+ pDCs (circles) and CD83+ pDCs
(triangles) overtime in presence or absence of the TLR9L CpG ODN or HIV; medians and
IQRs are shown (N=3); P values in legend indicate Friedman’s test results for changes
overtime in each condition.
Figure 2. ILT7 downregulation is associated with pDC precursors differentiation. A) Flow
cytometry contour plots showing ILT7 expression in comparison to side scatter properties
(SSC; upper panels) and CD83 expression (lower panels) of pDCs in freshly isolated PBMCs
(black contours in all plots) and in PBMCs cultured overnight (SSC: red contours; CD83:
blue contours) in presence or absence of TLR9L, TLR7L or HIV; one example of
experiments performed on N=6 independent donors is shown. B) Summary graphs
showing (from top to bottom) frequency of ILT7+ pDCs, fold change in side scatter (SSC),
frequency of CCR7+ pDCs and frequency of CD83+ pDCs in freshly isolated PBMCs and
PBMCs cultured in control media alone or in presence of TLR9L, TLR7L or HIV; SSC were
normalized against measurements on fresh cells; medians and IQRs are shown (N=6); *
P<0.05 and ** P<0.01 (Friedman’s test with Dunn’s correction for multiple pairwise
comparisons); § P<0.05 compared to ntreated control at the same time point (Wilcoxon
sign rank test).
Figure 3. TLR7/9L- and HIV-mediated induction of BST2 in PBMCs and ILT7/BST2 pDC-
regulatory activity. A) Frequencies of BST2+ cells among different subsets of freshly
isolated PBMCs, gated as in Figure 1A; medians and IQRs from at least N=5 independent
donors are shown. B) Frequencies of BST2+ cells among different subsets of PBMCs
cultured overnight in presence or absence of TLR9L (CpG ODN), TLR7L (R848) or HIV;
medians and IQRs of experiments from at least N=5 independent donors are shown. C)
BST2-PE MFI in monocytes from PBMCs cultured overnight in presence or absence of
TLR9L, TLR7L or HIV; medians and IQRs of experiments from N=5 independent donors are
shown. D) IFN- was measured by ELISA in culture supernatants from PBMCs cultured
overnight in presence or absence of TLR9L, TLR7L or HIV and pre-treated or not with the
142
cross-linking ILT7-specific Ab 17G10.2 or the BST2-specific blocking Ab 26F8; medians and
IQRs of experiments from N=11 independent donors are shown. E) Fold change in TLR9L-
induced IFN- in PBMC cultures after pre-treatment with 17G10.2 or 26F8 over time (6, 9,
18 or 48 hours); all values were normalized against TLR9L-stimulated cells, indicated by
the grey dashed line; medians and IQRs of experiments from N=3 independent donors are
shown; P values indicate Friedman’s test results for changes overtime in each condition. F)
Kyn:Trp was measured by HPLC in supernatants from PBMCs cultured overnight in
presence or absence of TLR9L, TLR7L or HIV and pre-treated or not with the cross-linking
ILT7-specific Ab 17G10.2 or the BST2-specific blocking Ab 26F8; medians and IQRs of
experiments from N=11 independent donors are shown. G) HEK 293T cells were stained
with PE-labelled 26F8 anti-BST2 antibody; leftmost panel shows forward and side scatter
properties of 293T cells; all other panels show staining of untreated and rIFN--treated
mock-transfect 293T, as well as 293T cells transfected with wild-type or mutated BST2;
details of mutations are given in the text; numbers in the plots indicate % BST2+ cells
(upper figure) and BST2-PE MFI (lower figure). In panels B, C, D and F, * P<0.05, ** P<0.01,
*** P<0.001.
Figure 4. Effect of TCR engagement on BST2 expression in T cells and effect on TLR9L-
induced IFN- production. A) Frequencies of BST2+ CD4 and CD8 T cells among PBMCs
cultured overnight in presence or absence of different combinations of TLR9L, stimulating
CD3-specific Ab (HIT3a) and stimulating CD28-specific Ab (CD28.2); medians and IQRs of
experiments from N=6 independent donors are shown. B) Frequencies of BST2+ CD4 and
CD8 T cells among PBMCs cultured overnight in presence or absence of TLR9L and/or
stimulating CD3-specific Ab (HIT3a) and pre-treated or not with blocking antibodies
against the subunit 2 of the IFN- receptor (IFNAR2) and/or against the subunit 1 of the
IFN- receptor (IFNGR1); each symbol represents results from one independent donor
(N=3) for both CD4 and CD8 T cells (empty and solid symbols, respectively). C) IFN- was
measured by ELISA in supernatants from PBMCs cultured overnight in presence or
absence of different combinations of TLR9L, HIT3a and CD28.2, pre-treated or not with the
BST2-specific blocking Ab 26F8; medians and IQRs of experiments from N=6 independent
donors are shown. In both panels, * P<0.05, ** P<0.01 compared to control.
Figure 5. Effect of cytokines on BST2 expression, regulation and effect on TLR9L-induced
IFN- production. A) Frequency of BST2+ pDC among PBMCs cultured overnight in
presence or absence of TLR9L and pre-treated or not (2 hours before TLR9L stimulation)
with IFN-, IL-4, IL-10 or TNF-; medians and IQRs of experiments from N=6 independent
donors are shown; * P<0.05. B) Change in TLR9L-stimulated BST2-PE MFI induced by pre-
treatment with IFN-, IL-4, IL-10 or TNF- in different subsets of PBMCs; all results were
normalized against TLR9L-treated PBMCs with no cytokines, indicated by grey dashed line;
medians and IQRs of experiments from N=6 independent donors are shown; * P<0.05
143
compared to TLR9L-treated PBMCs with no cytokines. C) IFN- was measured by ELISA in
supernatants from PBMCs cultured overnight in presence or absence of TLR9L and pre-
treated or not (2 hours before TLR9L stimulation) with IFN-, IL-4, IL-10 or TNF-; cells
were pre-incubated (30 min before TLR9L stimulation) or not with the BST2-specific
blocking Ab 26F8 or isotype control antibody; medians and IQRs of experiments from N=6
independent donors are shown; dark grey dashed line and light grey shaded area indicate
median and IQR of TLR9L-stimulated PBMCs without cytoikine pre-treatment (first data
set on the left); * P<0.05 compared to unstimulated control (no TLR9L) for each cytokine
pre-treatment; § P<0.05 compared to TLR9L-stimulated with no cytokine pretreatment.
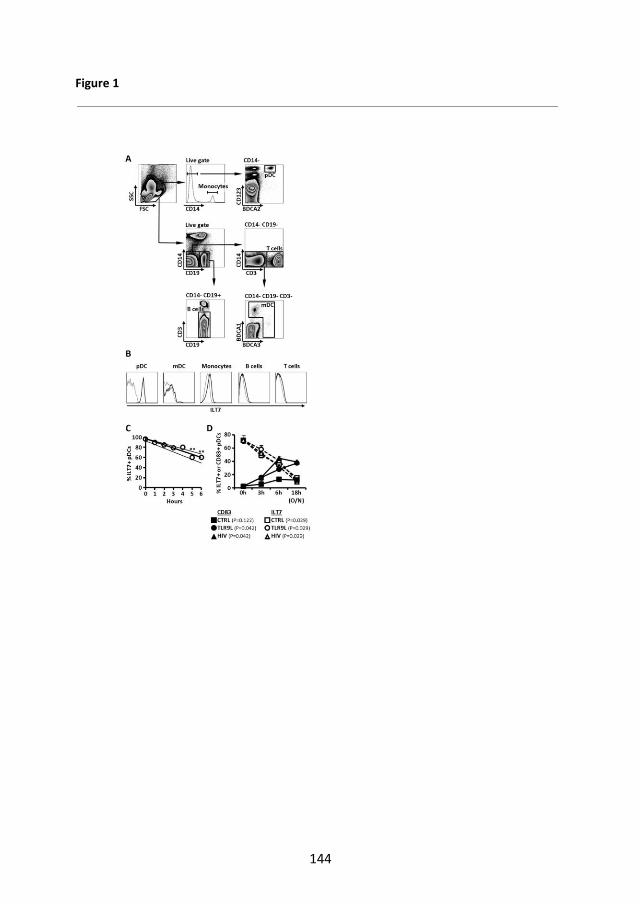
144
Figure 1
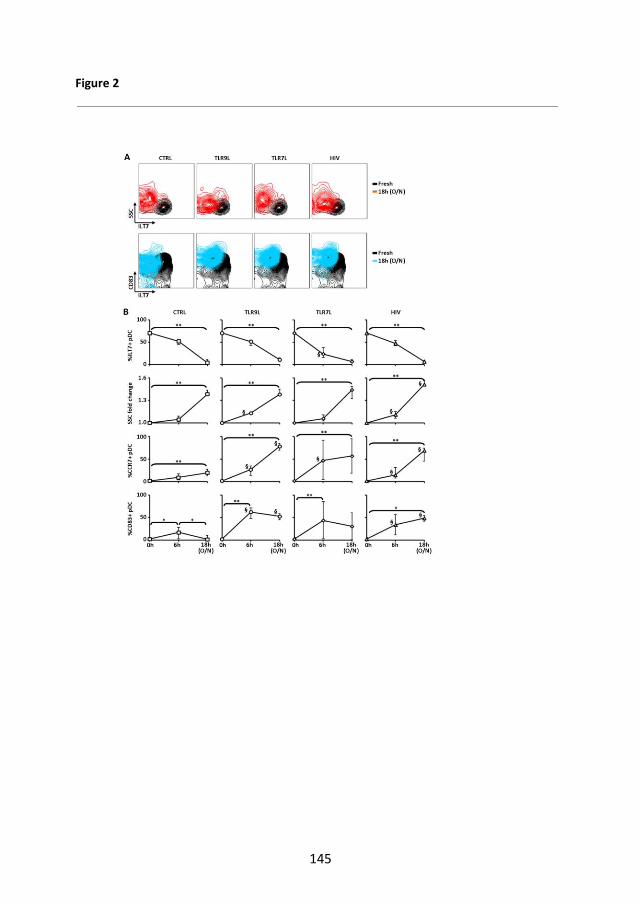
145
Figure 2
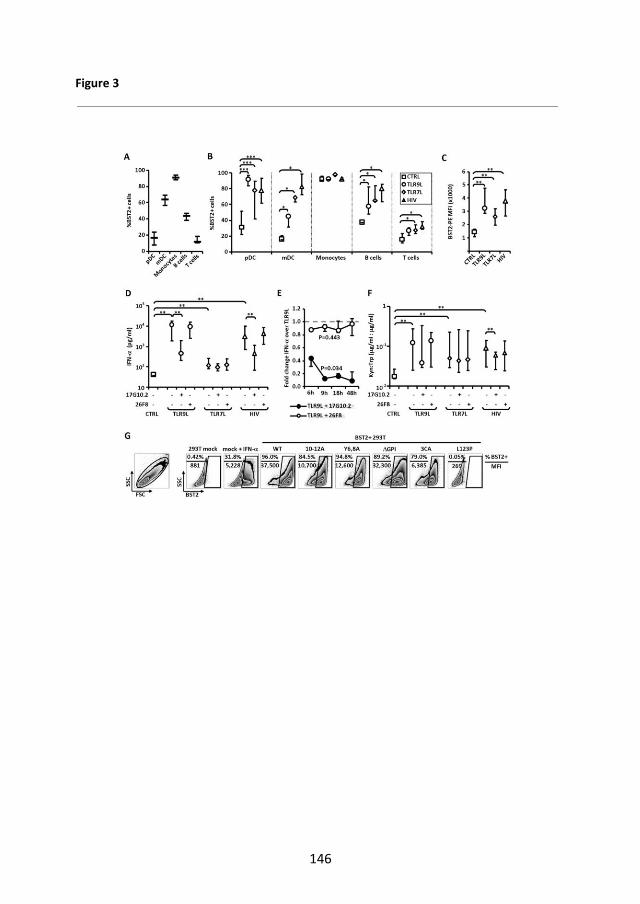
146
Figure 3
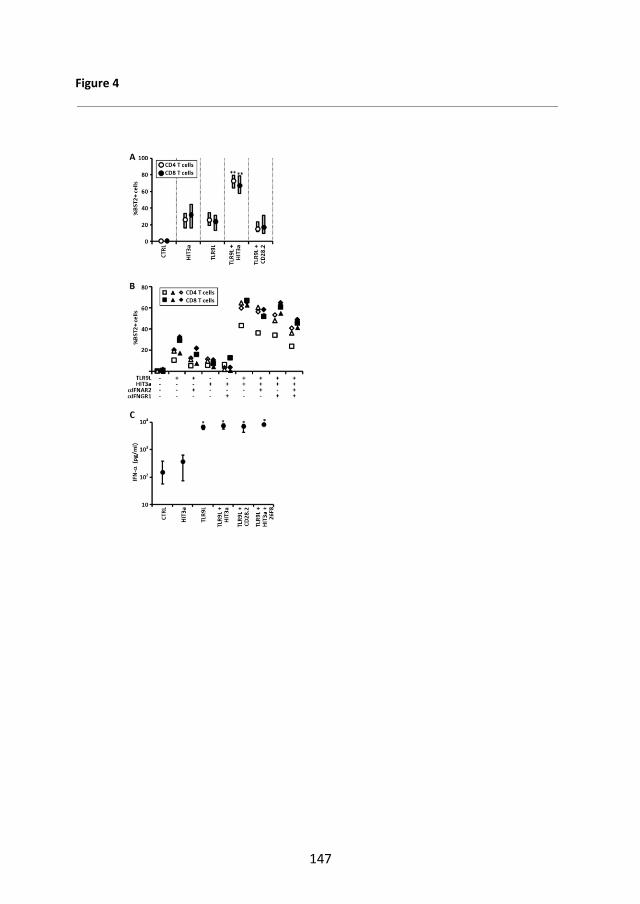
147
Figure 4
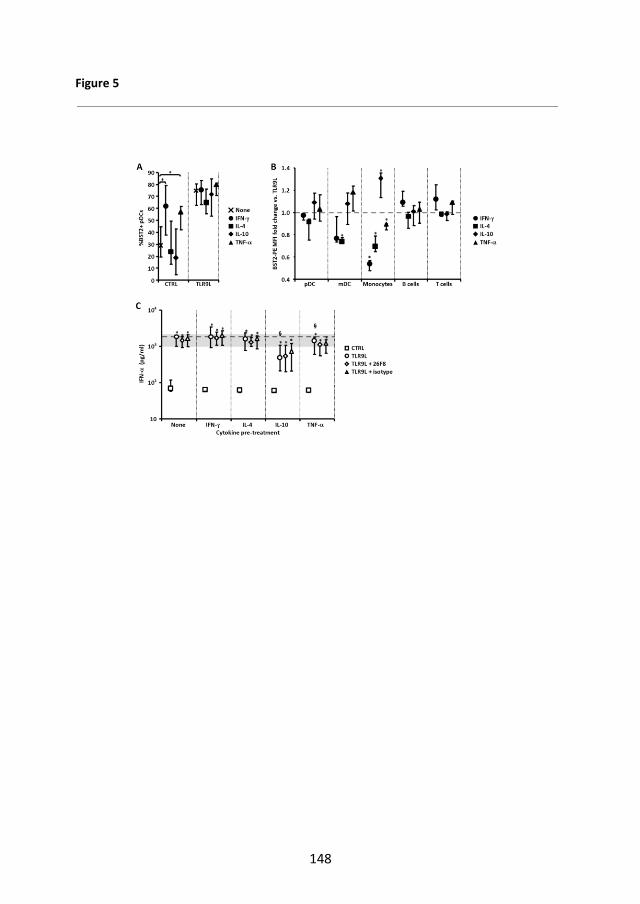
148
Figure 5
149
Supplemental Figure Legends
Supplemental Figure 1. Details of pDC gating strategy and ILT7 staining overtime. A)
Flow cytometry pseudocolour dot plots showing one example of BDCA2 and CD123
staining on CD14- cells (pDC gating strategy) among freshly isolated PBLs and PBLs
cultured overnight (O/N) with or without TLR9L, TLR7L or HIV;rRed squares indicate pDC
gating; numbers within plots indicate the frequency of pDCs within the total live PBLs
(defined by SSC/FSC gating as in Fig. 1A). B) Flow cytometry histograms showing ILT7
staining on pDCs (CD14-BDCA2+CD123+) in freshly isolated PBLs and PBLs cultured in
media alone for 3h, 6h or 18h; one example of N=3 independent experiments is shown. C)
Change in the MFI of ILT7 staining overtime in presence or absence of the TLR9L CpG ODN
or HIV; medians and IQRs are shown (N=3); P values in legend indicate Friedman’s test
results for changes overtime in each condition. D) Flow cytometry contour plots showing
ILT7 expression in comparison to CD40 (upper panels), CD80 (middle panels) and CD86
(lower panels) of pDCs in freshly isolated PBMCs (black contours in all plots) and in PBMCs
cultured overnight (CD40: green contours; CD80: orange contours; CD86: purple contours)
in presence or absence of TLR9L; one example of experiments performed on N=3
independent donors is shown. E) Summary graphs showing (from top to bottom)
expression of ILT7, CD40, CD80 and CD86 on pDCs, expressed both as frequency of
positive pDCs (left panels) and MFI (right panels) in freshly isolated PBMCs (empty
symbols) and PBMCs cultured in presence or absence of TLR9L (blue and grey symbols,
respectively) from N=3 donors tested; each symbol represents one individual donor.
Supplemental Figure 2. BST2 expression and regulation in PBLs. A) Flow cytometry
histograms showing BST2 expression on different cell populations among freshly isolated
PBLs, gated as in Figure 1A; black lines indicated fluorescence minus one (FMO) controls
and orange lines indicate BST2 staining; one example of experiments performed on at
least N=5 independent donors is shown. B) Flow cytometry histograms showing BST2
expression on different cell types among PBLs cultured overnight in control media (black)
or stimulated with TLR9L (blue), TLR7L (green) or HIV (red); grey lines indicate
fluorescence minus one (FMO) controls; one example of experiments performed on at
least N=5 independent donors is shown.
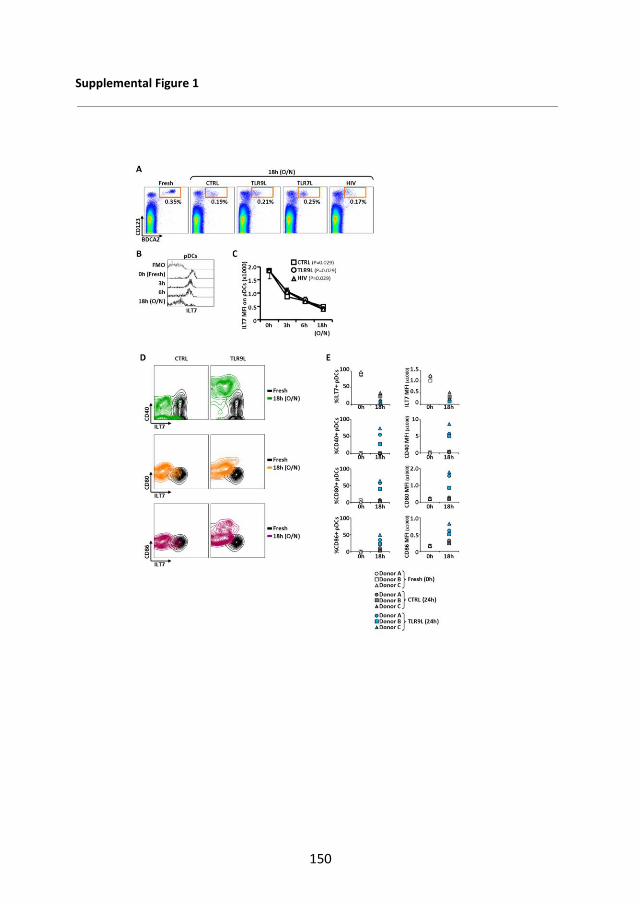
150
Supplemental Figure 1
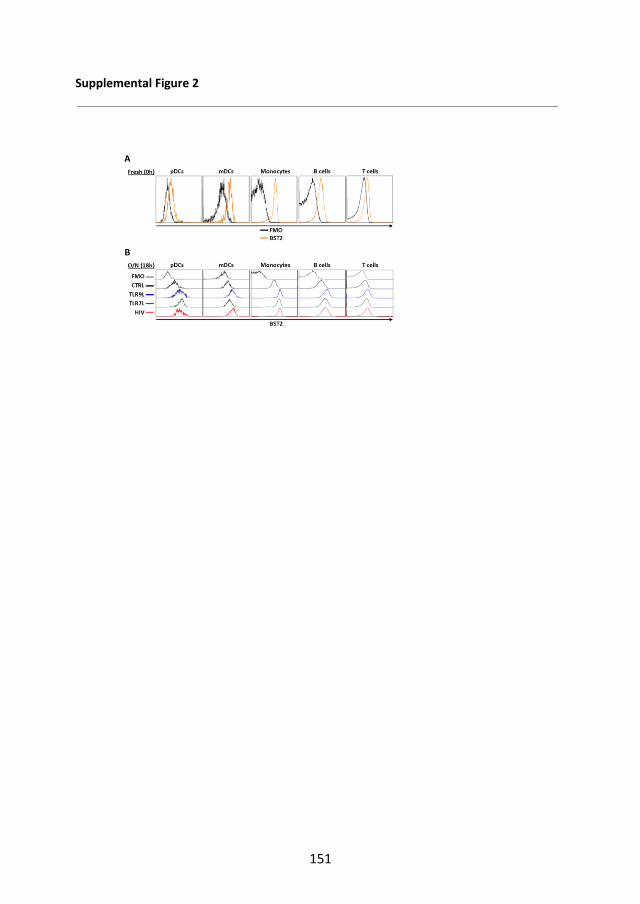
151
Supplemental Figure 2
152
APPENDIX 3
Abstract no A-427-0002-00412 BSI 2011, Liverpool , UK
Immunoglobulin like transcript 7 (ILT7)-mediated regulation of HIV-induced plasmacytoid dendritic cell (pDC) activation.
Barbara Tavano*1,2
, D Graham3, and A Boasso
2
1Univ of Milan, Italy;
2Imperial Coll London, UK; and
3Johns Hopkins Univ Sch of
Med, Baltimore, MD, US Immunoglobulin like transcript (ILT) 7 is a surface molecule selectively expressed by human pDC. ILT7 cross-linking suppresses plasmacytoid dendritic cells (pDC) activation and type I interferon (IFN-I) secretion following Toll-like receptors (TLR) 7/9 engagement. The bone marrow stromal cell antigen 2 (BST2, tetherin) is expressed by different cell types upon exposure to IFN-I and has been recently identified as a natural ligand for ILT7. We investigated BST2/ILT7 expression in peripheral blood leukocytes (PBL) following HIV- or TLR7/9 ligand (TLR7/9L)-mediated pDC activation, and tested whether HIV-induced pDC activation is modulated by ILT7 cross-linking. Our data confirmed that ILT7 expression is specific to pDC, however the frequency of ILT7-positive pDC halved within 6 hours of in vitro culture, a kinetic which was only modestly modified by HIV or TLR7/9L. BST2 expression was not affected by in vitro culture and was highest in monocytes, myeloid DC and B cells compared to pDC and T cells. BST2 upregulation in response to HIV-1 and TLR7/9L was observed only in pDC and monocyte and peaked in pDC at intermediate stimuli concentration, being only modestly increased at maximum stimuli concentration. This upregulation profile correlated with that of CD83 on pDC and IFN-alpha secretion. Finally, ILT7 cross-linking using a specific Ab inhibited IFN-alpha production in HIV and TLR7/9L-exposed PBL. Our data suggests that pDC over-stimulation results in hyporesponsiveness or altered kinetics of pDC responses, and points at the BST2/ILT7 system as a regulator of pDC activation in response to HIV.
153
APPENDIX 4
Abstract no 326. CROI 2012, Seatle USA. Immunoglobulin like transcript 7 (ILT7)-mediated regulation of HIV-induced plasmacytoid dendritic cell (pDC) activation. Barbara Tavano*
1,2, D Graham
3, and A Boasso
2
1Univ of Milan, Italy;
2Imperial Coll London, UK; and
3Johns Hopkins Univ Sch of
Med, Baltimore, MD, US Background: The immunoglobulin-like transcript (ILT) 7 is a surface molecule
selectively expressed by human plasmacytoid dendritic cells (pDC). ILT7 cross-
linking suppresses pDC activation and type I interferon (IFN-I) secretion following
Toll-like receptors (TLR) 7/9 engagement. The bone marrow stromal cell antigen 2
(BST2, tetherin) is expressed by different cell types upon exposure to IFN-I and is
a natural ligand for ILT7. We investigated BST2/ILT7 expression and regulation by
HIV or TLR7/9 ligands (TLR7/9L) in peripheral blood leukocytes (PBL). We then
tested whether ILT7/BST2 modulates HIV-induced pDC activation.
Methods: PBL from healthy donors were cultured with different concentrations of
imiquimod, CpG ODN or AT-2 HIV-1MN. The effect of BST2 blockade and ILT7
cross-linking were tested using anti-BST2 monoclonal antibodies (mAb; clones:
26F8, RS38E) or cross linking-ILT7 mAb (clone 17G10.2). Expression of ILT7,
BST2 and CD83 was analyzed in different cell types by flow cytometry. IFN-α
production was quantified by ELISA. Statistical analysis was performed using non-
parametric Wilcoxon sign rank test.
Results: Our data confirmed that ILT7 expression is specific to pDC. However the
frequency of ILT7-positive pDC halved within 6 hours of in vitro culture. BST2
expression was not affected by in vitro culture and was highest in monocytes, mDC
and B cells compared to pDC and T cells. A significant upregulation of BST2 was
observed in all cell types after culture with HIV or TLR7/9L. BST2 and CD83
expression peaked in pDC at intermediate stimuli concentration but were only
modestly increased at maximum stimuli concentration, which correlated with IFN-α
production. ILT7 cross-linking inhibited IFN-α production in HIV- and TLR7/9L-
exposed PBL while BST2 blockade showed different results depending on the mAb
used. Clone RS38E significantly reduced IFN-α secretion whilst no changes were
observed when clone 26F8 was used. Thus, the two clones may have different
binding sites and clone RS38E may induce clustering of BST2 resulting in cross-
linking of its receptor ILT7.
Conclusions: Our data indicate that BST2-mediated ILT7 cross-linking negatively
regulates pDC activation, possibly resulting in hyporesponsiveness and/or
extensive alterations of the kinetic of pDC responses. This negative feed-back
mechanism may be exploited to prevent HIV-induced immune-hyperactivation.
![) ] È(Ô ¶ ] e È È æ W>& q ±0d >'...1 Â e G b W c ) ] È(Ô ] b È ) Ø%± 6ë _ X 8 Z È75 2 b0d _ | ~ æ I S K q ±0d b7F7µ _ | e È È æ È K S _ I È Ý /²&g K S W8 [](https://img.pdfslide.us/doc/110x75/603a5d761436be63e21b1769/-e-w-q-0d-1-e-g-b-w-c-.jpg)