Embed Size (px)
Citation preview

Paul O’Callaghan
Dynamics of Water Innovation
Paul O’Callaghan
Dynamics of Water InnovationInsights into the rate of adoption, diffusion and
success of innovative water technologies globally

Cover image: Stepwell, Gujarati vav, Hindi baoli or baori, subterranean edifice and water source, an architectural form that was long popular throughout India but particularly in arid regions of the Indian subcontinent. For centuries, stepwells—which incorporated a cylinder well that extended down to the water table—provided water for drinking, washing, bathing, and the irrigation of crops. They also served as cool sanctuaries for caravans, pilgrims, and other travellers during the heat of day or overnight. Commissioned by royal, wealthy, or powerful patrons, they were complex engineering feats and stunning examples of both Hindu and Islamic architecture.

Dynamics of Water InnovationInsights into the rate of adoption, diffusion and success of emerging water technologies globally
Paul O’Callaghan
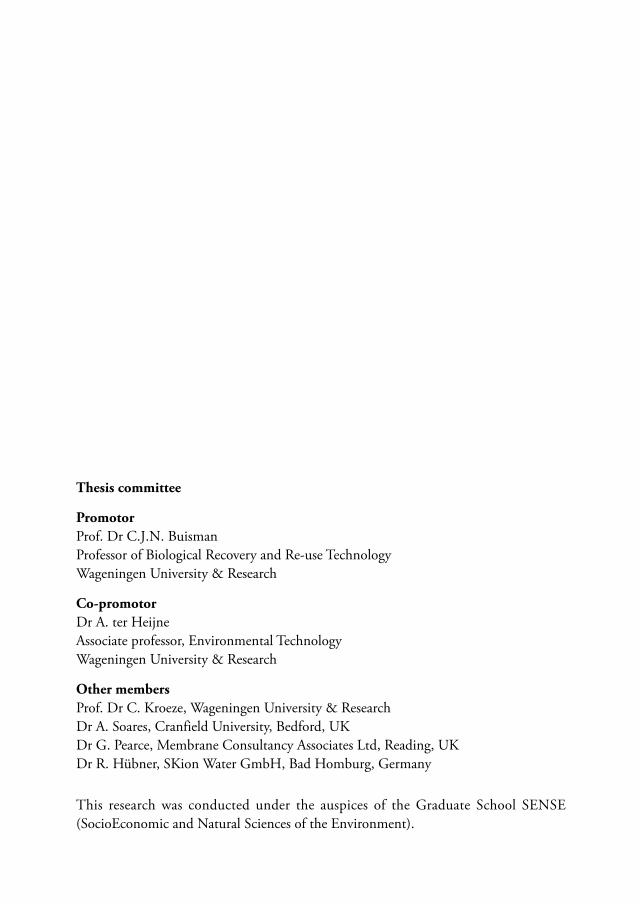
Thesis committee
PromotorProf. Dr C.J.N. Buisman Professor of Biological Recovery and Re-use TechnologyWageningen University & Research
Co-promotorDr A. ter Heijne Associate professor, Environmental TechnologyWageningen University & Research
Other membersProf. Dr C. Kroeze, Wageningen University & ResearchDr A. Soares, Cranfield University, Bedford, UKDr G. Pearce, Membrane Consultancy Associates Ltd, Reading, UKDr R. Hübner, SKion Water GmbH, Bad Homburg, Germany
This research was conducted under the auspices of the Graduate School SENSE (SocioEconomic and Natural Sciences of the Environment).

Dynamics of Water InnovationInsights into the rate of adoption, diffusion and success of emerging water technologies globally
Paul O’Callaghan
Thesissubmitted in fulfilment of the requirements for the degree of doctor
at Wageningen Universityby the authority of the Rector Magnificus,
Prof. Dr A.P.J. Mol,in the presence of the
Thesis Committee appointed by the Academic Boardto be defended in public
on Wednesday 9 December 2020at 4:00 p.m.

Paul O’Callaghan Dynamics of Water Innovation: Insights into the rate of adoption, diffusion and success of emerging water technologies globally162 pages
PhD thesis, Wageningen University, Wageningen, NL (2020) With references, with summary in English

Chapter 1 General Introduction 91. The water challenge 102. The field of water technology 113. Problem statement of this thesis 174. State of the art 195. Objectives for the thesis 206. Thesis outline summary 23
Chapter 2 Development and Application of a Model to Study Water Technology Adoption
27
1. Introduction 281.1. Applied research and development: an important
source for water technology innovation29
1.2. Existing water technology adoption models 292. Methodology 32
2.1. Development of definitions and criteria 322.2. Research interviews to test the validity of the criteria
and definitions33
2.3. Testing of the criteria to assign technologies to different stages of the water technology adoption model
33
2.4. Analysis of average time spent at each stage of the model
35
3. Results and discussion 363.1. Results of testing criteria on a sample data set of
water technologies at different stages of the Water Technology Adoption (WaTA) model
42
3.2. Average water technology adoption timelines 434. Conclusion 445. Future work 45
Chapter 3 Analysis of Factors Affecting Rates of Technology Adoption 471. Introduction 482. Methodology 493. Results & discussion 534. Conclusion 65
Contents

Chapter 4 The Applicability of Innovation Theories to the Water Sector
69
1. Introduction 701.1. Why do we need innovation? 701.2. The rate of innovation adoption in water is slow 721.3. There is a lack of clear terminology, which hampers
research into the innovation process75
2. Critical review of two different innovation theories 772.1. A review of Disruptive Innovation Theory 772.2. A review of Innovation Diffusion Theory 79
3. Assessment of the applicability of innovation diffusion theory as a framework to study water technology innovation
81
4. Discussion 835. Conclusion 86
Chapter 5 Assessing Real World Impact of Innovative Water Technologies
89
1. Introduction 902. Framework development 93
2.1. Metrics evaluated for inclusion in the framework 942.2. Metrics selected for inclusion in the framework 96
3. Method 984. Results 995. Discussion 1046. Conclusion 109
Chapter 6 General Discussion 1111. Contributions/key ideas 1122. Limitations of this work 1203. Suggestions for future research work 120
References 123Appendix 139Summary 145Dedication 152Acknowledgements 153About the Author 158List of Publications 160


1

Chapter 1General Introduction

Chapter 1
10
1. The water challenge
Human society needs access to safe water and sanitation in order to flourish. Access to water and sanitation is a basic human right and water is essential for healthy ecosystems, agriculture and industry. The importance of access to water and sanitation is embodied in the United Nations Sustainable Development Goal No. 6: “Ensure availability and sustainable management of water and sanitation for all” (United Nations, 2020).
Increasingly the world faces growing water challenges (Addams et al., 2009; Kwok et al., 2009; Alves et al., 2014; Elsevier, 2011). These challenges relate to both water supply and water quality, and are due to mounting pressures including population growth, urbanisation, increased industrial demand, climate change and water scarcity. Our current water system is inefficient, wasteful and capital intensive. Due to the mounting pressures listed above, we can no longer afford an inefficient and wasteful system (Naik and Stenstrom, 2014; Daigger, 2009; Kwok et al., 2010; Daigger et al., 2019).
The field of water technology innovation can help to address some of these water challenges. There is however a limited amount of human and financial capital available to develop technological solutions to address water challenges. By 2050, more than half of the global population (57%) will live in areas that suffer water scarcity at least one month each year (United Nations, 2018).
Water scarcity is driving change and innovation in the water sector. This will require new thinking and new approaches. There are many opportunities for both system-level changes, as well as incremental improvements within the existing paradigm. A better understanding of the water innovation process will contribute towards more effective and efficient use of capital in research and development (R&D) and a higher rate of successful innovation diffusion. The rate of innovation and technology uptake in the water sector is often reported as being relatively slow due to the conservative nature of the industry. Each year millions of dollars are invested globally in water technology research and development and much of this research does not go on to be developed into products and technologies that are actually deployed. In a BlueTech Research survey conducted with 60 research institutes in 10 countries investigating all licensing opportunities from 2013-2019, only 9% of the 300 technologies identified were successfully licensed, while the majority of technologies were either found to be still available or discontinued (BlueTech Research, 2019). There are hundreds of water technology start-ups at any given point in time working to develop new technologies, however, only a handful of these companies will succeed. Larger water technology companies have internal research departments and, here too, much of this research does not make its way into the market.
At the same time, there are mounting pressures on water resources and on our current water system. There are also opportunities to leverage new technologies, and new

General Introduction
11
Chap
ter
1approaches, to solve water issues and provide more efficient use of limited freshwater resources. Policy makers are increasingly realising the importance of innovations in the water sector and thus numerous research agendas and international forums, such as the Horizon2020 programme, the Strategic Research and Innovation Agenda of the Strategic Forum for International Science and Technology Cooperation of the European Commission and Member States, the European Innovation Platform on Water (EIP Water), the Joint Programming Initiative of EU Member states on Water (JPI Water), Water Europe (Previously the Water Supply and Sanitation Technology Platform (WssTP), are including this topic as an issue to be tackled urgently giving utmost priority (Schmidt et al., 2018; Nagel et al., 2018; Bikfalvi et al., 2018; Ajami et al., 2014).
2. Thefieldof watertechnology
For the purposes of this thesis, the field of study covers the use of technologies that enable use of water in municipal and industrial settings. This includes the collection, treatment and use of drinking water and the collection, treatment and discharge of used water. This also relates to the use of water in industrial manufacturing and production, and in commercial buildings for cooling and heating.
The case studies studied in this thesis relate specifically to treatment technologies that alter the quality of the water or by-products produced from treating water or wastewater. This involves altering the purity of the water and removing or destroying, organic and inorganic chemical contaminants as well as biological agents, such as bacteria, viruses and protozoa. It also involves treatment of sludges produced during the treatment process including biogas.
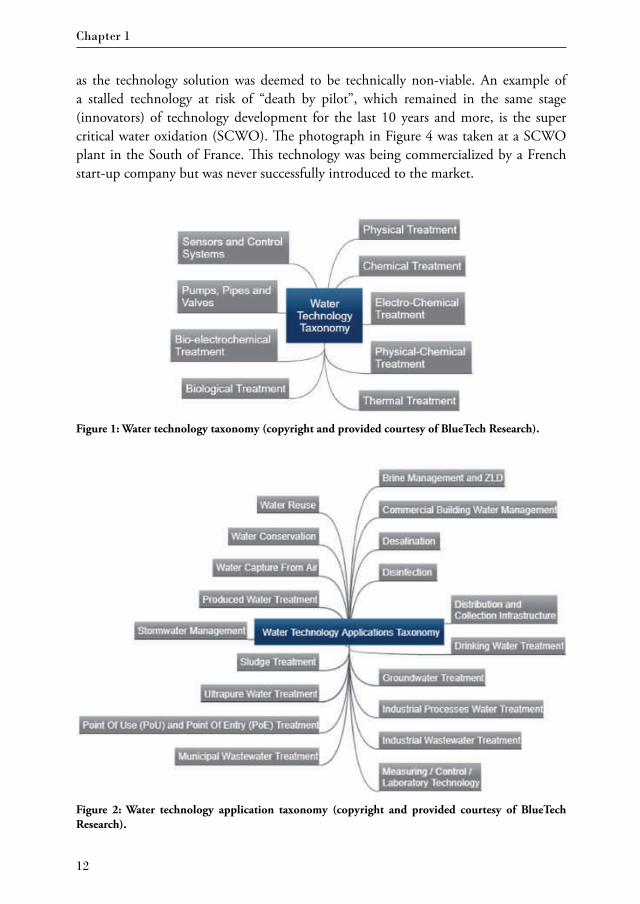
For the purposes of analysis, the author has developed the Water Technology Taxonomy of various water technologies. Some of the key elements of this taxonomy are shown below in Figure 1 and Table 1, which will help to illustrate the diverse nature of the scientific disciplines that relate to managing water in urban and industrial settings.
In addition to requiring the use of a very wide range of treatment technologies, there are also a wide range of individual applications for drinking water, process water, and wastewater treatment, as illustrated in Figure 2 as the Water Technology Application Taxonomy developed by and reproduced here with the permission of BlueTech Research.
A water technology that has been successfully commercialized is the ultraviolet (UV) light water disinfection. An example of this technology at a water treatment plant in Ireland is illustrated in Figure 3. However QUAY technologies, that patented for microwave-powered UV systems for water disinfection, promised to offer significantly improved reliability and bulb life resulting in lower overall operating costs when compared with traditional technologies, however it never made its way through commercialization
Chapter 1
12
Figure 1: Water technology taxonomy (copyright and provided courtesy of BlueTech Research).
Figure 2: Water technology application taxonomy (copyright and provided courtesy of BlueTech Research).
as the technology solution was deemed to be technically non-viable. An example of a stalled technology at risk of “death by pilot”, which remained in the same stage (innovators) of technology development for the last 10 years and more, is the super critical water oxidation (SCWO). The photograph in Figure 4 was taken at a SCWO plant in the South of France. This technology was being commercialized by a French start-up company but was never successfully introduced to the market.

General Introduction
13
Chap
ter
1
Ultrafiltration membranes, as shown in Figure 5, are used as part of a Membrane Bioreactor (MBR) treatment plant. For example, an industrial wastewater treatment plant in the Guangzhou Province in China is known to be using UF hollow-fiber membranes. This is an example of a technology that has been successfully commercialized and is widely adopted in China to meet strict effluent limit guidelines that are imposed on industrial wastewater discharges, which are some of the most stringent in the world.
Table 1: Technology class and sub-class of water technology taxonomy (copyright and provided courtesy of BlueTech Research)
Technology class Technology sub-class
Biological treatment Aerobic AnaerobicBiological Nutrient Removal Bio-catalysts
Physical treatment Membrane filtration (MF, UF, NF, RO, FO)Non-membrane filtrationCavitation Vortex separation Mechanical Vapor Compression
Chemical treatment Photochemical treatment Advanced oxidation Coagulation DewateringDisinfection & biocidesAdsorbent AbsorbentIon exchangeAnti-scalants
Electro-chemical treatment Electro-deionizationCapacitive deionization Electro-dialysisElectrocoagulationElectrochemical oxidation
Physical-chemical treatment Dissolved air flotation Micro and nanobubblesSupercritical water oxidation Wet air oxidation
Thermal treatment GasificationPyrolysisHydro-thermal carbonization Multiple effect distillation and multi-stage flashThermal hydrolysis
Sensors and control systems Artificial intelligence and decision support toolsSmart meteringOn-line sensorsData management systems

Chapter 1
14
Figure 3: Ultraviolet light water disinfection system at a water treatment plant in Ireland.
Figure 4: Supercritical water oxidation plant in France.

General Introduction
15
Chap
ter
1
Another example of successful water technology innovation is the Reverse Osmosis membrane. Figure 6 shows racks of Reverse Osmosis membrane modules at the Orange County water reclamation plant. This plant currently holds the Guinness Book of World Records for the “most wastewater recycled in 24 hours” (www.guinnessworldrecords.com). This plant successfully deploys a range of treatment technologies, including Membrane Ultrafiltration, Reverse Osmosis, Advanced Oxidation and Ultraviolet light disinfection, to enable in-direct potable water re-use. An example of a resource recovery technology is THIOPAQ (Figure 7) used for the removal of sulphur from biogas through biological oxidation of hydrogen sulphide gas to elemental sulphur. This technology enables the extraction of biosulfur from natural gas, landfill gas or biogas. The bio-sulphur is suited for use as fertilizer or fungicide as it is more bioavailable to crops than chemically produced sulphur. The company Paques offers the technology to treat biogas from anaerobic digestion, while a licensee, the company Paquell, offers the technology in oil and gas applications.
Figure 5: Filament UF membrane in water filter isolated on white background.

Chapter 1
16
Figure 6: Reverse Osmosis membrane modules at Orange County, California (courtesy of Brave Blue World foundation).
Figure 7: THIOPAQ installation in the Netherlands (courtesy of Paques).

General Introduction
17
Chap
ter
13. Problemstatementof thisthesis
The problem that is to be addressed in this thesis is that the process of water technology development and technology diffusion is not well understood. There are no models that can be used to analyse success and failure nodes. The factors affecting success or failure of any water technology, and the timelines for the technology to move through different stages of technology diffusion are not well analysed and studied. There is currently relatively little data and theory available (Krozer et al., 2010; Montalvo, 2008; Montalvo and Kemp, 2008). It is widely recognised that given the large amount of applied research in water, there is a relatively low percentage success rate in terms of successful deployment.
There are many elements required to solve global challenge including finance, technology, regulation and policy. Bringing these different aspects together requires that people from different disciplines work together with a shared understanding of the problems, the motivation to want to solve them and a clear pathway to implementing solutions. The galvanizing force is the ability of a community to work together. Without this galvanizing force, nothing happens.
The purpose of this thesis is to give the scientific community and the community of global water professionals and policy makers, a framework for shared discussion. Similar to the way in which evolution of language allows us to share ideas, our ability to see the world through models that we can describe, provides a common ground that allows us to work together to solve problems. The hope is that the ideas contained in this thesis will provide the starting point for a body of work that will continue to be studied academically. Many of the issues addressed in this thesis have previously only been discussed anecdotally. There are certain shared assumptions, beliefs, and often these can become self-reinforcing and limiting if they are incorrect or are not challenged.
The bottlenecks and failure rates act as a disincentive to those wishing to develop new technologies. Investors are wary to invest and end-users are slow to adopt and researchers may find it difficult to build sustainable research programs around water technology research and development if there is a low rate of success of technology transfer and successful technology diffusion.
Understanding how long it takes for new water technologies to diffuse into the market, the different drivers that can affect the rates of adoption, the diverse types of innovation that exist and how to measure and quantify market impact, are areas that are covered in the subsequent chapters of this thesis.
Understanding the inter-relation of all of these issues will help the community of stakeholders involved in water innovation to understand how capital may be put to work more efficiently to ensure that applied research leads to an advancement and successful deployment.

Chapter 1
18
Investor–challengesCapital is not used efficiently when it is invested into water technology companies that do not provide a return on this investment for the investor. This can occur when the true funding requirements are not understood, or the likely level of impact and the time required to achieve this impact are not clear. A water technology can run out of time, money, or both. This leads to a write-down on the investment and discourages other investors to invest in water.
Investor–benefitof thethesisUse of the ideas and concepts outlined in this thesis may help to inform investment strategy of venture capital and strategic investors to classify different types of innovation they are being presented with, set realistic expectations of timelines for a return on investment and gain insights into which types of innovation are likely to have the greatest level of market impact.
End-user–challengesFrom the perspective of an end-user, municipal and industrial, having a bad experience with adopting a new technology that does not work, does not solve a need, or deliver value, can discourage these end-users from trying out new solutions in the future. End-users need to understand if they think they are innovators, early adopters, or part of the early and late majority. They then need to understand what stage the technologies are at. A water utility that identifies itself as being part of the early majority is not suited to engaging in pilot testing and being the first adopter of an unproven technology.
End-user–benefitsof thethesisIt may help end-users such as water utilities and industrials to appreciate the innovation life cycle and understand their role as early adopters of new technologies and to identify what exactly their innovation drivers are, and how new technologies map to their needs. The role of a water utility or industrial end-user is not to adopt new water technologies. It is to understand their innovation needs and then adopt appropriate solutions that map to those needs. The role of the inventor, entrepreneur and investor, is to develop a deep understanding and appreciation of those needs and research, develop and introduce solutions that are then successfully adopted.
Appliedresearch–challengesApplied research and development resources are not used efficiently when they are focused on solving a problem that does not need to be solved or does not have enough value as a pain point for the end-user.

General Introduction
19
Chap
ter
1
Appliedresearch–benefitsof thethesisA better understanding of the process and dynamics of water technology innovation will contribute to more efficient R&D that will lead to a higher degree of success in the diffusion of innovation in the water technology sector. Having clearer insights into how to successfully valorise research and development to achieve tangible results to solve water issues will create value for society.
There are also cases where all of the stakeholders need to be able to see the bigger picture and often hyper-focused on using the solutions they have at hand, in accordance with what is commonly referred to as the Law of the Instrument or the Law of the Hammer, which describes a cognitive bias that involves an over-reliance on a familiar tool. It was described by Maslow that in a situation where “if you only have a hammer, everything starts to look like a nail” (https://medium.com/thethursdaythought/when-all-you-have-is-a-hammer-everything-looks-like-a-nail-the-einstellung-effect-on-67ee8449f740).
4. Stateof theart
Studies on innovation theory have been carried out in the Information Technology (IT) industry sector and much of the current thinking and innovation theory, arises from work done by others, such as Clayton Christensen and Geoffrey Moore in this area (Moore, 1991; Christensen, 1997). The models developed in the IT industry look at the technology deployment process in terms of market segmentation, and define the following categories: Innovators, Early Adopters, Early Majority, Late Majority and Laggards (Wenger et al., 2009).
There is the well-recognised ‘Valley of Death’, as defined in technology development theory in the IT sector, where many technologies fail as they try to move from Applied Research to Innovators, and subsequently from Early Adopters to Early Majority, sections of the market (Moore, 1991; Christensen, 1997). The ‘Valley of Death’ is also referred to as ‘The Chasm’ and the challenges in overcoming this are well documented in the seminal work ‘Crossing the Chasm’ by Moore (Moore 1991). The chasm in Rogers Adoption curve is illustrated in Figure 8. The adoption curve is also overlain with the Gartner Hype Cycle, which also describes the process of technology development and diffusion, including the peak of inflated expectations, trough of disillusionment and the slope of enlightenment. The Chasm, (or Valley of Death), coincides with the Trough of Disillusionment (Gartner, 2018). The Trough of Disillusionment is defined as the period when “Interest wanes as experiments and implementations fail to deliver. Producers of the technology shake out or fail. Investment continues only if the surviving providers improve their products to the satisfaction of early adopters” (www.gartner.com/en/research/methodologies/gartner-hype-cycle). The chasm in the adoption curve is a point where new technologies often fail.

Chapter 1
20
Figure 8: Th e chasm (Moore, 1991; Khateeb, 2017).
Innovators Early Adopters Early Majority Late Majority Laggards
Peak of inflated expectations
Trough of disillusionment
Slope of enlightenment Plateau of
productivity
The Chasm
A technology S-curve can be overlain on this market segmentation to track technology development, deployment and maturity. Th ese theories also describe distinct types of innovation: sustaining innovation and disruptive innovation. Th ose within the industry develop sustaining innovation typically while new entrants typically bring about high level market impact innovation i.e. disruptive innovation. Other studies of innovation and the diff usion of innovations have focused on many industrial and manufacturing sectors to examine the multitude of factors that aff ect innovation (Montalvo, 2006; Etzkowitz, 2003), however few relate to water related research (Hegger et al., 2011; Krozer et al., 2010; Lobina, 2012; Mvurliwenande et al., 2013; Peuckert, 2012; Partzsch, 2009; Wehn and Montalvo, 2014).
5. Objectivesforthethesis
Th e objective of this research is to examine the area of water technology innovation, using empirical data, and to adapt and build models specifi cally for the water industry.
Th e water industry has diff erent drivers compared to the IT sector, however, the same theories relating to sustaining innovation and disruptive innovation and market segmentation can be used to develop models which can then be tested with empirical data. Th e benefi t of using such a model is that it allows data from disparate technologies to be used to gain an overall understanding at a macro level, of water technology

General Introduction
21
Chap
ter
1development and deployment. Where there are differences in the rate at which technologies have moved through the various sections of the technology development process, key differentiating factors can be identified. If these factors can be identified, through objective analysis, then this may inform future water technology development to help ensure greater innovation efficiency, higher success rates, shorter times to market and more efficient use of capital. The next generation of water technologies may represent systems level changes and will include both sustaining innovation and disruptive innovation. The models will help future researchers inform their work in this area.
The water sector is different to the IT sector, due to slow rates of adoptions, splintered scientific disciplines, and high capital intensity. There is relatively little academic work that relates specifically to the analysis of innovation in water technologies. A key foundational reference paper addressing this gap is Introduction of New Process Technology into the Wastewater Treatment Sector by Denny Parker (Parker, 2011).
The absence of available research literature on water technology innovation has been recognised by other academics in the field, including Uta Wehn and Carlos Montalvo. This led to a call for papers, for a special issue of the Journal of Cleaner Production (JCP) (Wehn & Montalvo, 2018). This subsequently led to the publication of the JCP Special Issue which included a range of paper on this topic. The papers were varied and highlighted a number of initiatives that were designed to foster water innovation including the European Innovation Partnership (EIP), VIA Water in the Netherlands, the European Water and Sanitation Technology Platform (WSSTP and Water Innovation Network (WIN) in Sweden.
The European Innovation Partnership (EIP) on water was first established in 2012 with the purpose of finding innovative solutions to water challenges which would prove to be beneficial for the jobs and economic growth in Europe. The major task of EIP is to ‘identify, test, scale up, disseminate and stimulate the uptake of innovative solutions by the market and society for 8 major water related challenges’, as specified in the 2020 headline target. Water issues in developing countries in Africa have been supported by the VIA Water – a Dutch research programme. It was aimed at facilitating innovative solutions for water problems in seven African countries: Benin, Ghana, Kenya, Mali, Mozambique, Rwanda and South Sudan. Innovative projects are supported by VIA Water funds. As per VIA Water, in Africa, there are twelve ‘pressing needs’ for water (Figure 9). Dutch Ministry of Foreign Affairs helped his programme financially with $ 14 million dollars for the period of 2014-2018. With the utilisation of a virtual network-centered incubator model that was designed and executed in Sweden, called the Water Innovation Accelerator, it was possible to advance water-related innovation. This can assist several researchers as well as policy makers in the field of water innovation (Gabrielsson et al., 2018).

Chapter 1
22
The aims of this research were:
1. To create a technology diffusion model applicable for the water sector, including defined stages in the technology research, development, and deployment process with clear definitions that can be applied to the water sector as well as defining key factors which can affect the model by accelerating, or decelerating successful technology development and deployment and to test the robustness of the model created by gathering empirical data on wide range of water technology types and applications.
2. To create a framework to measure disruptivity or in other words, market impact of innovation technologies in the water sector. There are different approaches to developing and implementing water technology innovation. Case studies to be applied to the framework to measure the level of market impact for each technology.
3. To identify the factors that play a key role in creating market for new technologies such as legislation.
4. To define terminology and characteristics to be used to classify different innovation types in the water sector.
Figure 9: The twelve ‘pressing needs’ of water in African cities as listed by VIA Water (Nagel et al., 2018).
City
Demand Availability
Risk Management
Enabling Environment
Pressing needs of VIA Water
1. Sustainable access to drinking water services
2. Sustainable access to sanitation services and clean cities
3. Equitable and efficient water use in urban and peri-urban agriculture
4. More and reliable water harvesting and storage
5. Sustainable use of groundwater resources
6. Improved quality of water resources and distributed water
7. High quality data gathering, management and sharing
8. Institutional strengthening9. Sustainable and equitable
water allocation10.Viable financial arrangements
and partnerships11. Improved urban planning
12. Prevention and management of floods, droughts and coastal erosion

General Introduction
23
Chap
ter
16. Thesisoutlinesummary
Chapter 2 focuses on development of a set of criteria that can be used to study industry adoption and dissemination of water technologies through various stages of a market adoption model. It tests the applicability of these criteria on a diverse array of over 488 water technologies. Based on case studies, it seeks to define the typical and reasonable time frames in which a water technology moves through these defined stages of industry adoption and dissemination. The development of these criteria, and the definition of reasonable industry average timelines to move through these stages, is an important contribution to the understanding of the process of water technology development. The criteria and defined timelines described in this chapter are foundational, and are used as the basis for subsequent research and analysis to examine the success rates for different water technologies, and common factors linked to why some technologies succeed and others fail.
Chapter 3 analyses six case studies of new water technology innovations in the last 30 years and investigates the differences in timelines for moving through the various stages of water technology commercialisation. The concept of two different types of innovation were explored: Crisis / Needs Driven and Value Driven. It was found that the case studies that mapped to the crisis / needs driven innovation moved relatively quickly compared to value-driven innovations and in most cases involved new entrants. New entrants refer to new companies or start-ups that have recently entered the water technology market. The case studies, which could be mapped to value driven innovation had a slower rate of technology diffusion and they involved a combination of existing companies as well as new entrants.
Chapter 4 critically reviews two theories of innovation: Disruptive Innovation Theory, and Innovation Diffusion Theory (IDT). While important, Disruptive Innovation Theory is found to have limited applicability to water – for example, there are limited opportunities for lower-end innovation which competes on price in a regulated market like water, and there is also limited opportunity to be market-creating. Although the question arises: is there a market-creating equivalent of the Ford production line that would unlock solutions to water problems in developing countries? Innovation Diffusion Theory is found to be more applicable to water, with some important caveats. In conclusion, this chapter proposes a practical framework, with industry examples, for studying water technology innovation. Such a framework could provide a common shared basis to support further research into this topic, including the question: can the disruptive potential of an innovation be predicted?
Chapter 5 proposes a novel framework to measure market impact and technology diffusion, based on three criteria: number of reference plants, number of countries in which the technology is adopted in, and the annual market value represented by the

Chapter 1
24
technology. A total of 11 technologies have been investigated and divided into three levels of market impact: Level 1 being the highest level of market impact (i.e. Unicorn Technologies), Level 2 being the medium level, (i.e. Lion Technologies) and Level 3 being the lowest (i.e. Horse Technologies). Timelines have been investigated to understand the speed of these technologies moving through the different levels of market impact, to provide investors and water technology experts a tool to quantify market impact in the water sector.
Finally, Chapter 6 summarizes some of the main contributions and conclusions of this thesis. It also includes a reflection on the limitations of this work, recommendations for how others can use this thesis and suggestions for further research work.

General Introduction
25
Chap
ter
1

2

Chapter 2Development and Application
of a Model to Study Water Technology Adoption

Chapter 2
28
1. Introduction
A substantial amount of research addresses numerous water-related challenges, including water scarcity (Addams et al., 2009; Kwok et al., 2009), emerging contaminants (Holtz, 2006), climate change (McCarthy, 2008), ageing infrastructure, urbanization, population growth, and resource recovery (Kalogo and Monteith, 2008). These pressures will become more acute and urgent in the decades ahead (Alves et al., 2014; Elsevier, 2011), driving real change in water management strategies, which creates opportunities for technology development and innovation. Key areas, which are seeing increased activity in terms of water technology innovation, include water reuse, energy and resource recovery, and low-energy desalination (Daigger, 2009; Naik and Stenstrom, 2014; O’Callaghan, 2008).
‘Diffusion of Innovations’ is a multidisciplinary theory of how, and at what rate, new technology spreads, and why this happens in a specific manner (Rogers, 2003). As the word ‘diffusion’ is ambiguous within the water sector, the phrase ‘dissemination and adoption’ will be used. Dissemination and adoption of new technology across industries frequently takes many years before the technology is widely used. Several researchers have attempted to explain the reasons for this in a mix of reviews, case studies, modelling, and policy papers (Krozer et al., 2010; Montalvo, 2008; Montalvo and Kemp, 2008). Kemp and Volpi (2008) concluded that the adoption of any type of innovation is influenced by both technology and market factors. Factors that play a role include government policy, specific characteristics of any new technology, receptiveness of potential adopters, and economic factors such as the age structure of capital (for the latter, see for example Hritonenko and Yatsenko, 2008). The adoption of technologies can also fail in the so-called ‘valley of death’ in which they stall while moving through the different defined segments of the market (Moore, 1991).
The author wishes to analyze the key factors that are linked to successful water technology development. This chapter focused on studying water technology innovation by defining key stages in water technology adoption and dissemination, the typical timelines associated with each stage, and defining the factors that can be used to assign a water technology to a particular stage. The stages in the model itself will not be new; they will build on previous models. What will be unique is the analysis of the typical time it takes for a water technology to move through the stages of this model, and to develop criteria that can be used to objectively assign a water technology to each stage of the model. The development of this framework is foundational for future work, which will analyze success factors to help ensure efficient use of capital to develop water technologies.

Development and Application of a Model to Study Water Technology Adoption
29
Chap
ter
2
1.1. Applied research and development: an important source for water technology innovation
Many of the water technologies in use today have their origins in applied research at research institutes. Some examples of this are illustrated in Table 1. However, many of the technologies developed in research institutes, are not successfully commercialized and adopted. In a BlueTech Research survey conducted with 60 research institutes in 10 countries investigating all licensing opportunities from 2013-2019, only 9% of the 300 technologies identified were successfully licensed, while the majority of technologies were either found to be still available or discontinued (BlueTech Research, 2019).
Table 1: Examples of commercialized technologies developed at research institutes
Technology area Source for applied research Resultant commercial process
Forward osmosis McCutcheon et al. (2005), Yale University Oasys (Membrane Brine Concentrator)
Struvite crystallization Adnan et al. (2003), University of British Columbia
Ostara (Pearl Process)
Reverse osmosis membranes
Jeong et al. (2007), University of California, Los Angeles
NanoH2O Membranes
Chemical oxidation Monzyk et al. (2013), Battelle Memorial Institute
Ferrate
Nutrient removal De Kreuk et al. (2005) and Van der Star et al. (2007), Delft University of Technology; Blonigen et al. (2005)
Annamox, Sharon, Nereda
1.2. Existing water technology adoption modelsWe have reviewed a range of theories and models, including the Technology Adoption Life Cycle (TALC) and the Technology Life Cycle (TLC) models. The TALC model is based on an earlier model known as the Diffusion Process, which was originally devised to study the rate of hybrid corn adoption by farmers in two Iowa farming units (Beal and Bohlen, 1957). This model describes how a new product or innovation moves through different segments of the defined adopter groups: Innovators, Early Adopters, Early Majority (about 34% of the population), Late Majority (last major group to adopt, also about 34% of the population), and Laggards. This classification into adopter groups is well suited for consumer products used by the general population. Wenger and coworkers (2009) have shown how the Diffusion Process model can be adapted to specific technology domains, such as education and digital technology. Moore (1991) revised the TALC model to look at gaps present between the adopter groups in high-tech markets.
The Technology Life Cycle (TLC) typically follows an S-curve shape as technology moves from research and development through the ‘ascent phase’ to maturity and finally

Chapter 2
30
declines (Christensen, 1992). The TLC is a measure of technology maturity, and is distinct from the Technology Adoption Life Cycle (TALC). The TLC’s S-curve can be overlaid with the TALC model to analyze the adoption of innovations and maturity of adopted technologies. This can be seen in Figure 1, which shows the conceptualization of technology adoption by Rogers (2003). These two curves focus not on the state (maturity) of the technology but, rather, on the characteristics of the people adopting the technology (Parker, 2011). Rogers found that the adopter groups identified in TALC statistically fitted a bell-shaped curve representing a normal distribution.
Cum
ulat
ive
num
ber o
f ins
talla
tions
or
cum
ulat
ive
inst
alle
d ca
paci
ty
Innovators 2.5%
Early Adopters
13.5%
Early Majority
34%
Late Majority
34%
Laggards 16%
Time
Technology lifecycle s-curve
Roger’s bell curve for technology adoption
Figure 1: Figure overlaying the Roger’s bell curve for technology adoption with classical technology lifecycle s-curve indicating technology maturity across classes of adopters (Parker, 2011; Rogers, 2003).
Technology Readiness Levels (TRLs) are a measure of technology development in research and development institutes (Mankins, 1995), of which business sectors and governmental organizations use different variations. So far, the commercial aspects of TRLs have not been defined, because initially TRLs were mainly applied to technologies in specific systems developed for the research institutes’ own use only (e.g., NASA’s space missions). For example, there are no clear definitions of technologies in their initial stages of development in the TRLs applied by the E.U. in its Horizon 2020 Framework Programme for Research and Innovation (European Commission, 2013; Schild, 2013):

Development and Application of a Model to Study Water Technology Adoption
31
Chap
ter
2
• TRL 1 - basic principles observed• TRL 2 - technology concept formulated• TRL 3 - experimental proof of concept• TRL 4 - technological validity in a laboratory• TRL 5 - technology validated in a real environment• TRL 6 - technology demonstrated in relevant environment• TRL 7 - system prototype demonstration in an operational environment• TRL 8 - system completed and qualified• TRL 9 - actual system proven in operational environment
The TRLs define technology development stages in a granular manner, and a correlation with either Rogers’ bell curve (TALC) or the S-curve (TLC) is difficult. Vyakarnam (2013) attempted such a correlation and suggested that the translational journey from laboratory to market should make use of TRLs in early technology stages, and use Rogers’ TALC model in later stages of technology development (i.e., once the technology is ready for market introduction). In the literature, only Parker (2011) has applied the S-curve to five case histories to examine the pace of dissemination and adoption, as well as the stages of technology development, and by which events they were shaped and influenced.
This chapter defines a Water Technology Adoption (WaTA) model, which covers the entire technology life cycle from development through to maturity, and can serve as a practical framework for water industry professionals and water technology researchers. This model is based on interviews with water industry leaders, a review of existing technology and dissemination and adoption models, innovation theory, an analysis of empirical water technology data, and insights gained by the author and his coworkers through their collective experience in the global water industry.
The first objective of the research was to define key stages in a water technology’s dissemination and adoption. The second aim was to provide a well-defined set of criteria that could be used to classify water technologies according to relevant stages. This could then, for example, be used in subsequent research to determine if there are particular technology areas that move faster than others, to identify accelerators and decelerators, and identify any common factors that might affect success and failure rates in technology dissemination and adoption.
This chapter is structured as follows. After this introduction, the Methodology describes the process in defining six different stages of water technology adoption and dissemination. The Results and Discussion section explains how the author tested the model and validated the six stages by applying them to a data set of 488 water treatment technologies. Finally concluding remarks and suggestions for further work are outlined in the last section.

Chapter 2
32
2. Methodology
In this section the development of criteria for assigning water technologies to particular stages of the WaTA model is explored.
2.1.Developmentof definitionsandcriteriaTh e author adapted existing models to create one that was suitable for the analysis of water technologies from Applied Research through to Maturity. Activities such as Pilot and Demonstration were mapped to the Innovators Stage, and the stages of Early Majority and Late Majority were grouped together into one stage (Figure 2), for reasons outlined later in this section. To develop the defi nitions for each stage, the author began studying a discrete number of case studies for water technologies which were previously introduced to market, including membrane bioreactors, ultraviolet disinfection, moving bed bioreactor (MBBR), and ultrafi ltration membranes; and developing criteria that the author believed could have been used to defi ne when these technologies were at a particular stage in the WaTA Model.
Applied Research
Maturetechnology
Pilot
Cum
ulat
ive
num
ber o
f ins
talla
tions
or
cum
ulat
ive
inst
alle
d ca
paci
ty
Innovators Early Adopters
Early Majority
Late Majority
Laggards Time
Technology lifecycle s-curve
Roger’s bell curve for technology adoption
Demonstration
Proven technology
Figure 2: Illustration of stages of the water technology diff usion (WaTa) model and how these relate to diff erent stages of the water technology development process, such as Pilot stage and Demonstration stage. Applied Research is shown as preceding the technology adoption stages.

Development and Application of a Model to Study Water Technology Adoption
33
Chap
ter
2
In particular, the author sought to define the following for each stage of the model:
• Criteria for assigning a technology to this stage• Activities undertaken in this stage• Objectives/outcomes sought at this stage• Duration of this stage• Corresponding stage in other models
2.2.Researchinterviewstotestthevalidityof thecriteriaanddefinitionsThe objective of the research interviews was to assess whether the criteria used to assign a water treatment technology to a particular stage of the model were robust, and would be understood and usable in a consistent and objective way by water industry stakeholders. There were 13 interviewees selected to provide representative coverage across key stakeholder groups, including consulting engineers, water treatment technology providers, academics, water utility end users, and water technology investors; and on the basis of their extensive expertise in developing new water treatment technologies and implementing innovation. The lead author conducted these research interviews between September and December 2015.
The interviewees were contacted by e-mail, in advance, and given standard background information on the purpose of the research interview. During the interview, the interviewees were guided through the different stages of the WaTA model. The definitions for each stage were outlined, criteria for classification were shared, and feedback was solicited on each stage. For each of the criteria, the author asked the interviewees if the criteria were clear, if they agreed or disagreed with these definitions, if they believed the criteria needed to be modified, and if additional criteria should be used.
The collective responses were analyzed, tabulated, and cross-compared for each stage of the WaTA model. This led to refinements to the definitions, based on the feedback of the interviewees, and to additional criteria. The research interviews provided confidence that the criteria outlined in this chapter can be applied by anyone in the water industry, based on accepted terminology and definitions. In addition, this also enables a consistent approach to mapping technologies to different stages of an adapted S-curve (TLC) and Rogers’ TALC model, if desired.
2.3. Testing of the criteria to assign technologies to different stages of the water technology adoption model
The author then attempted to apply the criteria that were developed, and further refined through research interviews, to a data set of over 488 different water technologies. The objective was to determine if the criteria would be robust and useful when applied to a diverse set of water technologies. The data set used in this study pertains to

Chapter 2
34
488 proprietary technologies contained in the BlueTech Research database of water technologies. The author was granted access to the database to support this research. The technologies represent a broad section of technologies that are used in municipal, and industrial, water and wastewater resource recovery. This was supplemented with a data set of 28 mature water treatment technologies.
Figure 3 depicts the distribution of the sample data set across the five different water technology classes and illustrates the spread and representation across these different technology classes. For the purposes of this study, the author excluded sensors, control systems, and data analytics because their characteristics are significantly different to water and wastewater treatment technologies. The following are five different classes of water technologies that are represented in the data set.
1. Biological Treatment 2. Chemical Treatment3. Physical Treatment4. Physical-Chemical Treatment5. Electro-Chemical Treatment
Figure 3: Illustration of the distribution of the test data set across different water technology classes.
Biological Treatment, 22%
Chemical Treatment, 22%
Physical Treatment, 36%
Electro-Chemical Treatment, 13%
Physical-Chemical Treatment, 7%

Development and Application of a Model to Study Water Technology Adoption
35
Chap
ter
2
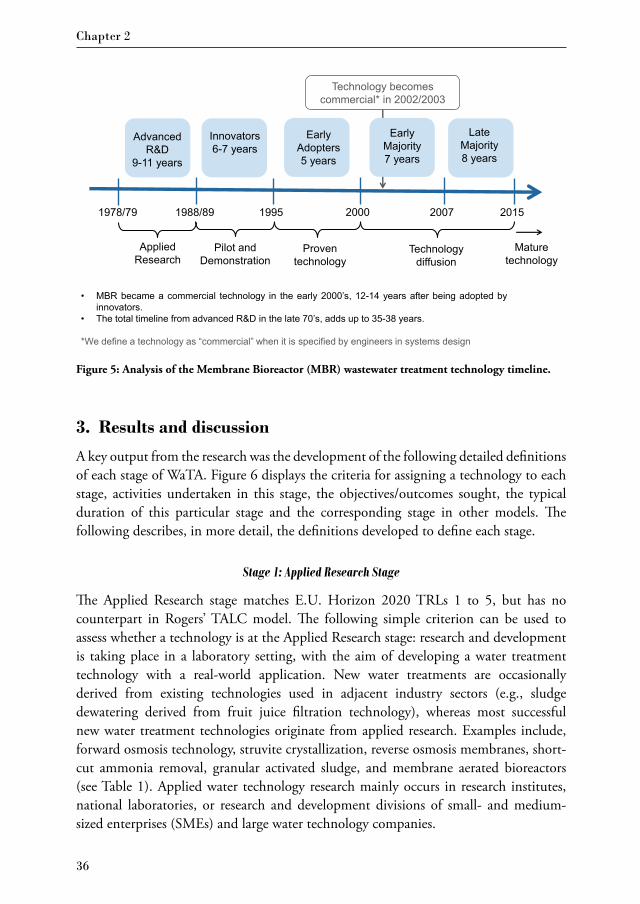
2.4. Analysis of average time spent at each stage of the modelThe author also wished to determine the average time spent by a technology at different stages of the WaTA model. To determine this, the author prepared and analyzed a number of case studies, including ultraviolet disinfection, membrane bioreactors, phosphorus removal as struvite, and sludge thermal hydrolysis. Figures 4 and 5 give the timelines for ultraviolet disinfection and membrane bioreactors, respectively. Based on the case studies analyzed, a set of average or typical timelines were developed, which are presented in the next section. Figure 4 illustrates the stages in the Ultraviolet (UV) disinfection case study, timelines, and key stages in the adoption and dissemination of this technology. Figure 5 illustrates the timelines that were required to commercialize and achieve technology adoption and dissemination of the Membrane Bioreactor (MBR) technology.
Figure 4: Analysis of the Ultraviolet (UV) water disinfection technology timeline.
First UV disinfection system installed. Although UV installations continued for the next 30 years,they were all replaced by chlorine systems at later dates. Poor technical quality and high costsof UV systems prevented the technology from achieving a competitive position in the market.
After being dormant for more than 2 decades, advanced R&D in UV technology for waterdisinfection led to commercially viable products appearing on the market in the early 1970’s.This came on the background of chlorine associated by-products found in drinking water.
1910 1960 1970
Innovators5 years
1975
Early Adopters5 years
1980 2000
Late Majority10-12 years
Technology becomes commercial* in 1982/1984
• UV disinfection became commercial in the early 1980’s, 12-14 years after being adopted by Innovators.• Although a long timeline, considering that the technology is more than 100 years old, the total “actual” timeline
starting with advanced R&D in the 60’s to early 70’s, adds up to 35-40 years.
*We define a technology as “commercial” when it is specified by engineers in systems design
Advanced R&D
10 years
1988/90
Early Majority
8-10 years
Applied Research
Pilot and Demonstration
Proven technology
Technology diffusion
Mature technology
Chapter 2
36
3. Results and discussion
A key output from the research was the development of the following detailed definitions of each stage of WaTA. Figure 6 displays the criteria for assigning a technology to each stage, activities undertaken in this stage, the objectives/outcomes sought, the typical duration of this particular stage and the corresponding stage in other models. The following describes, in more detail, the definitions developed to define each stage.
Stage 1: Applied Research Stage
The Applied Research stage matches E.U. Horizon 2020 TRLs 1 to 5, but has no counterpart in Rogers’ TALC model. The following simple criterion can be used to assess whether a technology is at the Applied Research stage: research and development is taking place in a laboratory setting, with the aim of developing a water treatment technology with a real-world application. New water treatments are occasionally derived from existing technologies used in adjacent industry sectors (e.g., sludge dewatering derived from fruit juice filtration technology), whereas most successful new water treatment technologies originate from applied research. Examples include, forward osmosis technology, struvite crystallization, reverse osmosis membranes, short-cut ammonia removal, granular activated sludge, and membrane aerated bioreactors (see Table 1). Applied water technology research mainly occurs in research institutes, national laboratories, or research and development divisions of small- and medium-sized enterprises (SMEs) and large water technology companies.
Figure 5: Analysis of the Membrane Bioreactor (MBR) wastewater treatment technology timeline.
Advanced R&D
9-11 years
1978/79 1988/89
Innovators6-7 years
1995
Early Adopters5 years
2000 2007
Late Majority8 years
Technology becomes commercial* in 2002/2003
• MBR became a commercial technology in the early 2000’s, 12-14 years after being adopted byinnovators.
• The total timeline from advanced R&D in the late 70’s, adds up to 35-38 years.
*We define a technology as “commercial” when it is specified by engineers in systems design
2015
Applied Research
Pilot and Demonstration
Proven technology
Technology diffusion
Mature technology
Early Majority7 years

Development and Application of a Model to Study Water Technology Adoption
37
Chap
ter
2
Figure 6: Criteria for defi ning stages of the WaTA Model.
•Criteria for assigning a technology to this stage•Activities undertaken in this stage•Objectives/ outcomes sought at this stage•Duration of this stage•Corresponding stage in other models
THE STAGES OF THE WaTA MODEL
•Critera: R&D in laboratory setting with aim of developing a water treatment technology with real-world applications•Activities: Bench-scale tests with synthetic streams to analyze fundamental mechanisms and gather data on fundamental performance criteria•Objective: Confirming the scientific basis (Proof of Concept)•Timeline: Typically, 6 to 8 years, but can be longer or shorter•Corresponding stage in other models: E.U. Horizon 2020 TRLs: 1 to 5
1. Applied Research stage
•Criteria: Technology tested in real-life applications; deployment of pilot-scale process at, for example, drinking water or wastewater treatment facility; no full-scale facility operational yet•Activities: Gathering operational data, which can be used as design criteria for scale-up•Objective: Addressing fundamental engineering issues •Timeline: Typically, 2 to 3 years•Corresponding stage in other models: E.U. Horizon 2020 TRLs: 6 to 9, TALC (bell curve): First part of Innovators
2. Pilot stage (Innovators)
•Criteria: Technology scaled up and part of formal product offering; 1 to 3 units operational at similar scale in similar applications•Activities: Construction and deployment of technology in full-scale systems in target applications; results presented in papers and at conferences•Objective: Testing commercial viability, proving value proposition•Timeline: Typically, 3 to 5 years•Corresponding stage in other models: TALC (bell curve): Second part of Innovators
3. Demonstration stage (Innovators)
•Criteria: Now a proven technology, but not widely accepted by end users yet; commercial sales of 1st-generation units taking place; at least 3 units operating at similar scale, in similar applications, at separate locations; still limited awareness and technical understanding among end users and water professionals•Activities: Larger water utilities starting to adopt; debuggging and improvements•Objective: Creation of client base and reference projects so that technology can become specified in tender documents and requests for proposals•Timelines: Typically, 6 to 8 years•Corresponding stage in other models: TALC (bell curve): Early Adopters
4. Early Adopters
•Criteria: Consulting engineers now specify the technology; technology appears in tender documents and RFPs; at least 3 companies actively offer versions of the technology; more than 30 full-scale units in operation•Activities: Time to double total number of installations shortest in this stage; technology continues to be improved; price tends to reduce•Objective: Efficiencies gained in engineering design and process optimization•Timelines: Typically, 12 to 16 years•Corresponding stage in other models: TALC (bell curve): Early and Late Majority
5. Early & Late Majority
•Criteria: Technology included in engineering manuals and textbooks, university courses and curriculums; know-how and expertise in the hands of most companies offering proprietary technologies; technology becoming a commodity technology with multiple suppliers offering competing products; engineering professionals designing generic nonproprietary versions•ActivitiesTechnology continues to be value-engineered, with small improvements in efficiency•Outcome: Technology becoming at risk of being displaced by newer technologies •Timelines: 15 to 20 years, or longer•Corresponding stage in other models: TALC (bell curve): Laggards
6. Maturity Stage

Chapter 2
38
Typically, tests are carried out with synthetic feed water streams designed to mimic real-world conditions. For example, sodium chloride solutions can be used to model salinities likely to be encountered in seawater, and brackish water, desalination applications. For biological removal of organic contaminants, sugars are frequently used to create wastewater streams with a synthetic biological oxygen demand. These bench-scale tests with synthetic streams allow researchers to analyze fundamental mechanisms, confirm the scientific basis for the technology (Proof of Concept), and gather data on fundamental performance criteria, such as the rate of removal of particular contaminants, kinetics, and removal efficiencies. However, limitations include the fact that in real-life conditions, a wider range of compounds and materials are present, and at fluctuating concentrations. This can interfere with the process through various mechanisms, including inhibition of biological processes, membrane fouling, chemical deposits, and corrosion. There can also be unintended effects during scale-up for example, as a result of changes in fluid dynamics, mixing, or heat exchange when the size of reactors is increased.
At the end of the Applied Research stage, a pilot installation may be tested with natural water or wastewater. Once technologies have completed the Applied Research stage at an institute, assuming the results are promising, the technology will typically be examined for the purposes of an Invention Disclosure and Patent Cooperation Treaty (PCT) patent filing. The technology is then handed over to the institution’s Technology Transfer Office or its equivalent.
Stage 2: Pilot Stage (Innovators)
The Pilot stage matches E.U. Horizon 2020 TRLs 6 to 9 and corresponds to the first part of the Innovators step in the TALC model. The criteria for this stage are as follows: (1) The technology is tested outside the laboratory in real-life applications; (2) Until at least one full-scale plant is operational, the technology remains in the Pilot stage. This stage concerns, for example, the deployment of a pilot-scale reactor at a municipal or industrial water resource recovery facility, a desalination facility, or drinking water treatment facility.
Pilot stage testing is typically carried out to gather data on operations, such as the technology’s robustness in real-world conditions, which can then be used as design criteria for the scale-up to a full-scale plant. The data gathered is dependent on the process, but can include parameters such as reaction rates, membrane flux rates, removal efficiencies, chemical and energy consumption, time between cleaning cycles, and variation in performance following extended periods of operation. A pilot plant is basically a smaller-scale version of the technology, envisaged as a commercial full-scale system in terms of size and capacity.

Development and Application of a Model to Study Water Technology Adoption
39
Chap
ter
2
Issues frequently identified during the Pilot stage include:
• Inhibition of a biological process as a result of substances not present in the synthetic feed used in the laboratory.
• Membrane fouling as a result of inorganic deposits and biofouling.• Reaction rates, removal and flux rates or other key performance criteria are different
from expected data.
At this stage, the technology is typically being developed by a company and has left the research institute or laboratory. It is linked to commercial activity, and pilots can therefore be funded by the potential end user or by the company offering the technology.
The Pilot stage is not to be confused with all pilot testing. A fully commercial technology may still be ‘piloted’, or undergo pilot testing at particular sites to reduce the risk of failure in a full-scale application, but this may, for example, concern a new application for the technology. This type of pilot testing would be part of a feasibility study, which can take place during the later stages of this model. Many efforts to bring new solutions to market fail at the Pilot stage, or can remain stalled at this stage and have difficulty moving beyond it. In the context of the WaTA model, failure is defined as failure on the part of the technology developer to move the technology forward. If this happens, there is a potential for the technology to be successful as it can still be ultimately picked up by another entity, which then continues to try and move the innovation forward.
Stage 3: Demonstration Stage (Innovators)
This stage no longer matches any TRLs, but is equivalent to the second part of the Innovators step of the TALC model. The criteria for this stage are as follows: (1) The technology must now be of a size and scale that would be practical in the real-world target applications; (2) The technology must form part of a formal commercial product offering; (3) The technology is deemed to remain at this stage until there are three units operating at a similar scale, in similar applications. The Demonstration stage involves the construction and deployment of the technology in full-scale systems in target applications. The criterion of having no more than three units operating at a similar scale, in similar applications, in this stage is based on the concept of ‘proven innovation’, frequently contained in tendering documents, often requiring three reference plants at a similar scale treating a similar stream (see also next stage). The author noticed that the following technologies were already offered by one to three companies at the Demonstration stage: capacitive deionization, ceramic ultrafiltration membranes, struvite crystallization, granular activated sludge, forward osmosis, short-cut nitrification, membrane bioreactors, anaerobic membrane bioreactors, and supercritical water oxidation.

Chapter 2
40
Stage 4: Early Adopters
This stage corresponds to the Early Adopters step of the TALC model and meets the following criteria:
• The technology is now a ‘proven technology’, but is not yet widely accepted by end users in the market.
• There are some commercial sales of first-generation units to early adopters.• At least three units, but typically less than twenty-five units, are now operating at a
similar scale in similar applications.• The technology remains at the Early Adopters stage until it has been fully commercial-
ized and then moves to the Early and Late Majority stage. The Early Majority, typically, will only adopt a ‘proven technology’ that is accepted by a sufficient number of end users.
The definition of ‘proven technology’ or ‘proven innovation’ is embodied in many state regulatory bodies engineering guidelines, such as the following (Ontario Ministry of the Environment, 2008): (1) At least three separate installations must be operating at (near-) design capacity; (2) The technology should have an operating record of a minimum of three years, at three separate locations; (3) The technology should show reliable and consistent compliance with design performance criteria, for a minimum of three years, without major failure of either the process or the equipment.
At the Early Adopters stage, the technology is still a ‘new technology’, and is unlikely to be specified by a consulting engineer or appear in formal tender documents. There is limited awareness and technical understanding or expertise, in relation to the technology, among end users and water professionals. In the water sector, these Early Adopters tend to be the larger water utilities, serving populations greater than 100,000 people, or operating facilities with capacities greater than 20,000 m3 per day. The Early Adopter water utilities typically have strong internal teams, with a high degree of expertise and capability. They are visible as leaders in the industry and may participate in technical committees and present papers at water conferences.
Stage 5: Early and Late Majority
For the purposes of the Water Technology Adoption (WaTA) model, the author has proposed that it makes sense to combine Early and Late Majority into one stage. Based on analysis and research interviews, the author does not believe there are clearly defined differences in water between these two segments, and that both can be defined as one cohesive stage. The technology is now commercialized and moving into the Early and Late Majority step of Rogers’ TALC market adoption model. As the water sector does not display a difference between the Early Majority and Late Majority sections, this stage constitutes adoption by roughly 68%. The criteria for assessing whether a technology has reached this stage are as follows:

Development and Application of a Model to Study Water Technology Adoption
41
Chap
ter
2
• Consulting engineering companies begin to specify the technology for a project during the design phase.
• The technology now appears in formal tender documents and requests for proposals (RFPs).
• At least three companies are actively offering versions of this technology to end-users.• There are more than 30 full-scale units in operation.
The technology is now no longer only used by Early Adopters, but is typically still only offered by a handful of companies (usually not more than six) at the start of the Early and Late Majority stage. As the market adopts the technology, new players will enter towards the end of the Early and Late Majority stage (and at the start of the Maturity stage).
The definition for the point at which a technology is deemed to be ‘commercialized’ and moving out of the Early Adopters stage is based on case studies for ultraviolet disinfection, membrane bioreactors, sludge thermal hydrolysis and struvite precipitation, and research interviews with CEOs and CTOs of technology companies and end users. At the Early Adopters stage, the rate of technology installation increases most rapidly, and the time taken to double the number of cumulative installations is the shortest; the technology is now entering the log-phase in terms of technology dissemination and adoption. This can be observed when cumulative annual installations are plotted, and an inflection point is apparent in the TLC S-curve. When the technology moves from the Early Adopters to the Early and Late Majority stage there are typically 25-30 full-scale plants successfully in operation. The technology now also begins to be specified by design engineers in projects and appears in formal tender documents.
Stage 6: Maturity Stage
This stage corresponds to the Laggards section in Rogers’ TALC model. The criteria are the following:
• The technology is now included in standard engineering manuals and textbooks, as well as in university courses and curriculums as design projects for students.
• The know-how and expertise required to design and implement the technology is no longer in the hands of a small number of companies offering proprietary technologies.
• It is now becoming a commodity technology with multiple suppliers (greater than ten), offering competing products.
• The knowledge of process design enables engineering professionals to be able to design generic nonproprietary versions of this technology.
• The rate of increase in annual cumulative installations levels off, as market saturation occurs.
• Original patents are nearing the end of their life or may have expired.

Chapter 2
42
During the Maturity stage, the systems continue to be value-engineered, and sustaining innovation keeps delivering small improvements in efficiency. A mature technology is, itself, now at risk of being displaced in the market by newer technologies.
3.1. Results of testing criteria on a sample data set of water technologies at differ-ent stages of the Water Technology Adoption (WaTA) model
The results of testing the criteria on the sample data set are illustrated in Figure 7. Figure 7 illustrates how the technologies in the test data set were assigned across the different stages of the Water Technology Adoption (WaTA) model using the criteria set out in Figure 6. The testing on 488 different proprietary technologies showed that the model is quite robust, as it was possible to use the criteria to classify all the technologies into relevant stages. The criteria and defined stages of the WaTA model can be applied across a wide range of different water and wastewater treatment technologies. The first three stages of the model (Applied Research, Pilot, and Demonstration) proved to be relatively straightforward to classify. It is also relatively clear when a technology has moved from the Demonstration to the Early Adopters stage because this is based on the number of full-scale plants in operation. The most challenging classification is between the Early Adopters and Early and Late Majority stages because their definitions are more qualitative in nature, and the transition is a function of both the market
Figure 7: Distribution of the test data set across the stages of the Water Technology Adoption Model (WaTA).
0
40
80
120
160
200
AppliedResearch
Pilot(Innovators)
Demonstration(Innovators)
Early Adopters Early & LateMajority
Mature
Num
ber o
f tec
hnol
ogie
s in
dat
a se
t at e
ach
stag
e

Development and Application of a Model to Study Water Technology Adoption
43
Chap
ter
2
and the technology. Th e technology itself may undergo improvements, with second-generation systems being developed and deployed in the fi rst major market segment (the so-called Early Majority), using the experience gained in the Early Adopters stage. A key transition point between Early Adopters and Early and Late Majority is when the technology is deemed ‘commercialised’. It was found that this transition also correlated with the existence of over 30 full-scale plants in operation. Once this number of plants is in operation, the knowledge and experience gained from earlier generations allow improvements in subsequent generations, and the Early Majority customers now regard this as a proven and accepted technology.
3.2. Average water technology adoption timelinesBased on the analysis of case studies outlined in Section 2, a set of average timelines for each stage were developed and proposed. Th ese are illustrated in Figure 8. It was found that the Applied Research stage typically takes seven to ten years, but can vary between four and twelve years.
Cum
ulat
ive
num
ber o
f ins
talla
tions
or
cum
ulat
ive
inst
alle
d ca
paci
ty
Innovators 2.5%
Early Adopters
13.5%
Early Majority
34%
Late Majority
34%
Laggards 16%
Time
Technology lifecycle s-curve
Roger’s bell curve for technology adoption
Innovators5-8 years
Early Adopters6-8 years
Early & Late Majority12-16 years
Pilot & Demo
5-8 years
Figure 8: Water Technology Adoption (WaTA) model timelines.
Figure 8 outlines the average timelines that are proposed based on this research that can be assigned to each stage of the Water Technology Adoption model (WaTA). Th e Pilot stage typically takes two to three years, but can take as many as fi ve. Th is is because it can take time to fi nd sites and clients that are willing to host pilot tests, each

Chapter 2
44
pilot test typically operating over four to twelve weeks. A minimum of four weeks is frequently required to establish stable operating conditions, and monitor any variability in performance. A water technology can be at the Demonstration stage for three to five years. The combined time for Pilot and Demonstration, which relates to the Innovators stage, is typically the region of five to eight years.
Once a technology has been shown to operate reliably in three demonstration-scale plants, it moves on to the Early Adopters stage of the WaTA Model. The Early Adopters stage can last a further 6 to 8 years, and the Early and Late Majority stage can typically last 12 to 16 years as the technology continues to be adopted, until a technology is regarded as mature. A mature technology can remain in use indefinitely, until it is replaced by an alternative. To give an example, activated sludge wastewater treatment was first developed in 1914, and is still in use over 100 years later.
4. Conclusion
The author has a number of key conclusions from this work. Firstly, the proposed model, along with the accompanying definitions and criteria, are suitable for the study of water technology adoption. This will be foundational for future analysis of different types of water technologies. One of the key findings of this present study is that it is possible to develop generalized timelines for successful technology commercialization. The average timelines that the author has identified for each stage of the model support an industry belief that the process of water technology development and adoption can take more than a decade. Analysis indicates that from the year that pilot testing commences to when the technology is moving into the Early Majority section of the market and is commercialized, can take in the region of 11 to 16 years. This needs to be considered by any companies that are actively seeking to introduce a new technology to the water market. Having established timelines that are reasonable and typical, the author believes that this sets an important benchmark against which velocity, or rate, of progress can be measured. Technologies that are taking much longer than the average timelines outlined in this model run the risk of stalling out and failing to be adopted. The author believes that certain factors may accelerate adoption, and that there may be differences in timelines between different types of technologies – this will be explored in future research.
Another important conclusion arising out of this work is that velocity, or the rate, at which technologies move through the process of dissemination and adoption is an important metric to track and analyze, and that the extent of any deviation from these industry averages can be an indication of potential failures in this process. Because of the nature of the definitions, there will be a degree of subjectivity in the use of this model, and it is possible for a technology to straddle adjacent categories. It is important

Development and Application of a Model to Study Water Technology Adoption
45
Chap
ter
2
when measuring technology stage to consider reference plants by all companies that are offering a particular technology class, rather than looking at the references for one company in isolation. However, from the perspective of an end user who is looking to adopt a new technology, they typically wish to see that one particular vendor has three full-scale plants in operation before they will consider that the technology has moved beyond ‘Demonstration’. No credit is given for the fact that a different company with a competing or similar technology may also have operational reference plants.
5. Future work
There are many exciting possibilities for future applications of this model:
• Future papers could examine if there are any reasons why certain technologies move faster than others, perhaps linked to differences in external factors, or technology-related factors i.e. any differences in timelines between water treatment and wastewater treatment technologies.
• Future papers could also seek to examine the rate of improvement in performance and efficiency over time, and the impact and feedback loop that this has on the rate of adoption. The average success rates for water technologies could also be studied to see what percentage of the technologies succeed, versus what percentage fail, or remain stalled out.
• Analysis of the relationship between the duration of the latency period, (Applied Research, Pilot and Demonstration stages) and the total life span of a technology, could also be interesting to investigate. This could allow the determination, for example, of the optimum life span of a patent (monopoly), balancing the need for monopoly and drivers for innovation versus hampering innovation as a result of an extended monopoly. It could also allow the assessment of the best technology development approaches for different life span durations.
• The establishment of typical timelines for each stage also provides an objective means by which to measure velocity, or rate, of progress of a given technology against timelines that might be considered reasonable. There is also a need to investigate whether an algorithm can be developed that would enable velocity to be calculated as a value, and relate it to the industry averages as a possible predictive indicator of success or failure.
• The ability to measure the velocity of technologies as they move through this process over time against industry baseline averages could be a valuable diagnostic tool to determine their likely rate of success, and could also help pinpoint when a technol-ogy appears to be taking longer (or moves faster) than usual.

3

Chapter 3Analysis of Factors Affecting
Rates of Technology Adoption

Chapter 3
48
1. Introduction
It has been claimed that the water sector is less innovative than other sectors (Kwok & O’Callaghan, 2009; Wehn & Montalvo, 2018) with less invested in R&D (Ipektsidis et al., 2016). A paper in the recent special issue of the Journal of Cleaner Production, The Dynamics of Water Innovation (2018) (Wehn & Montalvo, 2018), noted that relative to the scope of innovation studies, there is a striking absence of academic studies on the dynamics of water innovation. In particular, it was noted that there was a lack of studies examining how relevant actors (fail to) interact to generate, finance, diffuse and apply water innovations and how these processes can be fostered, guided and steered. At the same time, it is widely accepted that water challenges exist (United Nations, 2016) and that new solutions and innovative approaches are required to meet these needs (Ajami et al., 2014; Krozer et al., 2010; Partzsch, 2009).
The slow nature of the water technology adoption process (Ipektsidis et al., 2016), compared to other sectors like the energy sector, can act as a disincentive towards new investment into research and development and water technology commercialization. Despite these perceptions, the author identified 121 early stage companies that received a combined cumulative investment of $1.75 billion in the period of 2006 – 2016.
Given the amount of capital being invested, the success rate of investment in water technologies is often questioned and the author wished to understand the factors that may affect rates of adoption of water technologies to enable efficient and informed use of capital. When human capital or financial capital is deployed, a return on investment is required in order for this to be sustainable. If a new technology is not adopted, there is no possibility for value creation from the deployment of the technology.
Based on analysis of case studies, a Water Technology Adoption (WaTA) model was developed (O’Callaghan et al. 2018). This model defined six stages: 1. Applied Research, 2. Pilot (Innovators) 3. Demonstration (Innovators), 4. Early Adopters, 5. Early and Late Majority and 6. Mature. It was noted that it can take 11-16 years for a technology to move from Innovators to Early Majority and Late Majority section of the market.
Within these water industry averages, the author had observed that some technologies appeared to move faster than others through various stages of the Water Technology Adoption (WaTA) model. The analysis of factors that can drive and accelerate water technology innovation and diffusion, such as policy, regulation, innovation accelerators and water clusters has been the subject of a number of recent papers (Gabrielsson et al., 2018; Schmidt et al., 2018; Tanner et al., 2018).
The author was curious to investigate if there were any patterns that were discernible, external factors or technology related factors that could be linked to faster or slower rates of technology adoption. In this chapter, the rate of adoption has been measured as the

Analysis of Factors Affecting Rates of Technology Adoption
49
Chap
ter
3
number of full-scale plants built per year. To support this analysis, the author decided to select six case studies of new water technology innovation in the last 30 years and analyse the respective timelines for moving through various stages of water technology commercialisation.
2. Methodology
To allow for analysis of the timelines, it was necessary to select water technologies that had already moved through the first stages of the Water Technology Adoption (WaTA) model and reached at least stage 4, the Early and Late Majority. In the context of this chapter, the term ‘water technologies’ refers to drinking water treatment, and wastewater treatment technologies. The availability of data to support the analysis was one factor that was used to determine which technologies were short-listed for analysis. In the absence of available historic data, it would not be possible to analyze the rate of technology diffusion. The technologies were also selected for being diverse geographically and across different types of treatment from drinking water to wastewater.
The six short-listed technologies, including the type of water technology each represents and the period of years studied in this chapter, are presented in the Table 1.
Table 1: The technologies studied in this chapter
Name of technology Type of water technology Time period studied Country
Sequencing Batch Reactor (SBR)
Wastewater Treatment 1981-19891985-1992
JapanUSA
Biological Phosphorous Removal (BPR)
Wastewater Treatment 1972-1982 South Africa
Ultrafiltration Membranes Drinking Water Treatment 1985-19951995-2004
UK North America (USA & Canada)
THIOPAQ Biogas Desulphurization Process
Wastewater Treatment 1990-2009 Europe
Sludge Thermal Hydrolysis Wastewater Treatment 1996-2016 Global
Ultraviolet Disinfection Drinking Water Treatment 1982-1992 USA
To gather the data on these six case studies, the author contacted informed industry professionals in Australia, Japan, Europe and North America with detailed knowledge of these technologies and databases that tracked the technology deployment. In each case we focused on the time period moving from the Innovators stage (Pilot stage and Demonstration stage) to Early Adopters and then to Early Majority.

Chapter 3
50
The general methodology followed was to obtain data on the number and the size of plants that were installed over the ten-year period following the first full-scale commercial installation. The criteria used to assign technologies to a particular stage in the water technology diffusion model were taken from our Water Technology Adoption (WaTA) model (O’Callaghan et al., 2018), a brief overview of the different stages is explained as follows.
Starting with the first stage, the Applied Research Stage corresponds to when research and development (R&D) is taking place in a laboratory setting with the aim of developing a water treatment technology with a real-world application. After which, the technology will be tested outside the laboratory in real-life applications and will remain in the second stage, known as the Pilot Stage, until at least one full-scale plant is operational. Many efforts to bring new solutions to market fail at this stage or can remain stalled at this stage and have difficulty moving beyond it.
Once the technology is of a size and scale that would be practical in real-world target applications and forms part of a formal commercial product offering, the technology has entered the third stage, known as Demonstration stage. The technology is deemed to remain at this stage until there are three units operating at a similar scale in similar applications. The Early Adopters stage corresponds to a technology that is ‘proven’ where commercial sales of first-generation units are taking place, but is not yet widely accepted by end-users in the market. Between three and thirty units are now operating at a similar scale in similar applications. The technology remains in the Early Adopters stage until it has been fully commercialised and reaches the final stage: Early and Late Majority stage. The Early Majority typically will only adopt what is deemed to be a ‘proven technology’.
The following is a brief description of each of the technologies analysed and the methods used to obtain the data.
Sequencing Batch Reactors (SBR)A Sequencing Batch Reactor (SBR) is a wastewater treatment technology based on the activated sludge process (USEPA, 1999) that uses suspended bacterial growth in an aerated reactor to achieve biochemical oxygen demand (BOD) removal.
The key innovation of the SBR technology was the use of timed cycles to enable solids separation to be achieved by allowing a quiescent phase in the aeration basin where solids were allowed to separate and were removed from the bottom of the tank using a decanter. The ability to perform multiple unit processes in a single tank using a timed control sequence provided a number of valuable advantages over conventional activated sludge technology such as reduction in capital costs and reduced footprint by eliminating the secondary clarifier.

Analysis of Factors Affecting Rates of Technology Adoption
51
Chap
ter
3
This chapter is focused on the time period of 1981 to 1992 using the data obtained from Mr. Paul Cardinal, former CEO of Austin BioJet, and also from the book Sequencing Batch Reactor (Wilderer et al., 2001). The first SBR plants were constructed in Australia and Japan and the technology was subsequently introduced into North America (Strous et al., 1998; Wang & Li, 2009) with various biological nutrient removal configurations.
Biological Phosphorus Removal (BPR)Biological Phosphorus Removal enables phosphorus to be removed from wastewater through a process known as luxury phosphorus uptake where phosphorus is taken up by Poly-phosphate Accumulating Organisms (PAO) and stored within the bacterial cells (Blackall et al., 2002; Zhou et al., 2007). Daspoort Pretoria WWTP (SA) was the first pilot plant where BPR was observed in 1972. Soon after in 1973, Barnard found that phosphorous was removed by fermenting biomass and returning the product to un-aerated zone (Seviour et al., 2003).
There was an acute need in South Africa at the time to remove phosphorus from wastewater as it was leading to eutrophication of surface water bodies (Oleszkiewicz & Barnard, 2006). An alternative method of removing phosphorus through chemical dosing was not viable or possible at the time in South Africa as this used metal salts, such as ferric chloride and aluminum sulphate. This would have led to increased total dissolved solids levels in water bodies, which were already elevated (Schutte et al., 1987).
The author contacted one of the original technology inventors for Biological Phosphorus Removal: Dr. James L. Barnard, Black and Veatch. He has published numerous papers on the subject of biological phosphorus removal (Barnard, J. L., 1975) and was able to assist the author of this chapter in analyzing the evolution of the technology 1972 to 1982.
Ultrafiltration Membranes for Drinking Water TreatmentThe use of ultrafiltration membranes for drinking water treatment is now widely accepted and used. When the technology was first deployed in the late 1980’s and early 1990’s, it was more expensive than the conventional treatment processes such as media filtration and coagulation. A key catalyst to the introduction and use of this technology in drinking water treatment was the need to provide a method to remove cryptosporidium from drinking water. This was linked to outbreaks of cryptosporidium in the UK (Atherton et al., 1995) and USA (Solo-Gabriele & Neumeister, 1996).
The period studied in this chapter was 1985 to 2004. Data on the number of installations was obtained for the UK, the United States and Canada from Dr. Graeme Pearce based on records he maintained and from Zenon, a leading pioneer in the use of ultrafiltration membrane technology for drinking water treatment.

Chapter 3
52
THIOPAQ Sulphide Removal from BiogasFollowing successful trials, the first commercial unit for biogas desulphurisation was built in 1993 (Benschop et al., 2002). THIOPAQ is a technology used for the removal of sulphur from biogas through biological oxidation of hydrogen sulphide gas to elemental sulphur. This technology enables the extraction of biosulfur from natural gas, landfill gas or biogas. The bio-sulphur is suited for use as fertilizer or fungicide as it is more bioavailable to crops than chemically produced sulphur. Data on the number of installations was provided by Dr. Cees Buisman, who started working on the first THIOPAQ pilot plant in the Netherlands in 1990.
Sludge Thermal Hydrolysis Sludge thermal hydrolysis uses pressure and temperature to achieve cell lysis of secondary activated sludge, leading to increased conversion of sludge volatile solids to methane gas during the anaerobic digestion process. Data to support this study was obtained by contacting the technology provider CAMBI, a pioneer in introducing this technology. The key advantages and value of this technology is that it increases the efficiency of the anaerobic digestion process, produces a Class A Biosolid, leads to improved sludge dewaterability and increases anaerobic digester capacity.
The technology was first piloted in 1989 by the company Cambi, and the first full-scale installation of Thermal Hydrolysis Process (THP) was developed and implemented at a plant for the City of Hamar in Norway in 1995 (Kalogo & Monteith, 2008). The world’s largest sludge pre-treatment system was built in 1999 at Ringsend WWT in Dublin, using Design Build Operate (DBO) model which provided lower whole-life costs for the 20 Year DBO.
Ultraviolet Disinfection The germicidal effectiveness of ultraviolet C radiation varies between species and peaks at about 260-265 nm, which corresponds to the peak of UV absorption by bacterial DNA (Kowalski, 2009). UV disinfection uses 254 nm UV light to germicidially irradiate various species/contaminants/microorganisms.
This case study focuses on the evolution of the Trojan UV technology for the treatment of municipal wastewater in the period of 1982-1992. Data was accumulated from a review of related literature (Johnson & Qualls, 1984; Petrasek et al., 1980; Scheible et al., 1981; Severin, 1980) and research interviews with the founder of Trojan UV, Hank Van der Laan.
In the late 1970’s and early 1980’s, there was an environmental need, in one of the largest US watersheds (Chesapeake Bay), related to the toxicity levels of its harvested shellfish, which was attributed primarily to the effluent discharges from municipal

Analysis of Factors Affecting Rates of Technology Adoption
53
Chap
ter
3
wastewater systems surrounding that particular watershed (Pace et al., 1988). As a result of this, US Congressmen began inquiring whether UV had the ability to disinfect municipal wastewater. In 1982, Trojan UV demonstrated the technology at the first full-scale installation in Tillsonburg WWTP, Ontario (Canada) for disinfection of municipal water.
3. Results & discussion
SBR Wastewater Treatment The SBR data is presented in Figure 1 and Figure 2 for two geographic locations. When compared with the data of the other technologies, the SBR data showed that the technology moved much faster relative to the other technologies. The key contributory factors are listed below:
• A smaller footprint and capital cost advantage of at least 25%, due to the elimination of the secondary clarifier and associated civil works.
• State-level Innovative and Advanced Technology Grants, that covered up to 60% of the process costs of the plant (i.e. excluding non-related costs such as laboratories, ground works, civil works, offices, etc.) – this made it very attractive to the end-user clients in Tennessee. Such a financial incentive was not present in the other five case studies (UV Disinfection, Biological Phosphorus Removal, UF Membrane Filtration, Thermal Hydrolysis and THIOPAQ).
• A regulatory driver that required biological nutrient removal.
SBR technology was first introduced to the US market by a new entrant to the market, Austgen Biojet (ABJ), as opposed to by an incumbent company. ABJ was the sole builder of SBR systems in the US from 1984 until 1987, at which point several jet aerator companies, such as Fluidyne, incorporated SBR technology into their product lines and the company Aqua Aerobic Systems entered the SBR market (Cardinal, P.J., personal communication, February 2018).
Biological Phosphorus Removal Wastewater TreatmentThe transfer of biological phosphorus removal from laboratory scale pilots, directly to full-scale demonstration plants, is an example of an exceptionally rapid movement through the Water Technology Adoption (WaTA) model. The two main factors that contributed to accelerated technology adoption were that:
1. There was a high level of knowledge sharing between the utility managers via monthly meetings of the local water institute (Barnard, J. L., Personal Communication, November 2017).

Chapter 3
54
510
15
23
32
53
64 65
0
10
20
30
40
50
60
70
0
10
20
30
40
50
60
70
80
90
1985 1986 1987 1988 1989 1990 1991 1992
Cum
ulat
ive
inst
alle
d ca
paci
ty (M
GD
)
Cum
ulat
ive
num
ber o
f ins
talla
tions
YearCumulative installations Cumulative capacity
Early Adopters (5 Years)
Early & Late Majority
Figure 2: SBR Technology – rate of technology adoption in the USA.
1 29
14
26
42
59
7174
0
5,000
10,000
15,000
20,000
25,000
30,000
35,000
0
10
20
30
40
50
60
70
80
90
1981 1982 1983 1984 1985 1986 1987 1988 1989
Cum
ulat
ive
inst
alle
d ca
paci
ty (m
³/d)
Cum
ulat
ive
num
ber o
f ins
talla
tions
Year
Cumulative installations Cumulative capacity
Innovators(3 Years)
Early Adopters (3 Years)
Early & LateMajority
Figure 1: SBR Technology – rate of technology adoption in Japan.

Analysis of Factors Affecting Rates of Technology Adoption
55
Chap
ter
3
2. There was a high level of competence and wastewater expertise in the wastewater industry at that time (Barnard, J. L., Personal Communication, November 2017).
Another author, Parker, had previously emphasized that sharing information was a key factor for increased rate of adoption in water technology market (Parker, 2011).
The use of BPR technology was not less expensive than the incumbent alternative, which would be to add metal salts such as aluminum sulphate or ferric chloride, to remove phosphorus. However, the inability to use these chemicals, due to salinity issues in the receiving waters, meant that BPR was a compelling alternative.
According to Figure 3, the Biological Phosphorus Removal (BPR) data showed that the first plant was installed in 1972 and by 1974 there were five full-scale plant installations. The crossover point from Innovators to Early Adopters, defined in the Water Technology Adoption (WaTA) model, is three full-scale plants hence the technology moved through the Innovators stage and into the Early Adopters stage within three years. Within the period 1972-1982, this technology seems to have reached market saturation at around 18 installations.
12
5
9
1213
1516 16
1718
-
100
200
300
400
500
600
0
2
4
6
8
10
12
14
16
18
20
1972 1973 1974 1975 1976 1977 1978 1979 1980 1981 1982 Cum
ulat
ive
inst
alle
d ca
paci
ty (P
E *1
0,00
0)
Cum
ulat
ive
num
ber o
f ins
talla
tions
YearCumulative installations Cumulative capacity
Figure 3: Biological phosphorus removal – rate of technology adoption in South Africa.

Chapter 3
56
In the case of South Africa between 1972-1982, there were less than 30 wastewater treatment plants in the size range studied (>10,000 PE). As such, the standard metric of using the numeric indicator of 30 plants to when a technology moves to Early Majority, does not apply here in this case. In the WaTA model, if one applies the numerical guidelines, this would suggest that it remained at Early Adopters stage. However, if we refer to Rogers (Rogers, 2003), we can see that the Innovators section is 2.5% of the market adopters and Early Adopters is 13.5%, so combined it is 16%. In this instance we estimate that the technology also moved into Early Majority within 3 years by 1974 as 5 reference plants represents more than 16% of the total number of plants. Hence, this technology moved from Innovators to Early Majority stage within 3 years, skipping the Early Adopters stage. As this was a special case, BPR was not included when estimating the average number of years taken for the Crisis and Value Driven types of technologies as they move through the Water Technology Adoption (WaTA) model.
Ultrafiltration Drinking Water Treatment Figure 4 illustrates the rapid adoption of UF membranes in the UK, which can be explained by the regulations that were introduced in the UK in 1992 (Nichols, G. et al., 2006) in order to reduce risk of Cryptosporidium in water supplies. This required the use of an absolute filtration barrier against Cryptosporidium outbreak that occurred in 1989 in UK. In North America, the uptake in membranes lagged behind the 1993 Milwaukee outbreak by about 4 years with plants being installed in 1997, as can be seen in Figure 5. This outbreak paved the way for the Interim Enhanced Surface Water Treatment Rule, promulgated on December 16, 1998 (USEPA, 2001), which applied to water utilities using surface water, or groundwater under the direct influence of surface. This corresponds to the increased adoption of UF membrane Filtration in North America with the technology moving through the Early Adopters portion of the market between 1997 and 2001 (Figure 5). In the United States, regulations came in the form of the Surface Water Enhanced Long Term treatment regulations (USEPA, 2005).
When first introduced in drinking water treatment references in the early to mid-1990’s, UF membranes were a significantly more expensive filtration option when compared to sand filtration. However, after 2000, prices began to come down steadily and project sizes increased, gradually reducing the difference in costs. The first project in the US where membranes represented a competitive bid on a project, which was also open to bid from conventional options, was Olvenhain in California. This took place in 2008 and was won by GE. Prior to that, membranes only won projects in which membranes were specified (Pearce, G., personal communication, February 2018).
There were no grant subsidies to encourage or off-set the use of membrane filtration in the US or the UK markets. UF technology succeeded initially, in the Innovators and

Analysis of Factors Affecting Rates of Technology Adoption
57
Chap
ter
3
Early Adopters stages, by being specified due to legislative or government drivers and not as a result of financial incentives.
0 0 1 3 5 711
17
27
41
59
80
0
10
20
30
40
50
60
70
80
90
100
1993 1994 1995 1996 1997 1998 1999 2000 2001 2002 2003 2004
Cum
ulat
ive
num
ber o
f ins
talla
tions
Year
Innovators (2 Years)
Early & LateMajority
Early Adopters (5 Years)
1993: Milwaukee outbreak
Figure 5: UF membrane drinking water filtration – rate of technology adoption in North America.
0
50
100
150
200
250
1985 1986 1987 1988 1989 1990 1991 1992 1993 1994 1995
Cum
ulat
ive
inst
alle
d ca
paci
ty (M
LD)
Year
1989: A largeCryptosporidiumoutbreak in the UK
1992: Legislation mentioned 1-micronabsolute barrier and expert groupdeveloped and published policy onreducing risk of Cryptosporidium inwater supplies.
Figure 4: UF Membrane drinking water filtration – rate of technology adoption in the United Kingdom.

Chapter 3
58
UF Membrane filtration could be deemed to be a disruptive innovation in the water sector as it represented a completely new approach to conventional sand filtration and was introduced by new entrants to the market, such as Zenon, Kalsep and Norit X Flow. However, when compared with the theories and definitions of disruptive innovation as outlined in the work of Clayton Christiansen (Christensen, 1997), the technology is neither an example of disruptive innovation nor sustaining innovation, as the technology did not represent in incremental improvement, which would be typical of sustaining innovation, and required a legislative driver to ensure it was specified into contracts when it was first introduced. In this instance an external factor, legislation, was required to stimulate the adoption of a disruptive technology.
THIOPAQ Wastewater TreatmentIn 1997, a strong alliance was formed between Paques and Shell, leading to the successful development of THIOPAQ and its deployment to the broader oil and gas industry. Thereafter, the number of plants increased to almost 100 within 20 years, as can be seen in Figure 6.
1 1 1 2 2 3 3 4 6 917
2125 25
36 38
54
65
75
95
0
5,000
10,000
15,000
20,000
25,000
30,000
35,000
40,000
0
20
40
60
80
100
1990
1991
1992
1993
1994
1995
1996
1997
1998
1999
2000
2001
2002
2003
2004
2005
2006
2007
2008
2009
Cum
ulat
ive
inst
alle
d ca
paci
ty (k
g/d)
Cum
ulat
ive
num
ber o
f ins
talla
tions
Year
Cumulative installations Cumulative capacity
Innovators (6 Years)
Early & LateMajority
Early Adopters (9 Years)
Figure 6: THIOPAQ – rate of technology adoption in Europe.
Hydrogen sulphide gas is present in biogas and in natural gas but has to be removed before it can be used. The main driver then for the removal of hydrogen sulphide, is to enable the biogas and natural gas to be used to generate energy. The prevailing method
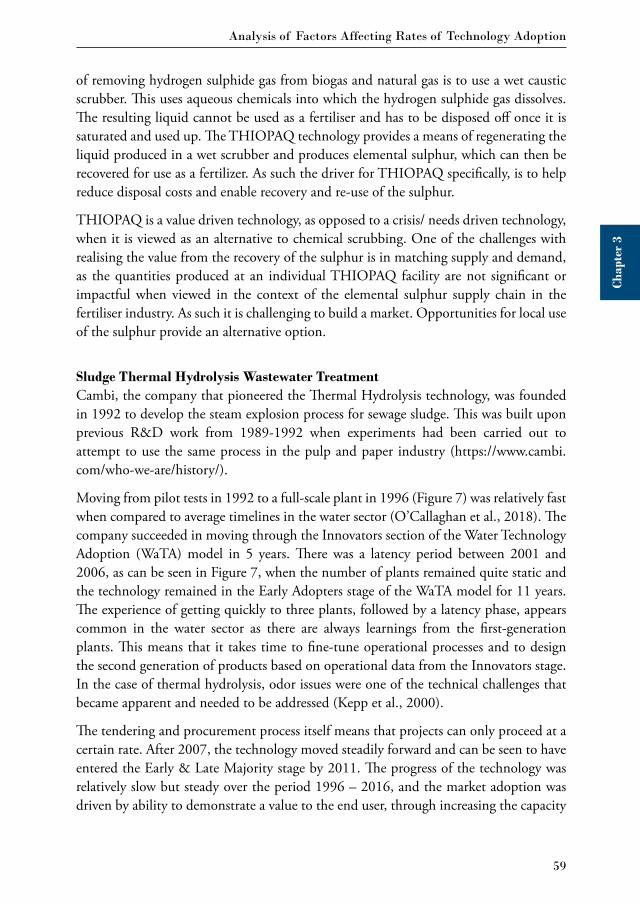
Analysis of Factors Affecting Rates of Technology Adoption
59
Chap
ter
3
of removing hydrogen sulphide gas from biogas and natural gas is to use a wet caustic scrubber. This uses aqueous chemicals into which the hydrogen sulphide gas dissolves. The resulting liquid cannot be used as a fertiliser and has to be disposed off once it is saturated and used up. The THIOPAQ technology provides a means of regenerating the liquid produced in a wet scrubber and produces elemental sulphur, which can then be recovered for use as a fertilizer. As such the driver for THIOPAQ specifically, is to help reduce disposal costs and enable recovery and re-use of the sulphur.
THIOPAQ is a value driven technology, as opposed to a crisis/ needs driven technology, when it is viewed as an alternative to chemical scrubbing. One of the challenges with realising the value from the recovery of the sulphur is in matching supply and demand, as the quantities produced at an individual THIOPAQ facility are not significant or impactful when viewed in the context of the elemental sulphur supply chain in the fertiliser industry. As such it is challenging to build a market. Opportunities for local use of the sulphur provide an alternative option.
Sludge Thermal Hydrolysis Wastewater TreatmentCambi, the company that pioneered the Thermal Hydrolysis technology, was founded in 1992 to develop the steam explosion process for sewage sludge. This was built upon previous R&D work from 1989-1992 when experiments had been carried out to attempt to use the same process in the pulp and paper industry (https://www.cambi.com/who-we-are/history/).
Moving from pilot tests in 1992 to a full-scale plant in 1996 (Figure 7) was relatively fast when compared to average timelines in the water sector (O’Callaghan et al., 2018). The company succeeded in moving through the Innovators section of the Water Technology Adoption (WaTA) model in 5 years. There was a latency period between 2001 and 2006, as can be seen in Figure 7, when the number of plants remained quite static and the technology remained in the Early Adopters stage of the WaTA model for 11 years. The experience of getting quickly to three plants, followed by a latency phase, appears common in the water sector as there are always learnings from the first-generation plants. This means that it takes time to fine-tune operational processes and to design the second generation of products based on operational data from the Innovators stage. In the case of thermal hydrolysis, odor issues were one of the technical challenges that became apparent and needed to be addressed (Kepp et al., 2000).
The tendering and procurement process itself means that projects can only proceed at a certain rate. After 2007, the technology moved steadily forward and can be seen to have entered the Early & Late Majority stage by 2011. The progress of the technology was relatively slow but steady over the period 1996 – 2016, and the market adoption was driven by ability to demonstrate a value to the end user, through increasing the capacity
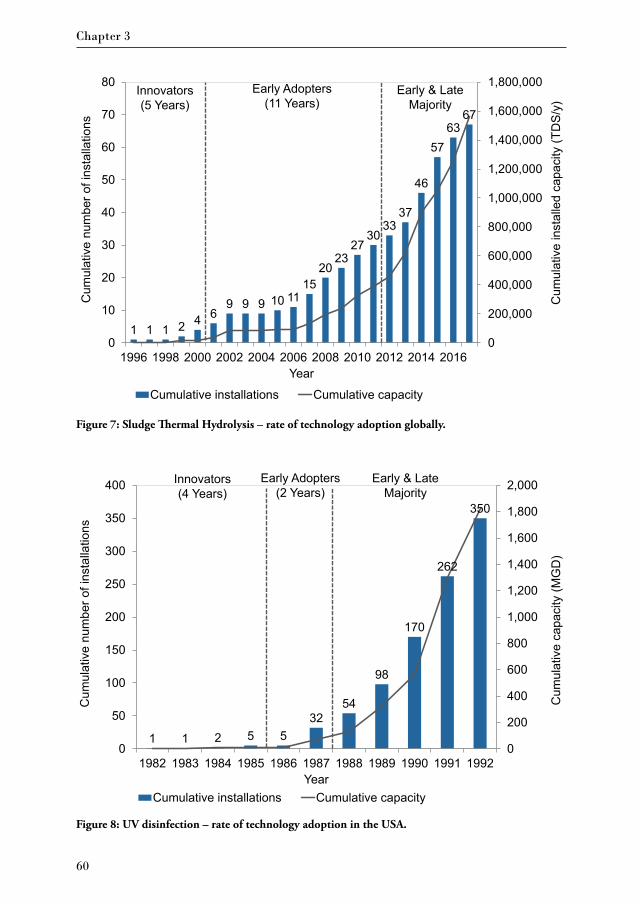
Chapter 3
60
1 1 1 2 4 69 9 9 10 11
1520
2327
3033
37
46
5763
67
0
200,000
400,000
600,000
800,000
1,000,000
1,200,000
1,400,000
1,600,000
1,800,000
0
10
20
30
40
50
60
70
80
1996 1998 2000 2002 2004 2006 2008 2010 2012 2014 2016
Cum
ulat
ive
inst
alle
d ca
paci
ty (T
DS/
y)
Cum
ulat
ive
num
ber o
f ins
talla
tions
Year
Cumulative installations Cumulative capacity
Innovators (5 Years)
Early & LateMajority
Early Adopters (11 Years)
Figure 7: Sludge Thermal Hydrolysis – rate of technology adoption globally.
1 1 2 5 532
54
98
170
262
350
0
200
400
600
800
1,000
1,200
1,400
1,600
1,800
2,000
0
50
100
150
200
250
300
350
400
1982 1983 1984 1985 1986 1987 1988 1989 1990 1991 1992
Cum
ulat
ive
capa
city
(MG
D)
Cum
ulat
ive
num
ber o
f ins
talla
tions
YearCumulative installations Cumulative capacity
Innovators (4 Years)
Early & LateMajority
Early Adopters (2 Years)
Figure 8: UV disinfection – rate of technology adoption in the USA.

Analysis of Factors Affecting Rates of Technology Adoption
61
Chap
ter
3
of digesters, increasing biogas yield, and reducing sludge volumes, rather than directly from a regulatory driver, such as to produce Class A Biosolids (Barber, 2016; Oosterhuis et al., 2014).
Ultraviolet Disinfection Drinking Water TreatmentThe UV data showed that it took four years to get five full-scale facilities up and running. In the next two years (1986 and 1987), it moved relatively quickly to over 30 operating full-scale plants. The rapid construction of new facilities from 1985 onwards (Figure 8) can be explained by the two main factors:
1. The scientific credibility of the demonstration installations backed up by Johnson & Qualls, 1984 and papers presented at the 56th Annual Conference of WPCF in Atlanta, Georgia Oct 3-7,1983 by Trojan.
2. The strong need in the Chesapeake Bay area (related to the toxicity levels of its harvested shellfish) (Pace et al., 1988).
It was also found that the pilot study at Tillsonburg, Ontario, as described in the above journal paper, was funded in part through a grant from the Canadian Federal Government through its Industrial Research Assistance Program (IRAP), which covered approximately 50% of the costs of the pilot project. UV technology was also a technology that could be added at the end of the existing treatment train, as an add-on technology, and it did not require any changes to the existing wastewater treatment infrastructure. This may have been an enabling factor that facilitated rapid adoption, coupled with the acute need.
OverviewFigure 9 presents the comparison of years at the Early Adopters stage and years at the Innovators stage for each of the technologies studied. The data indicated that the rate of movement across the Water Technology Adoption (WaTA) model varied significantly across the technologies studied.
During the course of the analysis, one thesis that was proposed to help differentiate between the different technologies was that in some cases there was an external driver that accelerated technology adoption, such as a new regulation, or an environmental or health issue. We have referred to these as Crisis / Need Driven Water Technology Market Adoption. In other cases, there was no such external driver or catalyst for adoption, but the technologies themselves had an inherent advantage over the existing technologies used, based on factors such as capital cost savings, operational cost savings, smaller footprint, and life-span of the technology. These will be referred to in this discussion as Value Driven Water Technology Market Adoption. Certain case studies contained a hybrid of these factors, such as SBR, where the technology had an advantage over incumbent
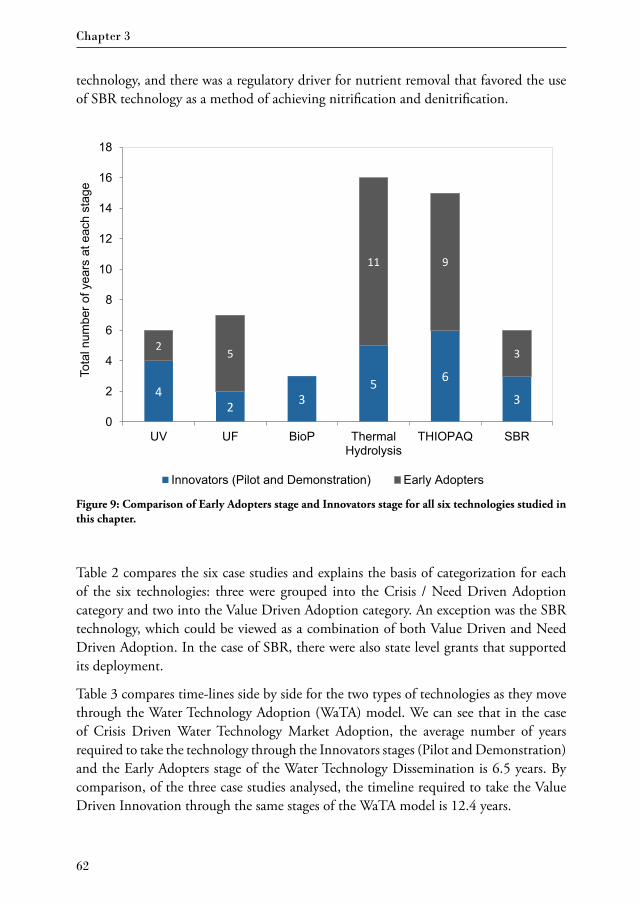
Chapter 3
62
technology, and there was a regulatory driver for nutrient removal that favored the use of SBR technology as a method of achieving nitrification and denitrification.
42 3
5 6
3
2 5
11 9
3
0
2
4
6
8
10
12
14
16
18
UV UF BioP ThermalHydrolysis
THIOPAQ SBR
Tota
l num
ber o
f yea
rs a
t eac
h st
age
Innovators (Pilot and Demonstration) Early Adopters
Figure 9: Comparison of Early Adopters stage and Innovators stage for all six technologies studied in this chapter.
Table 2 compares the six case studies and explains the basis of categorization for each of the six technologies: three were grouped into the Crisis / Need Driven Adoption category and two into the Value Driven Adoption category. An exception was the SBR technology, which could be viewed as a combination of both Value Driven and Need Driven Adoption. In the case of SBR, there were also state level grants that supported its deployment.
Table 3 compares time-lines side by side for the two types of technologies as they move through the Water Technology Adoption (WaTA) model. We can see that in the case of Crisis Driven Water Technology Market Adoption, the average number of years required to take the technology through the Innovators stages (Pilot and Demonstration) and the Early Adopters stage of the Water Technology Dissemination is 6.5 years. By comparison, of the three case studies analysed, the timeline required to take the Value Driven Innovation through the same stages of the WaTA model is 12.4 years.

Analysis of Factors Affecting Rates of Technology Adoption
63
Chap
ter
3
Table 2: Summary of six case studies
Innovation Crisis / Needs Driven Value Driven
Ultraviolet Wastewater Disinfection
Yes. Concerns regarding the toxicity of harvested shell-fish in the Chesapeake Bay linked to wastewater discharges led to a need to find an effective wastewater disinfection technology.
No. It was more expensive than chlorine disinfection when introduced.
Membrane Ultrafiltration for Drinking Water Treatment
Yes. A crisis relating to Cryptosporidium outbreaks in USA and UK led to legislation which created the need in the market.
No. It was more expensive than sand filtration when introduced.
Enhanced Biological Phosphorous Removal
Yes. Issues with deterioration in water quality as a result of eutrophication linked to phosphorus and the inability to use chemical dosing created the need and opportunity for Biological Phosphorus Removal.
No. It was higher CAPEX compared to chemical dosing, although it had a lower OPEX.
Sludge Thermal Hydrolysis
Partially. There was a requirement to produce Class A Biosolid in certain areas, and Thermal Hydrolysis does achieve this. However, this was not the primary driver for its deployment.
Yes. Sludge Thermal hydrolysis leads to increased biogas yields, increases in anaerobic digester capacity and improved sludge de-watering and produces a Class A sludge. These advantages created the basis for value driven technology adoption
THIOPAQ No Yes. THIOPAQ is a biological desulphurization process that removes sulphur compounds from biogas without the need to add chemicals and produces a value-add by-product leading to reduced operational costs.
Sequencing Batch Reactor (SBR)
Partially. There were regulatory drivers that required the removal of ammonia and total nitrogen in wastewaters and SBR was one method that this could be achieved.
Yes. An SBR eliminates the need for a secondary clarifier, leading to lower capital costs and a smaller footprint. SBR also can be used to achieve biological nutrient removal and regulations requiring nitrogen removal created a needs driver.
Table 3: Timelines comparison of the types of technologies as they move through the Water Technology Adoption (WaTA) model
Innovators(Pilot and Demonstration)
Early Adopters
Innovators + Early Adopters
Water Technology Adoption Model Average Timelines 5 to 8 6 to 8 11 to 16
Crisis / Needs Driven Adoption 3 3.5 6.5
Value Driven Adoption 4.7 7.7 12.4

Chapter 3
64
The timelines for movement from Innovators and Early Adopters for Value Driven Innovation, of 12.4 years are more in keeping with water industry normal timelines as outlined in the Water Technology Adoption (WaTA) model.
There is a risk for technologies that are Crisis / Needs Driven of being developed before the crisis or need driving adoption takes hold of the market. The author has observed companies developing a technology that was dependent on an external factor, such as implementation of a new piece of legislation, fail when this regulation was not adopted in the anticipated time-frame. One such scenario is the Swedish company, Ocean Saver, a company focused on the Ballast Water Treatment market. The delay in ratification of the International Maritime Organisation regulations meant that this market did not materialise, and the company ceased trading in 2017.
Many companies in the biosolids management space were anticipating that there would be a regulatory ban on the application of sewage sludge to land. MaxWest Environmental was developing a sludge gasification technology in 2008 to 2014 (Peric et al., 2012). It was competing with land application of biosolids as a lower cost alternative, and this was one factor that meant the market conditions were not ready to drive adoption of sludge gasification. The sludge pyrolysis and gasification, in particular, is somewhat of a grave-yard for failed companies, with examples including Enertech SlurryCarb process, MaxWest Gasification System, New Earth Inc. Torrefaction, ThermoEnergy Sludge to Oil Reactor System (STORS), and EnerSludge (O’Callaghan, 2009); all of them have now ceased operating.
It is interesting to consider what might have been the fate of these companies had such a regulatory ban come into effect while they were still developing these technologies. In many cases where the company fails, the intellectual property is handed on to another company and may exist in a latent state until the market conditions are favourable, or further work improves its efficiency and confers a value–driven competitive advantage. The author would posit that if a ban on the land application of sewage sludge were to come into effect that this would lead to success stories of technology adoption of sludge gasification and pyrolysis similar to the creation of UF Membrane Filtration and UF Disinfection technologies.
The three Crisis / Needs Driven innovations – UV Wastewater Disinfection, Biological Phosphorus Removal and UF Drinking Water Filtration – had a crisis or market need to accelerate adoption. The author is of the view that in the absence of a Cryptosporidium outbreak and subsequent legislative and government drivers, the adoption of UF membranes that was observed between 1995 and 2005 would not have occurred, and those companies that were active then, such as Norit X-flow, Zenon and Memcor, would not have succeeded. The technology may never have moved beyond the Innovators stage of the market had the catalyst not arisen that led the creation of a market demand,

Analysis of Factors Affecting Rates of Technology Adoption
65
Chap
ter
3
which in turn led to cost reductions and competition, and had the positive feedback loop of enabling more wide-spread adoption. UF technology succeeded initially in the Innovators and Early Adopters stages, by being specified due to legislative or government drivers and not as a result of financial incentives. A legislative driver was required to enable the diffusion of this disruptive technology.
Similarly, in the absence of the need to disinfect wastewater to reduce shellfish toxicity (Pace et al., 1988), the adoption of UV in wastewater disinfection that was seen in the period 1982 to 1992 would not have occurred with the same velocity. The company Trojan UV would likely not have been able to sustain itself for the next decade until the outbreak of Cryptosporidium accelerated its adoption in drinking water.
In the case of Biological Phosphorus Removal, unlike UF Membrane Drinking Water Filtration and UV Wastewater Disinfection, this was not a disruptive technology. BPR technology was an improvement to the biological treatment process and was not introduced by new entrants and start-up companies but by consulting engineering firms. It was not patented at the outset in South Africa and therefore, it could be designed by engineers who understood the design principles. Thus, the author believes that the main factor for the rapid rate of adoption of BPR was the acute need in South Africa at that time to remove phosphorous from wastewater to prevent eutrophication of surface water bodies.
In the case of the three value-driven case studies, the SBR was introduced by new entrants such as Austin BioJet and Sanitaire, through technology licensing, and as it was an improvement to the activated sludge process. Thermal Hydrolysis was introduced by a new entrant, CAMBI, a start-up company and THIOPAQ was introduced by an existing company, PAQUES. These technologies succeeded in the absence of a crisis, suggesting that if there is a clear value proposition, a crisis is not necessary to allow for the adoption of new innovative technologies.
4. Conclusion
In the water sector, the adoption of a water technology that is driven based on its value proposition takes in the region of 12.4 years to move through the Innovators and Early Adopters stages of the market and to reach Early and Late Majority.
In the case of a technology whose adoption is driven by a crisis or market need, such as a new piece of legislation, or an urgent health or environmental issue, the timeline can be half this, in the region of 6.5 years.
In the case of UF Membrane Drinking Water Filtration and UV Wastewater Disinfection, an external driver was required to enable the adoption of these disruptive technologies

Chapter 3
66
and both were introduced by new entrants to the market. It could be argued that it was the legislation / Crisis Driven need that was the disruptive driving force that led to these disruptive innovations being adopted, as opposed to the technologies themselves.
The case studies that can be mapped to being value driven innovations were introduced by existing companies as well as new entrants and did not require an external driver such as legislation to enable their adoption.
Financial incentive mechanisms assisted the first pilot UF system and the first full-scale SBR system in Tennessee. Apart from these two examples, the use of financial inventive mechanisms was not identified as being involved in the other case studies. The author posits that in the case of a Crisis / Need Driven innovation, that an external financial support mechanism is therefore not required to enable technology adoption and in the case of the value driven innovations it is likewise not required, as the technologies have inherent advantages, but in both cases financial support can help to accelerate the adoption rate.
It has been observed that success in Crisis /Need Driven innovation is often about being in the right place at the right time (Schlichte et al., 2019). In general, it can be concluded that we can conclude that Crisis /Need Driven innovation involves disruptive innovation offered by new entrants whereas with value driven innovation, it can be both existing companies as well as new entrants. Non-patented technologies and innovations can be introduced directly by consulting engineering firms without involving proprietary technology companies.
It is also observed that, in most cases, a technology that is adopted in order to meet a crisis or need in the market is more expensive at the outset than the alternatives at the outset. While the value driven adoption has a slower cycle for adoption, it presents lower risk as it is less dependent on external factors and timing of implementation of regulations or the occurrence of some public health related or environmental crisis.
Future work will analyse which technologies constitute a disruptive innovation and if there are ‘faux disruptive innovations’ which are adopted initially but fail to replace the incumbent technologies. Future research work will also analyse the rate of success in investment in water technology companies and how this compares to standard investment models.

Analysis of Factors Affecting Rates of Technology Adoption
67
Chap
ter
3

4

Chapter 4The Applicability of Innovation
Theories to the Water Sector

Chapter 4
70
1. Introduction
1.1. Why do we need innovation?Water supply crises have been identified as one of the top five global risks to society in each of the last seven years according to the World Economic Forum (WEF, 2019). Wehn & Montalvo’s review paper recognizes that innovation is required to address the mounting challenges with our current water systems (Wehn & Montalvo, 2018a). The authors classify these challenges into social, technological, economic, environmental, and political categories. It is the combination of these factors that prevents continuous innovation of water management practices, especially in developing countries.
The High Level Panel on Water, established by the UN Secretary General and President of the World Bank Group, called for “a fundamental shift in the way the world looks at water” (High Level Panel on Water (HLPW), 2016). In Europe, the urgent need for water innovation is being addressed by initiatives such as the Horizon 2020 program for research, development and innovation activities, LIFE 2014-2020 which focuses on funding for environment and climate action, and grants from the European Research Council for individual researchers to undertake basic research (Wehn & Montalvo, 2018a). Yet the water sector has been reported to be less innovative than other sectors, such as the energy sector, when measured by indicators such as the amount of investment funding attracted by research and development for example (Ipektsidis et al., 2016). The author of this chapter would like to argue that the real issue is not so much the extent of research and development efforts, but the rate of diffusion of technologies and adoption of innovation.
It is well accepted and documented in the literature that mounting pressures globally are affecting both availability of water supply and water quality (Wehn & Montalvo, 2018b). These pressures, which include rapidly increasing global population, urbanisation, climate change, deteriorating water quality and ageing infrastructure, are putting increased demand on water resources. In parallel with increases in population, nations are lifting themselves out of extreme poverty and entering Levels 2, 3 and 4 of the economic pyramid (Rosling et al., 2018). However, as a country becomes wealthier and its Gross Domestic Product (GDP) increases, the personal use of water and the virtual use of water also increase through increased consumption of goods, which all require water as a fundamental input to the manufacturing process. It is estimated that 20% of all human consumptive water use is related to industrial consumption (Kwok et al., 2010).
Moreover, urbanisation is also leading to more people living in cities, and requires water and sanitation services to support this shift. Despite investment in the provision of sanitation, it is difficult for nations to keep pace with the rate of migration of populations to cities. According to WHO/ UNICEF: Joint Monitoring Program reporting, which

The Applicability of Innovation Theories to the Water Sector
71
Chap
ter
4
is the leading source for Water Sanitation and Health (WASH) data to track progress against SDG6 goals, the percent of the population with sewer coverage in sub-Saharan Africa urban areas has declined from 13% in 2000 to 11% in 2015 (WHO & UNICEF, 2017).
Today, more than 2.1 billion people do not have access to clean drinking water, and of the 4.4 billion that lack safely managed sanitation, 2.3 billion do not have basic sanitation facilities (WHO, 2017). The costs associated with a lack of access to water and sanitation place a burden on those who can least afford it (Damon & White, 2018). The challenges are not confined to the developing world or poorer economies. In the United States, deteriorating water quality in shrinking cities such as Flint, Michigan (Zahran et al., 2018; Roy & Edwards, 2019) where water supplies had elevated levels of lead are leading to a crisis in confidence in public water supplies. Similar water quality issues have been reported in cities such as Kentucky (Food and Water Watch (FWW), 2018) and Newark (NRDC, 2019). Environmental watchdog groups such as Environmental Working Group (EWG) are continually reporting on the inadequate level of regulation and compliance monitoring of drinking water quality in the United States (Environmental Working Group (EWG), 2019). By some estimates, in Southern California, 80% of the public does not drink the tap water (Pontius et al., 2003). In addition, the cost of repairing ageing water infrastructure in the United States of America (USA) is estimated by the American Water Works Association to be $1 trillion over the next 25 years. The American Society of Civil Engineers report card gives Drinking Water a Grade D, reporting that 6 billion metres cubed of treated water are lost every day, while wastewater infrastructure receives a D+ Grade (Buckley et al., 2016; Infrastructure Report Card (IRC), 2017a&b). These issues represent a crisis, but also an economic opportunity. In 2018, the global water sector is estimated to be worth USD 770 billion (Water Desalination Report (WDR), 2018). By 2025, it is predicted that this sector will be worth 1 trillion USD per year (RobeccoSAM, 2015).
Availability of affordable, circular and efficient technology to ensure economic and sustainable viability of wastewater for domestic and industrial purposes is still limited (Yenkie, 2019; Castillo et al., 2017; Piao et al., 2016; Plappally et al., 2012; OECD, 2017). The transportation, collection and treatment of water and wastewater uses approximately three percent of all the electrical energy produced in the United States. Due to rising climate change pressures and tightening environmental legislation on wastewater effluents, there has been an increased urgency to develop efficient and sustainable water treatment technologies to treat organic and inorganic pollutants from wastewater prior to discharging into the environment (Lee et al., 2009; Bradford-Hartke et al., 2015; Adapa et al., 2016). Activated sludge treatment plants, for example, provide hygenic water but do not remove and recover nitrogen, phosphorous, micronutrients or trace metals. Zinc is one such trace metal and an essential element whose significance

Chapter 4
72
to health is increasingly appreciated and whose deficiency is affecting nearly two billion people in the developing countries (Prasad, 2003; Hambidge and Krebs, 2007). Innovation in the water sector is required to balance constantly changing human and environmental needs as well as evolving water treatment systems that must adapt to existing institutions and practices (Daigger et al., 2019). Therefore, existing technologies are not sufficient to meet the needs of the current and future generation with regards to water challenges.
1.2. The rate of innovation adoption in water is slow The rate of innovation and technology uptake in the water sector is often reported as being relatively slow compared with other sectors due to the conservative nature of the industry (Thomas and Ford, 2005; Wehn & Montalvo, 2018a). The term ‘water innovation’ appeared for the first time in the published academic literature in 2004. This term was seen in the title of publication, which referred to water innovation in water resources management in Australia (Barripp et al., 2004; Bowmer, 2004).
Each year millions of euros are invested globally in water technology research and development. However, much of this research does not go on to be commercialized and developed into products and technologies. A study in the Netherlands showed that out of 1,000 water technology companies in the country, only 35% reported investing in research & development (NWP, 2018). Large water companies also invest in internal research and development. Suez reports that it invests over €74M ($87M) in more than 65 research programs each year. This includes not only water related research but all research in areas such as waste management. Against revenues of $19.8B in 2018, the reported figure of €74M ($87M) invested in R&D represents 0.39% of top line revenue. This is a relatively small percentage and it should be put into context by noting that Suez generates a considerable portion of group revenue, not from technologies but from operational contracts. Suez also established Suez Ventures in 2010 with the goal of investing €50M into early stage technology companies (Suez, 2020). Another water technology company, Xylem, reports that it incurred $189M, $181M and $110M in R&D expenditure in 2018, 2017 and 2016, respectively. This is against total revenues of $5.2B in 2018 and $4.7B in 2017, indicating that investment in R&D was 3.63% and 3.85% respectively (Xylem, 2019). Evoqua reported incurred $15.8M and $19.9M of Research and Development expenditure against total revenues of $1.34B and $1.25M in 2018 and 2017 respectively, representing 1.17% and 1.6% of total turnover invested into R&D (Evoqua, 2018). A Japanese water solutions company, Kurita, reported in 2018 that it invested Yen 5.3B in R&D Expenses ($48M), against total net sales of Yen 236.8B ($2.16B), representing 2.25% of total sales. Much of the research work within larger companies does not make its way into the market. There are hundreds of water technology start-ups at any given point in time working to introduce new technologies to the market. However, only a small percentage of these companies will succeed.

The Applicability of Innovation Theories to the Water Sector
73
Chap
ter
4
Despite a clear need for innovation to address water challenges, it is also widely acknowledged that adoption and dissemination of new water technologies and policies are slow. A previous paper by O’Callaghan and co-authors which presented a Water Technology Adoption (WaTA) Model, noted that the adoption of a water technology was found to take in the region 12 to 14 years to move through Innovators and Early Adopters stages of the market and reach the Early and Late Majority (O’Callaghan et al., 2018).
Ten years after the introduction of Ultraviolet disinfection technology for wastewater treatment in the United States, the total number of full-scale reference plants was 350 installations (O’Callaghan et al., 2018). To put this into context, there are a total of 16,000 wastewater treatment plants in the United States (EPA, 2017). Similarly, 10 years after the introduction of ultrafiltration for drinking water treatment in the United States, the total number of installations was 80 full-scale drinking water treatment plants.
The distribution of the wastewater treatment plants (WWTPs), in terms of the number that fall into different capacity ranges versus population served, is illustrated in Figure 1. It shows that a large percentage of the population is served by a small number of very large wastewater treatment plants, while a large number of small WWTPs serve a relatively small percentage of the total population. This illustrates that it is difficult to have market impact in terms of the total numbers of plants, without having a technology adopted in a large number of relatively small WWTPs. Conversely, it is difficult to have impact in terms of population served, without having the technology installed at a relatively small number of very large WWTPs.
The number of mid-sized to large-scale WWTPs, serving populations of greater 10,000 PE up to 100,000 PE is 2,737 WWTPs. Based on Figure 1, the market penetration, 10 years following introduction of UV Wastewater Disinfection, by which stage the technology had entered the early majority section of the market, was 13% (350 total number of full-scale UV installation plants as quoted above). It must be noted that only a sub-set of all wastewater treatment plants employ UV disinfection technology even today, as it is dependent on whether the discharge consent requires disinfection.
The general point that can be taken from these two examples is that ten years following technology introduction, by which time the technologies were entering the early majority section of the Water Technology Adoption curve, the impact on the market is limited as measured by the average number of people served per WWTP.
The author suggests that this is a function of several factors including:
• The variable treatment capacities and size distribution of the asset base as illustrated in Figure 1.

Chapter 4
74
• The life span and replacement cycle of the installed asset base which can be 10-15 years for the mechanical and electrical equipment, and over 25 years for civil and structural elements such as tanks.
• The length of the engineering design, public tendering and procurement cycle, which can take several years from initiation to project completion.
• The varying local regulatory environment that requires different levels of treatment.
On the other hand, smart phones took less than 10 years to accomplish 40% penetration rate (McGrath, 2013). The water sector offers many opportunities to innovate and deploy new technologies, but in practice this sector has barely tapped the potential those technologies actually offer (Ajami et al., 2014).
Technology is one area where innovation delivers value, but there is equally a need for innovation in water policy. This includes the development of new regulations that will create the space for water innovation, the creation of new finance models, such as those created by Water.org (Damon & White, 2018), and new financial mechanisms and business models, as well as innovation in terms of how the value of water is communicated to the public. Regulatory gaps and misdirected policies slow down the adoption of innovative technologies. The provision of water services is at an exciting yet challenging point, because traditional approaches are being questioned and a combination of new and old technologies are emerging on to the market.
Figure 1: Comparison of number and percentage of population served in different wastewater treat-ment plants’ capacity size range.

The Applicability of Innovation Theories to the Water Sector
75
Chap
ter
4
1.3. There is a lack of clear terminology, which hampers research into the innova-tion process
Many authors have developed frameworks to assess the broader category of disruptive innovations and to forecast their market diffusion (Linton, 2002; Hang et al., 2011; Sood and Tellis, 2011). For example, Guo and his co-authors proposed a framework of assessing disruptive innovations based on three multidimensional factors: technological features, marketplace dynamics and external environment (Guo et al., 2019).
The subject of water technology innovation and diffusion is not well understood or studied to date. There are far fewer water innovation studies compared to research into innovation in general, which offers close to four million scholarly titles (Wehn & Montalvo, 2018a). Amongst those few water-related innovation studies, there is even more of a striking absence of academic studies on the dynamics of water innovation or existing insights about models of, and approaches for, studying innovation (Wehn & Montalvo, 2018a). In response to this, the author of this chapter along with his coworkers published a Water Technology Adoption (WaTA) model that presents the average timelines taken for the diffusion of water technology and the innovation drivers that can affect the rate of technology diffusion (O’Callaghan et al., 2018 & 2019).
One of the major problems is that clear innovation terminology in the water sector is urgently required. The term “innovation” in the water sector, and particularly “disruptive innovation”, is often over-used and misused to the point that it has lost its meaning. The need to define “disruptive innovation” has been noted more generally by others. One paper notes that to facilitate an academic discussion in the business community, a clear definition of disruptive innovation is required; otherwise the term will create confusion and become just a “buzz word” (Nagy et al. 2016; Tellis, 2006). A stipulated definition is needed, giving the term a specific meaning for a specific argument or purpose so that it can be used in the right context. This need has been recognized by many business scholars as being necessary to facilitate meaningful use of this concept (Markides, 2006; Schmidt & Druehl, 2008).
The term disruptive innovation was first launched into the mainstream consciousness of the business world with the publication of a series of seminal papers by Bower and Christensen (Bower and Christensen, 1995; Christensen and Bower, 1996; Christensen, 1997). Since then, this term has gained widespread use, but is also widely misunderstood. The over-use of the term disruptive innovation has reached a point where it has become a synonym for any new ‘threatening’ substitute to an incumbent technology or substantial on-going change, and there is under-use of the term disruptive innovation as a theoretical concept.
Christensen also states that when core ideas of prior works are obscured by indiscriminate use of its terminology, researchers will face difficulty building on and extending that work. He cites widespread invocation of disruption-related terminology in academic

Chapter 4
76
journals, practitioner-oriented publications, and books in multiple disciplines. His papers are an effort to re-invigorate academic interest and spur exciting new research on disruptive innovation in management by providing a review of previous work and suggesting new avenues for research (Christensen et al., 2001 & 2008).
Searching for the prevalence of the terms “disruptive technologies”, “disruptive technology” or “disruptive innovation”, the review found that between 1993 and 2016, there were 133 academic articles in management journals and 66,773 articles in general-interest outlets (Christensen et al., 2018). This analysis found that, following the publication of three foundational works in the area (Bower and Christensen, 1995; Christensen and Bower, 1996; Christensen, 1997), there was a sustained upward trend of academic articles that cited this foundational research in the area of Disruptive Innovation Theory. The analysis found that while the level of citations had tapered off during the last decade, when it came to popular press articles mentioning disruptive terminology the pattern was different – there was a relatively slow increase, followed by a steep and sustained rise in its use.
This supports our thesis that there has been a divergence from the theoretical framework and concepts captured in the foundational work, and the general use of the terms relative to disruptive innovation.
It has been documented that in the period 2014 to 2016 there has been an increase in general engagement with the theories of innovation, but the overall number of publications on water innovation specifically, was limited to less than 55 papers per year, with these papers addressing topics such as frugal innovation, business models service innovation and analysis of the adoption and diffusion of water innovations (Wehn and Montalvo, 2018a). Wehn and Montalvo have noted that water researchers have been slow to embrace this discourse around water innovation. This was the catalyst for a special edition of the Journal of Cleaner Production (JCP) entitled The Dynamics of Water Innovation which provided a very comprehensive review.
Despite the lack of academic papers studying innovation theory as it pertains to water, the term ‘water innovation’ is becoming increasingly widespread and is increasingly an area of interest for investors, water end-users, water utilities and research institutes.
Venture capital investors constantly seek innovative water companies to invest in. In addition to many specialist venture capital and private equity funds, such as XPV Water Partners, True North Venture Partners, SKIon, and Emerald Technology Ventures, which have an active focus on the water sector, there are large number of corporate investors and family offices looking to invest in the water sector. Universities and research institutes are encouraged to develop innovative technologies. In 2017, the UK Water Utility regulator, OFWAT, called on water utilities to become more innovative in its Pricing Review 19 (PR19) business plans (OFWAT, 2017).

The Applicability of Innovation Theories to the Water Sector
77
Chap
ter
4
The author analysed data on investments in water for the period 2008 to 2018, based on BlueTech Research Innovation Tracker data, and identified 158 investors which had invested into early stage water technologies, representing investments into 320 unique water technology start-up companies. This is by no means an exhaustive list, as there is no way to analyse and identify all water investments, but nevertheless it does serve to highlight the level of activity.
This chapter aims to address this problem of slow adoption of water innovation technologies by first providing a review of the two common innovation theories: Disruptive Innovation Theory and Innovation Diffusion Theory, and then discussing their applicability to water technologies.
2. Critical review of two different innovation theories
2.1. A review of Disruptive Innovation TheoryThe best known and most widely studied and cited theory of innovation is Disruptive Innovation Theory, as developed by Clayton Christensen (Christensen et al., 2015; Christensen et al., 2018; Markides, 2006). In this theory, Christensen described two types of disruptive innovations: a market creating innovation and a low-end disruptive innovation.
Market Creating InnovationMarket creating innovations are those that lead to the creation of new markets (Christensen et al., 2019a&b). By definition then, these are not market taking, meaning that they do not rely solely on capturing market share from existing products in order to create value. These innovations can be categorized as introducing a solution to a problem that has either not been recognized before or has not yet been solved. Market creating innovations develop a new class of customers or a new market.
A good illustrative example of a market creating innovation is the iPhone, which integrated features from a range of existing electronics and packaged them into one device. Technologies were assimilated from mobile phones, computers, cameras, music players and video player and integrated into one hand-held device that could be sold in both the developed and the developing world.
Another example of a market creating innovation that is often cited is the Ford Model T. Ford did not invent the automobile, but with the innovation of the manufacturing line, which made it affordable, the company created a market for a technology that prior to this had been only accessible to the wealthy (Ojomo, 2015; Christensen et al., 2019a). These market-creating innovations are said to often solve unrecognized, or unsolved problems for customers.

Chapter 4
78
Low-end Disruptive InnovationA low-end disruptive innovation is defined as an innovation that provides a low-cost service or product to customers who are happy with a ‘good enough’ product (Christensen et al., 2006; Christensen, Bohmer, & Kenagy, 2000; Paap & Katz, 2004; Thomond & Lettice, 2002). A typical low-end disruptive innovation takes advantage of markets in which existing products offer more performance than many customers either want or need. By offering lower functionality at lower cost, they compete for market share in a segment that the incumbents are less interested in pursuing.
By contrast, there is an opposite general trend in Sustaining Innovation, in that incumbents continue to improve and add more functionality to their existing products, sometimes exceeding the needs of particular segments of the market. The conundrum described in the Innovator’s Dilemma (Christensen, 1997) is that large incumbent players find it difficult to introduce a lower cost, lower functionality version of what they already provide to capture the lower end of the market which is often deemed to be less profitable, or not large enough to be significant. Over time, Disruptive Innovation Theory describes how low-end innovations can eventually evolve to the point where they compete with incumbents for the higher end of the market, thereby disrupting that market and replacing the incumbent technology (Bower and Christensen, 1995). Recent critiques from business scholars of this theory note that defining disruptive innovations as lower quality products that compete on price would not appear to be an innovation characteristic (Nagy et al., 2016; Besanko et al., 1996).
This definition of low-end disruptive innovation focuses on a business strategy and market entry and overlooks the innovation characteristics. Price is influenced by a variety of factors including the raw material cost base, market competition and the level of cost and profit across the value chain. Low-end disruption is therefore a business strategy to commercialize an innovation as opposed to an innate innovation characteristic. For example, if we take the low-end examples of disruptive innovations, driven by market factors like lower price, the author finds that price is a business strategy, rather than a characteristic of the innovation (Danneels, 2004).
Disruptive Innovation Theory, as defined by the foundational works of Christensen, while seminal and extremely valuable, is a narrow theoretical construct (Markides, 2006) snd is limited in its use to analyse and to study early stage water innovations.
Limitations of Disruptive Innovation TheoryMeasuring disruptivity is only possible retrospectively, in that it can only be measured with the benefit of hindsight, based on an effect on the market. It is therefore a function of business strategy, as opposed to an innovation characteristic. The author also proposes that low-end innovation is not widely applicable, thereby not relevant in a regulated market such as water. In the water sector that is mostly driven by regulation, there is

The Applicability of Innovation Theories to the Water Sector
79
Chap
ter
4
very little opportunity for ‘low-end innovation’. In terms of treating drinking water or wastewater, there is a set standard that has to be met and ‘good enough’ is not relevant: the technology is either compliant or it is not compliant. There is a binary aspect to the performance requirements. This is unfortunate for the billions of people who lack access to water and sanitation, who would welcome any level of improvement, even if it were not at the same level or provided in the same way as those in the developed world. This makes the problem of providing water services in the developing world extremely challenging, if we try to bring people from zero level of access to full access, by relying on local government to provide centralized water and sanitation services compliant with WHO standards. This is an area where a market creating innovation would help to unlock demand, meet an unmet need and solve an unsolved problem.
Moreover, a technology can ‘disrupt a market’ by taking market share from one player, and not fit the academic definition of a “disruptive innovation.” Christensen in a recent review article notes that there is overuse of disruptive innovation/disruption as a synonym for any new threat (or substantial ongoing change) and underuse of disruptive innovation as a theoretical concept. Specifically, he notes that ‘Many popular writers invoke disruptive innovation to describe any new technology or startup that aims to shake up an industry and alter its competitive patterns’ (Christensen at al., 2018). To analyse this usage, Christensen carried out an extensive analysis of the appearance of terms related to Disruptive Innovation Theory in academic articles, management articles and popular press that either cited foundational work or used disruption terminology in the period 1993 to 2016. The results suggest an overly broad application of the terms disruption/disruptive innovation (Christensen et al., 2018).
This is further reaffirmed and discussed in detail by Delmer Nagy and coworkers (Nagy et al., 2016). They note that the problem with the overuse of the term is that if academics in the business community wish to seek ownership of the idea of ‘disruptive innovation’ they need to offer a clear definition of the term. They note that without clear definition academics and practitioners are left with an extracted definition based on common usage. Therefore, a definition for disruptive innovation that is grounded in the innovation itself is needed. For the purposes of studying and classifying water innovation, particularly at the early technology readiness levels and stages of technology adoption (Innovator to Early Adopter stages), the author proposes that Disruptive Innovation Theory is not a practical framework as it is not grounded in a property of the innovation.
2.2. A review of Innovation Diffusion Theory In terms of defining innovation, while the most popular and well-known construct is Disruptive Innovation Theory, the author proposes that Innovation Diffusion Theory (IDT) (Rogers, 1995), which focuses on five attributes that affect innovation adoption, is a valuable alternative and practical model to apply when studying early stage water
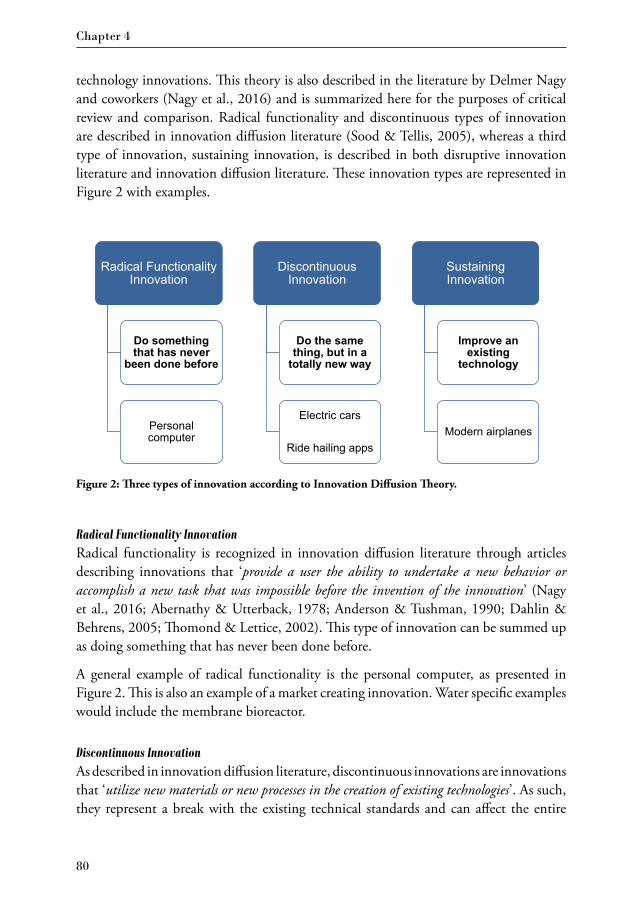
Chapter 4
80
technology innovations. This theory is also described in the literature by Delmer Nagy and coworkers (Nagy et al., 2016) and is summarized here for the purposes of critical review and comparison. Radical functionality and discontinuous types of innovation are described in innovation diffusion literature (Sood & Tellis, 2005), whereas a third type of innovation, sustaining innovation, is described in both disruptive innovation literature and innovation diffusion literature. These innovation types are represented in Figure 2 with examples.
Figure 2: Three types of innovation according to Innovation Diffusion Theory.
Radical Functionality Innovation
Do something that has never
been done before
Personal computer
Discontinuous Innovation
Do the same thing, but in a
totally new way
Electric cars
Ride hailing apps
Sustaining Innovation
Improve an existing
technology
Modern airplanes
Radical Functionality InnovationRadical functionality is recognized in innovation diffusion literature through articles describing innovations that ‘provide a user the ability to undertake a new behavior or accomplish a new task that was impossible before the invention of the innovation’ (Nagy et al., 2016; Abernathy & Utterback, 1978; Anderson & Tushman, 1990; Dahlin & Behrens, 2005; Thomond & Lettice, 2002). This type of innovation can be summed up as doing something that has never been done before.
A general example of radical functionality is the personal computer, as presented in Figure 2. This is also an example of a market creating innovation. Water specific examples would include the membrane bioreactor.
Discontinuous InnovationAs described in innovation diffusion literature, discontinuous innovations are innovations that ‘utilize new materials or new processes in the creation of existing technologies’. As such, they represent a break with the existing technical standards and can affect the entire

The Applicability of Innovation Theories to the Water Sector
81
Chap
ter
4
value chain as a result (Nagy et al., 2016). This type of innovation could be summed up as doing something that is already being done, but in a totally new way. Discontinuous technical standards are recognized as having the potential to change markets in innovation diffusion literature (Dewar & Dutton, 1986).
General examples of discontinuous innovation include electric cars, as presented in Figure 2. The basic functionality is the same as an automobile powered by an internal combustion engine, but the value chain is different as it utilizes a different drive train and batteries to store the energy.
Sustaining InnovationSustaining innovation or incremental innovation does not provide radical functionality and ‘does not represent a break with an existing technical standard and is not market creating’ (Nagy et al., 2016). Sustaining innovation is continual innovation, which develops existing technologies and products. The majority of product and service innovations represent sustaining innovation because they meet the needs of existing customers by representing an improvement to an existing technology, process or service.
General examples of sustaining innovation would include modern airplanes, as shown in Figure 2. They increased the number of passengers who could be carried on a passenger airplane, providing better performance than was previously available, but did not create new value or new markets.
3. Assessment of the applicability of innovation diffusion theory as a framework to study water technology innovation
From the Innovation Diffusion Theory, the author proposes that the following innovation types are useful in that they represent a property of the innovation and can be defined and applied. To summarise:
1. Radical Functionality Innovation is something that has never been done before, as they ‘provide a user the ability to undertake a new behavior or accomplish a new task that was impossible before the invention of the innovation’ (Nagy et al., 2016).
2. Discontinuous Innovation ‘utilize[s] new materials or new processes in the creation of existing technologies’ (Nagy et al., 2016), meaning that they do the same thing, but in a totally new way.
3. Sustaining Innovation improves an existing technology and ‘does not represent a break with an existing technical standard and is not market creating’ (Nagy et al., 2016).
For researchers, investors, end-users and technologists engaged in the process of bringing innovations to market, it is more useful to have a construct and framework that is

Chapter 4
82
grounded in characteristics of the innovation itself (Nagy et al., 2016). This differentiates innovation typology from business strategy. For example, a business strategy can be to compete on price, which is not an innovation characteristic. In this section, we take the three types of innovation described previously and attempt to apply this to the classification of water technology examples, as shown in Figure 3.
Figure 3: Examples of water technology innovation according to Innovation Diffusion Theory.
Radical Functionality
UV amalgam lamp disinfection
Upflow anaerobic sludge
blanket
Polymeric hollow-fibre membranes
Discontinuous
UV LED water disinfection
Membrane aerated biofilm
reactor
Ceramic membranes
Sustaining
Medium pressure UV
amalgam lamp
Granular activated sludge
TFC reverse osmosis
membranes
Radical Functionality InnovationWater specific examples of radical functionality include UV amalgam lamp disinfection, upflow anaerobic sludge blanket (UASB) and polymeric hollow-fibre membranes, as described in Table 1.
Discontinuous InnovationWater specific examples of discontinuous innovation include UV LED water disinfection, membrane aerated biofilm reactor (MABR), ceramic membrane filtration, UASB reactors, and bio-electrochemical treatment. Some of these are described in Table 2.
Sustaining InnovationWater-specific examples of sustaining innovation include medium pressure UV amalgam lamp, granular activated sludge, TFC reverse osmosis membranes, as described in Table 3.

The Applicability of Innovation Theories to the Water Sector
83
Chap
ter
4
4. Discussion
In the public utility water sector, there is very little room for low-end innovation, as water is a regulated market. On the contrary, market-creating innovations are often driven by regulation. Examples of market creating innovations include UF drinking water filtration and UV wastewater disinfection (O’Callaghan et al., 2019). While these innovations addressed unsolved problems, it must be noted that regulation and policy played a key role in encouraging the market to adopt these solutions.
Table 1: Radical functionality technologies
Name of water technology Reasons for classifying as radical functionality
UV amalgam lamp disinfection UV light provided a means of inactivating Cryptosporidium oocysts which were resistant to chlorine disinfection. The use of the germicidal effect of UV light also provided a means to disinfect water without the need to add chemical disinfectants, and eliminated the formation of disinfection by-products.
Upflow anaerobic sludge blanket (UASB) The UASB technology provided a low energy and lower sludge generating technology when compared to aerobic biological and lower footprint and higher rate, when compared to existing anaerobic biological treatment systems. As such this innovation provided radical functionality and was driven by the need to treat high organic strength industrial wastewater.
Polymeric hollow-fibre membranes The use of hollow fibre polymeric membrane filtration provided a means to provide an absolute filtration cut-off point in the terms of the size of particles that were excluded, which was not possible to achieve with conventional depth media filtration.
Table 2: Discontinuous innovation technologies
Name of water technology Reasons for classifying as a discontinuous innovation
UV LED water disinfection A UV LED, when it replaces a UV mercury amalgam lamp for the disinfection of drinking water or wastewater, is discontinuous. It provides the same service as a UV Mercury amalgam lamp, but it does so using entirely different components. It eliminates the use of a ballast, or power system to excite mercury in a conventional UV lamp.
Membrane aerated biofilm reactor (MABR)
A membrane aerated biofilm reactor provides a mechanism to meet the oxygen demand of bacteria without the use of fine bubble diffusers combined with air blowers.
Ceramic membranes Ceramic membranes provide the same level of filtration as hollow fibre polymeric ultrafiltration membranes, but they do so using a completely different technical standard and manufacturing process. The materials used and the form factor are a break with the existing technical standard.

Chapter 4
84
This type of innovation is the exact opposite of Christensen’s definition of disruptive innovation because of its complexity, and because it starts at the top of the market and never makes its way down. For example, in the case of UF membrane filtration for drinking water treatment, it was more expensive to begin with than granular depth media filtration and did not start in simple applications at the bottom of the market. Subsequently costs have come down to parity with depth media filtration and today, in China in particular, UF membrane filtration is the dominant technology used at new drinking water treatment plants (Pearce, 2019a).
Membrane bioreactor technology is a radical functionality innovation technology that was at pilot stage in the mid 1990’s (O’Callaghan et al., 2018) and today there are over 1,000 plants in operation in over 40 countries representing an annual market value of over $1.6 billion per year (https://www.thembrsite.com/interactive-map-history-of-municipal-mbr-installations). MBR technology was not a low-end innovation. It provided better final treated effluent quality, occupied a smaller footprint and was more expensive than conventional alternatives. It did fill an un-met need in the market, where high effluent quality was required on sites constrained by footprint. On the other hand, variable frequency drive (VFD) is an example of sustaining innovation as it improves
Table 3: Sustaining innovation technologies
Name of water technology Reasons for classifying as sustaining innovation
Medium pressure UV amalgam lamp Industrial medium pressure UV lamp systems followed the development of low pressure UV lamps and can output approximately 10 times more energy per lamp than low pressure UV lamps. This provides greater disinfection capacity within a single UV vessel, without the addition of numerous lamps to achieve a high level of disinfection, as required with low-pressure systems. The energy efficiency of medium pressure lamps is lower and if a higher energy output is not required, low-pressure lamps are favored.
Granular activated sludge The granular activated sludge process is a variation and adaptation of the conventional activated sludge process, which selects for compact dense granules held together by extra cellular polysaccharides (EPS), has inherent advantages over the conventional processes, but these all fall into the category of sustaining innovation. The value chain remains unchanged. The functionality provided in terms of final treated wastewater effluent quality, is similar to the conventional wastewater treatment process.
TFC reverse osmosis membranes In the late 1970s, thin film composite membrane chemistries were developed that subsequently replaced cellulose acetate as the dominant membrane chemistry used in reverse osmosis seawater desalination. The change in chemistry was handled by existing companies using existing manufacturing techniques.

The Applicability of Innovation Theories to the Water Sector
85
Chap
ter
4
energy efficiency in wastewater treatment plants by changing the way in which airflow into aeration basins is controlled (Maktabifard et al., 2018). Thiopaq process instead of caustic gas washers for biogas desulphurization is another example of sustaining innovation.
It is important to divorce the theoretical concept of “Disruptive Innovation” from the phenomenon of “Market Disruption”, the latter being of high interest to business academics and stakeholders in the water innovation value chain. The particular type of innovation described as “Disruptive innovation” is not the sine qua non for market disruption, with many different types of innovation capable of leading to a disruption in the market (Paap & Katz, 2004; Danneels, 2004; Schmidt & Druehl, 2008; Sood & Tellis, 2011; Ronny & Sebastian, 2015).
An important question is: Can disruptive innovations be predicted before a disruption has occurred, and are these linked to certain types of innovation? In order to make any attempt to answer this, it first needs to be defined (Danneels, 2004). For this, the following questions need be answered: What constitutes a disruption in the water market? How can this be quantified or measured? If a new technology achieves 10% market share, is this disruptive? Are the total numbers of reference sites or the global distribution and adoption important heuristics to measure? Does a new technology need to lead to the replacement of some companies and the establishment of new ones in order to be considered disruptive? This chapter and subsequent work by the author and his coworkers will attempt to address these questions.
If the metric is that a new technology completely replaces an existing technology, then there are very few examples in the water sector of where this has occurred. One possible explanation for this lack of market disruption may be the fragmented nature of the global water market. It is widely recognized and accepted that the municipal water market is highly fragmented. In the United States there are 14,376 wastewater treatment plants active (EPA, 2012) that represent the customer base, the regulations and standards vary from State to State, and from country to country, and there are multiple companies offering multiple solutions, all-capable of doing the same job. Technology adoption in the water sector is also relatively slow because replacement rates can stretch to 30-50 years for existing installations. Compare this to the smart phones market where the technology is replaced every 3-5 years. Growth in the water industry depends solely on growth of population and new regulation; therefore, it is unlikely to unlock non-consumption.
Paap & Katz investigated the relation between technology and disruptivity and concluded that technology creates change in processes, materials, functionality or the utility of a product or service, and does not directly lead to a return. Predicting the future is difficult but anticipating change and preparing for it by focusing on the drivers

Chapter 4
86
of the technology is one way to recognize new technologies that may cause disruption (Paap & Katz, 2004).
The search for technology disruption can also be myopic at times, hyper-focused on individual technologies, which represent just one small part of an overall larger picture. If we take the example of fixed line telephony being disrupted by cell phones as an analog, should we really be looking for systems level disruptions in water as opposed to smaller technology changes within the current paradigm? The market creating innovations that can unlock markets may use a combination of both new and existing technologies, combined in new ways.
Sustaining innovation either helps existing companies retain market share, or claw some of it away from others, but this type of innovation does not unlock non-consumption or create new markets. So, it has limited potential to create growth (Christensen, 2019b). Discontinuous innovation and radical functionality all create a market for themselves, but the question remains whether they do it at the expense of someone else or do they unlock non-consumption? Radical functionality innovations fit with the Clayton Christensen definition of market creating innovation, which is one aspect of disruptive innovation. However radical functionality alone is not enough to create a new market. Dewar & Dutton, Maidique & Zirger and many others have given examples of radical innovations that never succeeded in the marketplace (Nagy et al. 2016, Dewar & Dutton 1986, Maidique & Zirger, 1984). In addition to this, Paap & Katz confirm that disruptions are not only caused by the technologies associated with major innovation but rather are often a function of actions and inactions by dominant competitors in the marketplace (Paap & Katz, 2004). Danneels defines disruptive technologies as ‘a technology that changes the bases of competition by changing the performance metrics along which firms compete’. He introduces a dimension of performance metrics along which products did not compete previously into this discussion with the example of disk drives where drive capacity exceeded the requirement of a certain market segment and the size of the drive became a basis of competition, creating significant value for that market segment (Danneels, 2004). Similarly, Thomond & Lettice view the change in the perception of the product’s value in the mainstream market as an enabler for a “disruptive” innovation to replace existing products and services (Thomond & Lettice, 2002). Tellis adds the internal mindset of a firm and its cultural aspects as an important player in the success and failure of technology adoption, and not only where it has radical functionality or its technology characteristics alone (Tellis, 2006).
5. Conclusion
The fragmented nature of the global water market, long replacement cycles for existing technologies and the market growth dependence on population increases and new

The Applicability of Innovation Theories to the Water Sector
87
Chap
ter
4
regulation all contribute to the slow technology diffusion rates and low disruption in the water sector. This chapter is a response to the fact that innovation is required in water, that innovation as it relates to water is understudied, and that the concepts behind Disruptive Innovation Theory have lost their meaning due to overuse, mainly out of context, and that a practical framework is required to facilitate meaningful academic and industry discussion.
The author proposes to use the framework and theories described in this chapter to evaluate several water technologies to determine if there are any commonalities or patterns that can be discerned. If certain types of innovation have led to market disruption and market creation, other innovation frameworks like the Innovation Diffusion Theory which is more practical and useful than the Disruptive Innovation Theory should be used as analogues when evaluating the potential of new technologies. Three types of innovation are defined: sustaining, radical functionality and discontinuous, where sustaining innovation take market share away from existing technologies and the later two create new markets and unlock non-consumption. This framework is proposed to inform investment strategy in water and provide a clear and objective basis and framework for academic discussion of water technology innovation.

5
Chapter 5Assessing Real World Impact of Innovative Water Technologies

Chapter 5
90
1. Introduction
Innovation is vital for driving change, creating industries, sustaining competitive performance and improving the quality of life and the environment. However, water utilities are typically slow to adopt new concepts and innovation into their facilities and operations due to barriers such as cost and financing, risk aversion and regulatory compliance (Kiparsky et al., 2016). The combination of a supportive culture at the water utility and a regulatory system promoting innovation, backed up with strong financial capability for research and development, have been identified as successful drivers of innovation in the water industry (Speight, 2015). Even though over 90% of utility respondents believe innovation is critical for the future of their organisations, only 40% believe they are effectively leveraging innovation to meet challenges and evolve (Carter et al., 2017).
The goal of this chapter is to develop a framework that will provide practicioners in the field of water technology innovation with a basis to objectively look at a particular water technology and gauge the level of market impact the technology has had. This will be achieved by developing a series of metrics that can be used to assign the level of impact into one of three categories, Level 1, 2 and 3, with Level 1 being the highest level of impact. Technologies which have achieved Level 1, will be referred to as Unicorn Technologies. The metrics will then be applied to various different water and wastewater technologies as a series of test cases. The time that each technology spent at each level will be quantified. The goal of this chapter, and subsequent work which it will lay the groundwork for, is to study what types of technologies achieve the highest level of impact, how long this takes and also which types of technologies fail to achieve high levels of impact. By studying the range of factors surrounding those technologies which have high impact, and those which do not, it is hoped that we can better understand the technology diffusion landscape and by doing so, anticipate what is realistic to expect in terms of timelines and what factors correlate with different levels of impact.
In a previous chapter, the authors outlined different types of innovation including sustaining innovation, radical functionality and discontinuous innovation (O’Callaghan et al., 2020), and studied different innovation drivers: crisis driven and value-driven innovation (O’Callaghan et al., 2019). In the water sector, the adoption of a technology driven purely by its value proposition typically takes in the region of 14 years. It has to move through the Innovators and Early Adopters stages of the market and reach the Early and Late Majority, according to the Water Technology Adoption (WaTA) model (O’Callaghan et al., 2018). In the case of a technology whose adoption is driven by a crisis or market need, such as a new piece of legislation or an urgent health or environmental issue, the timeline can be half this, at just under 7 years (O’Callaghan et al., 2019). While value-driven innovation has a slower cycle for adoption, it presents lower risk of failure as it is less dependent on external factors such as the timing of implementation

Assessing Real World Impact of Innovative Water Technologies
91
Chap
ter
5
of regulations or the occurrence of some public health related or environmental crisis (O’Callaghan et al., 2019).
Many technologies are researched and developed, but how many have real world impact? Many research topics such as bio-electrochemical and microbial fuel cell systems and photocatalytic oxidation have a large body of published literature and citations, yet have had relatively little impact in terms of solving real world global water challenges. Loeb, Alvarez, Westerhoff and co-authors in a paper entitled “The Technology Horizon for Photocatalytic Water Treatment: Sunrise or Sunset?” (Loeb et al., 2019), noted that advanced oxidation processes (AOPs) via photocatalysis for water treatment have been the subject of extensive research over the past three decades.
The boom in published literature, with 8,000 articles on the topic of photocatalytic water treatment published between 2000 and 2017, can lead to a certain amount of hype, and push a technology to the Peak of Inflated Expectations on the Gartner Hype Cycle (Dedehayir & Steinert, 2016). This phase is known to generate enthusiasm and unrealistic expectations, where there are typically more failures than succcessful applications of a technology (Bresciani & Eppler, 2008).
Many new technologies are referred to as being disruptive. The term disruptive innovation has been overused to the point that it is has lost much of its meaning (Schmidt & Druehl, 2008). Disruptivity is not a characteristic of a technology but its effects on the market (O’Callaghan et al., 2020). Several frameworks for assessing and predicting disruptive innovation have been proposed in the literature (Thomond & Lettice, 2002). Markides proposed that all three technological, business-model and new-to-the-world product innovations should be treated separately as they produce different kinds of markets (Markides, 2006). Rasool and co-workers proposed a five-step framework to help firms develop disruptive innovations, with a scale to measure the level of disruptivity. It was applied to a case study showing how consumer electronics company Nintendo could have planned development of its disruptive home video console Wii using their framework (Rasool et al., 2018). Hang and co-workers presented a model based on the theory of Christensen and subsequent clarifications in the literature, where the assessor needs to consider key success factors in market positioning, technology and other favourable drivers (Hang et al., 2011). Rafii and Kampas looked at how an incumbent may identify a potentially disruptive threat (Rafii and Kampas, 2002), whereas Christensen and his coworkers explored the impact of industry changes on disruptive innovations (Christensen et al., 2004). In addition, Hang and co-workers investigated the entrepreneurial process embedded in the theory of disruptive innovation and debated whether the theory of disruptive innovation is useful for ex ante prediction of future innovations (Hang et al., 2015).
Despite the progress made by academics since the publication of three foundational works in this area (Bower and Christensen, 1995; Christensen and Bower, 1996; Christensen,

Chapter 5
92
1997), practitioners still struggle with the innovation challenge and ways to confidently predict whether an early-stage disruptive innovation technology would have a good chance of succeeding and disrupting the market. To facilitate an academic discussion in the business community, a clear definition of disruptive innovation is required (Nagy et al., 2016). Disruptive innovation theory is still in its infancy and many areas of theory remain under-researched due to the lack of understanding and accessible empirical data (Christensen et al., 2018).
A previous chapter by the authors analysed the use of the term disruptive innovation in relation to water technologies and proposed alternative innovation classification systems (O’Callaghan et al., 2020). It was noted that sustaining innovation either helps existing companies retain market share, or claw some of it away from others, but this type of innovation does not counteract non-consumption or create new markets. Discontinuous innovation, which can be summed up as doing something that is already being done but in a totally new way, and radical functionality, representing something that has never been done before, can create a new market (Sood et al., 2005) or take market share from existing technologies (Dewar & Dutton, 1986).
This chapter looks at what constitutes a disruption, or impact, from the perspective of a water treatment technology. The level of impact can only be assessed retrospectively. The authors wish to explore whether certain innovation characteristics of the technology, which can be identified earlier in its lifecycle, correlate with different levels of market impact. There may also be differences in the relative rates of impact that correlate to innovation typology. This would be of use to those wishing to invest in the development of new innovations, in setting realistic expectations based on how they map across this framework. How their real world impact can be measured and quantified is another question.
Technology readiness levels (TRLs) are a method for estimating the maturity of technologies, developed by the NASA in the 1970s. They enable consistent, uniform discussions of technical maturity across different types of technology. Moving a technology from early-stage TRLs 1, 2 and 3 through to TRL 6 or higher, does not in itself guarantee impact in terms of application, widespread adoption and implementation. Likewise, moving a technology beyond the Early Adopters stage of the WaTA model, and into the Early and Late Majority section of the market, does not equate to the level of impact.
There are certain cases where technologies have become extremely dominant in particular applications. For example the use of spiral-wound thin-film composite reverse osmosis (RO) membranes in seawater desalination, with over 80% of all newly built seawater desalination plants using this technology instead of thermal desalination technologies, such as multiple effect distillation (MED), with the exception of some plants in the

Assessing Real World Impact of Innovative Water Technologies
93
Chap
ter
5
Middle East where thermal energy is available at low cost (Global Water Intelligence (GWI), 2019).
It is acknowledged in the literature that in terms of the introduction of new technologies, the rate of adoption of innovation in the water sector is relatively slow (Thomas & Ford, 2005). This is much less of an issue with sustaining innovations, those improvements to existing technologies being continually introduced and adopted. The uptake of sustaining innovations is important to technology providers in maintaining market share in what are typically mature and regulated markets. Given that the rate of adoption of new technologies in the water sector is slow, due to being less innovative than other sectors (Wehn & Montalvo, 2018), it may be the case that the level of impact is also low as measured by how widespread the adoption is. More questions still remain: how should we go about quantifying and measuring market impact? What constitutes disruption? Where should we set the bar so that we can objectively define levels of impact? A set of criteria has been created in this chapter that represent a meaningful and robust method to measure the level of impact and adoption. Combining and overlaying this framework with innovation types, as outlined by O’Callaghan et al. 2020, to see if particular innovation types and characteristics are linked to higher levels of impact and adoption, is valuable. The dimension of time was also overlayed to study the rate of impact to look at the typical timeframes associated with achieving certain levels of impact.
2. Framework development
Currently there is no clear impact assessment framework to objectively quantify the degree of market impact of water technologies. The availability of a recognised and replicable method of doing this will be very valuable for a range of different stakeholders as a tool to support research, development and investment. This can be useful for a water technology start-up company having a conversation with a potential investor in its company. Often when a water technology start-up company pitches to a potential investor, they hold out the promise that they will have a hockey-stick shaped growth curve, reaching high levels of market impact in relatively short-timelines of 5-7 years. Conversely, an investor may expect to see this hockey-stick shaped growth curve and may be reluctant to make an investment if a start-up company does not present a scenario where this is the case. A mismatch of expectations on either side can lead to disappointment if the reality is different to what the expectation was at the start of the journey.
The water technology impact assessment framework provides a reference point to ground expectations in real-world experience and allows both parties to benchmark potential scenarios against real world examples. There are factors that can accelerate growth, for example a piece of new legislation and if so, this needs to be clearly identified as a key driver for adoption and diffusion. It is also important to note that achieving
Chapter 5
94
lower levels of impact, (Level 3 and Level 2 impacts) are also a success, in that they represent successful technology transfer and commercialisation and real world impact in solving water challenges in the situations where they are applied. There are various stakeholders in water technology development, including the researchers who carry out the applied research, the inventor who develops the first commercial prototypes, the entrepreneur who builds a company around the technology, the end-users who adopt the technology, the investor and indeed the technology itself. Often, a technology may pass through the hands of several entrepreneurs and investors and several test sites with end-users, before it finally becomes established and widely adopted. In this sense the technology could be viewed as analogous to the transfer of genes. The authors coined the term the ‘selfish water technology gene’ to capture the essence of this, which borrows from the evolutionary concepts outlined in book The Selfish Gene (Richard Dawkins, 1976).
A number of different potential metrics and heuristics that could be used to estimate and quantify the level of impact and adoption were considered.
2.1. Metrics evaluated for inclusion in the framework The following is a list of six potential criteria that were evaluated for inclusion in the analysis in this chapter, with a discussion on each:
1. Total number of companies offering the technologyThe hypothesis associated with this metric was that the existence of multiple companies all offering a particular technology might be correlated with market impact. It was found in almost all cases that there were at least three or more companies offering the technology and that having a larger number of companies offering the technology does not necessarily equate to greater market impact. It should, however, be noted that where there are less than three, and in some cases only one company offering the technology, i.e. THIOPAQ, this can be correlated with lower levels of market impact but is not a direct measure of it.
2. Total percentage of all existing, or newly constructed, treatment facilities that use a particular technologyAnother metric that was also considered to assess the level of market penetration was the percentage of all plants that currently use the technology. In theory, this would be the ultimate measure of how dominant a particular technology has become. The rationale is that, at some point, a disruptive technology would take over from incumbent technologies or become a standard part of all treatment plants.
Due to the existing global installed base of water and wastewater treatment facilities, many with lifespans of over 30 years, the time taken to make any measurable impact on

Assessing Real World Impact of Innovative Water Technologies
95
Chap
ter
5
existing stock can take decades if relying on end-of-life replacement. This is analogous to a small group of individuals trying to make an impact on the genetic pool of a large population of long-living individuals.
It was then subsequently considered whether to apply this criterion to only the percentage of newly constructed treatment plants that incorporate a particular technology. This has the negative effect of excluding all retrofit and upgrade projects, which make up a significant portion of the available annual market opportunity for deployment for certain technologies, such as moving-bed biofilm reactors (MBBRs).
This heuristic was further complicated by factors such as the notion that certain technologies are suitable at different scales, with anaerobic digestion only making sense at wastewater treatment plants above a certain size, while other technologies require a certain configuration of existing processes, such as the need to have biological phosphorus removal in order to make struvite recovery viable and advantageous. Moreover, there are striking regional differences in the dominance of particular technologies in newly constructed plants. For example, in China, it is estimated that almost half of all new drinking water treatment (DWT) plants use ultrafiltration membrane technology, whereas in North America and Europe the figure is 10% or less (Pearce, 2019).
3. Total volume of water or wastewater (or total mass-loading) treated using the technology Another metric considered was the total volume of all water or wastewater treated that uses a particular technology. Again, in theory, this represents an ideal metric by which to measure impact. This is affected by the size and scale of the plants, which would penalise technologies that are suitable for use at small to medium sized treatment plants, and given the mature nature of the water infrastructure, many plants still use legacy technology. The authors also wished to be able to include references and impact in industrial wastewater treatment, but data on total flow and total numbers of plants is even harder to ascertain than it is for the municipal water sector.
4. Total number of reference plants in operation This metric of total number of reference plants represented an alternative to the use of total flow and/or mass loading. By comparison, the total number of facilities is more practical to apply. One limitation of this datapoint, is that it does not take into account the size and scale of the facilities. A small number of very large treatment plants could treat much higher volumes than a larger number of very small plants. Similarly, the inverse is also true; a large number of smaller sized installations could skew the results. It can be expected that in some cases, as a technology matures, the size and scale of the installations increases, in much the same way as the capacity of passenger airplanes increased over time as the technology developed. The corollary of this is that certain technologies are designed specifically for use smaller scales. Notwithstanding these

Chapter 5
96
limitations, total number of reference facilities presents a useful and practical metric to quantify market impact.
5. Total number of countries the technology is used in Another metric to help assess global level of impact is the total the number of countries in which the technology has been adopted. This can be easily measured and quantified and it provides an indication of how widespread adoption is globally, or whether it is limited to a small handful of countries or certain regions.
6. Total annual market value the technology represents For this metric, the total annual capital sales value that the water technology market represents was proposed, the rationale being the higher values correlate with higher levels of market impact. This is a difficult metric to quantify as the information is often deemed to be commercially sensitive and is not readily disclosed. There are different ways to quantify the market value, depending on what is included in the scope. For this metric, the authors found that setting revenue brackets was helpful, as this could be assigned with a greater degree of confidence than trying to estimate exact revenue figures. For example, if there is a very low annual number of reference plants, then based on known cost estimates, it is possible to estimate that the market revenue for that particular technology is under a certain threshold, for example, $100 million per annum. Likewise, in certain instances the total technology revenues of only one company may be known, and this in itself could push the technology into a higher revenue bracket, without knowing total revenue sales from all players.
2.2. Metrics selected for inclusion in the framework Based on the above outline and discussion it was proposed that the following three metrics be brought forward for impact assessment model.
1. Total number of reference plants in operation2. Total number of countries the technology is used in3. Total annual market value the technology represents
The following is an overview of the three metrics that were brought forward for testing to measure market impact. The goal was to establish three levels of Market Impact, Level 3, being the lowest level, Level 2 the next level and Level 1 being the highest level. These are described here also as Horse, Lion and Unicorn technology markets, respectively.
Total number of reference plants in operationFor the purposes of this analysis, a technology remains at the lower Level 3 impact level when the total number of plants is below 100. If the number of plants is greater than

Assessing Real World Impact of Innovative Water Technologies
97
Chap
ter
5
100, this is one of the criteria to hit Level 2. The highest level of impact is deemed to have been attained when there are more than 1,000 plants in existence.
Total number of countries the technology is used inIt is proposed that when the technology is used in under 10 countries, this represents a Level 3 impact, when it is over 10 countries it is Level 2 and when it is over 25 countries, this correlates with a Level 1 impact.
Total annual market value It is proposed that the technology is in Level 3 when the annual market value is less than $100 million, in Level 2 when the value increases up to $500 million and in Level 1 when the value exceeds $500 million.
We set the following thresholds for each of the criteria:
• Level 1 – Unicorn Technologies o Used in 1,000 or more reference plants o Used in 25 or more countries o Annual sales are $500M or more
• Level 2 – Lion Technologies o Used in 100 or more reference plants, but less than 1,000 reference plants o Used in 10 or more countries, but less than 25 countries o Annual sales are $100M or more, but less than $500M
• Level 3 – Horse Technologies o Used in less than 100 reference plants o Used in less than 10 countries o Annual sales are less than $100M
In terms of assessing whether a technology had reached Level 1, the question arose as to whether it required the technology to cross all three hurdles, or just two out of the three, and if so, which two. It is proposed for this analysis, that if a technology meets Criteria 1 and 2, then it is deemed to have crossed over to the next level of impact and adoption. Criteria 3 then becomes an auxiliary criteria which is helpful and meaningful in providing additional context to the first two metrics. It is not always possible to get accurate data on market size and interpretations of parameters vary. In cases like MBBR, the scope of supply of media and associated control systems can make up just 20% of the total project cost. Also, some technologies are inherently more capital intensive than others, which can make it easier for them to reach higher market values for lower levels of deployment relative to a lower capital cost technology.

Chapter 5
98
3. Method
Data was gathered on eleven case studies. The authors contacted informed industry professionals in Australia, Japan, Europe and North America. These individuals were known to have detailed knowledge of these technologies and databases that tracked the technology deployment. The target group were selected to provide representative coverage across key stakeholder groups. They included consulting engineers, water treatment technology providers, academics, water utility end-users, water technology investors and those who qualified on the basis of their extensive expertise in developing new water treatment technologies and implementing innovation.
The objective of the research interviews and email communications was: 1) to gather data on the number of full-scale installations for the case studies investigated in this chapter and 2) to assess whether the criteria used to define the different levels of disruptivity were robust and would be understood and usable in a consistent and objective way by water industry stakeholders.
The authors conducted these research interviews and exchanged emails to gather data, with multiple follow-ups, between September 2015 and June 2020. The interviewees were contacted by email in advance and given standard background information on the purpose of the research interview and the disruptivity framework as outlined above. Some interviews took place on the phone while others were by email. The interviewees were asked for feedback on the criteria defining the three levels of disruptivity and discussions were conducted on how the different technologies investigated in this chapter fit the framework.
Naturally, a certain amount of time is required in order for a technology to achieve significant impact and adoption. This was addressed in the creation of the WaTA model covered in a previous chapter (O’Callaghan et al., 2018). It was found that it took 17 to 24 years from when a technology was first introduced to when it reached halfway through the Early and Late Majority. When deciding case studies suitable for use in analysing market impact, technologies first introduced over 17 years ago were selected. The one exception was struvite recovery, which was introduced 14 years ago. The timeframes at each stage of technology adoption were calculated as the average number of years taken to hit the criteria for Level 1 and Level 2.
The availability of data to support the analysis was one factor that was used to determine which technologies were shortlisted for analysis. In the absence of available historic data, it would not be possible to analyse the rate of technology diffusion. The technologies were also selected for being diverse geographically and across different types of treatment, from drinking water to wastewater. Table 1 lists the technologies analysed and assessed for level of impact and adoption in particular applications.

Assessing Real World Impact of Innovative Water Technologies
99
Chap
ter
5
Table 1: Technologies and the respective applications assessed for level of impact and adoption
No. Technology name Application studied
1 Ultrafiltration (UF) membrane Drinking water treatment
2 Ultraviolet (UV) disinfection Municipal wastewater and reuse and drinking water treatment
3 Membrane bioreactors (MBR) Municipal and industrial wastewater treatment
4 Upflow anaerobic sludge blanket (UASB) reactor
Industrial wastewater treatment
5 Dissolved air flotation (DAF) Industrial wastewater treatment
6 Moving-bed bioreactor (MBBR) Municipal and industrial wastewater treatment
7 Sludge thermal hydrolysis process (THP) Municipal wastewater treatment
8 THIOPAQ biogas treatment Municipal and industrial wastewater treatment
9 Phosphorus recovery as struvite Municipal and industrial wastewater treatment
10 Microbial encapsulation Municipal wastewater treatment
11 Ceramic membrane filtration Drinking water treatment
For UF membrane filtration, it was decided to focus on drinking water treatment only, as the application of UF membrane filtration in wastewater is covered under MBR and is a very different application.
While efforts were made to obtain the exact data in terms of total numbers of plants and total number of countries the technologies were used in, it was proposed that the classification system is based on more than, or less than, a pre-determined range of criteria. Finding the exact number of reference plants in existence can be difficult, particularly after the technology has been offered for many years by many different companies. It is easier to estimate with a higher confidence interval that the total number lies within certain pre-determined ranges. This provides a model which, although a simplification of reality, makes the classification system easier to apply systematically in real world applications where approximations are available, which are accurate within the given range, but not precise.
4. Results
Once the number of reference facilities, number of countries the technology was adopted in and the annual market value were gathered for each of the eleven technologies, the three criteria were then applied to determine level of market impact as outlined in the methodology above. The data are presented in Tables 2 to 12 and the resulting level of impact assigned to each technology is summarised in Table 13.
Chapter 5
100
Table 2: Data for UF membrane technology – drinking water market
Year Number of reference plants Number of countries adoptedAnnual market value ($ million)
121985 1 1
1997 100 10 100
9
2000 25
2002 250
2006 1,000
132008 500
2019
Table 3: Data for UV disinfection technology – municipal wastewater and reuse and DWT
Year Number of reference plants Number of countries adoptedAnnual market value ($ million)
11
1983 1 1
1987 100
1994 10
8
1997 1,000
1999 100
2002 25
17 2019 500
Table 4: Data for MBR technology – municipal and industrial wastewater treatment
Year Number of reference plants Number of countries adoptedAnnual market value ($ million)
12
1990 1 1
1996 100
2000 100
2001 1,000
2002 10
4 2006 25
132008 500
2019 1,250

Assessing Real World Impact of Innovative Water Technologies
101
Chap
ter
5
Table 7: Data for MBBR technology – municipal and industrial wastewater treatment provided by AnoxKaldnes and Headworks
Year Number of reference plants Number of countries adoptedAnnual market value ($ million)
8
1990 1 1
1997 100
1998 10
17
2006 25
2008 100
2015 1,000 <500
4 2019
Table 8: Data for sludge THP – municipal wastewater treatment
Year Number of reference plants Number of countries adoptedAnnual market value ($ million)
23
1996 1 1
2007 14 9 <100
2008 20 11 <100
2019 98 24 <100
Table 6: Data for DAF technology – industrial wastewater and DWT
Year Number of reference plants Number of countries adoptedAnnual market value ($ million)
12
1975 1
1986 10
1987 100
131988 25
2000 1,000
9 2019
Table 5: Data for UASB reactor technology – industrial wastewater treatment
Year Number of reference plants Number of countries adoptedAnnual market value ($ million)
111976 1 1
1987 100 17
111988 100
1998 1,000 52
21 2019 1,700 250-300

Chapter 5
102
Table 9: Data for THIOPAQ biogas treatment – municipal and industrial wastewater treatment
Year Number of reference plants Number of countries adoptedAnnual market value ($ million)
20
1990 1 1
2002 25 10 <50
2009 95 20 <50
2010 111 23 <50
92012 148 25 <50
2019 <500 <50
Table 10: Data for phosphorus recovery as struvite – municipal and industrial wastewater treatment
Year Number of reference plants Number of countries adoptedAnnual market value ($ million)
13
2006 2 2
2015 41 9 <50
2016 47 10 <50
2019 60 11 <50
Table 11: Data for microbial encapsulation – municipal wastewater treatment
Year Number of reference plants Number of countries adoptedAnnual market value ($ million)
28
1991 1 1
2008 29 4 <100
2009 31 4 <100
2016 40 5 <100
2019
Table 12: Data for ceramic membrane filtration – DWT
Year Number of reference plants Number of countries adoptedAnnual market value ($ million)
22
1996 1 1
2011 100
2018 10
1 2019 <1,000 <25 30

Assessing Real World Impact of Innovative Water Technologies
103
Chap
ter
5
Figure 1 represents the number of years that each technology spent in each level of market impact from when the technology was launched to the year 2019. For DAF technology the data was acquired from only one vendor, Nijhuis Industries, which accounts for less than 20% of wastewater market share. Hence this technology has been excluded when calculating the average time required by a water technology to reach Level 1 market impact. Considering only UF for DWT, MBR, MBBR, UASB, and UV disinfection for wastewater and DWT markets (and excluding DAF) as Unicorn Technologies, the average time required, from the very beginning to when it reached
Figure 1: Timelines for each technology to reach different level of market impact.
12 11 12 11 12 820 22 23
13
289 8 4
11 13 17
91
13 1713
219
4
0
10
20
30
40
50
Num
ber o
f yea
rs
Years at Level 3 Years at Level 2 Years at Level 1
Level 1: Unicorn Technologies
Level 3: Horse Technologies
Level 2: Lion Technologies
Table 13: Technologies and their level of impact as of 2019
Level 1: Unicorn Technologies
1. UF membrane – drinking water treatment 2. UV disinfection – municipal wastewater and reuse, and drinking water
treatment3. MBR – municipal and industrial wastewater treatment4. UASB reactor – industrial wastewater treatment5. DAF – industrial wastewater treatment6. MBBR – municipal and industrial wastewater treatment provided by
AnoxKaldnes and Headworks
Level 2: Lion Technologies
7. THIOPAQ biogas treatment – municipal and industrial wastewater treatment8. Ceramic membrane filtration – drinking water treatment
Level 3: Horse Technologies
9. Sludge THP – municipal wastewater treatment10. Phosphorus recovery as struvite – municipal and industrial wastewater treatment11. Microbial encapsulation – water and wastewater markets – municipal
wastewater treatment

Chapter 5
104
Level 1 market impact, was 21 years. The average number of years spent at Level 2, prior to hitting Level 1, was 10 years. The average time spent at Level 3 for these same technologies was 11 years. This means it took 11 years to reach over 100 plants and to be used in ten countries, indicating a much faster market adoption rate as this number is well below the 17 to 24 year average required for the technology to reach the halfway-point of the Early and Late Majority stage of the WaTA model.
THIOPAQ and ceramic membranes were the two Level 2 Lion Technologies, as of 2019, studied in this chapter. These two technologies each took less than 24 years to move to Level 2 status during their adoption history (Figure 1), which is in line with the WaTA model, where a technology on average takes 17 to 24 years to reach halfway through the Early and Late Majority, representing 50% of the total market adoption (O’Callaghan et al., 2018).
Three of the technologies studied are currently categorised as Level 3 Horse Technologies (Figure 1): microbial encapsulation, THP and phosphorus recovery as struvite, but this could change over time. Notably in the cases of THP for sludge pre-treatment and microbial encapsulation, they have remained at Level 3 for 23 and 28 years, respectively. Struvite recovery was first adopted 13 years ago and is below the 17 to 24 year average required to reach halfway through the Early and Late Majority of the WaTA model. There is a possibility that this technology will reach Level 2 in a few years. If struvite recovery were to become crisis or needs driven, because of a new piece of legislation for example, then it would be more likely to move into Level 2 or Level 1.
5. Discussion
Many who are involved in the realm of technology development are familiar with the term unicorn company (Dellerman et al., 2017). This term is widely recognised as referring to a privately held start-up company whose market capitalisation exceeds $1 billion (Simon, 2016). It is a goal of many researchers, entrepreneurs and investors to develop technologies that will result in the creation of unicorn companies. A review of data provided by BlueTech Research found that no such companies exist in the water technology space, with the exception of large conglomerate companies that offer multiple different solutions and which have grown by acquisition (BlueTech Research Intelligence Platform at www.bluetechresearch.com, accessed June 20th, 2020).
A particular technology class (as opposed to an individual company), however, can represent a total market value that is worth more than $1 billion per annum (as opposed to market capitalisation). Whether this would be a useful threshold to measure market impact was tested and it was found that for many water technologies, this was setting the bar too high. There are relatively few individual water technology markets, such as

Assessing Real World Impact of Innovative Water Technologies
105
Chap
ter
5
RO seawater desalination, activated carbon water purification and ion exchange resins, that represent more than $1 billion in annual sales (Global Water Intelligence (GWI), 2017). In a real world scenario, the threshold of $1 billion is not appropriate for the water technology sector for individual technology classes. A threshold of $500 million per annum was selected as appropriate to quantify Level 1 impact.
A typical venture capital investor seeks to invest into companies whose technologies lead to Level 1 impacts and the typical investment horizon for such a fund is under 7 years from investments to exit. This analysis provides data to underpin the observation that water technologies are not likely to achieve Level 1 impacts in the time horizon sought by venture capital investment groups, if we measure the period from inception of a new company to the first installations. The analysis above shows that the average timeframe for a Unicorn Technology to reach Level 1 impact is 21 years. Similarly, when the same technologies are analysed at each level of market impact separately, it can be seen that on average these remain 10 years at Level 2 and 11 years at Level 3. This implies that once the technology gets into the mainstream market, it can grow relatively quickly. This in turn implies that if a venture capital firm were to invest into a water technology company that is just transitioning from Level 3 to Level 2, it is possible to make the move in about 10 years.
The data shows that microbial encapsulation technology, which is a Level 3 Horse Technology, has remained at this level for 28 years. This technology was first used for wastewater treatment in Japan in 1991, whereas the first wastewater treatment pilot plants in the United States was in 2015 (Microvi Biotechnologies – BlueTech Research interview with Microvi, March 12th 2020). Ceramic membrane drinking water filtration, a Level 2 Lion Technology, remained at Level 3 for 22 years and only crossed over to Level 2 in 2019. In a similar way to microbial encapsulation, this was first used in drinking water treatment in Japan and was slow to be adopted in other countries. These two examples illustrate that a technology can have an impact in terms of market adoption in one country and this can be isolated.
The THIOPAQ technology, while it reached Level 2 impact, remained at Level 3 for 20 years. This is at least partly related to the fact that its adoption is value driven. This underpins the challenges in pushing forward value driven innovation, particularly linked to resource recovery and circular economy, when the market is nascent, and the quantities produced are not significant enough to get the attention of the mainstream suppliers in the value chain. It is also noteworthy in the case of THIOPAQ that there was originally, and remains today, only one company offering the technology in oil and gas and municipal applications. The company Paques offers the technology to treat biogas from anaerobic digestion, while a licensee, Paqell, offers the technology in oil and gas. It has been noted by other researchers, notably Parker (Parker, 2011), that having a competitor is a common factor associated with successful new technology

Chapter 5
106
introductions. Our research and analysis uphold this finding. This may seem somewhat counterintuitive to investors and start-up companies, who often seek out what are termed blue ocean markets. These are markets which do not exist today, where demand is created rather than fought over and which are not crowded out with competitors. Our research and analysis provides clear evidence that creating a market is hard work, requiring patience, tenacity and the capital reserves to sustain a company for many years until the market takes off. Any perceived first-mover advantage is offset by the heavy investment of time and money required to single-handedly create a new market. This often leads to companies creating a market for someone else, or others who will follow in their footsteps, piggybacking on their initial investment. The analogy would be of a marathon runner who runs 25 miles alone, only to have a sprinter enter the race and overtake them on the last mile. Often these sprinters, or fast-followers, are industry incumbents who have the ability to catch up quickly. The African proverb, “If you want to go fast, go alone. If you want to go far, go together,” may be apt in the water sector, where it is often the tortoise and not the hare that wins the race; where patience and tenacity are rewarded over speed and agility.
The ideally balanced scenario in introducing a market-creating technology would have two or three companies active at the same time. This competition accelerates innovation cycles and drives down price, further accelerating adoption. The heavy effort of educating the market is shared by all players, reducing the burden. It also means clients to not have to sole-source a solution, which presents challenges where a competitive bid tender is a requirement of the procurement process, as is often the case. There is a synergy and collective benefit to having two or three competitors pushing simultaneously to open a new market.
The fragmented nature of existing technologies in the water sector may serve as a buffer against disruption in much the same way as diversity in a gene pool confers greater resistance in the population to the rapid spreading of a new disease. Certain technologies appear to have remained at Level 3 for longer that can be explained away by comparison with timelines in the WaTA model. This would suggest that a dimension other than time is the rate-limiting factor throttling the level of impact and adoption. Identifying reasons why these technologies remain limited in impact may help to anticipate factors that could limit the adoption of future technologies.
The thermal hydrolysis process is still at a Level 3 impact 23 years after its launch into the market. It has had a much higher level of impact in the United Kingdom (UK), with an estimate that over 40% of all sewage sludge in the UK is now processed using THP. There is 800 kt of installed design thermal hydrolysis capacity from one supplier alone - Cambi (Personal Communication with Cambi, June 29th 2020). Approximately 1.5 Mt of sewage sludge is produced in the UK each year (Woods et al., 2006).

Assessing Real World Impact of Innovative Water Technologies
107
Chap
ter
5
How can a technology achieve such dominance in one market and not in another? If we were to assess the level of impact of THP on the UK market only, then it has had a high level of adoption. The UK water utility market has a number of unique distinguishing characteristics, being a privatised regulated market with a dozen or so large public limited water companies providing water and wastewater services. As such, it is less fragmented and relatively consolidated. In addition, the prevailing practice in the UK, in accordance with the agreed Safe Sludge Matrix, is that the enhanced sludge treatment required for many agricultural uses can be achieved using thermal hydrolysis (Farm Advisory Service (FAS), 2001).
Differences in local market structure and legislative drivers can account for these different levels of adoption. Ceramic membranes are widely used for drinking water treatment in Japan, but much less so much globally. The data shows that Criteria 1 - total number of plants - was achieved quite early for ceramic membrane DWT, but took a lot longer to have a global impact.
It is possible to achieve localised impacts in terms of adoption in particular markets, as is seen with ceramic membranes and microbial encapsulation in Japan and thermal hydrolysis in the UK, which are anomalies or outliers when viewed in the context of the global impact and adoption levels of these technologies.
The authors posit that as market or technology conditions change, such as legislative drivers or improvements to the technologies that improve their competitiveness, this can have the effect of driving forward technologies that had previously remained stalled at Level 3.
Crisis or need drivers enable water technologies to advance to Level 1 Unicorn status and UV disinfection, UF drinking water technologies and UASB reactors are such examples (Figure 2).
The UASB reactor technology represented an advancement in industrial wastewater treatment. Prior to this, the alternatives were either aerobic biological systems, which were not practical due to the high energy consumption required to drive aeration and generation of excess waste in the form of activated sludge; or anaerobic treatment systems, which required large footprints, which were often not available at industrial sites. The UASB reactor provided a low energy and lower sludge-generating technology when compared to aerobic biological systems. It also had a lower footprint and higher rate when compared to existing anaerobic biological treatment systems. As such, this innovation provided radical functionality. It was driven by the need to treat high organic strength industrial wastewater and was a market creating innovation. It was enabled by overcoming the limitations of previously available biological treatment methods. UV and UF initially created new markets. In time they would add value at greenfield sites, but they were essentially add-ons, retrofit elements applied to an existing treatment

Chapter 5
108
train. Th is versatility to both create new markets and be added on may be a key factor that infl uences the level of adoption. MBRs provided high quality treatment at a small scale and helped create a product that enabled onsite water reuse.
Figure 2: Technologies classifi ed according to level of market impact, type of innovation and innova-tion driver, i.e. value driven or crisis/needs driven.
Value Driven
Crisis/Needs Driven
THIOPAQThermal
HydrolysisCeramic
Membranes
DAF
Radical FunctionalityDo something that has
never been done before
Disruptivity Levels
Microbial Encapsulation
MBBR
DiscontinuousDo the same thing,
but in a totally new way
SustainingImprove an existing
technology
Rackless UF Module
MBR
UV Disinfection
UF DWT
Zeolite Enhanced RO Membrane
Variable Speed Drives on Aerators
Level 1 Unicorn Level 2 Lion Level 3 Horse
Struvite Recovery
UASB
None of the technologies outlined in this chapter would be classifi ed as sustaining innovation. Sustaining is defi ned as improvements to an existing technology to enhance its performance (O’Callaghan et al., 2020). Sustaining innovation can also be defi ned with reference to the exclusion of characteristics associated defi ning other types of innovation, such as not using new components, not creating new value chains. Th e authors posit that the water sector adopts sustaining innovation at much higher rates than for other types of innovation, such as discontinuous and radical functionality. Examples of sustaining innovation include the rackless UF module (Lind et al., 2009; Hoek et al., 2011), variable speed drives on aerators and the use of zeolites as an additive in thin-fi lm composite RO membranes (Jeong et al., 2007). Sustaining innovations are generally introduced by existing companies to existing technologies and as such, the barriers to adoption are low and the market is at prime ready to adopt the next generation.

Assessing Real World Impact of Innovative Water Technologies
109
Chap
ter
5
6. Conclusion
A novel framework for assessing the impact of water technologies on the market is proposed in this chapter. Three levels of impact are defined based on the total number of reference plants, the total number of countries the technology is adopted in and total annual market value. Level 3 represents the lowest level of market impact with Level 1 being the highest. Technologies that hit Level 1 are referred to as Unicorn Technologies. For those technologies that reached Level 1, the average time required from the year of the first installation was 21 years. It was noted that once these technologies hit Level 2, they could move up to Level 1 within 10 years on average. This indicates that once a technology gains Level 2 market impact it can move more rapidly to Level 1.
It was also observed from the data that there appears to be a synergy and collective advantage to having competitors pushing simultaneously to open up a new market. This spreads the investment required to educate the consumer and prime the market and drives competition, which accelerates continued innovation and cost reduction. The fragmented nature of the water sector presents a buffer against disruption and higher levels of impact were observed in consolidated markets. Certain technologies can remain stalled at Level 1, in some cases for over 20 years, and it is posited that in the absence of some fundamental change in either technology or market drivers, certain technologies may never graduate to higher levels of market impact.
This chapter focused on applying a set of criteria to technologies that have already been fully developed. The objective being firstly to establish a set of meaningful criteria that could be applied in practice, and secondly, to measure how long it took these technologies to surmount the various hurdles and achieve the modelled levels of impact and adoption. Now that these criteria have been described, they can be used during technology development to dynamically track rates of impact and compare against other reference cases.
The authors believe that during the technology development phase, a deeper understanding of the broader context of the initiative should be developed. This should include consideration of common innovation typologies, the characteristics of the technology under development and the market drivers for adoption. These variables should also be compared with similar, fully developed analogues. This rounded approach would enhance understanding of which technologies have high potential to disrupt the market and bring greater efficiencies to the process.

6

Chapter 6General Discussion

Chapter 6
112
1. Contributions / key ideas
A Water Technology Adoption Model (WaTA) was developed to track technology diffusion. This model can be used to objectively track progress in the development and adoption of emerging new innovative water technologies. Certain criteria were defined that can be used to classify the stage on the adoption model of a particular technology. Based on applying the model to a series of case studies, average timelines associated with the movement through each stage of the model were identified. This model can be used by researchers and various stakeholders to set realistic expectations on how long it takes to develop and introduce a new technology to market. This can help to ensure that a realistic amount of capital and time is budgeted. Often technology developers run out of time and funding, and patience dwindles, as goals are not realized as quickly as anticipated. Conversely, technologies can sometimes be funded for far too long when there are no clear signs of progress and they remain zombie technologies and consume a disproportionate amount of time and capital without delivering any real value.
The author posits that if the time taken to bring a technology through the WaTA model takes significantly longer (circa >25% longer) than the average timelines for each stage, the probability that it will either stall-out, or fail, is increased. Analogous to an airplane taking off, the time to reach cruising altitude is an important metric to track. Any delay in reaching cruising altitude raises a cause for concern and may indicate that there is a deeper underlying issue that should be addressed. The greater the deviation from these typical timelines, the higher the probability that the technology will not make it through to next stage and will remain stalled out indefinitely, or until there is a fundamental change in either the technology, the market, or both. Conversely, technologies which make their way rapidly through the initial stage of the WaTA Model may have a higher probability of making it all the way through the adoption cycle in a time efficient way. As such, we posit that velocity through the stages of the model is an important and valuable heuristic to measure and track that can be correlated to the probability of success.
The rates of technology diffusion and adoption are influenced by different innovation drivers. Analysis of the rate of diffusion of different technologies revealed that certain technologies moved faster through the WaTA model than others, and it was observed that this could be correlated with two different types of innovation drivers. One innovation driver was classified as needs / crisis driven innovation, where the technology was solving an acute problem. The second type of innovation was classified as value driven innovation, where the main driver for adoption was that it delivered additional value compared to solutions currently deployed. It was observed that technologies that could be identified as crisis driven innovation, moved through the adoption cycle almost at twice the rate compared to technologies whose adoption was value driven. The author suggests that it is useful to consider at the outset, if the technology is value driven, (i.e. creating additional value, through efficiency, improved performance etc.) when

General Discussion
113
Chap
ter
6
compared to existing solutions available or whether it is responding to some form of need or crisis that exists.
The author posits that when compared with crisis driven innovations, that value driven innovations pose lower risk, but take longer to diffuse into the market, whereas crisis driven innovations, pose often higher risk as they are dependent on external forces such as legislation to be passed and enforced to drive adoption but when they move, they move at a faster rate.
The existence of competition appears to be a key factor associated with successful technology introduction, particularly in the regulated municipal utility market. It has been noted by other researchers, notably Parker (Parker, 2011), that having a competitor is a common factor associated with successful new technology introductions. Our research and analysis uphold this finding, and found that in the case of technologies, which reached higher levels of market impact, including MBBR, MBR, UV and UF, there were at least two strong competitors working to introduce the technology during the Early Adopters Stage.
This may seem somewhat counterintuitive to investors and start-up companies who often seek out what are termed ‘Blue Ocean’ markets, which do not exist today, where demand is created, rather than fought over and the market is not crowded out with competitors. Our research and analysis provides clear evidence that creating a market is hard work, requiring patience, tenacity and capital reserves to sustain a company for many years until the market takes off.
The regulated water utility market in particular, often requires the ability to obtain mul-tiple bids in an open tender. It also takes a considerable effort and bandwidth to educate the market on a new innovation so that it is primed and ready. Having more than one company is important, particularly for a value-driven innovation, where it is more of a push, than a pull, into the market.
It takes considerable bandwidth and effort to evangelize for and educate the market for the existence of and benefits from using this new innovation. Having more than one company active is in effect competition where the burden of education and marketing is distributed.
Any potential first mover advantage associated with being the only technology provider, is negated by the heavy investment of time and money required to single handedly create a new market. This often leads to companies creating a market for others, who will follow in their footsteps, piggy-backing on their initial investment. An analogy would be of a marathon runner who runs the first 23 miles alone, only to have a sprinter enter the race and overtake them on the last section of the race. Often these sprinters, or fast-followers, exist as large industry incumbents who have the ability to catch up quickly.

Chapter 6
114
Canadian struvite recovery company, Ostara, enjoyed first mover advantage, but they did not get far enough nor were fast enough, to become profitable and now there are many me-too competing technology offerings in the marketplace. In effect almost Ostara single handedly created the phosphorus struvite recovery market and are now competing in a Red Ocean for a slice of what is a small and finite market. The total investment into developing this technology exceeds USD$50M and the company today is valued at fractions of this.
The African proverb, “If you want to go fast, go alone. If you want to go far, go together”, may be apt in the water sector, where it is often the tortoise, and not the hare, that wins the race; where patience and tenacity are rewarded over speed and agility. The ideally balanced scenario in introducing a market creating technology would appear to have 2-3 companies active at the same time. This accelerates innovation cycles, competition drives down price, further accelerating adoption and the heavy effort of educating the market is divided between 2-3 players. This then reduces the burden on others and also avoids the need for a client to sole-source a solution, which presents challenges where a competitive bid tender is often a requirement of the procurement process. There is therefore a synergy and collective benefit to having 2-3 competitors all pushing simultaneously to open a new market.
The thesis shows us how we can differentiate between different types of innovation and how different innovation theories can be applied to water to help us to do this. The application of Innovation Diffusion theory, and development of a system of nomenclature that goes beyond the simple use of the word innovation as a generic term, allows various stakeholders to consider the innovation characteristics of the technology or solution and categorize it. This recognizes that there are many different types of innovation. It recognizes particularly the limitations of Disruptive Innovation theory, which is based on an impact on the market that can only be quantified after the technology has had an effect on the market. The ability to classify innovation typology based on a characteristic of the technology, allows typology to be assigned early on in the development lifecycle. Based on analyzing case studies of the type of strategy employed to bring different types of innovation through the WaTA model and the success they have had, or have not had, may help others to identify the development strategies that are tailored to and best suited to particular innovation typologies. For example, it can be discussed that venture capital investment is best suited to support the development of discontinuous innovation and radical functionality as opposed to sustaining innovation, which are best left to incumbents.
Sustaining InnovationSustaining Innovations are best suited to be diffused by industry incumbents as opposed to new entrants, unless the efficiency gain is greater than 30% over an incumbent

General Discussion
115
Chap
ter
6
technology. The author suggests that for researchers the best route to market for sustaining innovations which offer the potential for an efficiency gain of less than 30%, is by licensing the technology to an incumbent. It is not possible to rely on the value of the innovation itself to enable a start-up company, or new entrant, to obtain a significant market share from incumbents. A business strategy, separate to the innovation, may enable companies to succeed, but this needs to be analyzed independently from the technology.
Radical Functionality An innovation with radical functionality is generally introduced by a new entrant, as opposed to an existing player. This was also the case with the introduction of the Membrane Bioreactor, offered by a start-up company Zenon, from Canada, and Memcor, from Australia. Both companies subsequently were acquired circa 1997 by GE and US Filter, respectively. In the case of the Membrane Aerated Biofilm Reactor (MABR), a new technology, this is being offered by a start-up company, Oxymem, now acquired by DuPont, as well as a larger industry player, Suez WTS, though in the case of the latter, the technology was originally conceived by start-up company, Zenon and many of the original Zenon team members are still involved with the MABR technology.
Discontinuous Innovation Discontinuous Innovations have the potential to disrupt existing markets. As such, they need to be carefully monitored by incumbents. A good example is the development of electric vehicles in the automotive industry to replace fossil fuel powered cars or the introduction of digital photography, which took over from film photography. The introduction of discontinuous innovations requires a shift in the value-chain as it involves the use of different components and technical standards. Examples of discontinuous innovation in the water sector include the use of ceramic membranes, as opposed to polymeric membranes, or the use of UV LED light for disinfection, as opposed to mercury amalgam lamps. The introduction of ceramic membranes and UV LED in the water sector, have been led predominantly by new players, not existing industry incumbents. Examples of companies that have been active in the early stage development and introduction of UV LED water technology include Aquisense, RayVio, Water Sprint, Crystal IS and Acuva. Notably, none of these companies are mainstream UV companies. Companies active in the development and technology diffusion of ceramic membrane filtration include Metawater, Nanostone, PWN Water Technologies, Purifics, Ceraflo. None of these companies offer polymeric ultrafiltration membranes. This would uphold the general observation that discontinuous innovation is more often led by new entrants. This bias on behalf of incumbents towards existing solutions, creates a risk of obsolescence. A clear example was the impact on the film photography company Kodak, when its business was taken by digital photography. The

Chapter 6
116
author posits that a way to mitigate this bias on the part of incumbents is to have a separate part of the business focused on developing innovations that are disruptive to the main-stream business, using strategic investment as a way to take a position in companies that are developing such technologies. Otherwise they could simply watch and wait, and acquire at the right time in the WaTA diffusion model, ideally when the technology has achieved a Level 2 impact and has de-risked the technology and is poised for growth.
The thesis provides a simple model that can be applied consistently to measure 3 different levels of disruptive market impact. A model to measure and quantify the level of market impact was developed and applied. Having evaluated various different metrics, the author identified two key metrics and one auxiliary metric that could be used to place technologies into three different levels of impact. It was then possible to also analyze how long technologies spent at each level. Some technologies failed to reach the highest level of impact within the timelines studied and the author suggests that this is linked to the interaction of the innovation typology and market drivers. As such by studying what types of innovations have had the greatest market impact and how long it took to achieve this, we are better placed to evaluate new innovations based on their own innovation typology and use this as a benchmark to predict their likely impact.
Localized higher-level impacts in particular countries were observed that do not replicate themselves more widely in other markets pointing to the fragmented nature of the water sector. This is seen with ceramic membranes and microbial encapsulation in Japan and thermal hydrolysis in the United Kingdom, which are anomalies or outliers when viewed in the context of the global impact and adoption levels of these technologies. Thermal hydrolysis is still at a Level 3 impact globally, 24 years following its first launch into the market. It has however enjoyed a much higher level of impact in the United Kingdom, with over 40% of all sewage sludge in the United Kingdom processed using Thermal hydrolysis. Ceramic membranes were deployed for drinking water filtration in Japan in the early 1990’s, and yet this application of ceramic membranes to drinking water treatment remained quite limited to Japan for the next two decades. Microbial encapsulation was demonstrated and applied at various wastewater treatment plants in Japan again in the 1990’s but it would be many more years, before a similar approach was trialed and demonstrated at a full-scale plant outside of Japan.
How can a technology achieve such dominance in one market and not in another? If we were to assess the level of impact of thermal hydrolysis on the UK market only, then it has had a high level of adoption. Differences in local market structure, and legislative drivers can account for these different levels of adoption. The author posits that market conditions can change and that this will drive technologies that remain stuck at Level 3, to move forward with the help of new legislative drivers, or improvements in the technologies that enhance their competitiveness.

General Discussion
117
Chap
ter
6
Fragmentation may act as a buffer to disruption. The fragmented nature of existing technologies in the water sector may serve as a buffer against disruption; in much the same way as diversity in a gene pool confers greater resistance in the population to the rapid spreading of a new disease. Conversely, if fragmentation could be removed, or reduced, this could remove one of the obstacles to disruption and accelerate the diffusion of new innovations. The topic of customer fragmentation in the US water utility market and its impact was discussed by Seth Siegel (Siegel, 2019).
The following are some examples of the many different forms of fragmentation which can be found.
Variations in size and scaleFirstly, there is fragmentation in terms of size and scale. A drinking water or wastewater treatment system in the municipal utility sector can vary in size over three orders of magnitude, from small systems designed for single households, to systems serving over ten million people. Technology is scalable and unit operations can be replicated, however such a wide variance in size presents challenges in terms of execution and deployment. Certain technologies are more suited to certain niches and operating envelopes in terms of capacity.
Localised needs and crisesThe market is hyper-local and fragmented in terms of needs and crisis. Biological phosphorous removal was adopted very quickly in South Africa (Chapter 3), due to particular salinity issues with local water quality that favored its adoption over the use of chemical dosing. These conditions were not present in other parts of the world and hence chemical dosing was more widely adopted. Certain areas experience drought, whereas others have nutrient enrichment due to phosphorus and/or nitrogen. Mature markets have unaccounted for water due to ageing infrastructure and sludge disposal options. In addition to this, practices and economics vary widely, even from state to state in the United States and certainly from country to country. By contrast the need to disinfect drinking water continues to represent a clear homogenous need and this led to the widespread adoption of the use of chlorine in the treatment of water supplies. In the United States, within 10 years of the first application of chlorine to the treatment of drinking water, over 90% of all public water supplies had adopted the use of chemical disinfection (Siegel, 2019).
Technology fragmentation Certain segments of the technology market are fragmented with no clear winning or defining technology type. Polymeric membrane ultrafiltration is a case in point. UF membranes can be flat sheet, or hollow fiber, the flow pattern can be inside out, or outside

Chapter 6
118
in, a range of materials can be used including Polyethersulphone (PES), Polysulfone (PS), Polypropylene (PS), Polyvinyl Difluoride (PVDF), manufacturing processes also vary from non-solvent-induced phase separation (NIPS) process to thermally induced phase separation (TIPS). By contrast, other segments are remarkably commoditized, such as sea water membrane desalination, by a particular chemistry like thin film composite or a particular form factor, spiral wound elements.
A crisis is required to achieve Level 1 adoption of technologies with radical functionality. The water market does not require new functionality unless it is required by legislation. As such, in the absence of legislation there is no driver that will encourage widespread adoption of a technology that can deliver a level of service above and beyond what is mandated if it requires additional investment. If the technology saves money, then it is value-driven. All of the Level 1 impacts of radical functionality innovations were associated with a market need/ crisis.
Market-taking technologies often involve a long waiting period for a component or something that needs to be replaced i.e. for a new plant or a plant upgrade or expansion. On the other hand, market-creating technologies such as UV and UF initially created new markets as they were added into an existing treatment train as an additional unit process. Ultimately as the market matured, they could offset certain unit processes in new green-field sites, such as chlorine disinfection or sand filtration respectively, and became market taking, but when first introduced, they were market creating, or rather responded to an acute need that created the new market.
The Membrane Bioreactor (MBR) technology was market-creating in that it enabled high quality treatment at a small-scale offering the potential for on-site water re-use in water scarce areas, such as at Golf Clubs in areas such as Florida and California. This required on-site treatment and had a ready outlet for the re-use quality water.
It is not possible to introduce low-end Disruptive Innovation into the regulated utility water sector. In Disruptive Innovation theory, as defined by Christensen, there are two key types of water technology innovation described, firstly low-end innovation and the second, market-creating innovation. The author posits that there is no room for ‘low-end disruptive innovation’ in the regulated municipal water utility sector. Technologies cannot just be ‘good enough’ for low-end customers. All customers must meet the standards set by regulators.
There is an unmet need for low-end disruptive innovation in the industrial sector and in the provision of water services in the developing world to meet Sustainable Development Goal 6 (SDG6). In the industrial treatment sector, current treatment technologies can over-deliver on what is required. In the Oil and Gas and the Mining industry, end-users often lament the fact that the technologies used are over-kill for what they need. The water industry is often applying municipal solutions in an industrial

General Discussion
119
Chap
ter
6
setting. According to Abraham Maslows’ law of the instrument, or law of the hammer, we have a cognitive bias to rely on familiar tools.
The Water Sector like many other sectors has a cognitive bias towards the use of existing tools. Maslow’s first recorded statement of law of the instrument was “Give a small boy a hammer, and he will find that everything he encounters needs pounding” (https://en.wikipedia.org/wiki/Law_of_the_instrument). The extremely widespread and ubiquitous use of Reverse Osmosis (RO) treatment, wherever water re-use is required, is an example of this. Many industrial end-users and indeed some water utilities, note this is going a step further than is required, in effect “burning the house to roast the pig”. There may be room for less expensive solutions that do not produce as high-quality water as RO, but produce water, which is fit-for-purpose, or ‘good enough’, consistent with the Christensen definition of low-end innovation.
There is also room for low-end disruption in the developing world in the provision of both drinking water and sanitation. In the case of Sanitation, there is a large number of Water and Sanitation (WASH) startup companies that leapfrog the conventional collect system and treatment model employed in the western world. One example employed in Kenya by company Sanivation, involves the use of blue buckets, which are deployed in people’s homes for the purposes of collecting urine and faeces to be converted into a solid fuel at a centralized facility. This is not as convenient as a flush toilet, but it leap-frogs the need to have centralized wastewater collection systems. This is vital to solving challenges in areas where it is not possible to invest in centralized infrastructure. Another example is the use of an Atmospheric Water Capture (AWC) device to provide water for basic needs in areas where there are no other viable alternatives. This is not as ‘good’ or convenient as conventional drinking water treatment and distribution infrastructure, but it overcomes the great difficulties that exist in providing underground water distribution systems in the developing world and also the challenges that exist when the water is simply not there to be collected and treated.
The greatest need for Innovation to solve global water challenges is at a systems level as opposed to a technology level. Applied Research and Development in the water sector is very much focused on developing technologies (whether they are discontinuous, radical functionality, sustaining), that sit on top of, or fit into, an existing system or the urban water cycle. The urban water cycle itself needs to be evaluated, as outlined in the works of David Sedlak and Glen Daigger (Daigger et al., 2019; Sedlak, 2014). This will lead to new systems that include groundwater recharge, rainwater harvesting, non-potable and potable water re-use, decentralised systems, off-grid water, use of non-conventional water sources, water-less technologies, source separation, resource recovery and alternative sanitation ideas such as the Re-Invented Toilet, which was supported by the Bill and Melinda Gates Foundation. Systems level solutions would also include wetland habitat rehabilitation to restore water balances and provide for natural filtration systems and planting trees to help to create rain.

Chapter 6
120
Market creating innovations, which meet un-met needs, and address non-consumption, may be some of the most important innovations required. The major drivers for water innovation cannot be met by simply improving existing technologies or systems. Digital technologies, such as Internet of Things (IoT), Artificial Intelligence (AI), extracting value and intelligence from Big Data, all these open up new opportunities in the water sector to solve water challenges in new and exciting ways. For example, the use of satellite data from space to detect leaks in water mains on earth, the use of earth observation science to balance water needs at a catchment level or the use of data algorithms and software that optimize energy and water use withing commercial buildings. Financial innovations, such as micro-loans for the world’s poorest people that enable them to become part of fixing their own problem are another excellent example of approaching these problems from a different angle. All these are non-traditional approaches to addressing water quantity and quality challenges.
2. Limitations of this work
One of the reasons why Clayton Christensen studied the evolution of the hard drive market was that it had short evolution cycles for change lending itself well to observation. In the early days of genetics, scientists studied fruit flies for similar reasons. In the water sector, gestation periods for new technologies are long, as we have seen and the lifespan of technologies is often decades. To look at case studies, required us to look back 30-40 years in some cases. These periods of time pre-dated the Internet. While there was peer reviewed literature available, we were heavily reliant on the personal records maintained by individuals who directly led the development and evolution of these technology markets to obtain data required. For this we are very grateful. Access to commercial data is always difficult, as companies have to protect proprietary information.
The field of study for the thesis was municipal and industrial water and wastewater treatment. There are other areas, such as the use of water in agriculture, that are not addressed in this thesis.
3. Suggestions for future research work
The author would encourage continued use of the frameworks outlined in this thesis to study emerging water technologies, and also emerging policies and business models. The author recommends combined use of the Technology Impact Framework outlined in Chapter 5, for assessing level of market impact, overlain with the innovation typology, described in Chapter 4 and the Water Technology Adoption model (WaTa) described in Chapter 2, to help understand the level of impact that the diffusion of a particular technology is likely to have and in what time frame.

General Discussion
121
Chap
ter
6


References

References
124
Abernathy, W.J., Utterback, J., 1978. Patterns of industrial innovation. Technol. Rev. 80 (7), 40–47.
Adapa, L.M., Azimi, Y., Singh, S., Porcelli, D., Thompson, I.P., 2016. Comparative study of chemical and physical methods for distinguishing between passive and metabolically active mechanisms of water contaminant removal by biofilms. Water Res. 101, 574–581.
Addams, L., Boccaletti, G., Kerlin, M., Stuchtey, M., 2009. Charting our water future: economic frameworks to inform decision-making. McKinsey & Company, New York.
Adnan, A., Mavinic, D. S., Koch, F. A., 2003. Pilot-scale study of phosphorus recovery through struvite crystallization – examining the process feasibility. J. Environ. Eng. Sci. 2, 315–324.
Ajami, N.K., Thompson Jr, B.H., Victor David, G., 2014. The path to water innovation. Stanford woods institute for the environment, Washington DC. https://www.hamiltonproject.org/assets/legacy/files/downloads_and_links/path_to_water_innovation_thompson_paper_final.pdf (Accessed June 2020).
Alves, M. T. R., Teresa, F. B., Nabout, J. C., 2014. A global scientific literature of research on water quality indices: trends, biases and future directions. Acta Limnol. Bras. 26, 245–253.
Anderson, P., Tushman, M.L., 1990. Technological discontinuities and dominant designs: A cyclical model of technological change. Admin. Sci. Quar. 604–633.
Atherton, F., Newman, C.P.S., Casemore, D.P., 1995. An outbreak of waterborne Cryptosporidiosis associated with a public water supply in the UK. Epidemiol. Infect. 115, 123–131.
Barber, W.P.F., 2016. Thermal hydrolysis for sewage treatment: a critical review. Water Res. 104, 53–71.
Barnard, J. L., 1975. Biological nutrient removal without the addition of chemicals. Water Res. 9, 485–490.
Barnard, J. L., 2017. Advanced Environmental Technology Division, Black & Veatch, USA. Personal Communication, November 2017.
Barripp, C., Bowmer, K.H., Sorenson, P., 2004. Water innovation a new era for Australia. Market. 411, 790.
Beal, G. M., Bohlen, J. M., 1957. The diffusion process. Agricultural Experiment Station; Iowa State College: Ames, Iowa, USA. https://lib.dr.iastate.edu/cgi/viewcontent.cgi?article=1015&context=specialreports (Accessed June 2020).
Benschop, A., Janssen, A., Hoksberg, A., Seriwala, M., Abry, R., Ngai, C., 2002. The shell-Paques/THIOPAQ gas desulphurization process: Successful start up first commercial unit. http://docplayer.net/7906639-The-shell-paques-thiopaq-gas-desulphurisation-process-successful-start-up-first-commercial-unit.html (Accessed June 2020).
Besanko, D., Dranove, D., Shanley, M., Schaefer, S., 1996. The economics of strategy. John Wiley & Sons, New York.

References
125
Ref
eren
ces
Bikfalvi, A., Marques, P., Pérez-Cabaní, M.L., Juandó Bosch, J., Rodriguez-Roda, I., 2018. Bridging academia and water-related business through competence development: Evidence from a pan-European project. J. Clean. Prod. 171, S20–S33.
Blackall, L.L., Crocetti, G.R., Saunders, A.M., Bond, P.L., 2002. A review and update of the microbiology of enhanced biological phosphorous removal in wastewater treatment plants. Antonie Van Leeuwenhoek Int. J. General Molec. Microbiol. 81, 681–691.
Blonigen, S. J., Fassbender, A. G., Litt, R. D., Monzyk, B. F., Neff, R., 2005. Apparatus and method for ammonia removal from waste streams. U.S. Patent 6,838,069 B2; Jan 4, 2005. https://www.google.com/patents/US6838069.
BlueTech Research, 2019. Licensing tracker analysis.
Bower, J., Christensen, C., 1995. Disruptive technologies: catching the wave. Harvard Business Review, 73 (1), 43–53.
Bowmer, K.H., 2004. Water innovation a new era for Australia. CL Creations Pty Ltd., Lane Cove, NSW.
Bradford-Hartke, Z., Lane, J., Lant, P., Leslie, G., 2015. Environmental benefits and burdens of phosphorus recovery from municipal wastewater. Environ. Sci. Technol. 49, 8611–8622.
Bresciani, S., Eppler, M.J., 2008. Gartner’s magic quadrant and hype curve. In: Collaborative knowledge visualization case study series, 2. https://www.researchgate.net/profile/Martin_Eppler/publication/265407275_GARTNER’S_MAGIC_QUADRANT_and_HYPE_CYCLE/links/54e285680cf296663796a20a.pdf (Accessed June 2020).
Buckley, P., Gunnion, L., Sarni, W., 2016. Issues by the numbers. The aging water infrastructure: out of sight, out of mind. Deloitte Insights. https://www2.deloitte.com/content/dam/insights/us/articles/us-aging-water-infrastructure-investment-opportunities/DUP2795_Water_Report_042416.pdf (Accessed June 2020).
Cambi Website. https://www.cambi.com/who-we-are/history/ (Accessed June 2020).
Cardinal, P.J. Austgen Biojet Holdings Pty. Ltd., Australia. Personal communication, February 2018.
Carter, J.T., Foresman, J., Brown, T., Darr, M., Means, E., Owen, D., & Jones, T.M. IV, 2017a. Fostering innovation within water utilities. Water Research Foundation, Denver. www.teraz-srodowisko.pl/media/pdf/aktualnosci/3823-fostering-innovation-within-water-utilities.pdf (Accessed June 2020).
Carter, J.T., Foresman, J., Means, E., Owen, D. & Jones IV, T.M., 2017b. A framework for driving innovation in your water and wastewater utility. J. Am. Water Works Assoc. 109 (12), 32–39.
Castillo, A., Vall, P., Garrido-Baserba, M., Comas, J., Poch, M., 2017. Selection of industrial (food, drink and milk sector) wastewater treatment technologies: a multi-criteria assessment. J. Clean. Prod. 143, 180–190.
Christensen, C. M., 1992. Exploring the limits of the technology s-curve. Part I: component technologies. Prod. Oper. Manag., 1, 334–357.

References
126
Christensen, C.M., Bower, J.L., 1996. Customer power, strategic investment, and the failure of leading firms. Strat. Manage. J. 17, 197–218.
Christensen, C.M., 1997. The innovator’s dilemma: when new technologies cause great firms to fail. Harvard Business School Press, Boston.
Christensen, C.M., Bohmer, R., Kenagy, J., 2000. Will disruptive innovations cure healthcare? Harvard Business Review 78, 102–117.
Christensen, C.M., Raynor, M., Verlinden, M., 2001. Skate to where the money will be. Harvard Business Review 79, 72–81.
Christensen, C.M., Anthony, S.D., Roth, E.A., 2004. Seeing what’s next using the theories of innovation to predict industry change. Harvard Business Press, Boston.
Christensen, C.M., Baumann, H., Ruggles, R., Sadtler, T.M., 2006. Disruptive innovation for social change. Harvard Business Review 84, 94–101.
Christensen, C.M., Kaufman, S.P., Shih, W.C., 2008. Innovation killers. Harvard Business Review, 86, 98–105.
Christensen, C.M., Raynor, M. & McDonald, R., 2015. What is disruptive innovation? Harvard Business Review 93, 44–53.
Christensen, C.M., McDonald, R., Altman, E.J., Palmer, J.E., 2018. Disruptive innovation: an intellectual history and directions for future research. J. Manage. Stud. 55, 1043–1078.
Christensen, C.M., Ojomo, E., Dillon, K., 2019a. The prosperity paradox: How innovation can lift nations out of poverty. Harper Business, New York.
Christensen, C.M., Ojomo, E., Gay, G.D., Auerswald, P.E., 2019b. The third answer: how market-creating innovation drives economic growth and development. Innov.: Technol. Govern. Global. 12, 10–26.
Dahlin, K. B., Behrens, D.M., 2005. When is an invention really radical?: Defining and measuring technological radicalness. Res. Pol. 34 (5), 717–737.
Daigger, G. T., 2007. Wastewater management in the 21st Century. J. Environ. Eng. 133 (7), 671–680.
Daigger, G. T., 2009. State-of-the-art review: evolving urban water and residuals management paradigms: water reclamation and reuse, decentralization, resource recovery. Water Environ. Res. 81 (8), 809–823.
Daigger, G.T., Sharvelle, S., Arabi, M., Love, N.G., 2019. Progress and promise transitioning to the one water/resource recovery integrated urban water management systems. J. Environ. Eng. 145 (10), 04019061.
Damon, M., White, G., 2018. Taps and toilets for all. Stanford Social Innovation Review. https://ssir.org/articles/entry/taps_and_toilets_for_all (Accessed June 2020).
Danneels, E., 2004. Disruptive technology reconsidered: A critique and research agenda. J. Prod. Innov. Manage. 21 (4), 246–258.

References
127
Ref
eren
ces
Dedehayir, O., Steinert, M., 2016. The hype cycle model: a review and future directions. Technol. Forecast. Soc. Change. 108, 28–41.
De Kreuk, M. K., Heijnen, J. J., Van Loosdrecht, M. C. M., 2005. Simultaneous COD, nitrogen, and phosphate removal by aerobic granular sludge. Biotechnol. Bioeng., 90, 761–769.
Dellermann, D., Lipusch, N., Ebel, P., Popp, K. M., Leimeister, J. M., 2017. Finding the unicorn: predicting early stage startup success through a hybrid intelligence method. In: International Conference on Information Systems (ICIS). Seoul, South Korea.
Dewar, R.D., Dutton, J.E., 1986. The adoption of radical and incremental innovations: An empirical analysis. Manage. Sci. 32, 1422–1433.
Elsevier, 2011. Confronting the global water crisis through research; SciVal Report. https://www.elsevier.com/__data/assets/pdf_file/0018/53082/Water-Resources_WP_lr.pdf (Accessed June 2020).
Environmental Working Group (EWG), 2019. State of american drinking water: the dirty secret of government drinking water standards. EWG’s Tap Water Database. ewg.org/tapwater/state-of-american-drinking-water.php (Accessed June 2020).
EPA, 2012. Clean watersheds needs survey. https://www.epa.gov/cwns (Accessed June 2020).
EPA, 2017. EPA SDWIS Federal Reports Database. https://ofmpub.epa.gov/apex/sfdw/f?p=108:1:::NO::: (Accessed June 2020).
Etzkowitz, H., 2003. Innovation in innovation: the triple helix of university-industry-government relations. Soc. Sci. Inform. 42, 293–337.
European Commission, 2013. Horizon 2020 – Work Programme 2014-2015; General Annexes, Extract from Part 19 - Commission Decision C(2014)4995, Annex G; Technology Readiness Levels (TRL). https://ec.europa.eu/research/participants/data/ref/h2020/wp/2014_2015/annexes/h2020-wp1415-annex-g-trl_en.pdf (Accessed June 2020).
Evoqua, 2018. Evoqua water technologies reports fourth quarter and full year 2018 results. https://aqua.evoqua.com/press-release/evoqua-water-technologies-reports-fourth-quarter-and-full-year-2018-results (Accessed June 2020).
Farm Advisory Service (FAS), 2001. The safe sludge matrix. https://www.fas.scot/downloads/safe-sludge-matrix/ (Accessed June 2020).
Food and Water Watch (FWW), 2018. The water crisis in Martin County, Kentucky. Issue brief. https://www.foodandwaterwatch.org/sites/default/files/ib_1802_martincntykywater-web5.pdf (Accessed June 2020).
Gabrielsson, J., Politis, D., Persson, K.M., Kronholm, J., 2018. Promoting water-related innovation through networked acceleration: Insights from the water innovation accelerator. J. Clean. Prod. 171 S131–S139.
Gartner, 2018. Understanding Gartner’s hyper cycles. https://www.gartner.com/en/documents/3887767/understanding-gartner-s-hype-cycles (Accessed June 2020).

References
128
Global Water Intelligence (GWI), 2017. Global water market forecast data: CAGRs. https://www.globalwaterintel.com/ (Accessed June 2020).
Global Water Intelligence (GWI), 2019. Desalination Data. https://www.globalwaterintel.com/ (Accessed June 2020).
Guo, J., Pan, J., Guo, J., Gu, F., Kuusisto, J., 2019. Measurement framework for assessing disruptive innovation. Technol. Forecast. Soc. Change. 139, 250–265.
Hambidge, K.M., Krebs, N.F., 2007. Zinc deficiency: a special challenge. J. Nutr. 137(4), 1101–1105.
Hang, C.C., Chen, J., Yu, D., 2011. An assessment framework for disruptive innovation. Foresight. 13 (5), 4–13.
Hang, C.C., Garsney, E., Ruan, Y., 2015. Opportunities for disruption. Technovation. 39–40, 83–93.
Hegger, D.L.T., Spaargaren, G., van Vliet, B.J.M., Frijns, J., 2011. Consumer-inclusive innovation strategies for the Dutch water supply sector: opportunities for more sustainable produces and services. NJAS- Wageningen J. Life Sci. 58, 49–56.
High Level Panel on Water (HLPW), 2016. Joint statement of the high level panel on water, Press Release, 21 September. https://sustainabledevelopment.un.org/content/documents/ 11296Joint%20Statement%20HLPW.pdf (Accessed June 2020).
Hoek, E.M.V., Ghosh, A.K., Huang, X., Liong, M., Zink, J.I., 2011. Physical–chemical properties, separation performance, and fouling resistance of mixed-matrix ultrafiltration membranes. Desalination. 283, 89–99.
Holtz, S., 2006. There is no “away”: Pharmaceuticals, personal care products and endocrine-disrupting substances: emerging contaminants detected in water. Canadian Institute for Environmental Law and Policy: Toronto.
Hritonenko, N., Yatsenko, Y., 2008. Anticipation echoes in vintage capital models. Math. Comput. Model. 48, 734–748.
Infrastructure Report Card (IRC), 2017a. Infrastructure report card: drinking water. https://www.infrastructurereportcard.org/wp-content/uploads/2017/01/Drinking-Water-Final.pdf (Accessed June 2020).
Infrastructure Report Card (IRC), 2017b. Infrastructure report card: wastewater. https://www.infrastructurereportcard.org/wp-content/uploads/2017/01/Wastewater-Final.pdf (Accessed June 2020).
Ipektsidis, B., Remotti, L.A., Rumpf, G., Spanos, Y., Soderquist, K., Vonortas, N., Damvakeraki, T., Montalvo, C., Bulavskaya, T., Dröes, M., Moghayer, S., Hu, J., Koops, O., Leijten, J., Derbyshire, J., Passi, H., Burge, P., María Lázaro, J., Fisher, R., 2016. R&D investments and structural changes in sectors: quantitative and qualitative analysis policy recommendations. European Commission, Brussels. https://op.europa.eu/en/publication-detail/-/publication/26e9cd4d-4fcf-11e6-89bd-01aa75ed71a1/language-en (Accessed June 2020).

References
129
Ref
eren
ces
Jeong, B. H., Hoek, E. M. V., Yan, Y., Subramani, A., Huang, X., Hurwitz, G., Ghosh, A. K., Jawor, A., 2007. Interfacial polymerization of thin film nanocomposites: a new concept for reverse osmosis membranes. J. Membr. Sci. 294 (1-2), 1–7.
Johnson, J.D., Qualls, R.G., 1984. Ultraviolet disinfection of secondary effluent: measurement of dose and effects of filtration. EPA-600/S2-84-160, U.S. EPA, Municipal Environmental Research Laboratory, Cincinnati, Ohio, USA.
Kalogo, Y., Monteith, H. D., 2008. State of science report: energy and resource recovery from sludge. Report Project OWSO3R07. Water Environment Research Foundation: Alexandria, VA, U.S.A.
Kemp, R., Volpi, M., 2008. The diffusion of clean technologies: a review with suggestions for future diffusion analysis. J. Clean. Prod. 16, S14–S21.
Kepp, U., Machenbach, I., Weisz, N., Solheim, O.E., 2000. Enhanced stabilisation of sewage sludge through thermal hydrolysis – three years of experience with full scale plant. Water Sci. Technol. 42, 89–96.
Khateeb, O. M., 2017. The 4 stages of technology adoption: inside the chasm. Medium. https://medium.com/@omarmkhateeb/the-4-stages-to-adoption-inside-the-chasm-6c9c19e4375 (Accessed June 2020).
Kiparsky, M., B. Thompson, C. Binz, D. Sedlak, L. Tummers and B. Truffer. 2016. Barriers to innovation in urban wastewater utilities: attitudes of managers in California. Environ. Manage. 57, 1204–1216.
Kowalski, W., 2009. UVGI disinfection theory, in: Ultraviolet Germicidal Irradiation Handbook, Springer Berlin Heidelberg, pp. 17–50.
Krozer, Y., Hophmayer-Tokich, S., van Meerendonk, H., Tijsma, S., Vos, E., 2010. Innovations in the water chain-experiences in the Netherlands. J. Clean. Prod. 18, 439–446.
Kwok, S. C., Lang, H., O’Callaghan, P., Stiff, M., 2010. Water technology markets 2010: key opportunities and emerging trends. Media Analytics Ltd., Oxford.
Larsen, T. A., Hoffmann, S., Lüthi, C., Truffer, B., Mauer, M., 2016. Emerging solutions to the water challenges of an urbanizing world. Science, 352 (6288), 928–933.
Lee, C.W., Kwon, H.B., Jeon, H.P., Koopman, B., 2009. A new recycling material for removing phosphorous from water. J. Clean. Prod. 17 (7), 683–687.
Lind, M., Jeong, B., Subramani, A., Huang, X., Hoek, E., 2009. Effect of mobile cation on zeolite-polyamide thin fulm nanocomposite membranes. J. Mater. Res. 24 (5), 1624–1631.
Linden, A. & Fenn, J., 2003. Understanding Gartner’s Hype Cycles, Gartner.
Linton, J.D., 2002. Forecasting the market diffusion of disruptive and discontinuous innovation, in: IEEE Transactions on Engineering Management, 49 (4), 365–374.
Lobina, E., 2012. Water service governance, technological change and paradigm shifts: a conceptual framework. Int. J. Water 6 (3/4), 155–175.

References
130
Loeb, S.K., Alvarez, P.J.J., Brame, J.A., Cates, E.L., Choi, W., Crittenden, J., Dionysiou, D.D., Li, Q., Li-Puma, G., Quan, X., Sedlak, D.L., Waite, T.D., Westerhoff, P., Kim, J.H., 2019. The technology horizon for photocatalytic water treatment: sunrise or sunset? Environ. Sci. Technol. 53, 2937−2947.
Loewe, P. & Dominiquini, J., 2006. Overcoming the barrier to effective innovation. Strategy and Leadership, 34:1:24.
Maidique, M.A., Zirger, B.J., 1984. A study of success and failure in product innovation: the case of the US electronics industry, in: IEEE Transactions on Engineering Management, 31 (4), 192–203.
Maktabifard, M., Zaborowska, E., Makinia, J., 2018. Achieving energy neutrality in wastewater treatment plants through energy savings and enhancing renewable energy production. Rev. Environ. Sci. Bio/Technol. 17, 655–689.
Mankins, J. C., 1995. Technology readiness levels. White Paper. Office of Space Access and Technology, NASA.www.colorado.edu/ASEN/asen3036/TECHNOLOGYREADINESSLEVELS.pdf (Accessed June 2020).
Markides, C., 2006. Disruptive innovation: in need of better theory. J. Prod. Innov. Manag. 23 (1), 19–25.
McCarthy, D., 2008. Climate change and the UK water industry: stepping up to the challenge. http://www.waterwebster.com/documents/Water-Climate-Change-UK-APPROVED-06-30-08_000.pdf (Accessed June 2020).
McCutcheon, J. R., McGinnis, R. L., Elimelech, M., 2005. A novel ammonia—carbon dioxide forward (direct) osmosis desalination process. Desalination 174 (1), 1–11.
McGrath, R.G., 2013. The pace of technology adoption is speeding up. Harvard Business Review. https://hbr.org/2013/11/the-pace-of-technology-adoption-is-speeding-up (Accessed June 2020).
Montalvo, C., 2006. What triggers change and innovation? Technovation 26, 312–323.
Montalvo, C., 2008. General wisdom concerning the factors affecting the adoption of cleaner technologies: a survey 1990-2007. J. Clean. Prod. 16, S7–S13.
Montalvo, C., Kemp, R., 2008. Cleaner technology diffusion: case studies, modeling and policy. J. Clean. Prod. 16, S1–S6.
Monzyk, B. F., Rose, J. K., Burckle, E. C., Smeltz, A. D., Rider, D. G., Cucksey, C. M., Clark, T. O., 2013. Method for producing ferrate (V) and/or (VI). U.S. Patent 8,449,756 B2. https://patents.google.com/patent/US8449756 (Accessed June 2020).
Moore, G. A., 1991. Crossing the chasm: marketing and selling high-tech products to mainstream customers. Harper-Collins Publishers: New York.
Mvulirwenande, S., Alaerts, G., Wehn de Montalvo, U., 2013. From knowledge and capacity development to performance improvement in water supply: the importance of competence integration and use. Water Policy 15 (Suppl. 2), 267–281.

References
131
Ref
eren
ces
Nagel, W., Wouters, T., van der Weerd, K., 2018. VIA Water: a programme to support co-created water innovations in African cities. J. Clean Prod. 171, 140–143.
Nagy, D., Schuessler, J., Dubinsky, A., 2016. Defining and identifying disruptive innovations. Ind. Mark. Manag. 57, 119–126.
Naik, K. S., Stenstrom, M. K., 2014. Optimized decentralized wastewater systems for better energy-efficiency, sanitation and reclamation. IWA World Water Conference and Exhibition; Lisbon, Portugal, Sep 22.
Nichols, G., Chalmers, R., Lake, I., Sopwith, W., Regan, M., Hunter, P., Grenfell, P., Harrison, F., Lane, C., 2006. Cryptosporidiosis: a report on the surveillance and epidemiology of Cryptosporidium infection in England and Wales. Drinking Water Directorate. http://dwi.defra.gov.uk/research/completed-research/reports/DWI70_2_201.pdf (Accessed June 2020).
NRDC, 2019. Newark drinking water crisis. https://www.nrdc.org/newark-drinking-water-crisis (Accessed June 2020).
NWP, 2018. Economische kansen en hoogwaardige kennis in water. Netherlands Water Partnership. https://www.tkiwatertechnologie.nl/wp-content/uploads/2018/07/OEBW2017_def.pdf (Accessed June 2020).
O’Callaghan, P., 2008. Decentralised wastewater management - a solution to infrastructure bottlenecks? Eng. Ir., 62, 448–450.
O’Callaghan, P., Daigger, G., Adapa, L. & Buisman, C., 2018. Development and application of a model to study water technology adoption. Water Environ. Res. 90, 563–574.
O’Callaghan, P., Adapa, L.M., Buisman, C., 2019. Analysis of adoption rates for needs driven versus value driven innovation water technologies. Water Environ. Res. 91, 144–156.
O’Callaghan, P., Adapa, L.M., Buisman, C., 2020. How can innovation theories be applied to water technology innovation? J. Clean Prod. 276, 122910.
OECD, 2017. Prospects in water related technological innovation. Available at: https://www.oecd.org/environment/resources/Session%201%20Prospects%20in%20water-related%20technological%20innovation.pdf (Accessed June 2020).
OFWAT, 2017. Driving innovation in water. https://www.ofwat.gov.uk/wp-content/uploads/2017/12/Driving-innovation-in-water-FINAL.pdf (Accessed June 2020).
Ojomo, E., 2015. Making the case for market creating innovations — a look at the Ford Model T. Harvard Business School. https://medium.com/bsse-gets-social-media/making-the-case-for-market-creating-innovations-a-look-at-the-ford-model-t-d7db2f1e3b01 (Accessed June 2020).
Oleszkiewicz, J.A., Barnard, J.L., 2006. Nutrient removal technology in North America and the European Union: a review. Water Qual. Res. J. Canada 41, 449–462.
Ontario Ministry of the Environment, 2008. Design guidelines for sewage works. https://www.ontario.ca/document/design-guidelines-sewage-works (Accessed June 2020).

References
132
Oosterhuis, M., Ringoot, D., Hendriks, A., Roeleveld, P., 2014. Thermal hydrolysis of waste activated sludge at Hengelo Wastewater Treatment Plant, the Netherlands. Water Sci. Technol. 70, 1–7.
Paap, J. & Katz, R., 2004. Anticipating disruptive innovation. Res. Technol. Manage. 47(5), 13–22.
Pace, J., Wu, C.Y., Chai, T., 1988. Bacterial flora in pasteurized oysters after refrigerated storage. J. Food Sci. 53, 325–327.
Parker, D. S., 2011. Introduction of new process technology into the wastewater treatment sector. Water Environ. Res. 83, 483–497.
Partzsch, L., 2009. Smart regulation for water innovation- the case of decentralized rainwater technology. J. Clean. Prod. 17, 985–991.
Pearce, G., 2018. Membrane Consultancy Associates Ltd., Reading, UK. Personal communication, February 2018.
Pearce, G.K., 2019a. Membranes tech dive: seeking the holy grail. Aquatech. https://www.aquatechtrade.com/news/article/membranes-tech-dive/ (Accessed June 2020).
Pearce, G.K., 2019b. Recent developments in the membrane filtration market. IS13. Water Technology Innovations for Emerging Challenges. The 16th IWA Leading Edge Conference on Water and Wastewater Technologies.
Peric, M., Abu-Orf, M., Stinson, B., Davies, G., Goss, T., Taylor, R., Amad, S., Belschner, D., Hartz, F., Selock, K., 2012. Turning biosolids into green energy comparing anaerobic digestion with combined heat and power to close-coupled gasification. Proceedings of the Water Environment Federation, Residuals and Biosolids, 1140–1163.
Petrasek, A.C., Wolf, H.W., Edmond, S.E., Andrews, D.C., 1980. Ultraviolet disinfection of municipal wastewater effluents. EPA publ. no. 600/2-80/102. U.S. Environmental Protection Agency, Washington, D.C.
Peuckert, J., 2012. Urban water innovation systems in newly industrialised countries: case studies of Brazil, China, India and South Africa. In: Siyanbola, W., Egbetokun, A., Adebowale, B.A., Olmade, O. (Eds.), Innovation Systems and Capabilities in Developing Regions. Gower Publishing Ltd, Farnham, UK and Burlington, USA.
Piao, W., Kim, Y., Kim, H., Kim, C., 2016. Life cycle assessment and economic efficiency analysis of integrated management of wastewater treatment plants. J. Clean. Prod. 113, 325–337.
Plappally, A.K., Lienhard, J.H., 2012. Energy requirements for water production, treatment, end use, reclamation, and disposal. Renew. Sust. Energ. Rev. 16, 4818–4848.
Pontius, F., Regunathan, P., Harrison, J., 2003. SDWA compliance using point-of-use (POU) and point-of-entry (POE) treatment, in: Drinking Water Regulation and Health, F. Pontius, ed., WileyInterscience.
Prasad, A.S., 2003. Zinc deficiency: has been known of for 40 years but ignored by global health organisations. Br. Med. J. 326, 409–410.
References
133
Ref
eren
ces
Rafii, F., Kampas, P.J., 2002. How to identify your enemies before they destroy you. Harv. Bus. Rev. November, 115–123.
Rasool, F., Koomsap, P., Afsar, B., Panezai, B.A., 2018. A framework for disruptive innovation. Foresight, 20(3), 252–270.
RobeccoSAM, 2015. Water: the Market of the Future. https://www.robecosam.com/media/3/2/7/3272659fd94cb56fac2a47a4ec159001_150708-waterstudy-en-Vdef_tcm1011-16007.pdf (Accessed June 2020).
Rogers, E.M., 1995. Diffusion of innovations. 4th Edition, the Free Press, New York.
Rogers, E. M., 2003. Diffusion of innovations, 5th ed.; Simon and Schuster/The Free Press: New York.
Rosling, H., Rosling, O., Ronnlund, A.R., 2018. Factfulness: ten reasons we’re wrong about the world - and why things are better than you think. Flatiron Books, New York.
Roy, S., Edwards, M.A., 2019. Preventing another lead (Pb) in drinking water crisis: Lessons from the Washington D.C. and Flint MI contamination events. Curr. Opin. Environ. Sci. Health. 7, 34–44.
Scheible, O.K., Bassel, C.D., 1981. Ultraviolet disinfection of a secondary wastewater treatment plant effluent. EPA publ. no. 600/S2-81-152. U.S. Environmental Protection Agency, Washington, D.C.
Schild, P., 2013. Horizon 2020 – Calls Overview; E.U., Brussels. www.mizs.gov.si/fileadmin/mizs.gov.si/pageuploads/Znanost/doc/Horizon_2020/doc/Inforamtivni_dnevni/2014_Energy/NCP_meeting_140327_Energy_calls.pdf (Accessed June 2020).
Schlichte, F., Junge, S., Mammen, J., 2019. Being at the right place at the right time: does the timing within technology waves determine new venture successed? J. Bus. Econ. 89, 995–1021.
Schmidt, G.M., Druehl, C.T., 2008. When is a disruptive innovation disruptive? J. Prod. Innov. Manag. 25 (4), 347–369.
Schmidt, G., Bauer, S., Baur, T., Fleischmann, N., Kaltenbock, M., Leeuw, E., Matauschek, C., Matauschek, M., Nanu, C., Thurner, T., Misiga, P., Capitao, J., Schroeder, R., 2018. The European innovation partnership on water (EIP Water): approach and results to date (2012-2015). J. Clean. Prod. 171 S147–S148.
Schutte, C.F., Spencer, T., Aspden, J.D., Hanekom, D., 1987. Desalination and re-use of power plant effluents from pilot plant to full-scale application. Desalin. 67, 255–269.
Sedlak, D., 2014. Water 4.0: The past, present, and future of the world’s most vital resource. Yale University Press.
Severin, B.F., 1980. Disinfection of municipal wastewater effluents with ultraviolet light. J. Wat. Pollut. Contl. Fed. 52, 2007–2018.
Seviour, R. J., Mino, T., Onuki, M., 2003. The microbiology of biological phosphorous removal in activated sludge systems. FEMS Microbiol. Rev. 27, 99–127.

References
134
Siegel, S.M., 2019. Troubled water: what’s wrong with what we drink. St. Martin’s publishing group.
Simon, J.P., 2016. How to catch a Unicorn: An exploration of the universe of tech companies with high market capitalisation. JRC Technical Report. EUR 27822 EN, Institute for Prospective Technological Studies. https://ec.europa.eu/jrc/en/publication/how-catch-unicorn-exploration-universe-tech-companies-high-market-capitalisation?search (Accessed June 2020).
Solo-Gabriele, H., Neumeister, S., 1996. US outbreaks of Cryptosporidiosis. J. Am. Water Works Assoc. 88, 76–86.
Sood, A., Tellis, G.J., 2005. Technological evolution and product innovation. J. Marketing 69 (3), 152–168.
Sood, A., Tellis, G.J., 2011. Demystifying disruption: a new model for understanding and predicting disruptive technologies. Market. Sci. 30 (2), 339–354.
Speight, V. 2015. Innovation in the water industry: barriers and opportunities for the US and UK Utilities. WIREs WATER, 2 (4), 301–313.
Strous, M., Heijnen, J.J., Kuenen, J.G., Jetten, M.S.M., 1998. The sequencing batch reactor as a powerful tool for the study of slowly growing anaerobic ammonium-oxidising microorganisms. Appl. Microbiol. Biotechnol. 50, 589–596.
Suez, 2020. Our innovations: continuously improving technologies. https://www.suez.com/en/our-offering/local-authorities/what-are-you-looking-for/water-management/studies-and-engineering (Accessed June 2020).
Tanner, A.S., McIntosh, B.S., Widdowson, D.C.C., Tillotson, M.R., 2018. The water utility adoption model (wUAM): understanding influences of organisational and procedural innovation in a UK water utility. J. Clean. Prod. 171, S86–S96.
Tellis, G.J., 2006. Disruptive technology or visionary leadership? J. Prod. Innov. Manag. 23, 34–38.
Thomas, D.A., Ford, R.R., 2005. The crisis of innovation in water and wastewater. Edward Elgar Publishing Limited, Cheltenham, UK.
Thomond, P., Lettice, F., 2002. Disruptive innovation explored, in: 9th IPSE International Conference on Concurrent Engineering: Research and Applications (CE2002). A.A.Balkema Publishers, Lisse, The Netherlands, Vol. 9, 1021–1025.
USEPA, 1999. Wastewater technology fact sheet- sequencing batch reactors. EPA 832-F-99-073. https://www3.epa.gov/npdes/pubs/sbr_new.pdf (Accessed June 2020).
USEPA, 2001. Cryptosporidium: drinking water health advisory. EPA 822-R-01-009.https://www.epa.gov/sites/production/files/2015-10/documents/ cryptosporidium-report.pdf (Accessed June 2020).
USEPA, 2005. Long term 2 enhanced surface water treatment rule fact sheet. https://nepis.epa.gov/Exe/ZyPDF.cgi?Dockey=2000E999.txt (Accessed June 2020).

References
135
Ref
eren
ces
United Nations, 2016. Joint statement of the high level panel on water. World Bank Group https://sustainabledevelopment.un.org/content/documents/11296Joint%20Statement%20HLPW.pdf (Accessed June 2020).
United Nations, 2018. The United Nations World Water Development Report 2018. United Nations Educational, Scientific and Cultural Organization, New York, United States. www.unwater.org/publications/world-water-development-report-2018/ (Accessed June 2020).
United Nations, 2020. The sustainable development goals report. https://unstats.un.org/sdgs/report/2020/ (Accessed June 2020).
Van der Star, W. R., Abma, W. R., Blommers, D., Mulder, J. W., Tokutomi, T., Strous, M., Picioreanu, C., van Loosdrecht, M. C., 2007. Startup of reactors for anoxic ammonium oxidation: experiences from the first full-scale anammox reactor in Rotterdam. Water Res., 41, 4149–4163.
Vyakarnam, S., 2013. Emerging issues in technology management: global perspectives: the Need for and understanding of a technology commercialization framework. In Emerging Dimensions of Technology Management. Akhilesh, K. B., Ed.; Springer India: New Delhi; 1–16.
Wang, L.K., Li, Y., 2009. Sequencing batch reactors, in: Wang, L.K., Pereira, N.C., Hung, Y.T. (Eds.) Biological treatment processes. Handbook of Environmental Engineering, vol 8. Humana Press, Totowa, NJ.
Water Desalination Report (WDR), 2018. Global water market forecast from 2018 to 2023. www.desalination.com/articles/global-water-market-forecast-from-2018-to-2023 (Accessed Nov 2020).
WEF, 2019. World Economic Forum: WEF Global Risks Report 2019, 14th Edition. http://www3.weforum.org/docs/WEF_Global_Risks_Report_2019.pdf (Accessed June 2020).
Wehn, U., Montalvo, C., 2014. Knowledge transfer dynamics and innovation: behaviour, interactions and aggregated outcomes. In: Accepted for presentation at the 12th Globelics International Conference, 29-31 October. Addis Ababa, Ethopia.
Wehn, U., Montalvo, C., 2018a. Exploring the dynamics of water research innovation: Foundations for water innovation studies. J. Clean. Prod. 171.
Wehn, U. Montalvo, C., 2018b. Knowledge transfer dynamics and innovation: Behaviour, interactions and agreegrated outcomes. J. Clean. Prod. 171.
Wenger, E., White, N., Smith, J. D., 2009. Digital habitats: stewarding technology for communities. CPsquare: Portland, OR, U.S.A.
Wilderer, P.A., Irvine, R.L., Goronszy, M.C., 2001. Sequencing batch reactor technology. Scientific and Technical Report. IWA publishing, No 10.
Woods, J., Tipper, R., Brown, G., Diaz-Chavez, R., Lovell, J., de Groot, P., 2006. Evaluating the sustainability of co-firing in the UK. Report number URN 06/1960 produced for the Department of Trade and Industry, UK. http://www.appgwoodpanelindustry.org/docs/Sustainability%20of%20co-firing%20in%20the%20UK.pdf (Accessed June 2020).
References
136
World Health Organization (WHO) and the United Nations Children’s Fund (UNICEF), 2017. Progress on drinking water, sanitation and hygiene: 2017 update and SGD baselines. https://washdata.org/file/1116/download (Accessed June 2020).
World Health Organization (WHO), 2017. Public health, environmental and social determinants of health (PHE): Healthy environments, healthy people. The WHO department of public health, environmental and social determinants of health (PHE).
Xylem, 2019. Annual report pursuant to section 13 or 15(d) of the securities exchange act of 1934. http://www.annualreports.com/HostedData/AnnualReports/PDF/NYSE_XYL_2018.pdf (Accessed June 2020).
Yenkie, K.M., 2019. Integrating the three E’s in wastewater treatment: efficient design, economic viability, and environmental sustainability. Curr. Opin. Chem. Eng. 26, 131–138.
Zahran S., McElmurry, S.P., Kilgore, P.E., Mushinski, D., Press, J., Love, N.G., et al., 2018. Assessment of the Legionnaires’ disease outbreak in Flint, Michigan. Proc. Natl. Acad. Sci.115 (8), 1730–1739. https://doi.org/10.1073/pnas.1718679115.
Zhou, Y., Pijuan, M., Yuan, Z., 2007. Free nitrous acid inhibition on anoxic phosphorous uptake and denitrification by poly-phosphate accumulating organisms. Biotechnol. Bioeng. 98, 903–912.

References
137
Ref
eren
ces


AppendixDescription of water technologies
discussed in the thesis

Appendix
140
Biological Phosphorus Removal (BPR): In the Biological Phosphorus Removal process, activated sludge is recirculated through anaerobic and aerobic conditions. This generates favorable conditions for poly-phosphate accumulating organisms (PAOs) and their uptake of phosphorus from wastewater and store it within their cells. The main advantage of BPR is that addition of chemicals for phosphorus removal are not required.
Ceramic membrane filtration: Ceramic membranes are an alternative to hollow fiber ultrafiltration membranes. As opposed to polymeric compounds in UF membranes, ceramic membranes are made from inorganic materials (e.g. silicon carbide, titania or alpha-aluminium). Pore sizes usually range between 0.1-1 μm. The main advantages of ceramic membranes are their flux stability, mechanical durability and robustness in harsh environments (e.g. corrosive wastewater).
Dissolved air flotation (DAF): Dissolved air flotation is a solid-liquid separation process. The process includes the formation of micro bubbles (diameter 30-60 μm), which move organics and other relatively buoyant material to the surface of the water. Compared to conventional settling processes (e.g. sedimentation), DAF has a smaller footprint. DAF is used in municipal drinking and wastewater as well as industrial applications.
Granular activated sludge: The granular activated sludge process is a variation of the conventional activated sludge process, in which the biomass is manipulated to form spherical sludge granules. The granules have aerobic, anaerobic and anoxic layers and thus perform simultaneous nutrient removal. Advantages to the conventional activated sludge process are better sludge settling, biomass retention, and smaller footprint and reduced energy requirements.
Membrane aerated biofilm (MABR) reactor: The membrane aerated biofilm reactor is an advancement of biological wastewater treatment. The technology includes a gas permeable membrane through which oxygen is delivered directly to the microorganisms that form a biofilm on the membrane surface. This increases the oxygen transfer efficiency, which leads to less aeration energy requirements and increased nitrogen removal. MABR reactors can be retrofitted into existing wastewater treatment plants.
Moving bed bioreactor (MBBR): The moving bed bioreactor is an alternative to the conventional activated sludge process. Cylindrically shaped plastic media are suspended in the reactor and serve as biofilm formation sites (i.e. attached growth). MBBRs can reduce the footprint, increase treatment capacity compared to conventional biological treatment, do not require sludge recirculation and can be retrofitted into existing systems. MBBRs are applied in municipal and industrial wastewater treatment applications.
Membrane bioreactors (MBR): Membrane bioreactors combine biological treatment with micro-/ultrafiltration membranes to achieve secondary and tertiary treatment in one system. MBRs provide nutrient removal and effluent polishing of wastewater in

Description of water technologies discussed in the thesis
141
App
endi
x
one system and therefore can reduce the required footprint compared to conventional treatment systems.
Microbial encapsulation: Microbial encapsulation is the practice of concentrating beneficial microbes used in water and wastewater treatment processes into polymer “cages” or capsules. The value proposition of microbial encapsulation is limited or no sludge production, increased treatment capacity, protection of the microbes from competing organisms, shock loads or toxicity. Application can be in drinking and wastewater treatment, especially for nitrogen removal.
Phosphorus recovery as struvite: Traditionally, phosphorus was removed from the wastewater stream and recovered in the form of sewage sludge, which was directly applied to arable land. Phosphorus from the sludge de-watering streams can be recovered as a solid mineral product, known as struvite (magnesium ammonium phosphate, NH4MgPO4·6 H2O), through precipitation or crystallization. Struvite can potentially be marketed as a high value slow release fertilizer.
Polymeric hollow-fiber membranes: Polymeric hollow-fiber (HF) membranes were developed to achieve particle removal beyond conventional depth media filtration. The use of polymeric HF membrane filtration provided an absolute filtration cut-off point in terms of the size of particles that were excluded. These membranes are widely used especially in drinking water treatment.
Sequencing Batch Reactors (SBR): A Sequencing Batch Reactor (SBR) is a wastewater treatment technology based on the activated sludge process that uses suspended bacterial growth in an aerated reactor to achieve BOD removal. The key innovation of the SBR technology was the use of timed cycles to enable solids separation to be achieved by allowing a quiescent phase in the aeration basin where solids were allowed to separate and were removed from the bottom of the tank using a decanter. The ability to perform multiple unit processes in a single tank using a timed control sequence provided a number of valuable advantages over conventional activated sludge technology such as reduction in capital costs and reduced footprint by eliminating the secondary clarifier.
Sludge thermal hydrolysis: Sludge thermal hydrolysis is a sludge pre-treatment process. It uses high pressure and temperatures (100-180°C) to achieve cell lysis of activated sludge. This makes organic compounds easier available for anaerobic digestion and thus increases the yield of biogas. The main potential of thermal hydrolysis is the increased conversion of sludge volatile solids to methane gas (i.e. biogas) during the anaerobic digestion process.
TFC reverse osmosis membranes: Thin film composite (TFC) membranes were developed in the late 1970s to replace cellulose acetate as the dominant membrane chemistry used in reverse osmosis seawater desalination. TFC membranes consist of thin

Appendix
142
layers of polyamide and polysulfones. Existing companies using existing manufacturing techniques handled the change in chemistry.
THIOPAQ biogas treatment: THIOPAQ is a technology used for the removal of hydrogen sulphide from biogas through biological oxidation to elemental sulphur. This technology enables the extraction of biosulphur from natural gas, landfill gas or biogas. The biosulphur is suited for use as fertilizer or fungicide as it is more bioavailable to crops than chemically produced sulphur. The technology originates from the company Paques that offers THIOPAQ to treat biogas from anaerobic digestion. Its licensee Paquell offers the technology in oil and gas applications.
Ultrafiltration (UF) membrane: Ultrafiltration is a separation technology for fine particulates, bacteria and viruses. In commercial products, pore sizes range between 0.01 and 0.02 μm (i.e. 10 to 20 nm). UF is used for virus removal in drinking water, pre-treatment in reverse osmosis processes and surface and groundwater treatment.
Ultraviolet (UV) water disinfection: Ultraviolet water disinfection is an alternative to chlorine disinfection. UV light at wavelengths between 240 and 280 nm inactivates microorganisms (such as bacteria, viruses and protozoa) by irreversible damages to the DNA. UV light provides a means of inactivating Cryptosporidium oocysts and Giardia cysts which are resistant to chlorine disinfection. The properties of UV light provides a means to disinfect water without chemical addition and formation of disinfection by-products.
Upflow anaerobic sludge blanket (UASB): UASB is an anaerobic treatment process operated in an upward flow. These flow conditions generate a granular sludge blanket and anaerobic conditions. In this environment, organics in the wastewater are digested to biogas while the wastewater is treated. The main advantages of the UASB process are a high organic removal rates, low sludge production and high treatment capacities. Main application areas are in industrial wastewater treatment.

Description of water technologies discussed in the thesis
143
App
endi
x


Summary

Summary
146
Water scarcity is driving change and innovation in the water sector. This will require new thinking and new approaches. The water challenges are presented in Chapter 1, highlighting the need for a better understanding of the water innovation process to contribute towards more effective and efficient use of capital in research and development (R&D) and a higher rate of successful innovation diffusion. The rate of innovation and technology uptake in the water sector is often reported as being relatively slow due to the conservative nature of the industry. The field of water technology is explained in this chapter with the help of the ‘water technology taxonomy’ developed by BlueTech Research. The purpose of this thesis is to give the scientific community and the community of global water professionals and policy makers, a framework for shared discussion. The challenges faced by such stakeholders i.e. an investor or an end-user and how this thesis can benefit them is also explained. The main objective is to examine the area of water technology innovation, using empirical data, and to adapt and build models specifically for the water industry.
A key output of Chapter 2 is the development of detailed definitions for each stage of Water Technology Adoption (WaTA) model: Applied Research, Pilot Stage (Innovators), Demonstration (Innovators), Early Adopters, Early and Late Majority and Maturity Stage. The proposed model, including the criteria for assigning a technology to a specific stage, activities undertaken in this stage, objectives and outcomes, duration of this particular stage and the corresponding stage in other models i.e. Technology Adoption Life Cycle TALC (bell curve), are suitable for the study of water technology adoption. This will be foundational for future analysis of different types of water technologies. One of the key findings is that it is possible to develop generalized timelines for successful technology commercialization. Analysis indicates that from the year that pilot testing commences to when the technology is moving into the Early Majority section of the market and is commercialized, can take in the region of 11 to 16 years. This needs to be considered by any companies that are actively seeking to introduce a new technology to the water market. Having established timelines that are reasonable and typical, the author believes that this sets an important benchmark against which velocity, or rate, of progress can be measured. Another important conclusion arising is that velocity, or the rate, at which technologies move through the process of dissemination and adoption is an important metric to track and analyze, and that the extent of any deviation from these industry averages can be an indication of potential failures in this process. Because of the nature of the definitions, there will be a degree of subjectivity in the use of this model, and it is possible for a technology to straddle adjacent categories.
Chapter 3 focuses on measuring the rate of adoption either measured as the number of full-scale plants built per year or cumulative installed capacity over time. Six water technology innovations in the last 30 years are studied with the aim of analysing the respective timelines for moving through various stages of water technology

Summary
147
Sum
mar
y
commercialisation. These technologies are then categorised either as crisis/need driven adoption or value driven adoption category. The three Crisis / Needs Driven innovations – Ultraviolet Disinfection, Biological Phosphorus Removal and Ultrafiltration Drinking Water – had a crisis or market need to accelerate adoption, whereas Sludge Thermal Hydrolysis and THIOPAQ had an inherent advantage over the existing technologies used, based on factors such as capital cost savings, operational cost savings, smaller footprint, and life-span of the technology. An exception is the Sequencing Batch Reactor (SBR) technology, which could be viewed as a combination of both Value Driven and Need Driven Adoption because the technology had an advantage over incumbent technology, and there was a regulatory driver for nutrient removal that favored the use of SBR technology as a method of achieving nitrification and denitrification. In the water sector, the adoption of a water technology that is driven based on its value proposition takes in the region of 12.4 years to move through the Innovators and Early Adopters stages of the market and reach the Early and Late Majority. In the case of a technology whose adoption is driven by a crisis or market need, such as a new piece of legislation, or an urgent health or environmental issue, the time timeline can be half of this, in the region of 6.5 years.
The fragmented nature of the global water market, long replacement cycles for existing technologies and the market growth dependence on population increases and new regulation all contribute to the slow technology diffusion rates and low disruption in the water sector. Chapter 4 is a critical review to the fact that innovation is required in water, that innovation as it relates to water is understudied, and that the concepts behind Disruptive Innovation Theory have lost their meaning due to overuse, mainly out of context, and that a practical framework is required to facilitate meaningful academic and industry discussion. If certain types of innovation have led to market disruption and market creation, other innovation frameworks like the Innovation Diffusion Theory which is more practical and useful than the Disruptive Innovation Theory should be used as analogues when evaluating the potential of new technologies. Three types of innovation are defined: sustaining, radical functionality and discontinuous, where sustaining innovation take market share away from existing technologies and the later two create new markets and unlock non-consumption. This framework is proposed to inform investment strategy in water and provide a clear and objective basis and framework for academic discussion of water technology innovation.
A novel framework to measure level of market impact for water technologies is presented in Chapter 5. Three levels are defined, with the highest level being Level 1 – Unicorn Technologies, the lowest being Level 3 – Horse Technologies, and in between Level 2 – Lion Technologies. These levels are measured using three criteria: total number of reference plants in operation, total number of countries in which the technology is used in and total annual market value that the technology represents. Eleven technology

Summary
148
case studies are investigated against this framework to understand each technology’s impact on the market. The Water Technology Adoption (WaTA) model in Chapter 2 found that it could take 17–24 years for a technology to move from the Innovators section of the market adoption curve to when it is in the middle segment of the Early and Late Majority. The findings of this chapter, that quantify levels of market impact, are in keeping with this timeline. It is possible to measure level of market impact comparatively across different water technologies using the proposed framework and this will facilitate objective conversation and discussion around the disruptive effects of new water technologies in terms of rates of adoption and impact.
Chapter 6 summarizes and discusses the contributions and key ideas of Chapters 2 to 5. Important to those who invest in developing innovations is the link between the innovation and the market. Understanding these links helps innovators, researchers, adopters and investors to understand the likely commercial impact, how it should be commercialized and diffused, the typical time required, investment required, who is best placed to take on technology diffusion, and relative rates of success and risks associated with bringing these innovations to market. Each of the three types of innovation, Radical Functionality, Discontinuous and Sustaining, can be assigned to a technology based on the innovation characteristics prior to technology diffusion. The Innovation type can however then be compared to other analogues for this type of innovation to set realistic expectations as they are all very different from one another.

Summary
149
Sum
mar
y


Dedication Acknowledgements

152
Dedication
Dedication
To everyone in water sector, who works tirelessly in a committed way to provide access to water and sanitation for all and safeguard our environment. Human beings derive happiness from working together towards a common, shared goal. I can think of nothing better to be a part of than helping provide access to, and safeguarding, our most precious resource.
To my family Jean, Eoin, Katie and Rosie, who laugh at my endless interest in water, and listen patiently to me talking passionately about this for longer than they care to listen sometimes! Their support means a lot to me and I appreciate how proud they are of me.

153
Acknowledgements
Acknowledgements
The author would like to extend a special thanks to all the BlueTech team without whose support, this thesis would not have been possible. This thesis is really the culmination of over a decade of work undertaken by BlueTech Research that provided the underlying research foundational to this thesis. I would like to thank Jeff Guild, who has been a companion, friend and mentor on my journey to understand water technologies. Stefan Urioc and Tyler Algeo, who were there in the early days of the very first papers will be happy to see this finally published! Sarah Condon, Annmarie Brady and Divya Inna who help lead the BlueTech practice forward in serving our community. Rhys Owen has worked his editing magic on every paper and brought his mastery of language to bear.
A very special thanks to my constant companion on this journey, Dr. Lakshmi Adapa, whose positivity, encouragement and unwavering dedication was one of the key driving forces to completing this body of work. I look forward to continued collaboration with Lakshmi on further research!
I would like to thank my Promotor, Professor Cees Buisman, for encouraging me from the outset to believe that this was possible, helping to find a path and guiding me on my journey.
I would like to extend a special note of sincere gratitude and thanks for the support of the many people who contributed by sharing data for case studies and offering their insights into different technology areas. I felt at times, that I had the support of the entire water industry, willing this thesis forward into existence! I was incredibly lucky to have had access to the some of the brightest and most talented people in the field of water, all whom were genuinely interested and engaged in the questions I was seeking to answer and I felt were part of the team working on this.
I enjoyed the countless conversations and the spirit of collegiality. I hope that I have been respectful of your contributions in producing this body of work.
In no particular order, I would like to thank: Hank Vander Laan, Founder, Trojan UV, Marvin De Vries, Former CEO Trojan UV, James L. Barnard, Global Practice and Technology Leader, Black and Veatch, Paul Cardinal, President, Austgen BioJet, Graeme Pearce, Principal, Membrane Consultancy Associates, Per Nielsen and Keith Panter, CAMBI, Andrew Benedek, Founder, Zenon Membranes, Mark Wilf, RO Technology Associates, Barry Liner and Eileen O’Neill, Water Environment Federation (WEF), Glen Daigger, University of Michigan, David Sedlak, UC Berkeley, Menno Holterman and Arie Kluit, Nijhuis Industries, Dennis Totzke, Applied Technologies, Inc., Rene Rozendal, Paques, Mark van Loosdrecht, TU Delft, Steven Kloos, True North Venture Partners, Helge Daebel, Emerald Technology Ventures, Rafael Simon and Ahren Britton, Ostara, Oliver Lawaal, Jim Cosman,

154
Acknowledgements
Aquisense, Simon Judd, Cranfield Water Science Institute, Mike Adkins, Independent Water Treatment Consultant, Jan Klok, Paqell, and many others no doubt who all contributed ideas and inspiration that found their way into my thinking and informed this thesis.
I would like to thank my Mom and Dad for always supporting whatever it is I am doing in life. I wouldn’t be here were it not for that. My Dad in particular refers to my PhD as the ‘final terminus’.

155
Acknowledgements


About the Author List of Publications

158
About the Author
About the Author
Paul is a water scientist, thought-leader and doc-umentary fi lm producer.
Following completion of a Bachelor of Science i n Bio-Chemistry at University College Cork, Paul travelled across Asia and volunteered for World Wildlife Fund (WWF) in Malaysia, where he became interested in the relationships between forests and water. Th is experience inspired Paul to take a Masters degree at Edinburgh Napier University where he studied Water Resource Management. After successfully completing this Masters degree, Paul’s fi rst role was for the Body Shop working alongside the pioneering environmentalist Anita Roddick. Her vision for corporate sustainability was well ahead of its time and Paul worked on a “Living Machine” project designed to purify water naturally. Paul subsequently returned to Malaysia to work on a research project that investigated how deforestation was impacting water quality.
Paul’s next role was working for Atkins, a leading global engineering management consultancy renowned for its pioneering approaches to projects. It was while working as an environmental scientist on pilot testing of new technologies, that Paul fi rst noticed how extraordinarily long it took to get water technologies to market, which gave him the initial idea for BlueTech Research.
Paul relocated to Vancouver, Canada in 2002 and worked with leading technology company, Noram Engineering and up and coming water technology start-up company, Ostara. Paul founded a consulting practice, O2 Environmental, focused on advising early stage water technology companies on go-to-market strategy, carrying out due diligence studies for venture capital investors and ultimately providing merger and acquisition support and strategic advice on portfolio synergies for large water technology fi rms.
BlueTech Research was founded by Paul in 2011, to provide actionable intelligence in the fi eld of water technology markets and is now a global leader with Blue-chip clients on 5 continents representing leading water utilities, Fortune 500 Corporates, Technology fi rms, Investment groups and research institutes.
Th e desire to gain deeper insights into the dynamics of water technology innovation provided the impetus for Paul to undertake his PhD in Water Innovation at Wagenin-gen University.

159
About the Author
Paul’s latest project is a documentary film called “Brave Blue World.” The film is designed to increase awareness of existing solutions to the water crisis and Paul co-produced this groundbreaking film, which has attracted support from a host of A-list celebrities. It is now available to view globally in 29 languages on Netflix.
He advises global Fortune 500 corporates such as L’Oréal, Coca Cola, Unilever and Proctor and Gamble on their water strategy policies. He has also guest lectured on water at Harvard and Cambridge Universities and addressed a live audience of 15,000 people alongside Jaden Smith at Web Summit 2020 in Lisbon.
Paul divides his time between the BlueTech Research offices in Vancouver and Cork where he lives fittingly by the sea with his wife Jean and his three children – Eoin, Katie & Rosie. In his free time, he is a keen pianist and enjoys kayaking, ocean swimming and free diving.

160
List of Publications
List of Publications
Peer reviewedO’Callaghan, P., 2008. Decentralised wastewater management - a solution to infrastruc-ture bottlenecks? Eng. J., 62, 448–450.
O’Callaghan, P., Daigger, G., Adapa, L. & Buisman, C., 2018. Development and application of a model to study water technology adoption. Water Environ. Res. 90, 563–574.
O’Callaghan, P., Adapa, L.M., Buisman, C., 2019. Analysis of adoption rates for needs driven versus value driven innovation water technologies. Water Environ. Res. 91, 144–156.
O’Callaghan, P., Adapa, L.M., Buisman, C., 2020. How can innovation theories be applied to water technology innovation? J. Clean Prod. 276, 122910.
Other publicationsKwok, S. C., Lang, H., O’Callaghan, P., Stiff, M., 2010. Water technology markets 2010: key opportunities and emerging trends. Media Analytics Ltd., Oxford.
Roa, D.V., O’Callaghan, P., Value of Water Coalition, 2014. The value of water: a compendium of essays by smart CEOs. Vincent Roa Group, LLC.
Under reviewO’Callaghan, P., Adapa, L.M., Buisman, C., 2020. A novel framework to measure the level of impact of new water technologies. J. Clean Prod. (Submitted)


Cover design: Fenna Schaap | Fennaschaap.nlLayout: Renate Siebes | Proefschrift.nuPrinted by: ProefschriftMaken.nl
The research described in this thesis was financially supported by BlueTech Research.
Financial support from Wageningen University for printing this thesis is gratefully acknowledged.

Paul O’Callaghan
Dynamics of Water Innovation
Paul O’Callaghan
Dynamics of Water InnovationInsights into the rate of adoption, diffusion and
success of innovative water technologies globally