Embed Size (px)
Citation preview
Dynamics of surface-aligned photochemistry. III. A quantum mechanical study of the photodissociation of HBr(ad)/LiF(OOl)
V. J. Barclay, J. C. Polanyi, and Y. Zeiria) Department of Chemistry. University of Toronto, 80 St. George St., Toronto, Ontario M5S’ IAI, Canada
FL Kosloff Department of Physical Chemistry, The Fritz Haber Research Center for Molecular Dynamics, The Hebrew University of Jerusalem, Jerusalem 91904, Israel
(Received 2 November 1992; accepted 18 February 1993)
A quantum mechanical probe of surface and adsorbed layer structure is presented based on the photodissociation of ordered hydrogen halide adsorbates. The photolysis of the adsorbate molecule released atomic hydrogen which scattered from the surface as well as from neighboring adsorbed molecules. The coherent character of the hydrogenic wave function formed in the photodissociation process proved to be a revealing probe of the surface and of nearby adsorbates by way of localized atomic scattering (LAS). The dynamics of the H-atom motion were modeled by the time-dependent Schriidinger equation. This study includes two-dimensional simulations of the photodissociation of a single HBr molecule adsorbed on LiF(OO1) as well as photodissociation in full mono-layer and bilayer systems. It was found that for photolysis of an isolated adsorbate molecule, depending on the separation of the adsorbate from the surface, the angular distribution showed either a single specular peak (small z) or diffraction (larger z), while for higher coverage a series of diffraction peaks as well as peaks which corresponded to trapped unstable periodic orbits were observed. The quantization rules of these periodic orbits were identified and served as a link between the observed angular distribution and the structure of the adsorbed layer(s) .
I. INTRODUCTION
In recent years, the interaction of W radiation with adsorbed species on various substrates has become an ac- tive area of research.’ Such an interaction may lead to a variety of outcomes, including photodissociation, photore- action, and photodesorption. In the case of adsorbate pho- todissociation, the photofragments have been observed in dynamical studies to scatter from the surface into the vac- uum. The scattering of these photofragments can involve both collisions with the substrate and with other adsor- bates prior to desorption. This latter effect evidences itself in a broadening of energy and angular distributions,2 as well as in adsorbate photoreaction.’ If the adsorbates are aligned, oriented, and positioned in a pattern with respect to the surface, the angular and translational energy distri- butions of the scattered photofragments should show inter- ference effects. This is particularly likely to be true if one of the photofragments is a light atom such as hydrogen. The diffraction should reveal the structure of the surface and, at higher coverage, that of the adsorbed layer.
A number of studies have been reported in which a hydrogen-containing adsorbate was photodissociated. Two of these studies were related to HBr (Ref. 2) and H2S (Ref. 3) adsorbed on an LiF(OO1) surface. In both these studies the photon-adsorbate interaction resulted in the formation of atomic hydrogen which was detected in the gas phase. Translational energy and angular distributions of the desorbing H-atoms differed markedly from those for
“Present address: Department of Physics, N.R.C.N. P.O. Box 9001, Beer-Sheva Israel 84190.
gas-phase photodissociation. These differences were attrib- uted to interactions with the substrate and the coadsorbed species.2’3 Angular distributions, which were being mea- sured for the first time, were not measured with the preci- sion required to reveal diffraction patterns.
The present work is complementary to three- dimensional (3D) stochastic classical trajectory (SCT) studies which constitute parts II, IV, V, and VI of this series of papers on the theory of HBr/LiF(OOl > photodis- sociation dynamics.&’ Paper II of this series deals with nonreactive scattering of H from the surface, paper IV deals with reactive and nonreactive scattering of H from co-adsorbed molecules up to one monolayer and from the surface. Paper V extends this study into HBr multilayers, where photolysis can occur in the first or higher layers. Paper VI considers other hydrogen halides. The present work, involving a two-dimensional (2D) quantum me- chanical treatment of H-atom scattering, is intended to answer two questions: (i) Is the classical treatment of H scattering in other parts of this study a reasonable approx- imation; and (ii) what are the qualitative quantum me- chanical features expected from the potential which has, for the SCT case, given a reasonable simulation? In this respect, the present work continues, and may be contrasted to, an earlier quantum study of a model system8 related to recent experimental work.2,3 Quantum effects in the distri- butions of the photodissociation products were shown in the earlier study to be a sensitive probe of both surface and adsorbed layer characteristics.* The present work extends Ref. 8 to the case of a realistic potential for HBr(ad j/ LiF( 001) and compares the findings to classical studies to
J. Chem. Phys. 98 (1 I), 1 June 1993 0021-9606/93/i 1918514$06.00 @ 1993 American Institute of Physics 9185 Downloaded 15 Sep 2002 to 132.64.1.37. Redistribution subject to AIP license or copyright, see http://ojps.aip.org/jcpo/jcpcr.jsp
9186 Barclay et al.: Surface-aligned photochemistry. Ill
be found in parts II and IV of this series.495 In conformity with earlier usage,4 we denote this type of scattering study, in which the scattered atom interacts with a restricted re- gion on the surface, as localized atomic scattering (LAS).
In the following we shall briefly compare the main features of the LAS approach with thermal energy atomic scattering (TEAS) which is a widely used method for the study of the structure of the outermost layer of clean and adsorbate-covered crystalline surfaces constitutes.g-23 In these experiments, an approximately monoenergetic well- collimated atomic or molecular beam of light particles (i.e., H- or He-atoms or H, molecules) is scattered off the surface under investigation. A monoenergetic beam with a well-defined direction can be described quantum mechan- ically as a plane wave with known initial wave vector k. It should be noted that the long coherence length of such a plane wave is the reason why TEAS is a sensitive probe of long-range order.‘27’3 The interaction of this plane wave with the surface or the adsorbate layer leads to a scattered superposition of plane waves. The periodicity of the surface or the adsorbed layer imposes a selection rule on Akll which leads to the appearance of diffraction peaks.
Br Br (&J&s& H
Li+ F- Li+ F-
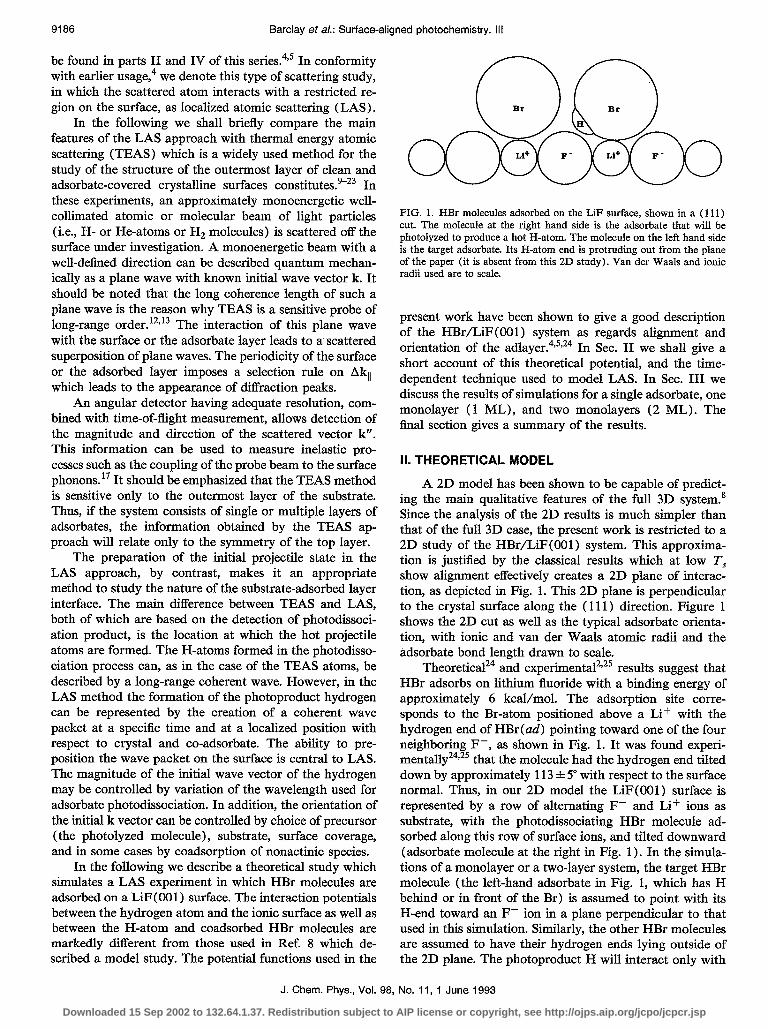
FIG. 1. HBr molecules adsorbed on the LiF surface, shown in a (111) cut. The molecule at the right hand side is the adsorbate that will be photolyzed to produce a hot H-atom. The molecule on the left hand side is the target adsorbate. Its H-atom end is protruding out from the plane of the paper (it is absent from this 2D study). Van der Waals and ionic radii used are to scale.
An angular detector having adequate resolution, com- bined with time-of-flight measurement, allows detection of the magnitude and direction of the scattered vector k”. This information can be used to measure inelastic pro- cesses such as the coupling of the probe beam to the surface phonons.” It should be emphasized that the TEAS method is sensitive only to the outermost layer of the substrate. Thus, if the system consists of single or multiple layers of adsorbates, the information obtained by the TEAS ap- proach will relate only to the symmetry of the top layer.
present work have been shown to give a good description of the HBr/LiF( 001) system as regards alignment and orientation of the adlayer.4,5,24 In Sec. II we shall give a short account of this theoretical potential, and the time- dependent technique used to model LAS. In Sec. III we discuss the results of simulations for a single adsorbate, one monolayer ( 1 ML), and two monolayers (2 ML). The final section gives a summary of the results.
II. THEORETICAL MODEL
The preparation of the initial projectile state in the LAS approach, by contrast, makes it an appropriate method to study the nature of the substrate-adsorbed layer interface. The main difference between TEAS and LAS, both of which are based on the detection of photodissoci- ation product, is the location at which the hot projectile atoms are formed. The H-atoms formed in the photodisso- ciation process can, as in the case of the TEAS atoms, be described by a long-range coherent wave. However, in the LAS method the formation of the photoproduct hydrogen can be represented by the creation of a coherent wave packet at a specific time and at a localized position with respect to crystal and co-adsorbate. The ability to pre- position the wave packet on the surface is central to LAS. The magnitude of the initial wave vector of the hydrogen may be controlled by variation of the wavelength used for adsorbate photodissociation. In addition, the orientation of the initial k vector can be controlled by choice of precursor (the photolyzed molecule), substrate, surface coverage, and in some cases by coadsorption of nonactinic species.
A 2D model has been shown to be capable of predict- ing the main qualitative features of the full 3D system.’ Since the analysis of the 2D results is much simpler than that of the full 3D case, the present work is restricted to a 2D study of the HBr/LiF( 001) system. This approxima- tion is justified by the classical results which at low T, show alignment effectively creates a 2D plane of interac- tion, as depicted in Fig. 1. This 2D plane is perpendicular to the crystal surface along the ( 111) direction. Figure 1 shows the 2D cut as well as the typical adsorbate orienta- tion, with ionic and van der Waals atomic radii and the adsorbate bond length drawn to scale.
In the following we describe a theoretical study which simulates a LAS experiment in which HBr molecules are adsorbed on a LiF( 001) surface. The interaction potentials between the hydrogen atom and the ionic surface as well as between the H-atom and coadsorbed HBr molecules are markedly different from those used in Ref. 8 which de- scribed a model study. The potential functions used in the
Theoretical24 and experimental2P25 results suggest that HBr adsorbs on lithium fluoride with a binding energy of approximately 6 kcal/mol. The adsorption site corre- sponds to the Br-atom positioned above a Li+ with the hydrogen end of HBr(ad) pointing toward one of the four neighboring F-, as shown in Fig. 1. It was found experi- mentally 2492s that the molecule had the hydrogen end tilted down by approximately 113 f 5” with respect to the surface normal. Thus, in our 2D model the LiF(OO1) surface is represented by a row of alternating F- and Lif ions as substrate, with the photodissociating HBr molecule ad- sorbed along this row of surface ions, and tilted downward (adsorbate molecule at the right in Fig. 1) . In the simula- tions of a monolayer or a two-layer system, the target HBr molecule (the left-hand adsorbate in Fig. 1, which has H behind or in front of the Br) is assumed to point with its H-end toward an F- ion in a plane perpendicular to that used in this simulation. Similarly, the other HBr molecules are assumed to have their hydrogen ends lying outside of the 2D plane. The photoproduct H will interact only with
J. Chem. Phys., Vol. 98, No. 11, 1 June 1993
Downloaded 15 Sep 2002 to 132.64.1.37. Redistribution subject to AIP license or copyright, see http://ojps.aip.org/jcpo/jcpcr.jsp
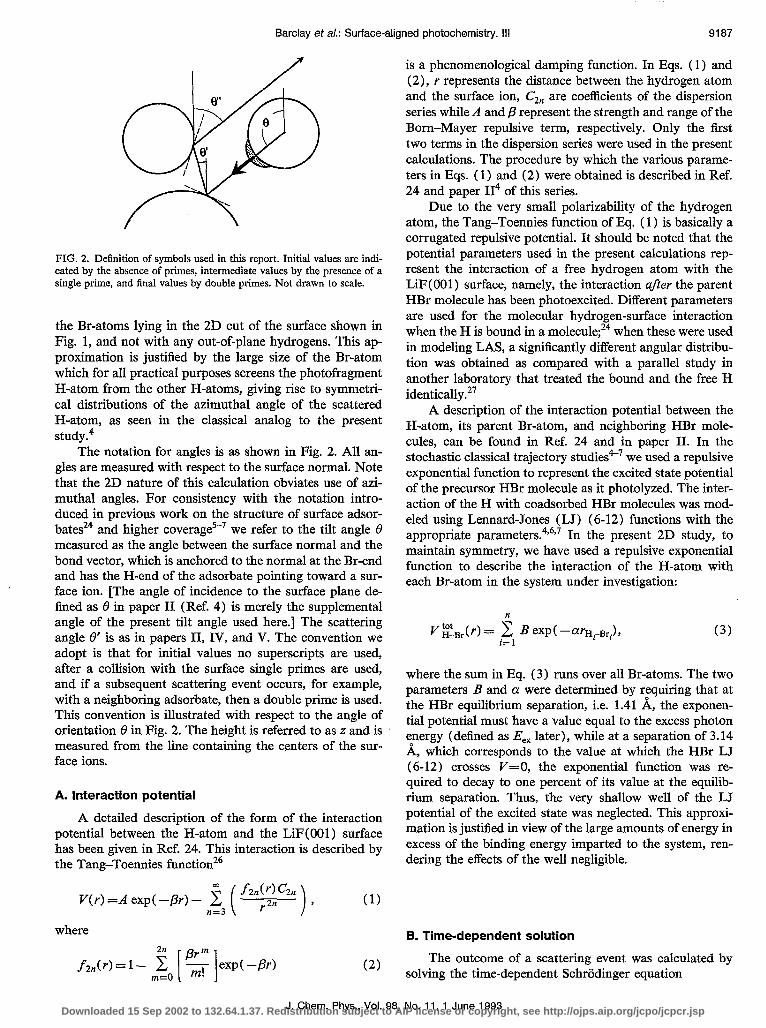
FIG. 2. Definition of symbols used in this report. Initial values are indi- cated by the absence of primes, intermediate values by the presence of a single prime, and final values by double primes. Not drawn to scale.
the Br-atoms lying in the 2D cut of the surface shown in Fig. 1, and not with any out-of-plane hydrogens. This ap- proximation is justified by the large size of the Br-atom which for all practical purposes screens the photofragment H-atom from the other H-atoms, giving rise to symmetri- cal distributions of the azimuthal angle of the scattered H-atom, as seen in the classical analog to the present study.4
The notation for angles is as shown in Fig. 2. All an- gles are measured with respect to the surface normal. Note that the 2D nature of this calculation obviates use of azi- muthal angles. For consistency with the notation intro- duced in previous work on the structure of surface adsor- batesz4 and higher coverage5-7 we refer to the tilt angle 19 measured as the angle between the surface normal and the bond vector, which is anchored to the normal at the Br-end and has the H-end of the adsorbate pointing toward a sur- face ion. [The angle of incidence to the surface plane de- iined as 8 in paper II (Ref. 4) is merely the supplemental angle of the present tilt angle used here.] The scattering angle 8’ is as in papers II, IV, and V. The convention we adopt is that for initial values no superscripts are used, after a collision with the surface single primes are used, and if a subsequent scattering event occurs, for example, with a neighboring adsorbate, then a double prime is used. This convention is illustrated with respect to the angle of orientation 8 in Fig. 2. The height is referred to as z and is measured from the line containing the centers of the sur- face ions.
A. Interaction potential
A detailed description of the form of the interaction potential between the H-atom and the LiF(OO1) surface has been given in Ref. 24. This interaction is described by the Tang-Toennies functionz6
V(r) =A exp( -fir) -
where
(1)
f2ntr>=l- m.. [‘G ]exp(-@) (2)
Barclay et a/.: Surface-aligned photochemistry. III 9187
is a phenomenological damping function. In Eqs. ( 1) and (2), r represents the distance between the hydrogen atom and the surface ion, C,, are coefficients of the dispersion series while A and fl represent the strength and range of the Born-Mayer repulsive term, respectively. Only the first two terms in the dispersion series were used in the present calculations. The procedure by which the various parame- ters in Eqs. (1) and (2) were obtained is described in Ref. 24 and paper II4 of this series.
Due to the very small polarizability of the hydrogen atom, the Tang-Toennies function of Eq. ( 1) is basically a corrugated repulsive potential. It should be noted that the potential parameters used in the present calculations rep- resent the interaction of a free hydrogen atom with the LiF( 001) surface, namely, the interaction after the parent HBr molecule has been photoexcited. Different parameters are used for the molecular hydrogen-surface interaction when the H is bound in a molecule;24 when these were used in modeling LAS, a significantly different angular distribu- tion was obtained as compared with a parallel study in another laboratory that treated the bound and the free H identically.27
A description of the interaction potential between the H-atom, its parent Br-atom, and neighboring HBr mole- cules, can be found in Ref. 24 and in paper II. In the stochastic classical trajectory studiesk7 we used a repulsive exponential function to represent the excited state potential of the precursor HBr molecule as it photolyzed. The inter- action of the H with coadsorbed HBr molecules was mod- eled using Lennard-Jones (LJ) (6-12) functions with the appropriate parameters.4p6’7 In the present 2D study, to maintain symmetry, we have used a repulsive exponential function to describe the interaction of the H-atom with each Br-atom in the system under investigation:
II
G&j,(r) = c B ew(-arHrFBri), i=l
where the sum in Eq. (3) runs over all Br-atoms. The two parameters B and a were determined by requiring that at the HBr equilibrium separation, i.e. 1.41 A, the exponen- tial potential must have a value equal to the excess photon energy (defined as E,, later), while at a separation of 3.14 A, which corresponds to the value at which the HBr LJ (6-12) crosses V=O, the exponential function was re- quired to decay to one percent of its value at the equilib- rium separation. Thus, the very shallow well of the LJ potential of the excited state was neglected. This approxi- mation is justified in view of the large amounts of energy in excess of the binding energy imparted to the system, ren- dering the effects of the well negligible.
B. Time-dependent solution
The outcome of a scattering event was calculated by solving the time-dependent Schrodinger equation
J. Chem. Phys., Vol. 98, No. 11, 1 June 1993 Downloaded 15 Sep 2002 to 132.64.1.37. Redistribution subject to AIP license or copyright, see http://ojps.aip.org/jcpo/jcpcr.jsp
ifi ay(&st)
at =s?Y!(x,z,t)
58 = -z v2+ V(w) Y(x,st) (4)
H
for the H-atom using a Hamiltonian with the potential described earlier. Note that the Hamiltonian does not pro- vide for motion of particles other than atomic H; the sur- face cannot therefore be involved in energy transfer. By contrast, the Br-atom and energy transfer to the substrate were included in all the classical studies.4-7
The photodissociation process as assumed to be initi- ated by an infinitely short laser pulse. According to the Franck-Condon principle, a short pulse corresponded to a vertical transition from the ground state to the excited electronic state.” By the uncertainty principle, the use of an intinitely short pulse meant that a full range of frequen- cies was applied. As a result, care must be taken in the interpretation of the wave function since Y(t) is not the energy-resolved wave packet formed experimentally.* A more rigorous treatment of the time evolution can be ob- tained if the nature of the electronic state and the transition dipole moment to it are well-understood.”
The initial wave function on the upper potential de- scribing the H-atom, Y (t=O), was represented by a 2D Gaussian wave packet. This approximation of Y (t=O) as- sumed a harmonic potential for the ground state of the HBr molecule and a linear form of the potential for the excited state, as previously discussed.*
Initially, the hydrogen atom was assumed to have zero momentum. The photon energy, E(h), excites the mole- cule to the repulsive state, hence, it must provide electronic excitation energy and overcome the H-surface repulsion:
E(hv) =E’(h) + vH-su,f, (5)
where the last term is V(r) in Eq. ( 1). As the atoms separate, the excess energy
E,,=E’(hv) -D,(H-Br) (6)
is converted into translational energy, ET (which we su- perscript with a prime symbol according to the number of collisions that have occurred, usually two in the present study). Here, O,( H-Br ) is the bond dissociation energy of HBr. At infinite separation EF=E,,. Note that it is this final translational energy which is denoted as E& and that E,, and EF are not necessarily equivalent. Only one exci- tation wavelength is chosen, corresponding to only one excess energy, whereas the post-scattering wave function covers much of (k,,k,) in the momentum plane and con- sequently has a range of translational energies. Hence, the asymptotic momentum picture leads to the identification of 8’ as the experimental scattering angle and the peak, or maximum density of the wave function, E$, as the atomic product energy (or, in the case of further collisions, 19” and E;).
Due to the H/Br mass ratio the excess energy would be channeled predominantly into the motion of the H-atom; exclusively so in the present calculation. Upon photodisso-
9188 Barclay et al.: Surface-aligned photochemistry. Ill
ciation, the H-atom k vector was directed along the mo- lecular axis. The excess energy, the molecule-surface dis- tance in the z-direction (along the surface normal), and the orientation of the molecular axis were fixed for a given calculation. The dependence of the dynamics on these pa- rameters is the central topic of this paper.
The hydrogenic wave function was evaluated on a 256 X256 two-dimensional grid of uniform spacing. The cell size used in all the calculations was Ax=Az~O.15; a.u. =0.078 710 9 A. The momentum-space grid is Ak,=W (2Ax). Calculation of the Laplacian (kinetic energy) op- erator on the right-hand side of Eq. (4) was greatly simplified by use of the Fourier method which evaluates derivatives using linear techniques. The time propagation on the left-hand side was carried out by a Chebychev poly- nomial expansion of the evolution operator;30 a detailed description of the method can be found in Ref. 31. In the present calculations we have displayed the wave function in coordinate space approximately every 12 fsec (500 a.u.).
As in the classical studies, periodic boundary condi- tions were used for boundaries perpendicular to the surface (periodic for motion parallel to the surface along the x direction in this 2D case). At large z values an optical potential of the form
V,,(z) =a, exp( -KZ) (7)
with ~=2.0 A-’ and K,=O.l eV was used to create an absorbing boundary.8
As in the model study in Ref. 8, two visualization tools were used: (a) projection of the absolute value of the wave function in coordinate space, and (b) projection of the absolute value of Y in k space. The first representation allows one to determine the time at which the asymptoti- cally constant potential region is reached. The second al- lows one to resolve the angular and kinetic energy distri- butions. The reader should note that in some of the k space plots shown below, only the high intensity contours will be shown, whereas in other cases the low intensity contours will be included to illustrate special features.
The analysis of the asymptotic wave function was per- formed using the momentum space representation of Y (k,t). Since the wave function in the asymptotic region contains a full band of energy components propagated from the Franck-Condon region, a range of individual continuous-wave photodissociation experiments [i.e. with pulses longer than 20 fsec (Ref. 32)] were simulated in a single calculation.
To analyze the asymptotic Y(k,t) we first filtered out from the wave function that part which remained near to the surface. This was the trapped (low-energy) part of the wave function. To do this, we multiplied Y by a continuous filtering function of the form
U--exp[ -I+-zo)13 f(z)=0’5+0*5 {l+exp[--y(z-zo)])’ (8)
where zo=2-5 A, depending on the amount of excess en- ergy used in the calculation, and y=5 A-‘. Next, the wave function was Fourier transformed into momentum space. The Cartesian coordinates were transformed to polar co-
J. Chem. Phys., Vol. 98, No. 11, I June 1993
Downloaded 15 Sep 2002 to 132.64.1.37. Redistribution subject to AIP license or copyright, see http://ojps.aip.org/jcpo/jcpcr.jsp
ordinates in momentum space, where E$= (k2,+e)/(2m) described the energy and 0’ =tan-‘(k,/k,) described the scattering angle. Thus, a given energy-resolved experiment is described by a constant radius in the (k, ,k,) momentum plane.
C. Approximations
The model calculations in Ref. 8 showed that the qual- itative as well as the quantitative features of the observed diffraction pattern in two dimensions were also obtained in three dimensions. We expect a similar 2D-to-3D transfer- ability in the present system; in addition a full 3D calcu- lation is underway.2g Due to alignment at low T,, Ref. 4 has shown that nonreactive H-atom scattering is well ap- proximated as scattering within a plane. The approxima- tions we have made to “real” behavior at the surface in- volve modeling the surface, the parent molecule, its photolysis, and its neighbors. We do this by ignoring (a) small effects in excited state photodissociation due to par- ent orientation and position, (b) surface effects such as thermal motion, and (c) co-adsorbate effects, reactive and nonreactive (with the exception of nonreactive scattering along the 111 plane).
If the excited adsorbate potential and the transition dipole moments were known, the photodissociation pro- cess could be treated in greater detail. The approximation of ignoring small variations from the equilibrium geometry in the parent molecule position and orientation will be in- vestigated in some detail in Sets. III A and III B later. This study did not explicitly model a canonical distribution but instead explored a few representative z and 8 shifted cases. In a real system, the molecular axis orientation and the position of the adsorbate above the surface exhibit a range of values determined by the distribution functions of these quantities. A weighted average of the representative cases considered at a given temperature should in fact be used. For example, the width of the 8 distribution at 80 K was found to be 12°.24 However, at low temperature, the distri- bution narrowed considerably,4 hence the average values should provide a good representation.
The second approximation was to ignore surface mo- tion. The present study has assumed frozen coadsorbed molecules and a surface with no thermal motion or recoil. Inclusion of such effects would lead to some broadening and increased complexity of the diffraction patterns. The classical investigations reported in papers II, IV, V, and VI of the present series incorporated surface effects through a version of the generalized Langevin equation approach.33 To determine the nature and magnitude of these surface effects in our wave packet study, we plan to extend this and the 3D studies to include the thermal motions in the sys- tem.2g This can be achieved by invoking the TD-SCF ap- proximation28’34’35 according to which the motions of sur- face atoms and the adsorbates will be treated classically while the motion of the projectile H will be solved quan- tum mechanically; the two sub-systems will then be cou- pled and their motion solved self-consistently.
Third, the presence of co-adsorbates can have an im- portant effect, This is largely taken into account in the
present study. However, we have considered only Br-atoms in the ( 111) plane, due to the 2D restriction. An extension to three dimensions includes the full interaction potentials with the entire set of neighboring HBr molecules.2g The inclusion of interactions with the H in HBr and with the HBr molecules not in the ( 111) plane will change the symmetry of the problem, leading to differences in the dif- fraction patterns as compared with those reported here. However, the classical results indicate 2D behavior, thus the effect of H-atoms is not large due to the size of the Br-atoms which screen the H-atoms.
A further complicating factor in the deconvolution of experimental spectra is the possibility for reaction between the projectile H-atom and co-adsorbates. Such a possibility-which is not included in the present study- has been examined in the classical case through the use of a London-Eyring-Polanyi-Sato (LEPS) model for H+HBr(ad).596 The possibility of reaction can be con- trolled by selection of adsorbates and excitation wave- lengths. At low coverages ( < 1.0 ML) our results’ indi- cated a reaction probability of up to 28% when islanding occurred and up to 20% when the adsorbates did not form islands. Furthermore, they indicated that there are two very different energy regimes for the product H-atom: high energy for direct nonreactive scattering and low-energy for H-atoms formed in the H+HBr exchange reaction. The angular distributions obtained for the high-energy H would be free of interferences due to chemical reactions and, therefore, could be described by the present model.
This simple separation of nonreactive from reactive collisions is, however, no longer possible at coverages > 1 ML, since H-atoms involved in nonreactive encounters as well as those involved in reaction give low-energy H pre- dominantly if they originate beneath the uppermost layer. This can, however, be remedied by substituting a nonreac- tive HX collision partner such as HF.7
Ill. RESULTS AND DISCUSSION
A. Single HBr adsorbate molecule
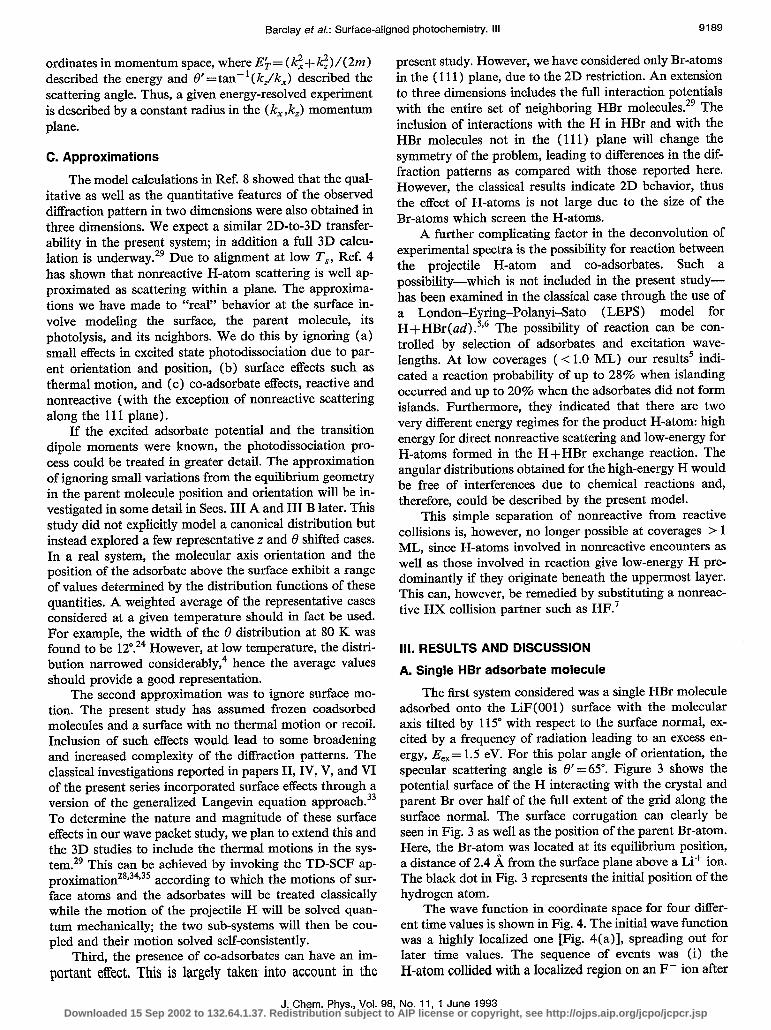
The first system considered was a single HBr molecule adsorbed onto the LiF(OO1) surface with the molecular axis tilted by 115” with respect to the surface normal, ex- cited by a frequency of radiation leading to an excess en- ergy, E,,= 1.5 eV. For this polar angle of orientation, the specular scattering angle is 8’ = 65”. Figure 3 shows the potential surface of the H interacting with the crystal and parent Br over half of the full extent of the grid along the surface normal. The surface corrugation can clearly be seen in Fig. 3 as well as the position of the parent Br-atom. Here, the Br-atom was located at its equilibrium position, a distance of 2.4 A from the surface plane above a Li+ ion. The black dot in Fig. 3 represents the initial position of the hydrogen atom.
The wave function in coordinate space for four differ- ent time values is shown in Fig. 4. The initial wave function was a highly localized one [Fig. 4(a)], spreading out for later time values. The sequence of events was (i) the H-atom collided with a localized region on an F- ion after
Barclay et aL: Surface-aligned photochemistry. Ill 9189
J. Chem. Phys., Vol. 98, No. 11, 1 June 1993 Downloaded 15 Sep 2002 to 132.64.1.37. Redistribution subject to AIP license or copyright, see http://ojps.aip.org/jcpo/jcpcr.jsp
9190 Barclay et al: Surface-aligned photochemistry. III
2.5
- Li+ F- Li+ F- Li+ F- Lf+ F- Lt+ 0, I I
0 I
5 10 16 20
xc&
FIG. 3. Potential energy contour for a Br-atom on a LiF 2D surface, as seen by the H-atom. Contours shown are in eV; axes’ distances are in .&. The small dot indicates the initial position of the H-atom prior to pho- tolysis. Note that the z axis was expanded (see text).
Y4.z) Ea= 1.5eV
t=25coaLL (4
t= 1ciooa.u.
t=5coau
bl
t=oau. al
k
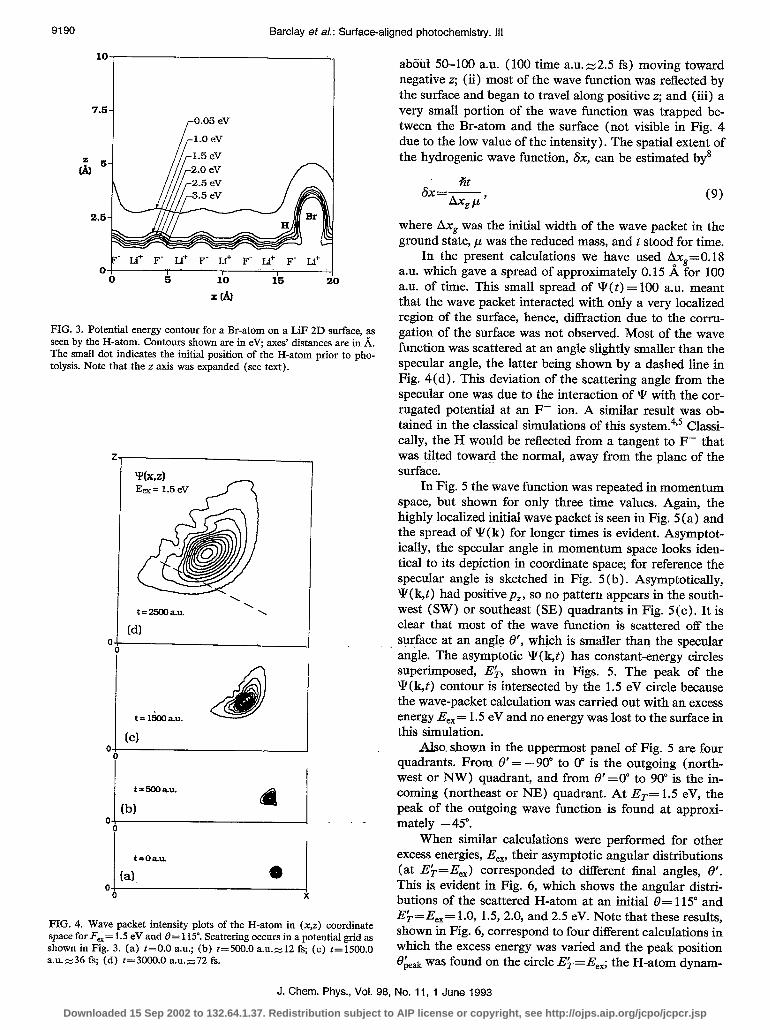
FIG. 4. Wave packet intensity plots of the H-atom in (x,z) coordinate space for F,= 1.5 eV and 8= 115”. Scattering occurs in a potential grid as shown in Fig. 3. (a) t=O.O au.; (b) t=500.0 a.u.=.12 fs; (c) t=1500.0 a.u.z-36 fs; (d) t=3000.0 a.u.z-72 fs.
about 50-100 au. (100 time a.u.z2.5 fs) moving toward negative z; (ii) most of the wave function was reflected by the surface and began to travel along positive z; and (iii) a very small portion of the wave function was trapped be- tween the Br-atom and the surface (not visible in Fig. 4 due to the low value of the intensity). The spatial extent of the hydrogenic wave function, 6x, can be estimated by8
fit 6x=7 _ (9) A-QPU , .
where A+ was the initial width of the wave packet in the ground state, p was the reduced mass, and t stood for time.
In the present calculations we have used Ax,=O.lS a.u. which gave a spread of approximately 0.15 A for 100 a.u. of time. This small spread of \I, (t) = 100 a.u. meant that the wave packet interacted with only a very localized region of the surface, hence, diffraction due to the corru- gation of the surface was not observed. Most of the wave function was scattered at an angle slightly smaller than the specular angle, the latter being shown by a dashed line in Fig. 4(d). This deviation of the scattering angle from the specular one was due to the interaction of Y with the cor- rugated potential at an F- ion. A similar result was ob- tained in the classical simulations of this system.4t5 Classi- cally, the H would be reflected from a tangent to F- that was- tiled toward the normal, away from the plane of the surface.
In Fig. 5 the wave function was repeated in momentum space, but shown for only three time values. Again, the highly localized initial wave packet is seen in Fig. 5 (a) and the spread of Y(k) for longer times is evident. Asymptot- ically, the specular angle in momentum space looks iden- tical to its depiction in coordinate space; for reference the specular angle is sketched in Fig. 5 (b). Asymptotically, \I, (k,t) had positive pz, so no pattern appears in the south- west (SW) or southeast (SE) quadrants in Fig. 5 (c). It is clear that most of the wave function is scattered off the surface at an angle (7, which is smaller than the specular angle. The asymptotic Y (k,t) has constant-energy circles superimposed, E$-, shown in Figs. 5. The peak of the w(k,t) contour is intersected by the 1.5 eV circle because the wave-packet calculation was carried out with an excess energy E,, = 1.5 eV and no energy was lost to the surface in this simulation.
Also. shown in the uppermost panel of Fig. 5 are four quadrants. From 8’ = - 90” to 0” is the outgoing (north- west or NW) quadrant, and from 6’ =o” to 90” is the in- coming (northeast or NE) quadrant. At ET= 1.5 eV, the peak of the outgoing wave function is found at approxi- mately - 45”.
When similar calculations were performed for other excess energies, E,,, their asymptotic angular distributions (at E$=E,,) corresponded to different final angles, 8’. This is evident in Fig. 6, which shows the angular distri- butions of the scattered H-atom at an initial 8= 115” and E$-=E,,= 1.0, 1.5, 2.0, and 2.5 eV. Note that these results, shown in Fig. 6, correspond to four different calculations in which the excess energy was varied and the peak position 8’ peak was found on the circle E$= E,,; the H-atom dynam-
J. Chem. Phys., Vol. 98, No. 11, 1 June 1993
Downloaded 15 Sep 2002 to 132.64.1.37. Redistribution subject to AIP license or copyright, see http://ojps.aip.org/jcpo/jcpcr.jsp
Barclay et a/.: Surface-aligned photochemistry. Ill
-fiu -Kx 0
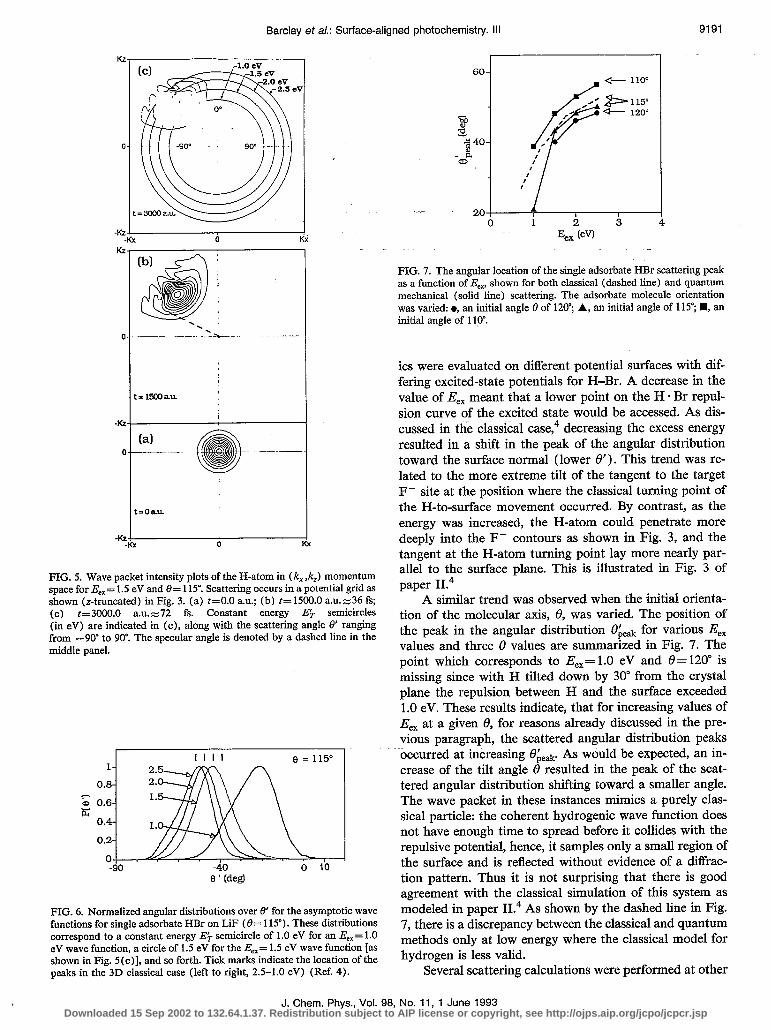
FIG. 5. Wave packet intensity plots of the H-atom in (k, ,/c,) momentum space for E,= 1.5 eV and 8= 115’. Scattering occurs in a potential grid as shown (z-truncated) in Fig. 3. (a) t=O.O a.u.; (b) t=1500.0 a.u.z-36 fs; (c) t=3000.0 a.u.z-72 fs. Constant energy Ek semicircles (in eV) are indicated in (c), along with the scattering angle 8’ ranging from -90” to 90’. The specular angle is denoted by a dashed line in the middle panel.
I I I I I3 = 115”
0.81 p&j =-@-----a A\ ;;xu, “LA!- 4,, /
-90 0 lo 0 ’ (degl
FIG. 6. Normalized angular distributions over 0’ for the asymptotic wave functions for single adsorbate HBr on LiF (0= 115”). These distributions correspond to a constant energy E$ semicircle of 1.0 eV for an E,,= 1.0 eV wave function, a circle of 1.5 eV for the E,,= 1.5 eV wave function [as shown in Fig. 5(c)], and so forth. Tick marks indicate the location of the peaks in the 3D classical case (left to right, 2.5-1.0 eV) (Ref. 4).
60-
._.. 20 I 1 t 1 0 1 2 3 4
EwL WI
FIG. 7. The angular location of the single adsorbate HBr scattering peak as a function of E,,, shown for both classical (dashed line) and quantum mechanical (solid line) scattering. The adsorbate molecule orientation was varied: l , an initial angle 0 of 120”; A, an initial angle of 115”; n , an initial angle of 1 lo”.
its were evaluated on different potential surfaces with dif- fering excited-state potentials for H-Br. A decrease in the value of E,, meant that a lower point on the H * Br repul- sion curve of the excited state would be accessed. As dis- cussed. in the classical case,4 decreasing the excess energy resulted in a shift in the peak of the angular distribution toward the surface normal (lower 0’). This trend was re- lated to the more extreme tilt of the tangent to the target F- site at the position where the classical turning point of the H-to-surface movement occurred. By contrast, as the energy was increased, the H-atom could penetrate more deeply into the F- contours as shown in Fig. 3, and the tangent at the H-atom turning point lay more nearly par- allel to the surface plane. This is illustrated in Fig. 3 of paper II.4
A similar trend was observed when the initial orienta- tion of the molecular axis, 8, was varied. The position of the peak in the angular distribution ok,, for various E,, values and three 8 values are summarized in Fig. 7. The point which corresponds to E,,= 1.0 eV and 0= 120” is missing since with H tilted down by 30” from the crystal plane the repulsion between H and the surface exceeded 1.0 eV. These results indicate, that for increasing values of E,, at a given 8, for reasons already discussed in the pre- vious paragraph, the scattered angular distribution peaks occurred at increasing O;leak As would be expected, an in- crease of the tilt angle 8 resulted in the peak of the scat- tered angular distribution shifting toward a smaller angle. The wave packet in these instances mimics a purely clas- sical particle: the coherent hydrogenic wave function does not have enough time to spread before it collides with the repulsive potential, hence, it samples only a small region of the surface and is reflected without evidence of a diffrac- tion pattern, Thus it is not surprising that there is good agreement with the classical simulation of this system as modeled in paper II.4 As shown by the dashed line in Fig. 7, there is a discrepancy between the classical and quantum methods only at low energy where the classical model for hydrogen is less valid.
Several scattering calculations were performed at other
J. Chem. Phys., Vol. 98, No. 11, 1 June 1993 Downloaded 15 Sep 2002 to 132.64.1.37. Redistribution subject to AIP license or copyright, see http://ojps.aip.org/jcpo/jcpcr.jsp
9192 Barclay et al.: Surface-aligned photochemistry. Ill
TABLE I. Effect of n shift on the location of the peak in the atomic product angular distribution, t9;lcak, as a function of excess energy, E, (measured in eV). The size of the shift from the equilibrium position is Ax (measured in A). All angles are given in degrees.
4, (ev) 1.0 1.5 2.0 2.5
- 1.0 - -39 -57 -63 0.0 -21 -43 -48 -50 1.0 -42 -46 -47 -48
positions along the x axis (shifted parallel to the surface). These results are summarized in Table I, which shows the location of the peak f~$‘,,~ in the scattered angular distribu- tion as a function of the shift Ax and the excess energy. As expected, the peak of the angular distribution of the scat- tered atom was altered significantly due to localized atomic scattering. This emphasizes the importance of the adsor- bate positions being in register with the surface. No evi- dence was found for diffraction, in contrast with what is reported in the following section for the z-shifted case.
B. Single HBr, z-shifted
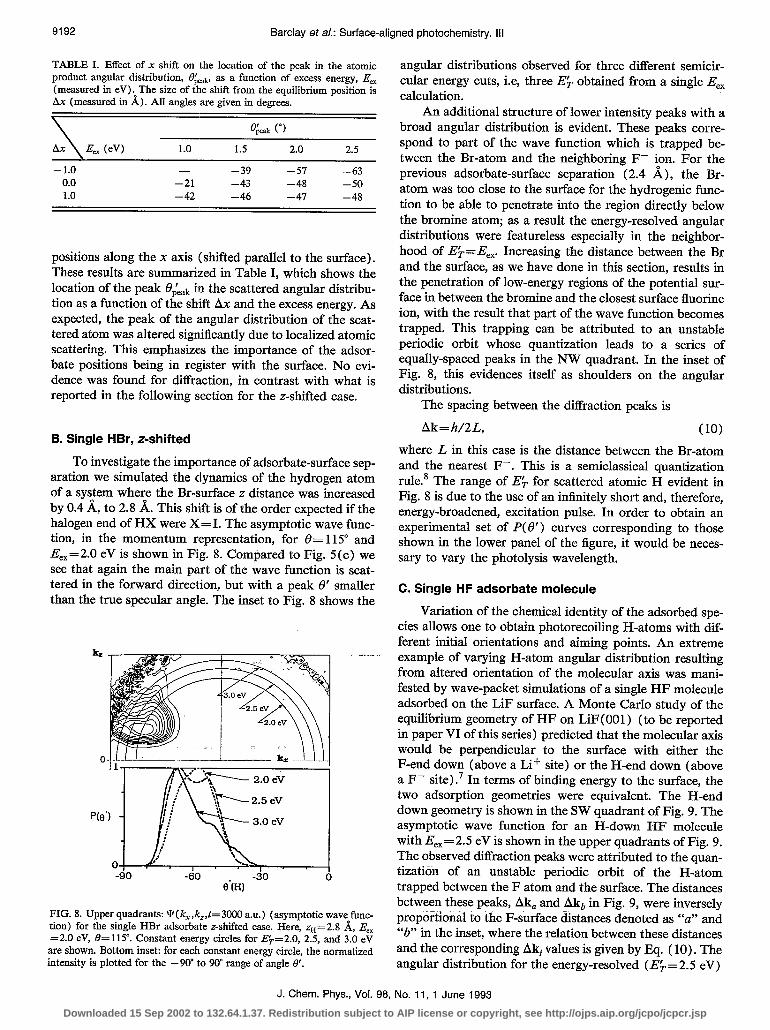
To investigate the importance of adsorbate-surface sep- aration we simulated the dynamics of the hydrogen atom of a system where the Br-surface z distance was increased by 0.4 & to 2.8 A. This shift is of the order expected if the halogen end of HX were X=1. The asymptotic wave func- tion, in the momentum representation, for 8= 115” and E,,=2.0 eV is shown in Fig. 8. Compared to Fig. 5(c) we see that again the main part of the wave function is scat- tered in the forward direction, but with a peak 8’ smaller than the true specular angle. The inset to Fig. 8 shows the
kz
0
p(e,ll p$=f , 1
-90 -so -do i ) 8’(H)
FIG. 8. Upper quadrants: Y(k,,k,,t=3OCHl a.u.) (asymptotic wave func- tion) for the single HBr adsorbate z-shifted case. Here, zn=2.8 A, E,, =2.0 eV, 8= 115”. Constant energy circles for E;=2.0, 2.5, and 3.0 eV
are shown. Bottom inset: for each constant energy circle, the normalized intensity is plotted for the -90” to 90” range of angle 8’.
angular distributions observed for three different semicir- cular energy cuts, i.e, three E& obtained from a single E,, calculation.
An additional structure of lower intensity peaks with a broad angular distribution is evident. These peaks corre- spond to part of the wave function which is trapped be- tween the Br-atom and the neighboring F- ion. For the previous adsorbate-surface separation (2.4 A), the Br- atom was too close to the surface for the hydrogenic fimc- tion to be able to penetrate into the region directly below the bromine atom; as a result the energy-resolved angular distributions were featureless especially in the neighbor- hood of E&=E,,. Increasing the distance between the Br and the surface, as we have done in this section, results in the penetration of low-energy regions of the potential sur- face in between the bromine and the closest surface fluorine ion, with the result that part of the wave function becomes trapped. This trapping can be attributed to an unstable periodic orbit whose quantization leads to a series of equally-spaced peaks in the NW quadrant. In the inset of Fig. 8, this evidences itself as shoulders on the angular distributions.
The spacing between the diffraction peaks is
Ak= h/2L, (10)
where L in this case is the distance between the Br-atom and the nearest F-. This is a semiclassical quantization rule.* The range of E& for scattered atomic H evident in Fig. 8 is due to the use of an infinitely short and, therefore, energy-broadened, excitation pulse. In order to obtain an experimental set of P(W) curves corresponding to those shown in the lower panel of the figure, it would be neces- sary to vary the photolysis wavelength.
C. Single HF adsorbate molecule
Variation of the chemical identity of the adsorbed spe- cies allows one to obtain photorecoiling H-atoms with dif- ferent initial orientations and aiming points. An extreme ~example of varying H-atom angular distribution resulting from altered orientation of the molecular axis was mani- fested by wave-packet simulations of a single HF molecule adsorbed on the LiF surface. A Monte Carlo study of the equilibrium geometry of HF on LiF(OO1) (to be reported in paper VI of this series) predicted that the molecular axis would be perpendicular to the surface with either the F-end down (above a Li+ site) or the H-end down (above a F- site).’ In terms of binding energy to the surface, the two adsorption geometries were equivalent. The H-end down geometry is shown in the SW quadrant of Fig. 9. The asymptotic wave function for an H-down HF molecule with E,, = 2.5 eV is shown in the upper quadrants of Fig. 9. The observed diffraction peaks were attributed to the quan- tization of an unstable periodic orbit of the H-atom trapped between the F atom and the surface. The distances between these peaks, Ak, and Ak, in Fig. 9, were inversely proportional to the F-surface distances denoted as “a” and “b” in the inset, where the relation between these distances and the corresponding Akj values is given by Eq. ( 10). The angular distribution for the energy-resolved (E$=2.5 eV)
J. Chem. Phys., Vol. 98, No. 11, 1 June 1993 Downloaded 15 Sep 2002 to 132.64.1.37. Redistribution subject to AIP license or copyright, see http://ojps.aip.org/jcpo/jcpcr.jsp
Barclay et a/.: Surface-aligned photochemistry. Ill 9193
t
0
-kz -h; 0 kx
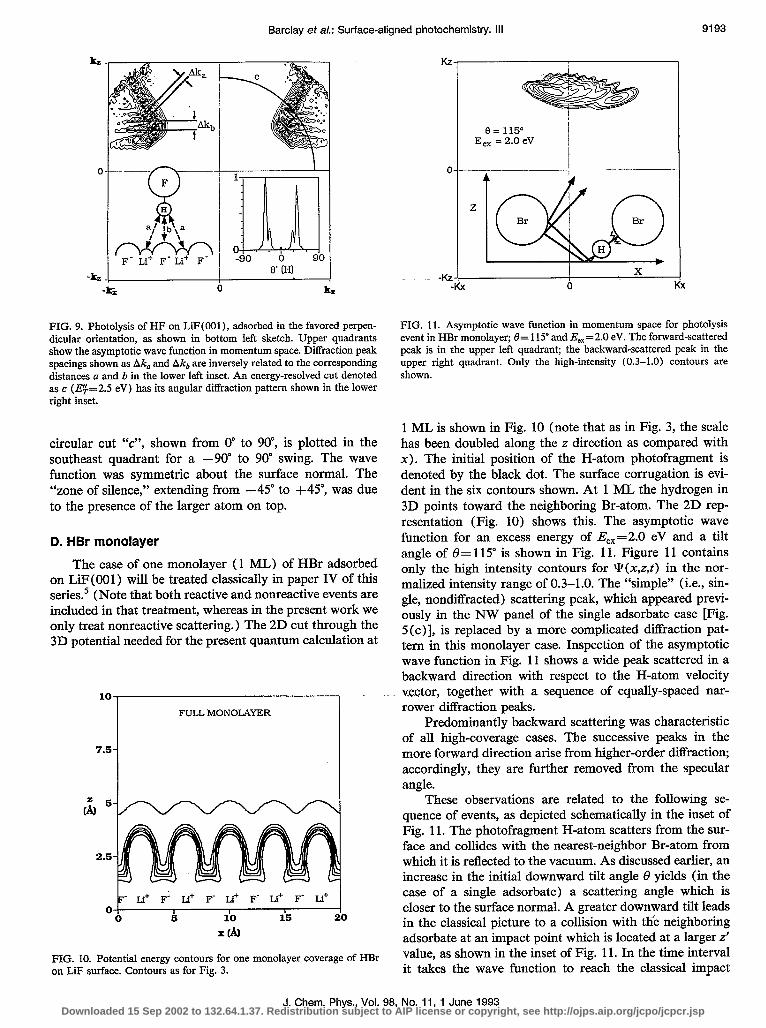
FIG. 9. Photolysis of HF on LiF(OOl), adsorbed in the favored perpen- dicular orientation, as shown in bottom left sketch. Upper quadrants show the asymptotic wave function in momentum space. Diffraction peak spacings shown as Ak, and Ak, are inversely related to the corresponding distances a and b in the lower left inset. An energy-resolved cut denoted as c (EF=2.5 eV) has its angular diffraction pattern shown in the lower right inset.
circular cut “c”, shown from 0” to go”, is plotted in the southeast quadrant for a -90” to 90” swing. The wave function was symmetric about the surface normal. The “zone of silence,” extending from -45” to +45”, was due to the presence of the larger atom on top.
D. HBr monolayer
The case of one monolayer ( 1 ML) of HBr adsorbed on LiF(OO1) will be treated classically in paper IV of this series5 (Note that both reactive and nonreactive events are included in that treatment, whereas in the present work we only treat nonreactive scattering.) The 2D cut through the 3D potential needed for the present quantum calculation at
FULL MONOLAYER
= 5- CA, v
FIG. 10. Potential energy contours for one monolayer coverage of HBr on LiF surface. Contours as for Fig. 3.
FIG. 11. Asymptotic wave function in momentum space for photolysis event in HBr monolayer; f3= 115” and E,,=2.0 eV. The forward-scattered peak is in the upper left quadrant; the backward-scattered peak in the upper right quadrant. Only the high-intensity (0.3-1.0) contours are shown.
1 ML is shown in Fig. 10 (note that as in Fig. 3, the scale has been doubled along the z direction as compared with x). The initial position of the H-atom photofragment is denoted by the black dot. The surface corrugation is evi- dent in the six contours shown. At 1 ML the hydrogen in 3D points toward the neighboring Br-atom. The 2D rep- resentation (Fig. 10) shows this. The asymptotic wave function for an excess energy of E,,=2.0 eV and a tilt angle of 8= 115” is shown in Fig. 11. Figure 11 contains only the high intensity contours for Y(x,z,f) in the nor- malized intensity range of 0.3-1.0. The “simple” (i.e., sin- gle, nondiffracted) scattering peak, which appeared previ- ously in the NW panel of the single adsorbate case [Fig. 5 (c)l, is replaced by a more complicated diffraction pat- tern in this monolayer case. Inspection of the asymptotic wave function in Fig. 11 shows a wide peak scattered in a backward direction with respect to the H-atom velocity
.~ vector, together with a sequence of equally-spaced nar- rower diffraction peaks.
Predominantly backward scattering was characteristic of all high-coverage cases. The successive peaks in the more forward direction arise from higher-order diffraction; accordingly, they are further removed from the specular angle.
These observations are related to the following se- quence of events, as depicted schematically in the inset of Fig. 11. The photofragment H-atom scatters from the sur- face and collides with the nearest-neighbor Br-atom from which it is reflected to the vacuum. As discussed earlier, an increase in the initial downward tilt angle 8 yields (in the case of a single adsorbate) a scattering angle which is closer to the surface normal. A greater downward tilt leads in the classical picture to a collision with the neighboring adsorbate at an impact point which is located at a larger z’ value, as shown in the inset of Fig. 11. In the time interval it takes the wave function to reach the classical impact
J. Chem. Phys., Vol. 98, No. 11, 1 June 1993 Downloaded 15 Sep 2002 to 132.64.1.37. Redistribution subject to AIP license or copyright, see http://ojps.aip.org/jcpo/jcpcr.jsp
9194 Barclay et al.: Surface-aligned photochemistry. Ill
0 2 4 6 -90 0 t E" 9tl
T 8"
-t 0
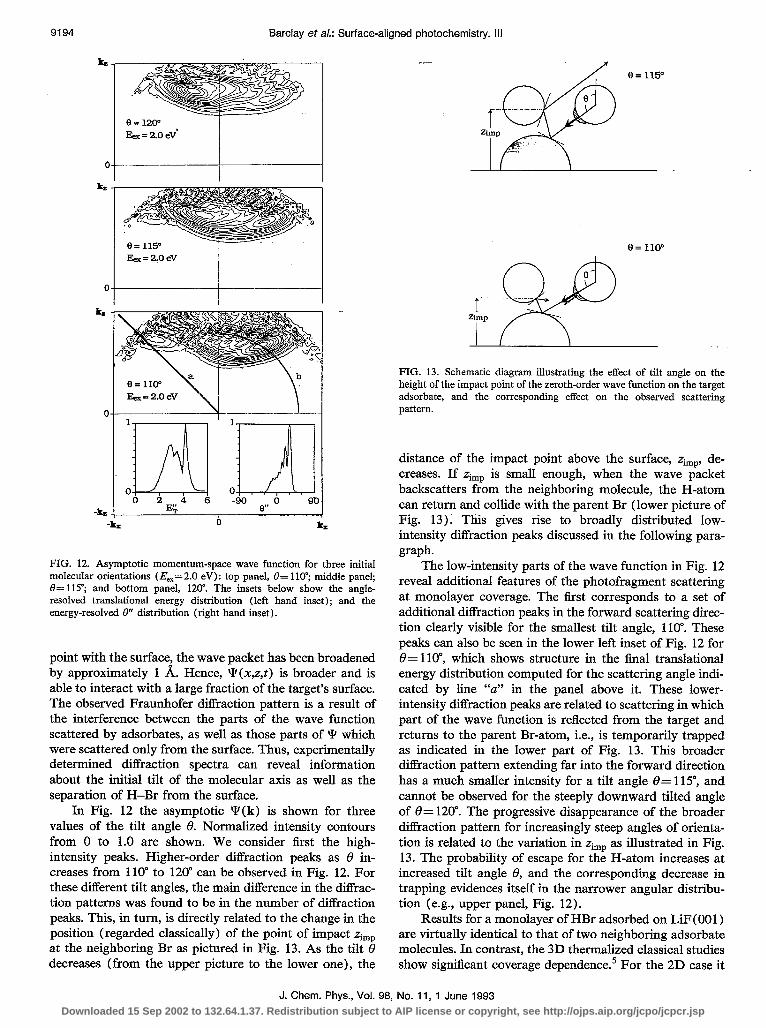
FIG. 12. Asymptotic momentum-space wave function for three initial molecular orientations (E-=2.0 eV): top panel, 8= 1 lo”; middle panel; 8= 115”; and bottom panel, 120”. The insets below show the angle- resolved translational energy distribution (left hand inset); and the energy-resolved 0” distribution (right hand inset).
point with the surface, the wave packet has been broadened by approximately 1 A. Hence, Y(x,z,t> is broader and is able to interact with a large fraction of the target’s surface. The observed Fraunhofer diffraction pattern is a result of the interference between the parts of the wave function scattered by adsorbates, as well as those parts of Y which were scattered only from the surface. Thus, experimentally determined diffraction spectra can reveal information about the initial tilt of the molecular axis as well as the separation of H-Br from the surface.
In Fig. 12 the asymptotic Y(k) is shown for three values of the tilt angle 8. Normalized intensity contours from 0 to 1.0 are shown. We consider first the high- intensity peaks. Higher-order diffraction peaks as 8 in- creases from 110” to 120” can be observed in Fig. 12. For these different tilt angles, the main difference in the diErac- tion patterns was found to be in the number of diffraction peaks. This, in turn, is directly related to the change in the position (regarded classically) of the point of impact Zimp at the neighboring Br as pictured in Fig. 13. As the tilt 8 decreases (from the upper picture to the lower one), the
[ ,;.e ._. .-.- ._._._._. IP
zimp <.;g” ; - .--T
e I
T’-‘-
I --.P
. I -.. zimp --_
FIG. 13. Schematic diagram illustrating the effect of tilt angle on the height of the impact point of the zeroth-order wave function on the target adsorbate, and the corresponding effect on the observed scattering pattern.
distance of the impact point above the surface, zimr, de- creases. If Zimp is small enough, when the wave packet backscatters from the neighboring molecule, the H-atom can return and collide with the parent Br (lower picture of Fig. 13). This gives rise to broadly distributed low- intensity diffraction peaks discussed in the following para- graph.
The low-intensity parts of the wave function in Fig. 12 reveal additional features of the photofragment scattering at monolayer coverage. The first corresponds to a set of additional diffraction peaks in the forward scattering direc- tion clearly visible for the smallest tilt angle, 110”. These peaks can also be seen in the lower left inset of Fig. 12 for f3= 1 lo”, which shows structure in the final translational energy distribution computed for the scattering angle indi- cated by line “u” in the panel above it. These lower- intensity diffraction peaks are related to scattering in which part of the wave function is reflected from the target and returns to the parent Br-atom, i.e., is temporarily trapped as indicated in the lower part of Fig. 13. This broader diffraction pattern extending far into the forward direction has a much smaller intensity for a tilt angle 8= 115”, and cannot be observed for the steeply downward tilted angle of 19= 120”. The progressive disappearance of the broader diffraction pattern for increasingly steep angles of orienta- tion is related to the variation in zimP as illustrated in Fig. 13. The probability of escape for the H-atom increases at increased tilt angle 8, and the corresponding decrease in trapping evidences itself in the narrower angular distribu- tion (e.g., upper panel, Fig. 12).
Results for a monolayer of HBr adsorbed on LiF (001) are virtually identical to that of two neighboring adsorbate molecules. In contrast, the 3D thermalized classical studies show significant coverage dependence.’ For the 2D case it
J. Chem. Phys., Vol. 98, No. 11, 1 June 1993 Downloaded 15 Sep 2002 to 132.64.1.37. Redistribution subject to AIP license or copyright, see http://ojps.aip.org/jcpo/jcpcr.jsp
Barclay et a/.: Surface-aligned photochemistry. Ill
4
0
-k=
la1
,.m : >’ e= 115’
,\,% Y Y+’
Ex= 1.0 cv
\ j
\’
2
liI53Lz
Bi- Br
H
X A
-Lx ”
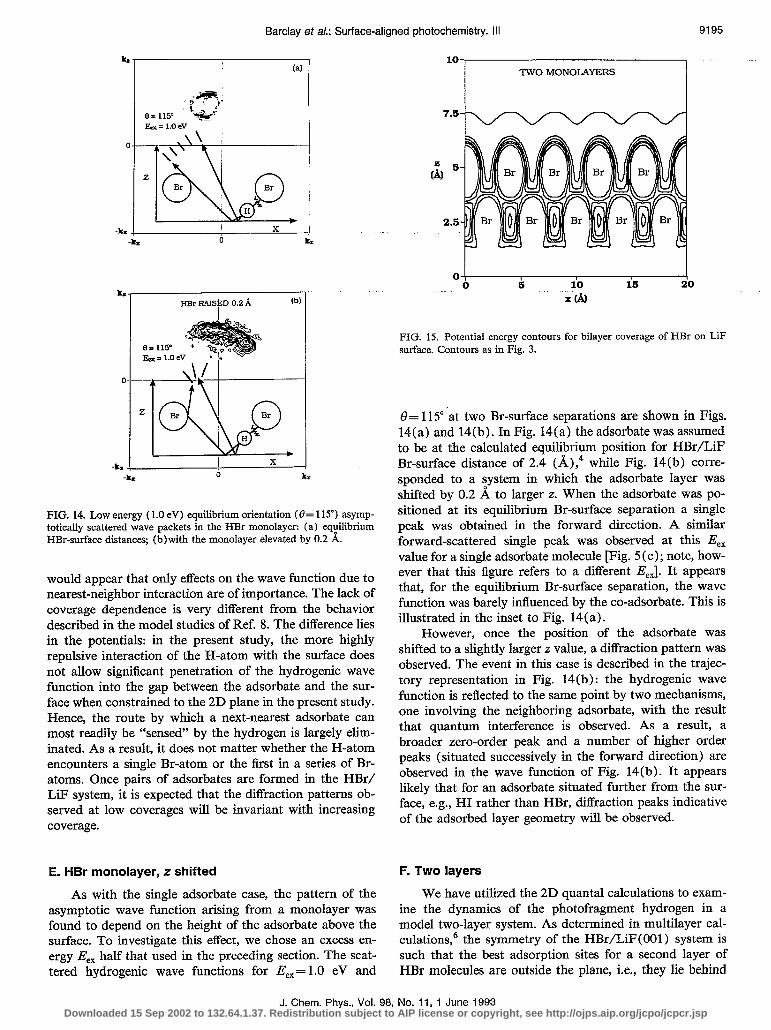
FIG. 15. Potential energy contours for bilayer coverage of HBr on LiF surface. Contours as in Fig. 3.
FIG. 14. Low energy (1.0 eV) equilibrium orientation (0= 115”) asymp- totically scattered wave packets in the HBr monolayer: (a) equilibrium HBr-surface distances; (b) with the monolayer elevated by 0.2 A.
would appear that only effects on the wave function due to nearest-neighbor interaction are of importance. The lack of coverage dependence is very different from the behavior described in the model studies of Ref. 8. The difference lies in the potentials: in the present study, the more highly repulsive interaction of the H-atom with the surface does not allow significant penetration of the hydrogenic wave function into the gap between the adsorbate and the sur- face when constrained to the 2D plane in the present study. Hence, the route by which a next-nearest adsorbate can most readily be “sensed” by the hydrogen is largely elim- inated. As a result, it does not matter whether the H-atom encounters a single Br-atom or the first in a series of Br- atoms. Once pairs of adsorbates are formed in the HBr/ LiF system, it is expected that the diffraction patterns ob- served at low coverages will be invariant with increasing coverage.
8= 115” ‘at two Br-surface separations are shown in Figs. 14(a) and 14(b). In Fig. 14(a) the adsorbate was assumed to be at the calculated equilibrium position for HBr/LiF Br-surface distance of 2.4 ( A),4 while Fig. 14(b) corre- sponded to a system in which the adsorbate layer was shifted by 0.2 A to larger z. When the adsorbate was po- sitioned at its equilibrium Br-surface separation a single peak was obtained in the forward direction. A similar forward-scattered single peak was observed at this E,, value for a single adsorbate molecule [Fig. 5 (c); note, how- ever that this figure refers to a different E,,1. It appears that, for the equilibrium Br-surface separation, the wave function was barely influenced by the co-adsorbate. This is illustrated in the inset to Fig. 14(a).
(bl
F. Two layers
J. Chem. Phys., Vol. 98, No. 11, 1 June 1993
However, once the position of the adsorbate was shifted to a slightly larger z value, a diffraction pattern was observed. The event in this case is described in the trajec- tory representation in Fig. 14(b) : the hydrogenic wave function is reflected to the same point by two mechanisms, one involving the neighboring adsorbate, with the result that quantum interference is observed. As a result, a broader zero-order peak and a number of higher order peaks (situated successively in the forward direction) are observed in the wave function of Fig. 14(b). It appears likely that for an adsorbate situated further from the sur- face, e.g., HI rather than HBr, diffraction peaks indicative of the adsorbed layer geometry will be observed.
E. HBr monolayer, z shifted
As with the single adsorbate case, the pattern of the asymptotic wave function arising from a monolayer was found to depend on the height of the adsorbate above the surface. To investigate this effect, we chose an excess en- ergy E,, half that used in the preceding section. The scat- tered hydrogenic wave functions for Eex= 1 .O eV and
We have utilized the 2D quanta1 calculations to exam- ine the dynamics of the photofragment hydrogen in a model two-layer system. As determined in multilayer cal- culations,6 the symmetry of the HBr/LiF(OOl ) system is such that the best adsorption sites for a second layer of HBr molecules are outside the plane, i.e., they lie behind
1
-I t 2.5
Downloaded 15 Sep 2002 to 132.64.1.37. Redistribution subject to AIP license or copyright, see http://ojps.aip.org/jcpo/jcpcr.jsp
9196 Barclay et a/.: Surface-aligned photochemistry. Ill
O! 0 X
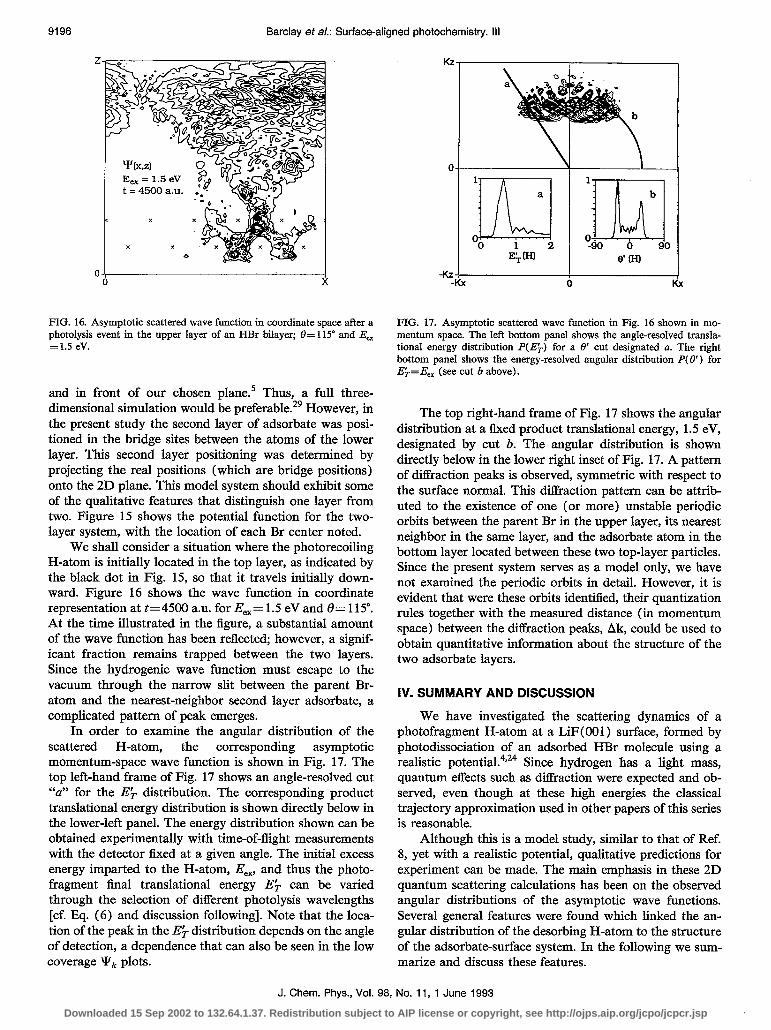
FIG. 16. Asymptotic scattered wave function in coordinate space after a photolysis event in the upper layer of an HBr bilayer; 6= 115” and E, = 1.5 eV.
and in front of our chosen plane.5 Thus, a full three- dimensional simulation would be preferable.” However, in the present study the second layer of adsorbate was posi- tioned in the bridge sites between the atoms of the lower layer. This second layer positioning was determined by projecting the real positions (which are bridge positions) onto the 2D plane. This model system should exhibit some of the qualitative features that distinguish one layer from two. Figure 15 shows the potential function for the two- layer system, with the location of each Br center noted.
We shall consider a situation where the photorecoiling H-atom is initially located in the top layer, as indicated by the black dot in Fig. 15, so that it travels initially down- ward. Figure 16 shows the wave function in coordinate representation at t=4500 a.u. for E,,= 1.5 eV and 8= 115”. At the time illustrated in the figure, a substantial amount of the wave function has been reflected; however, a signif- icant fraction remains trapped between the two layers. Since the hydrogenic wave function must escape to the vacuum through the narrow slit between the parent Br- atom and the nearest-neigbbor second layer adsorbate, a complicated pattern of peak emerges.
In order to examine the angular distribution of the scattered H-atom, the corresponding asymptotic momentum-space wave function is shown in Fig. 17. The top left-hand frame of Fig. 17 shows an angle-resolved cut “a” for the E> distribution. The corresponding product translational energy distribution is shown directly below in the lower-left panel. The energy distribution shown can be obtained experimentally with time-of-flight measurements with the detector fixed at a given angle. The initial excess energy imparted to the H-atom, E,,, and thus the photo- fragment final translational energy E$- can be varied through the selection of different photolysis wavelengths [cf. Eq. (6) and discussion following]. Note that the loca- tion of the peak in the E$- distribution depends on the angle of detection, a dependence that can also be seen in the low coverage Yk plots.
8’ N -Kz ,
-KX 0 I x
FIG. 17. Asymptotic scattered wave function in Fig. 16 shown in mo- mentum space. The left bottom panel shows the angle-resolved transla- tional energy distribution P(E>) for a 6’ cut designated a. The right bottom panel shows the energy-resolved angular distribution P( 0’) for E$=E,, (see cut b above).
The top right-hand frame of Fig. 17 shows the angular distribution at a fixed product translational energy, 1.5 eV, designated by cut b. The angular distribution is shown directly below in the lower right inset of Fig. 17. A pattern of diffraction peaks is observed, symmetric with respect to the surface normal. This diffraction pattern can be attrib- uted to the existence of one (or more) unstable periodic orbits between the parent Br in the upper layer, its nearest neighbor in the same layer, and the adsorbate atom in the bottom layer located between these two top-layer particles. Since the present system serves as a model only, we have not examined the periodic orbits in detail. However, it is evident that were these orbits identified, their quantization rules together with the measured distance (in momentum space) between the diffraction peaks, Ak, could be used to obtain quantitative information about the structure of the two adsorbate layers.
IV. SUMMARY AND DISCUSSION
We have investigated the scattering dynamics of a photofragment H-atom at a LiF( 001) surface, formed by photodissociation of an adsorbed HBr molecule using a realistic potentia1.4’24 Since hydrogen has a light mass, quantum effects such as diffraction were expected and ob- served, even though at these high energies the classical trajectory approximation used in other papers of this series is reasonable.
Although this is a model study, similar to that of Ref. 8, yet with a realistic potential, qualitative predictions for experiment can be made. The main emphasis in these 2D quantum scattering calculations has been on the observed angular distributions of the asymptotic wave functions. Several general features were found which linked the an- gular distribution of the desorbing H-atom to the structure of the adsorbate-surface system. In the following we sum- marize and discuss these features.
J. Chem. Phys., Vol. 98, No. 11, 1 June 1993 Downloaded 15 Sep 2002 to 132.64.1.37. Redistribution subject to AIP license or copyright, see http://ojps.aip.org/jcpo/jcpcr.jsp
For a single adsorbate at the calculated equilibrium tilt angle of 8= 115”, and equilibrium separation from the sur- face, it was found that the scattering angle 8’ for the H-atom was basically the same as that obtained using clas- sical dynamics.4 A single peak was found in the forward direction at an angle less than specular. The dependence of the peak in the product angular distribution, 6bk, on the excess energy, E,,, was very similar in the 2D quantum and the 3D classical studies for E,, in the range 1.5-2.5 eV. However, at the lower initial translational energy of the incident H-atom, corresponding to E,,=: 1 eV the value 13h, obtained quantally was substantially less than classi- cally and, therefore, even further removed from the spec- ular angle (Figs. 6 and 7).
The angular distribution of the asymptotic wave func- tion was found to be sensitive to Eex and to the initial tilt angle, 8, of the molecular axis. The width of the angular distribution increased for decreasing Eex (Fig. 6). This can be understood in terms of the fact that at lower energy, the wave packet had a greater spread at the point of interaction with the surface. As the molecular axis of the photolyzed HBr was tilted more steeply, Okeak decreased, i.e., the prod- uct was reflected nearer to the surface normal. This was also in agreement with the classical results.4 The location 0f ebk was also found to be sensitive to the horizontal position of the photolyzed HBr, which emphasizes the lo- cal character of LAS, since the horizontal position deter- mined the region of the surface on which the H-atom im- pacts.
When the adsorbate-surface vertical separation was in- creased by 0.4 A in the single HBr adsorbate case diffrac- tion peaks were obtained. This is of interest since this is approximately the height above the surface predicted for HI on LiF(O01).7 High- and low-intensity features were observed for this larger H-adsorbate separation. The high- intensity peaks could be attributed to scattering from the corrugated surface. The broader low-intensity peaks were due to the existence of an unstable periodic orbit for an H-atom trapped between its parent Br and the nearest sur- face fluorine ion. The displacement in momentum space between these diffraction peaks, combined with the quan- tization rules of the periodic orbit, will enable an experi- mental determination of the adsorbate-surface distance and geometry.*
The energy and angular distributions were shown to be sensitive to the identity of the halide adsorbed. In the case of HF, for which the adsorption geometry was perpendic- ular to the crystal surface, a complicated diffraction pat- tern was obtained in which two main Ak values were linked to two predominant periodic orbits corresponding to an H-atom trapped in F-H-Li+ and F-H-F- (the ion being the surface atom).
At one monolayer HBr coverage the observed angular distribution of the desorbing H-atom exhibited a diffrac- tion pattern which in this simple 2D model reflected only the presence of a nearest-neighbor HBr molecule on the crystal surface. Since the HBr-HBr interaction in the ad- sorbed state is attractive,24 it is expected that even at low coverages small islands will form.5*6 Diffraction patterns of
submonolayer islanded coverage would be indistinguish- able from a full monolayer in this 2D model. The expec- tation based on 3D classical calculations is, however, that in reality H will penetrate beyond the nearest-neighbor HBr and the true 3D diffraction pattern will differ as be- tween a pair of adsorbate molecules and a monolayer cov- erage.
When a full adsorbate monolayer was z-shifted by only 0.2 A, a diffraction pattern was observed at low energy (E,,= 1.0 eV>, whereas no diffraction was seen at this en- ergy for the equilibrium separation. This was attributed to the existence of unstable periodic orbits of the hydrogenic wave function between the surface, the neighboring Br cen- ter, and the parent Br-atom.
Finally, we reported results for photolysis occurring in the top layer of two layers of HBr adsorbed on LiF(OO1). Since the symmetry of the bridge sites where the second layer is located is such that they do not intersect the ( 111) plane of this 2D calculation, the location of the second layer could only be modeled approximately. However, am- ple evidence of trapping, with scattering features due to periodic orbits, was observed.
We conclude that localized atomic scattering (LAS) will under a variety of circumstances give rise to diffraction effects which can be used to reveal the geometry of the adsorbate and its position relative to the substrate. Unlike TEAS, LAS will allow the experimentalist to probe one or two layers into the adsorbate. Diffraction patterns obtained through LAS have yet to be seen experimentally. However, given adequate resolution and an adsorbate in register with the surface they should be detectable. At low enough tem- peratures, it should be possible to pre-position the scatter- ing projectile with sufficient localization that it samples a small and well-defined region of the surface or co- adsorbate. The magnitude of the initial wave vector can then be controlled by changing the excitation wavelength and the orientation by selection of the precursor or a co- adsorbate molecule. We believe that LAS will become a valuable tool in the exploration of adsorbates and the un- derlying substrates.
ACKNOWLEDGMENTS
We are indebted to Mr. Peter Charters for his expertise in preparing the figures. We thank the Natural Sciences and Engineering Research Council of Canada (NSERC), and the Ontario Laser and Lightwave Research Centre (OLLRC), for their continuing support of this research. Most of these calculations were performed on the Cray X-MP/28 at the former Ontario Center for Large-Scale Computation.
’ For recent reviews, see (a) W. Ho in Desorption Induced by Electronic Transitions, DIET IV, edited bv G. Betz and P. Varea (Berlin. Springer-Verlag, 1990), p. 48; (bj X.-L. Zhou, X.-Y. Zhu: and J. M: White, Surf. Sci. Rep. 13, 73 (1991); (c) J. C. Polanyi and H. Rieley, Photochemistry in the Adsorbed State in Dynamics of Gas-Surface Inter- actions, edited by C. T. Rettner and M. N. R. Ashfold (Royal Society of Chemistry, London, 1991), Chap. 8, p. 329.
*E. B. D. Bourdon, C. C. Cho, P. Das, J. C. Polanyi, C. D. Stanners, and G. Q. Xu, J. Chem. Phys. 95, 1361 (1991).
Barclay et a/.: Surface-aligned photochemistry. Ill 9197
J. Chem. Phys., Vol. 98, No. 11, 1 June 1993 Downloaded 15 Sep 2002 to 132.64.1.37. Redistribution subject to AIP license or copyright, see http://ojps.aip.org/jcpo/jcpcr.jsp
9198 Barclay et a/.: Surface-aligned photochemistry. Ill
‘I. Harrison, J. C. Polanyi, and P. A. Young, J. Chem. Phys. 89, 1475 (1988); I. Harrison, J. C. Polanyi, and P. A. Young, J. Chem. Phys. 89, 1498 (1988).
4V. J. Barclay, D. B. Jack, J. C. Polanyi, and Y. Zeii, J. Chem. Phys. 97, 9458 (1992); paper II of this series.
5V. J. Barclay, D. B. Jack, J. C. Polanyi, and Y. Zeiri (unpublished). 6V. J. Barclay, D. B. Jack, J. C. Polanyi, and Y. Zeiri (unpublished). ‘V. J. Barclay, D. B. Jack, J. C. Polanyi, Y. Zeiri, and R. R. Lucchese
(unpublished). ‘R. Kosloff and Y. Zeiri, I. Chem. Phys. 97, 1719 (1992). ‘B. Poelsma and G. Comsa, Scattering of Thermal Energy Atoms from Disordered Surfaces, Vol. 115 of Springer Tracts in Modem Physics (Springer, Berlin, 1989).
‘OR. B. Gerber, Chem. Rev. 87, 29 (1987). “A. M. Lahee, J. R. Manson, J. P. Toennies, and Ch. Wall, J. Chem.
Phys. 86, 7194 (1987). i*B. Poelsma and G. Comsa, Faraday Discuss. Chem. Sot. 80,16 (1985). i3B. Poelsma, R. L. Palmer, and G. Comsa, Surf. Sci. 136, 1 (1984). 14J. A. Barker and D. J. Auerbach, Surf. Sci. Rep. 4, 1 (1984). “J. M. Horn and D. R. Miller, Surf. Sci. 69, 354 (1977). 16G. Boato, P. Cantini, and R. Tatarek, J. Phys. F 6, L237 (1976). 17J. Lapujoulade, Y. Le Cruer, M. Lefort, Y. Lejay, and E. Maurel, Surf.
Sci. 103, L85 (1981). 18G. Lilienkamp and J. P. Toenmes, J. Chem. Phys. 78, 5210 (1983). “E. K. Schweizer and C. T. Rettner, Surf. Sci. 208, L29 (1989).
*‘G. Y. Liu, P. Rowntree, G. Stoles, and J. Xu, Surf. Sci. 224,43 (1989); P. A. Rowntree, G. Stoles, and J. C. Ruiz-Suarez, J. Phys. Chem. 94, 8511 (1990).
2’G. Parschau, E. Kirsten, and K. H. Rieder, Surf. Sci. 225, 367 (1990); G. Gross and K. H. Rieder, Surf. Sci. 241, 33 (1991).
‘*E P Marsh, M. R. Schneider, T. L. Gilton, F. L. Tabares, W. Meier, . . and J. P. Cowin, Phys. Rev. Lett. 60, 2551 (1988).
23K. Domen and T. J. Chaung, Phys. Rev. Lett. 59, 1484 (1987); T. J. Chaung and K. Domen, J. Vat. Sci. Technol A 5, 473 (1987).
24J. C. Polanyi, R. J. Wil l iams, and S. F. O’Shea, J. Chem. Phys. 94, 978 (1991).
*‘P. M. Blass, R. C. Jackson, J. C. Polanyi, and H. Weiss, J. Chem. Phys. 94, 7003 (1991).
26 K. T. Tang and J. P. Toemdes, J. Chem. Phys. 80, 3726 (1984). 27Z.-H. Huang and H. Guo, J. Chem. Phys. 96, 8564 (1992). 28B. Jackson, J. Chem. Phys. 89,2493 ( 1989); H. J. Cmz and B. Jackson,
ibid 91, 4185 (1989): B. Jackson, ibid 92. 1458 (1990). *‘V. J. Barclay, J. C. Polanyi, R. Kosloff, and Y. Zeiri (unpublished). s”H. Tal-Ezer and R. Kosloff, J. Chem. Phys. 81, 3967 (1984). 31R. Kosloff, J. Phys. Chem. 92, 2087 (1988). 32M. V. Rama Krishna and R. D. Coalson, Chem. Phys. 120,327 (1988). 33J C. Tully, G. H. Gilmer, and M. Shugard, J. Chem. Phys. 71, 1630
(1979). 34Y. Zeiri and R. Kosloff, J. Chem. Phys. 93, 6890 (1990). “R. Kosloff and C. Cerjan, J. Chem. Phys. 90, 7556 (1989).
J. Chem. Phys., Vol. 98, No. 11, 1 June 1993
Downloaded 15 Sep 2002 to 132.64.1.37. Redistribution subject to AIP license or copyright, see http://ojps.aip.org/jcpo/jcpcr.jsp