Embed Size (px)
Citation preview
Dynamical mechanisms for African monsoon changes
during the mid-Holocene
Hui Su1 and J. David NeelinDepartment of Atmospheric and Oceanic Sciences, Institute of Geophysics and Planetary Physics, University of California,Los Angeles, California, USA
Received 26 January 2005; revised 9 June 2005; accepted 7 July 2005; published 6 October 2005.
[1] During the mid-Holocene, about 6 ka BP, the African monsoon was stronger andextended farther north than in present-day climate associated with differences in orbitalparameters affecting insolation. Earlier research suggests that land surface vegetationinteraction and atmosphere-ocean coupling may be important to the northwardextension of the Holocene monsoon rainfall, but different climate models producedifferent results in terms of rainfall distribution. This study examines the dynamicalmechanisms that modulate the orbital forcing effect on the African monsoon convection.A series of simulations with 6 ka BP orbital parameters, modified land surface albedothat mimics grassland extending over North Africa, and alterations of the modeldynamics are used. It is found that the ‘‘ventilation mechanism’’ (inflow of low moiststatic energy air from oceanic or poleward regions) is a key process in setting the northernrainfall boundary for the African monsoon. In particular, advection and diffusion of lessmoist air oppose the increase of moisture that would be required to meet the increasedconvective instability criteria set by the warmer tropospheric air above the continent.While changes in heat fluxes into the atmospheric column favor convection in principle,the ventilation mechanism limits the poleward extent of the region that can actuallyconvect.
Citation: Su, H., and J. D. Neelin (2005), Dynamical mechanisms for African monsoon changes during the mid-Holocene,
J. Geophys. Res., 110, D19105, doi:10.1029/2005JD005806.
1. Introduction
[2] During the mid-Holocene, about 6000 years ago,paleoenvironmental data imply a northward expansion ofthe area influenced by the African-Asian summer monsoon.For example, data from the Global Lake Status Data Base(GLSDB [Qin et al., 1998]) indicate that during the mid-Holocene in North Africa, the region between 15�N and30�N was occupied by extensive lakes and wetlands, whilethe pollen and plant macrofossil data set from the BIOME6000 project [Prentice and Webb, 1998] indicates that thetransition from steppe to desert vegetation, marking theSahara/Sahel boundary, was at least 5 degrees farther norththan today [Jolly et al., 1998].[3] At 6 ka BP, the Earth reached perihelion during
northern summer (as opposed to in winter at present),causing an increase of northern summer insolation at theexpense of winter insolation. The obliquity at 6 ka BP alsofavors summer insolation and further enhances the seasonalcycle in the Northern Hemisphere. The increased land-ocean contrast in northern summer tends to enhance the
continental monsoon. Numerous studies have beenperformed to examine the consequences of changes in theEarth’s orbital forcing [e.g., Kutzbach and Otto-Bliesner,1982; Kutzbach and Street-Perrott, 1985; Kutzbach et al.,1993; Hall and Valdes, 1997; Hewitt and Mitchell, 1996]. Inthe Paleoclimate Modeling Intercomparison Project (PMIP[Joussaume et al., 1999]), a number of atmospheric generalcirculation models (GCMs) simulated equilibrium climateunder the orbital parameters and atmospheric CO2 concen-tration for 6 ka BP while sea surface temperature (SST), icesheets, vegetation, and land surface properties were speci-fied from present day values. All models produced warmersummers in the Northern Hemisphere and an intensifiednorthern tropical monsoon. However, the northward shiftsof monsoon rainfall in all PMIP simulations are not as farnorth as required by paleoenvironmental data to sustain thelake and vegetation changes in North Africa at 6ka BP[Joussaume et al., 1999]. This suggests that although orbitalforcing is the fundamental cause of the monsoon changeduring the mid-Holocene, other feedbacks such as landsurface and ocean-atmosphere interaction may be alsoimportant [e.g., Kutzbach et al., 1996; TEMPO, 1996;Braconnot et al., 1999; Ganopolski et al., 1998].[4] Changes in vegetation and/or the extent of surface
water (lakes and wetlands) affect the land surface conditionsthrough changing albedo, surface roughness, and moistureavailability for recycling. GCM sensitivity experiments with
JOURNAL OF GEOPHYSICAL RESEARCH, VOL. 110, D19105, doi:10.1029/2005JD005806, 2005
1Now at Skillstorm Government Services, Jet Propulsion Laboratory,California Institute of Technology, Pasadena, California, USA.
Copyright 2005 by the American Geophysical Union.0148-0227/05/2005JD005806$09.00
D19105 1 of 13
changes in vegetation and soil characteristics produced asignificant enhancement of the African monsoon comparedto changes in orbital forcing alone [Harrison et al., 1998;Coe and Bonan, 1997; Brostrom et al., 1998; Claussen andGayler, 1997; Texier et al., 1997; Doherty et al., 2000;Ganopolski et al., 1998; Diffenbaugh and Sloan,2002]. Oceanic feedback for the climate change duringthe mid-Holocene has also been studied using coupledatmosphere-ocean models [Kutzbach and Liu, 1997; Hewittand Mitchell, 1998; Braconnot et al., 2000; Crucifix et al.,2002]. The consideration of interactive ocean enhances theorbitally induced changes in the African monsoon but isnot sufficient to explain the observed expansion. Wheninteractive vegetation is included in the coupled atmo-sphere-ocean models, the positive feedbacks of vegetationand ocean for summer monsoon do not merely sum up butexhibit a positive synergy. However, even with oceanicand vegetation feedbacks, the monsoon boundary doesnot move as far north as required to match paleodata[Braconnot et al., 1999; Ganopolski et al., 1998].[5] Although inclusion of land-surface feedback and air-
sea coupling may improve the simulations of mid-Holocene‘‘green Sahara’’ conditions, different atmospheric GCMsproduce different rainfall anomalies. For example, DeNoblet-Ducoudre et al. [2000] showed that different atmo-spheric GCMs coupled to the same vegetation model yielddifferent responses to orbital forcing. From this it may beinferred that some features of the differing atmosphericdynamics must be crucial to the distribution of monsoonprecipitation. This study aims to examine the mechanismsfor the monsoon rainfall changes at 6 ka BP from adynamical point of view.[6] In current climate, it is widely known that continental
monsoons are affected by land-ocean contrast [Webster etal., 1998]. However, as noted by Chou et al. [2001,hereinafter referred to as CNS], atmospheric dynamicalpathways are important in how this contrast affects mon-soons. An important effect is the advection of low moiststatic energy air from ocean regions into the summercontinents, termed the ‘‘ventilation mechanism’’ in CNS.This advection of low moist static energy air is veryeffective at opposing the warming tendency due to the largeinsolation and prevents conditions thermodynamicallyfavorable to deep convection from occurring over continen-tal subtropical and midlatitude regions.[7] Chou and Neelin [2001, 2003] found that ventilation
has a dominant effect in limiting the poleward extent of theSouth American, North American and Asian summer mon-soons. Over Africa, because of the high surface albedo overmuch of North Africa, there is less positive net flux ofenergy into the atmospheric column. Convection is lessthermodynamically favored and the ventilation mechanismhas a weaker impact in preventing poleward extent of theconvergence zone than in other continents. When NorthAfrica albedo is reduced, ventilation becomes a leadingfactor.[8] Surface albedo was smaller in Africa during the mid-
Holocene than present day, potentially allowing the venti-lation mechanism to play a stronger role in governing thestrength of monsoon precipitation. How this and otherdynamical mechanisms interact with the tendencies due toorbital forcing is far from clear. Here we quantify the
importance of dynamical processes for the mid-Holocene‘‘green Sahara’’ problem.[9] The paper is organized as follows. Section 2 describes
the model and design of numerical experiments. The modelresults are presented in section 3. Section 4 analyzesmechanisms formonsoon variations fromaquasi-equilibrium(QE) perspective and examines the moist static energybudget for the mid-Holocene African monsoon. Section 5presents a mechanism-testing experiment in which dynam-ical processes are intervened in the model. Section 6discusses impacts of model climatology on the monsoonstrength and extent. Conclusions are given in section 7.
2. Model and Experimental Design
[10] We use an intermediate complexity atmosphericcirculation model, the quasi-equilibrium tropical circulationmodel (QTCM), v2.3, [Neelin and Zeng, 2000; Zeng et al.,2000]. It includes nonlinear advection of temperature andmoisture, Betts-Miller cumulus parameterization [Betts andMiller, 1986] and a weakly nonlinear cloud radiationscheme [Chou, 1997]. Compared to its previous versions,v2.3 includes a simple atmospheric boundary layer model(ABL) for winds developed by Stevens et al. [2002] and anupdated cloud fraction calculation scheme.[11] In this study, we use a simple land surface model in
which vegetation/soil types are prescribed. A thin landsurface layer is used for energy budgets (such that the netsurface heat flux is close to zero on time scales longer than aday). A much thicker soil layer is used to represent the root-zone water budget. Sensible heat fluxes are evaluated usingthe standard bulk formula, while evaporation has a formu-lation akin to biophysical models, with a surface resistancesimilar to a stomatal resistance combined with the effects ofroot resistance in dry soil conditions [Dickinson et al.,1993]. This resistance increases as the soil moisture drops.Interactive soil moisture is calculated from the balance ofprecipitation, evaporation and runoff. A seasonally varyingsurface albedo is specified based the International SatelliteCloud Climatology Project (ISCCP) [Darnell et al., 1992].A modified version of the land model which permitsinteractive vegetation feedback [Zeng et al., 1999; Zengand Neelin, 2000] is used in a related study (K. Hales et al.,Interaction of vegetation and atmospheric dynamical mech-anisms in the mid-Holocene African monsoon, submitted toJournal of Climate, 2005, hereinafter referred to as Hales etal., submitted manuscript, 2005) to address the mechanismsfor the monsoon rainfall when land surface feedback isactive.[12] The model boundary conditions for the present-day
control run and the mid-Holocene 6 ka run (6ka_PMIP) arethe same as for the PMIP project [Joussaume et al., 1999].Orbital parameters are specified for the present-day and 6 kaBP conditions, respectively, and CO2 concentration is set at345 ppm for present-day and 280 ppm for 6 ka BP.Seasonally varying climatological SST and present-day landsurface properties are used for both present-day and 6 ka BPcontrol runs.[13] Additional experiments for the mid-Holocene case
include: the ‘‘6ka_Lowalb’’ run in which the surface albedoover the North African desert is replaced by the value of0.2, typical for grassland; the ‘‘Grassy Sahara’’ run in which
D19105 SU AND NEELIN: MECHANISMS FOR MID-HOLOCENE MONSOON
2 of 13
D19105
the desert surface type is changed to grass in NorthAfrica for evapotranspiration as well as albedo; and the‘‘6ka_Lowalb_ML’’ run in which a mixed layer oceanmodel is coupled to the QTCM. A mechanism-testing run
‘‘6ka_Lowadvq’’ reduces the advection of moisture anoma-lies to demonstrate the role of the ventilation mechanism.Several experiments with reduced horizontal diffusion ofmoisture (runs ‘‘Lowdfq’’, ‘‘6ka_Lowdfq_PMIP’’ and
Table 1. Summary of Model Experiments and Resultsa
Experiment NameDifferences Fromthe Control Run
Annual Rainfallat 16.875�N
Boundary of 200 mm/yearAnnual Rainfall
control present-day orbital, land surface, SST, CO2 at 345ppm 48.5 16�N6ka_PMIP 6ka orbital, CO2 at 280ppm 148 16.7�N6ka_Lowalb 6ka orbital, reduced albedo 540 19.5�NGrassy Sahara 6ka orbital, reduced albedo, desert changed to grass 563 19.5�N6ka_Lowalb_ML 6ka orbital, reduced albedo, mixed layer ocean on 667 20�N6ka_Lowadvq_0.7 6ka orbital, reduced albedo, reduced ventilation(*0.7) 785 22�N6ka_Lowadvq_0.5 6ka orbital, reduced albedo, reduced ventilation (*0.5) 963 24�N6ka_Lowadvq_0.3 6ka orbital, reduced albedo, reduced ventilation (*0.3) 1159 28�N and northward6ka_Lowadvq_0.1 6ka orbital, reduced albedo, reduced ventilation (*0.1) 1701 north of 30�NLowdfq same as the control, except lower moisture diffusion 185 16.8�N6ka_Lowdfq_PMIP same as 6ka_PMIP, except lower moisture diffusion 451 19.5�N6ka_Lowdfq_Lowalb same as 6ka_Lowalb, except lower moisture diffusion 971 23�N
aThe annual rainfall refers to the zonally averaged annual rainfall between 20�Wand 30�E (in mm/year). Reduced ventilation (*r) with r = 0.7, 0.5, 0.3,and 0.1 denotes hv � rqi reduced by a factor of r.
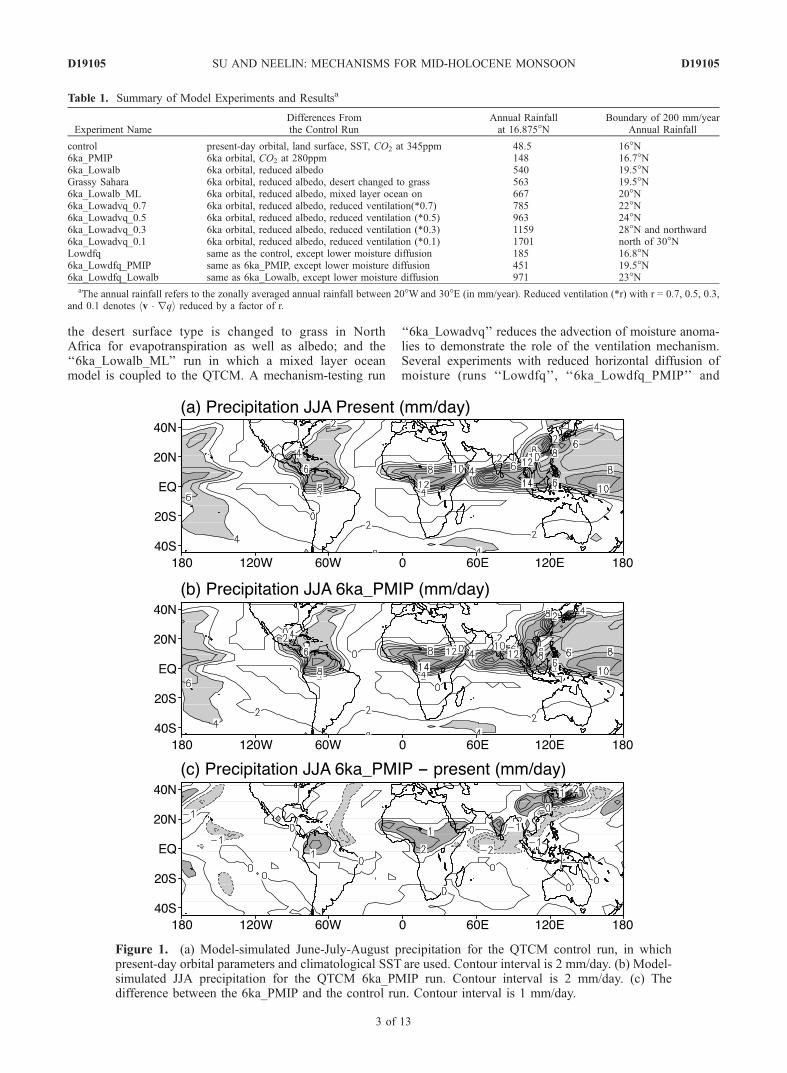
Figure 1. (a) Model-simulated June-July-August precipitation for the QTCM control run, in whichpresent-day orbital parameters and climatological SST are used. Contour interval is 2 mm/day. (b) Model-simulated JJA precipitation for the QTCM 6ka_PMIP run. Contour interval is 2 mm/day. (c) Thedifference between the 6ka_PMIP and the control run. Contour interval is 1 mm/day.
D19105 SU AND NEELIN: MECHANISMS FOR MID-HOLOCENE MONSOON
3 of 13
D19105
‘‘6ka_Lowdfq_Lowalb’’) are conducted as well. Table 1summarizes the experiments conducted.
3. Model Results
3.1. PMIP-Type Simulation
[14] The PMIP 6 ka BP simulations [Joussaume et al.,1999] provide a benchmark for the GCM responses to theorbital forcing 6000 years ago. To evaluate the QTCMmodel performance, it is natural to compare the QTCMPMIP-type simulation, run 6ka_PMIP, to the GCMresults produced by the PMIP. For both present-day andmid-Holocene experiments, ensemble means from tensimulations with slightly different initial conditions wereconstructed. The simulated precipitation for present day andthe mid-Holocene and changes between the two periods areshown in Figure 1. The model-simulated present-daysummer precipitation (June-July-August) is comparable toobservations [Xie and Arkin, 1997], although the
intertropical convergence zone (ITCZ) over the easternPacific and Atlantic is not as strong as the observed(Figure 1a). The location of the northern edge of the Africanmonsoon is at about 20�N, close to observations. Thesummer precipitation over Northern Hemisphere landregions is enhanced during the mid-Holocene, noticeablyover the monsoon regions, i.e., Africa, east Asia andnorthern South America (Figures 1b and 1c). The rainfallamount increases substantially over North Africa, butthe boundary of rainfall does not move much farthernorthward in the 6ka_PMIP run than the present-day controlrun (Table 1).[15] To directly compare with the GCM results from the
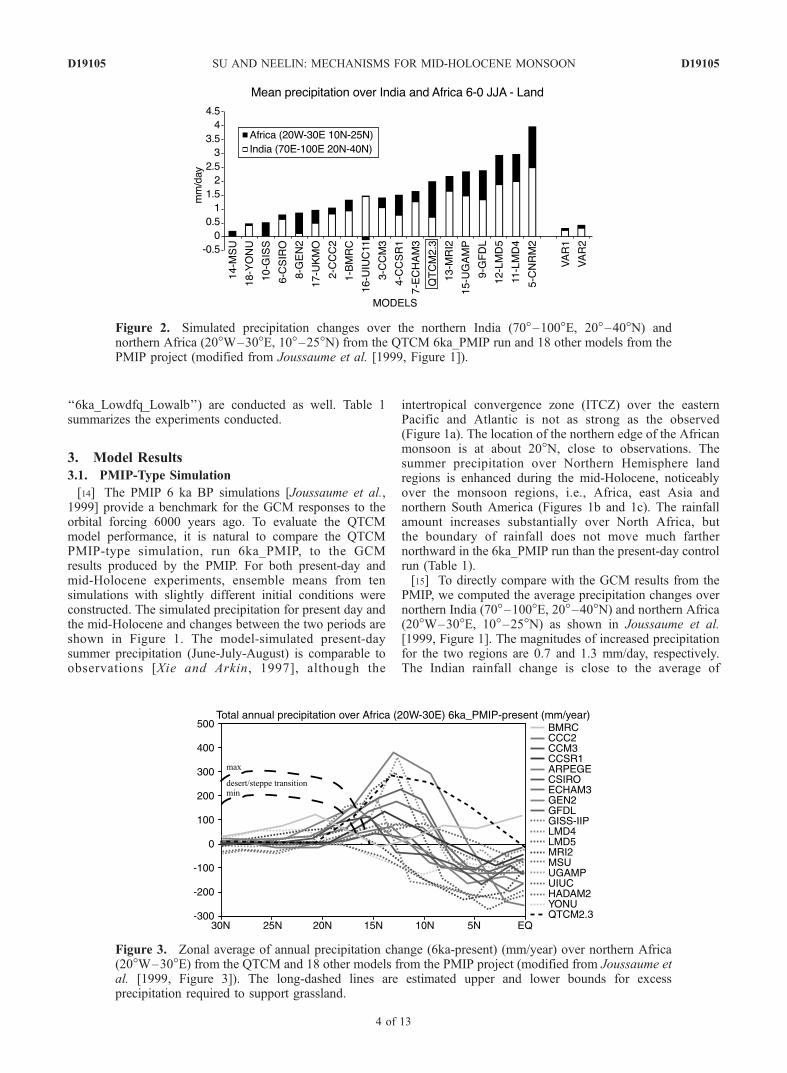
PMIP, we computed the average precipitation changes overnorthern India (70�–100�E, 20�–40�N) and northern Africa(20�W–30�E, 10�–25�N) as shown in Joussaume et al.[1999, Figure 1]. The magnitudes of increased precipitationfor the two regions are 0.7 and 1.3 mm/day, respectively.The Indian rainfall change is close to the average of
Figure 2. Simulated precipitation changes over the northern India (70�–100�E, 20�–40�N) andnorthern Africa (20�W–30�E, 10�–25�N) from the QTCM 6ka_PMIP run and 18 other models from thePMIP project (modified from Joussaume et al. [1999, Figure 1]).
Figure 3. Zonal average of annual precipitation change (6ka-present) (mm/year) over northern Africa(20�W–30�E) from the QTCM and 18 other models from the PMIP project (modified from Joussaume etal. [1999, Figure 3]). The long-dashed lines are estimated upper and lower bounds for excessprecipitation required to support grassland.
D19105 SU AND NEELIN: MECHANISMS FOR MID-HOLOCENE MONSOON
4 of 13
D19105
18 participating models, which range between 0. and2.5 mm/day. The rainfall change for northern Africaproduced by the QTCM, on the other hand, is abovethe average of the PMIP results, which range from 0. to1.5 mm/day (Figure 2).[16] The simulated surface air temperature during JJA at
6 ka BP is generally warmer than present over the NorthernHemisphere, with central Asia (40�–150�E, 30�–60�N)surface air temperature about 1 C warmer than present,comparable to the PMIP results, ranging from 0.6 to 2.1 C(figure not shown).[17] Figure 3 shows the model-simulated zonal average of
annual precipitation change for 6 ka minus present overNorth Africa from 20�W to 30�E. Figure 3 is modified from
Joussaume et al. [1999, Figure 3]. The results of the PMIPGCMs are shown in gray and the QTCM result is marked asa solid dashed line. The long-dashed lines are their estimatedupper and lower bounds for the excess precipitation requiredto support grassland. It is clear that the QTCM, similarto other GCMs for PMIP, does not produce sufficientprecipitation increase in North Africa (north of 15�N) tobe consistent with paleoenvironmental data when land-surface-vegetation feedback is not included.
3.2. Simulations With Lowered Albedo
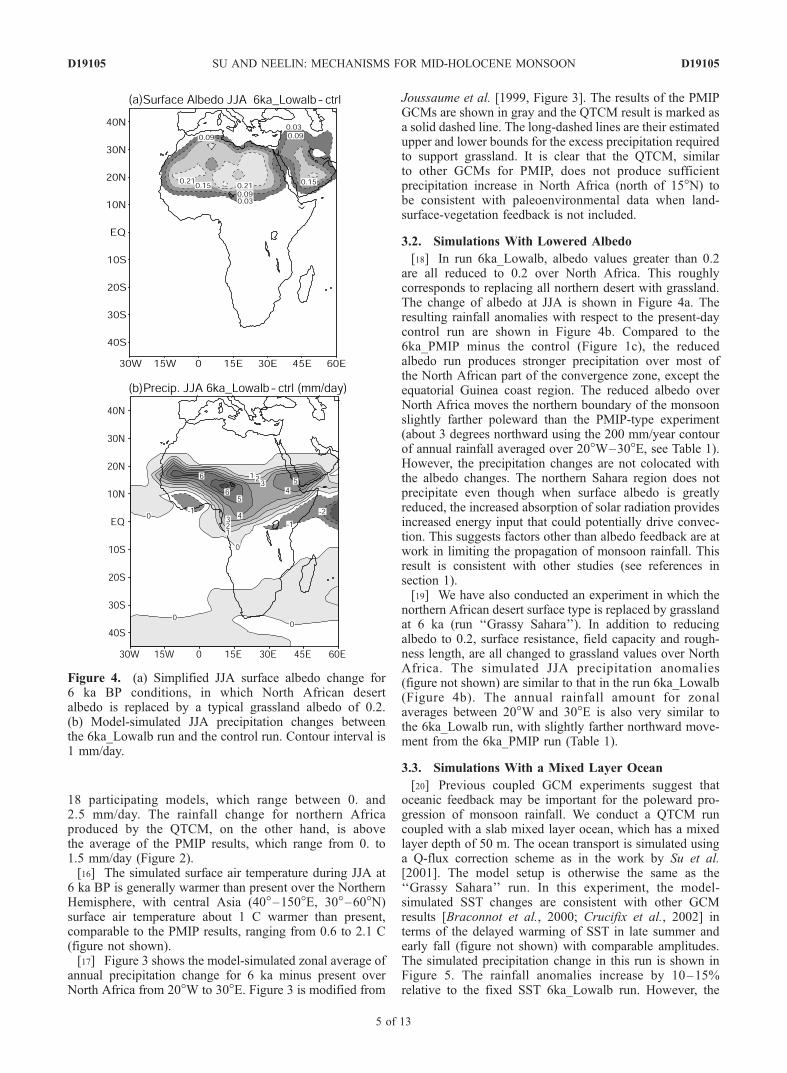
[18] In run 6ka_Lowalb, albedo values greater than 0.2are all reduced to 0.2 over North Africa. This roughlycorresponds to replacing all northern desert with grassland.The change of albedo at JJA is shown in Figure 4a. Theresulting rainfall anomalies with respect to the present-daycontrol run are shown in Figure 4b. Compared to the6ka_PMIP minus the control (Figure 1c), the reducedalbedo run produces stronger precipitation over most ofthe North African part of the convergence zone, except theequatorial Guinea coast region. The reduced albedo overNorth Africa moves the northern boundary of the monsoonslightly farther poleward than the PMIP-type experiment(about 3 degrees northward using the 200 mm/year contourof annual rainfall averaged over 20�W–30�E, see Table 1).However, the precipitation changes are not colocated withthe albedo changes. The northern Sahara region does notprecipitate even though when surface albedo is greatlyreduced, the increased absorption of solar radiation providesincreased energy input that could potentially drive convec-tion. This suggests factors other than albedo feedback are atwork in limiting the propagation of monsoon rainfall. Thisresult is consistent with other studies (see references insection 1).[19] We have also conducted an experiment in which the
northern African desert surface type is replaced by grasslandat 6 ka (run ‘‘Grassy Sahara’’). In addition to reducingalbedo to 0.2, surface resistance, field capacity and rough-ness length, are all changed to grassland values over NorthAfrica. The simulated JJA precipitation anomalies(figure not shown) are similar to that in the run 6ka_Lowalb(Figure 4b). The annual rainfall amount for zonalaverages between 20�W and 30�E is also very similar tothe 6ka_Lowalb run, with slightly farther northward move-ment from the 6ka_PMIP run (Table 1).
3.3. Simulations With a Mixed Layer Ocean
[20] Previous coupled GCM experiments suggest thatoceanic feedback may be important for the poleward pro-gression of monsoon rainfall. We conduct a QTCM runcoupled with a slab mixed layer ocean, which has a mixedlayer depth of 50 m. The ocean transport is simulated usinga Q-flux correction scheme as in the work by Su et al.[2001]. The model setup is otherwise the same as the‘‘Grassy Sahara’’ run. In this experiment, the model-simulated SST changes are consistent with other GCMresults [Braconnot et al., 2000; Crucifix et al., 2002] interms of the delayed warming of SST in late summer andearly fall (figure not shown) with comparable amplitudes.The simulated precipitation change in this run is shown inFigure 5. The rainfall anomalies increase by 10–15%relative to the fixed SST 6ka_Lowalb run. However, the
Figure 4. (a) Simplified JJA surface albedo change for6 ka BP conditions, in which North African desertalbedo is replaced by a typical grassland albedo of 0.2.(b) Model-simulated JJA precipitation changes betweenthe 6ka_Lowalb run and the control run. Contour interval is1 mm/day.
D19105 SU AND NEELIN: MECHANISMS FOR MID-HOLOCENE MONSOON
5 of 13
D19105
boundary of rainfall does not penetrate farther polewardexcept for the region near the west coast, where the rainfallboundary moves north about 3�–4�. Considering the zonalaverages of annual rainfall between 20�W and 30�E, theboundary of monsoon rainfall is barely changed from the6ka_Lowalb run to the 6ka_Lowalb_ML run (Table 1).
4. Approaching the Problem FromQuasi-Equilibrium Perspective
[21] Since the inclusion of 6 ka BP surface type changesand coupling with a mixed layer ocean do not affect themonsoon boundary significantly, we focus our analysis onthe simulations 6ka_PMIP and 6ka_Lowalb and comparethem to the present-day control run.
4.1. Diagnosis of Convective Threshold
[22] The boundary of monsoon rainfall closely relates towhere the threshold of convection is met. From the quasi-equilibrium point of view [Arakawa and Schubert, 1974;Emanuel et al., 1994], convection acts to remove theatmospheric column conditional instability, one measureof which is the convective available potential energy(CAPE), to restore the quasi-equilibrium of large-scalecirculation. On the basis of Betts-Miller convective adjust-ment scheme [Betts and Miller, 1986], the amount ofinstability can be represented by the difference betweencolumn-averaged tropospheric convective adjustment tem-perature (Tc) and tropospheric temperature (T), while Tc is afunction of T and tropospheric moisture (q). When Tincreases through a deep layer, Tc increases by a smallerextent if q is unchanged. Only when q increases sufficiently,can anomalies of Tc (T
0c) exceed anomalies of T (T0), leading
to increased precipitation. Thus we can regard an increase oftropospheric temperature as an increase of the convectivethreshold, while increase of moisture (which is mainly atlow levels) tends to overcome this convective threshold.
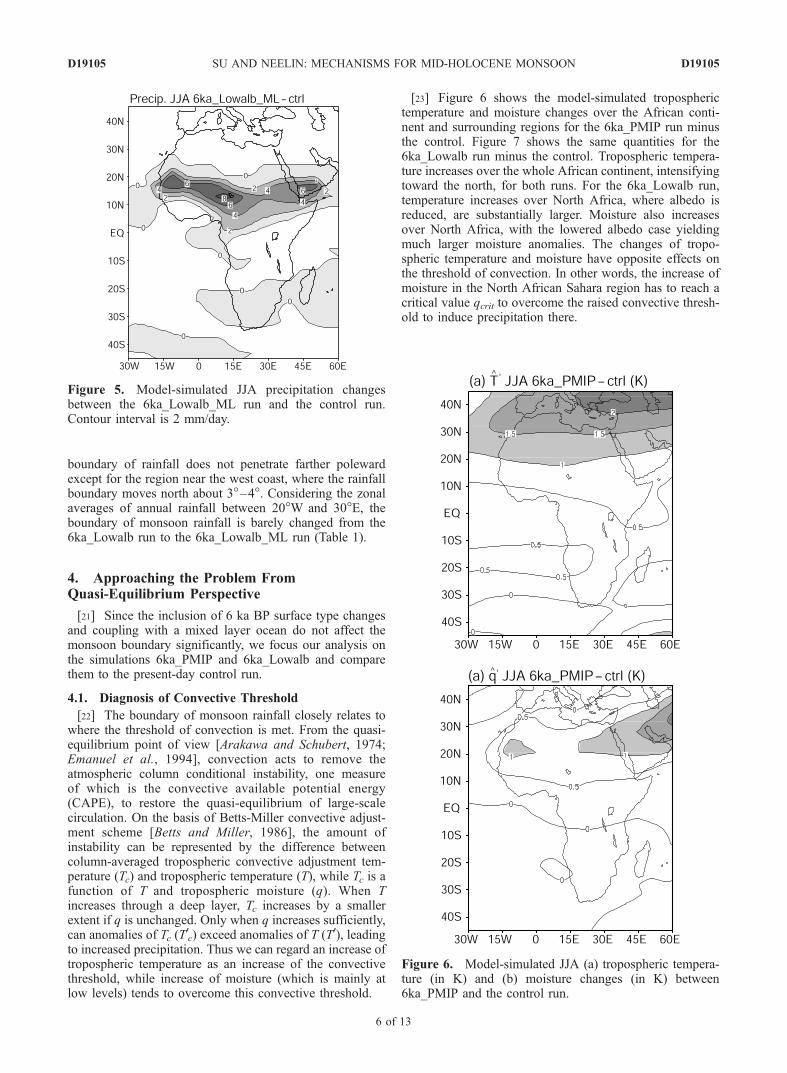
[23] Figure 6 shows the model-simulated tropospherictemperature and moisture changes over the African conti-nent and surrounding regions for the 6ka_PMIP run minusthe control. Figure 7 shows the same quantities for the6ka_Lowalb run minus the control. Tropospheric tempera-ture increases over the whole African continent, intensifyingtoward the north, for both runs. For the 6ka_Lowalb run,temperature increases over North Africa, where albedo isreduced, are substantially larger. Moisture also increasesover North Africa, with the lowered albedo case yieldingmuch larger moisture anomalies. The changes of tropo-spheric temperature and moisture have opposite effects onthe threshold of convection. In other words, the increase ofmoisture in the North African Sahara region has to reach acritical value qcrit to overcome the raised convective thresh-old to induce precipitation there.
Figure 5. Model-simulated JJA precipitation changesbetween the 6ka_Lowalb_ML run and the control run.Contour interval is 2 mm/day.
Figure 6. Model-simulated JJA (a) tropospheric tempera-ture (in K) and (b) moisture changes (in K) between6ka_PMIP and the control run.
D19105 SU AND NEELIN: MECHANISMS FOR MID-HOLOCENE MONSOON
6 of 13
D19105
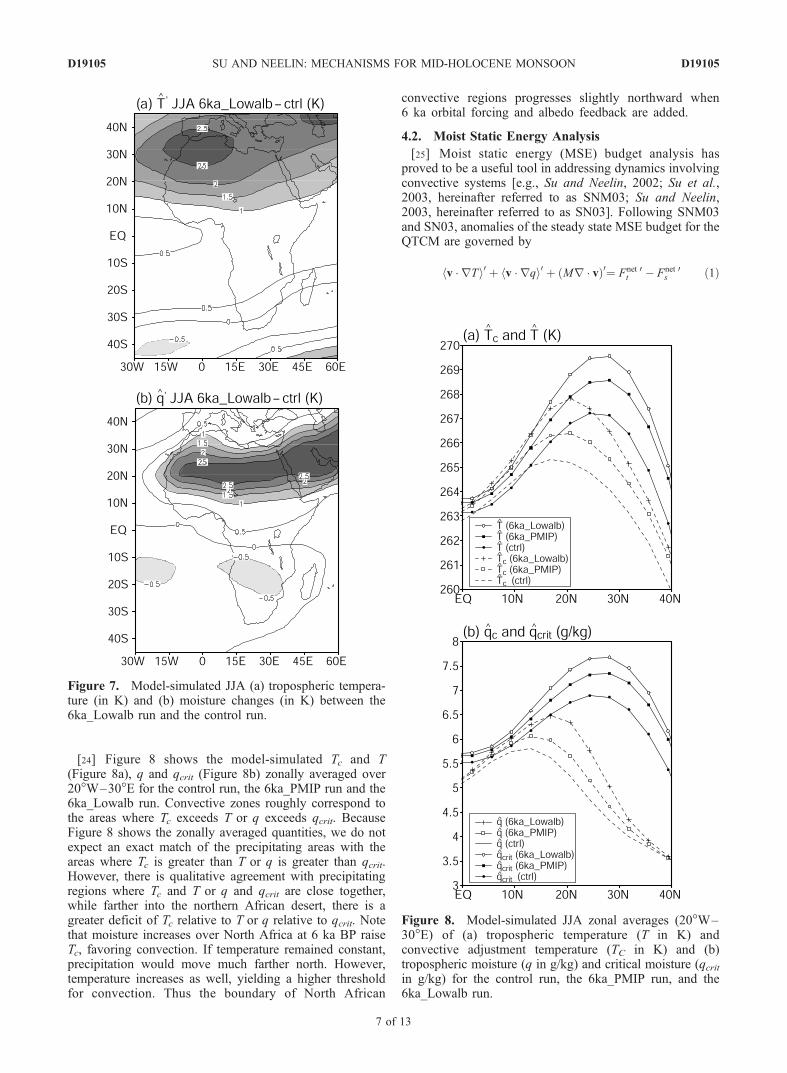
[24] Figure 8 shows the model-simulated Tc and T(Figure 8a), q and qcrit (Figure 8b) zonally averaged over20�W–30�E for the control run, the 6ka_PMIP run and the6ka_Lowalb run. Convective zones roughly correspond tothe areas where Tc exceeds T or q exceeds qcrit. BecauseFigure 8 shows the zonally averaged quantities, we do notexpect an exact match of the precipitating areas with theareas where Tc is greater than T or q is greater than qcrit.However, there is qualitative agreement with precipitatingregions where Tc and T or q and qcrit are close together,while farther into the northern African desert, there is agreater deficit of Tc relative to T or q relative to qcrit. Notethat moisture increases over North Africa at 6 ka BP raiseTc, favoring convection. If temperature remained constant,precipitation would move much farther north. However,temperature increases as well, yielding a higher thresholdfor convection. Thus the boundary of North African
convective regions progresses slightly northward when6 ka orbital forcing and albedo feedback are added.
4.2. Moist Static Energy Analysis
[25] Moist static energy (MSE) budget analysis hasproved to be a useful tool in addressing dynamics involvingconvective systems [e.g., Su and Neelin, 2002; Su et al.,2003, hereinafter referred to as SNM03; Su and Neelin,2003, hereinafter referred to as SN03]. Following SNM03and SN03, anomalies of the steady state MSE budget for theQTCM are governed by
hv � rTi0 þ hv � rqi0 þ Mr � vð Þ0¼ Fnett
0 Fnets
0 ð1Þ
Figure 7. Model-simulated JJA (a) tropospheric tempera-ture (in K) and (b) moisture changes (in K) between the6ka_Lowalb run and the control run.
Figure 8. Model-simulated JJA zonal averages (20�W–30�E) of (a) tropospheric temperature (T in K) andconvective adjustment temperature (TC in K) and (b)tropospheric moisture (q in g/kg) and critical moisture (qcritin g/kg) for the control run, the 6ka_PMIP run, and the6ka_Lowalb run.
D19105 SU AND NEELIN: MECHANISMS FOR MID-HOLOCENE MONSOON
7 of 13
D19105
where the first two terms on the left hand side are thevertically integrated advection of temperature and moisture,M is the ‘‘gross moist stability’’ [Neelin and Zeng, 2000]and ( )0 refers to the anomalies relative to the control run.Note that horizontal diffusion terms (commonly used inatmospheric numerical models as a representation ofsubgrid-scale contributions to advection) are included inthe advection terms for compactness. The right hand side ofthe equation is the net energy fluxes into the atmosphericcolumn, resulting from the difference between the top-of-atmosphere (TOA) and the surface. The sign is positive fordownward fluxes.[26] Because the net surface flux Fs
net 0 averages to zeroon time scales longer than a day over land, only theTOA flux anomalies Ft
net 0 matter in (1) for the Africanregion.
[27] The precipitation anomalies can be derived from thevertically integrated moisture equation [Su and Neelin,2002; Neelin and Su, 2005]
P0 ¼ Mqr � v� �0hv � rqi0 þ E0; ð2Þ
where Mq is the ‘‘gross moist stratification’’ [Neelin andZeng, 2000] and E0 is the evaporation anomalies.[28] Combining (2) with the MSE equation (1) for the
divergence, we obtain the approximate precipitation anom-aly equation
P0 ¼�Mq
�MFnett
0 �Mq
�Mþ 1
� �hv � rqi 0: ð3Þ
Here, changes in Mq and M (M0q and M0), and evaporation
anomalies (E0) have been neglected since they are small inthis application. Anomalous advection (plus diffusion) oftemperature (hv � rTi0) is also omitted in (3), although it isroughly a third to a half of the magnitude of hv � rqi0 andthus is not completely negligible. In budget diagnostics, it isstraightforward to include hv � rTi0. For discussionpurposes, the dynamics in (3), with hv � rTi0 neglected,appears to capture the leading behavior. Thus (3) ispresented for simplicity. The precipitation anomalies areapproximately determined by the energy balance betweenthe TOA fluxes and column-integrated advection ofmoisture anomalies.[29] Outside the convergence zones, advection of mois-
ture anomalies balance with the net energy fluxes at theTOA, with (3) reducing to
hv � rqi 0 ¼�Mq
�Ms
Fnett
0 ð4Þ
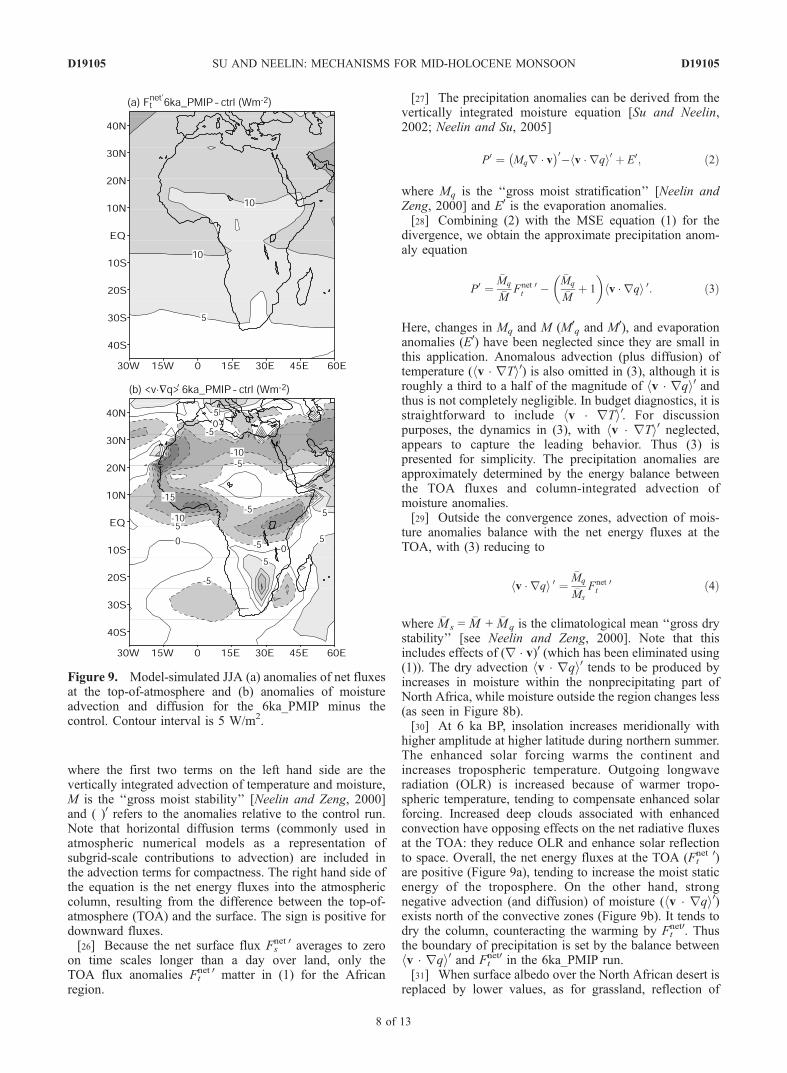
where �Ms = �M + �Mq is the climatological mean ‘‘gross drystability’’ [see Neelin and Zeng, 2000]. Note that thisincludes effects of (r � v)0 (which has been eliminated using(1)). The dry advection hv � rqi0 tends to be produced byincreases in moisture within the nonprecipitating part ofNorth Africa, while moisture outside the region changes less(as seen in Figure 8b).[30] At 6 ka BP, insolation increases meridionally with
higher amplitude at higher latitude during northern summer.The enhanced solar forcing warms the continent andincreases tropospheric temperature. Outgoing longwaveradiation (OLR) is increased because of warmer tropo-spheric temperature, tending to compensate enhanced solarforcing. Increased deep clouds associated with enhancedconvection have opposing effects on the net radiative fluxesat the TOA: they reduce OLR and enhance solar reflectionto space. Overall, the net energy fluxes at the TOA (Ft
net 0)are positive (Figure 9a), tending to increase the moist staticenergy of the troposphere. On the other hand, strongnegative advection (and diffusion) of moisture (hv � rqi0)exists north of the convective zones (Figure 9b). It tends todry the column, counteracting the warming by Ft
net0. Thusthe boundary of precipitation is set by the balance betweenhv � rqi0 and Ft
net0 in the 6ka_PMIP run.[31] When surface albedo over the North African desert is
replaced by lower values, as for grassland, reflection of
Figure 9. Model-simulated JJA (a) anomalies of net fluxesat the top-of-atmosphere and (b) anomalies of moistureadvection and diffusion for the 6ka_PMIP minus thecontrol. Contour interval is 5 W/m2.
D19105 SU AND NEELIN: MECHANISMS FOR MID-HOLOCENE MONSOON
8 of 13
D19105
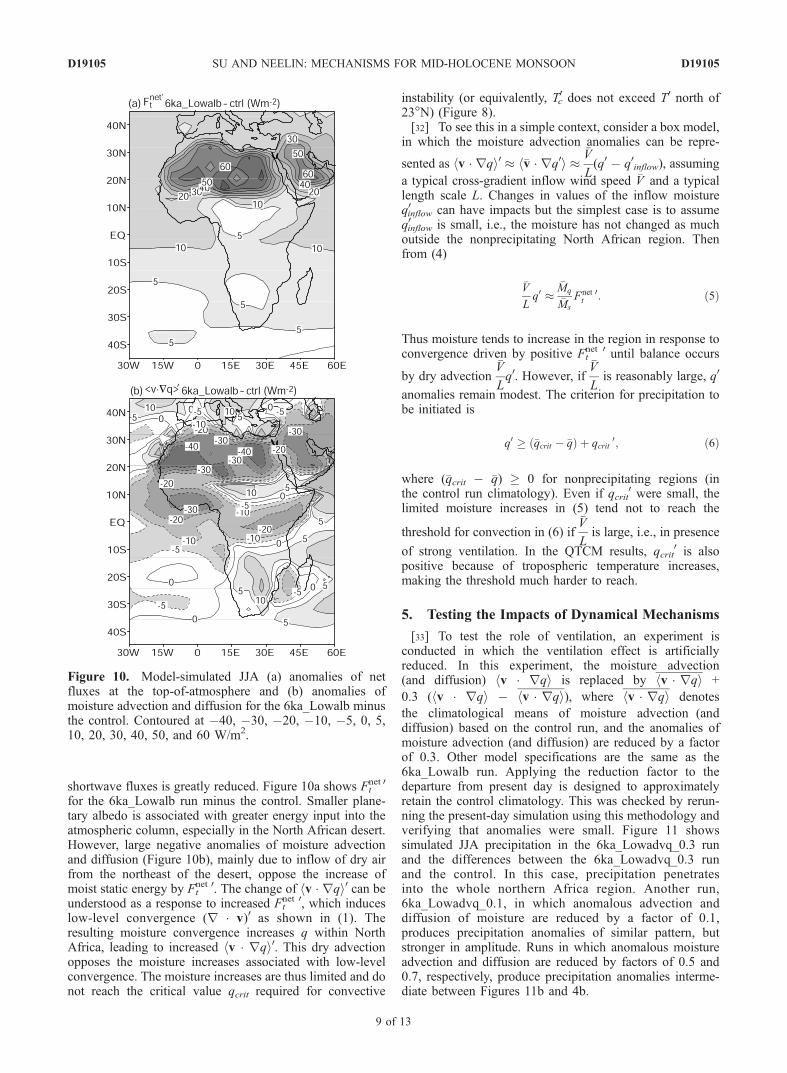
shortwave fluxes is greatly reduced. Figure 10a shows Ftnet 0
for the 6ka_Lowalb run minus the control. Smaller plane-tary albedo is associated with greater energy input into theatmospheric column, especially in the North African desert.However, large negative anomalies of moisture advectionand diffusion (Figure 10b), mainly due to inflow of dry airfrom the northeast of the desert, oppose the increase ofmoist static energy by Ft
net 0. The change of hv � rqi0 can beunderstood as a response to increased Ft
net 0, which induceslow-level convergence (r � v)0 as shown in (1). Theresulting moisture convergence increases q within NorthAfrica, leading to increased hv � rqi0. This dry advectionopposes the moisture increases associated with low-levelconvergence. The moisture increases are thus limited and donot reach the critical value qcrit required for convective
instability (or equivalently, T0c does not exceed T0 north of23�N) (Figure 8).[32] To see this in a simple context, consider a box model,
in which the moisture advection anomalies can be repre-
sented as hv � rqi0 � h�v � rq0i ��V
L(q0 q0inflow), assuming
a typical cross-gradient inflow wind speed �V and a typicallength scale L. Changes in values of the inflow moistureq0inflow can have impacts but the simplest case is to assumeq0inflow is small, i.e., the moisture has not changed as muchoutside the nonprecipitating North African region. Thenfrom (4)
�V
Lq0 �
�Mq
�Ms
Fnett
0: ð5Þ
Thus moisture tends to increase in the region in response toconvergence driven by positive Ft
net 0 until balance occurs
by dry advection�V
Lq0. However, if
�V
Lis reasonably large, q0
anomalies remain modest. The criterion for precipitation tobe initiated is
q0 � �qcrit �qð Þ þ qcrit0; ð6Þ
where (�qcrit �q) � 0 for nonprecipitating regions (inthe control run climatology). Even if qcrit
0 were small, thelimited moisture increases in (5) tend not to reach the
threshold for convection in (6) if�V
Lis large, i.e., in presence
of strong ventilation. In the QTCM results, qcrit0 is also
positive because of tropospheric temperature increases,making the threshold much harder to reach.
5. Testing the Impacts of Dynamical Mechanisms
[33] To test the role of ventilation, an experiment isconducted in which the ventilation effect is artificiallyreduced. In this experiment, the moisture advection(and diffusion) hv � rqi is replaced by hv � rqi +
0.3 (hv � rqi hv � rqi), where hv � rqi denotes
the climatological means of moisture advection (anddiffusion) based on the control run, and the anomalies ofmoisture advection (and diffusion) are reduced by a factorof 0.3. Other model specifications are the same as the6ka_Lowalb run. Applying the reduction factor to thedeparture from present day is designed to approximatelyretain the control climatology. This was checked by rerun-ning the present-day simulation using this methodology andverifying that anomalies were small. Figure 11 showssimulated JJA precipitation in the 6ka_Lowadvq_0.3 runand the differences between the 6ka_Lowadvq_0.3 runand the control. In this case, precipitation penetratesinto the whole northern Africa region. Another run,6ka_Lowadvq_0.1, in which anomalous advection anddiffusion of moisture are reduced by a factor of 0.1,produces precipitation anomalies of similar pattern, butstronger in amplitude. Runs in which anomalous moistureadvection and diffusion are reduced by factors of 0.5 and0.7, respectively, produce precipitation anomalies interme-diate between Figures 11b and 4b.
Figure 10. Model-simulated JJA (a) anomalies of netfluxes at the top-of-atmosphere and (b) anomalies ofmoisture advection and diffusion for the 6ka_Lowalb minusthe control. Contoured at 40, 30, 20, 10, 5, 0, 5,10, 20, 30, 40, 50, and 60 W/m2.
D19105 SU AND NEELIN: MECHANISMS FOR MID-HOLOCENE MONSOON
9 of 13
D19105
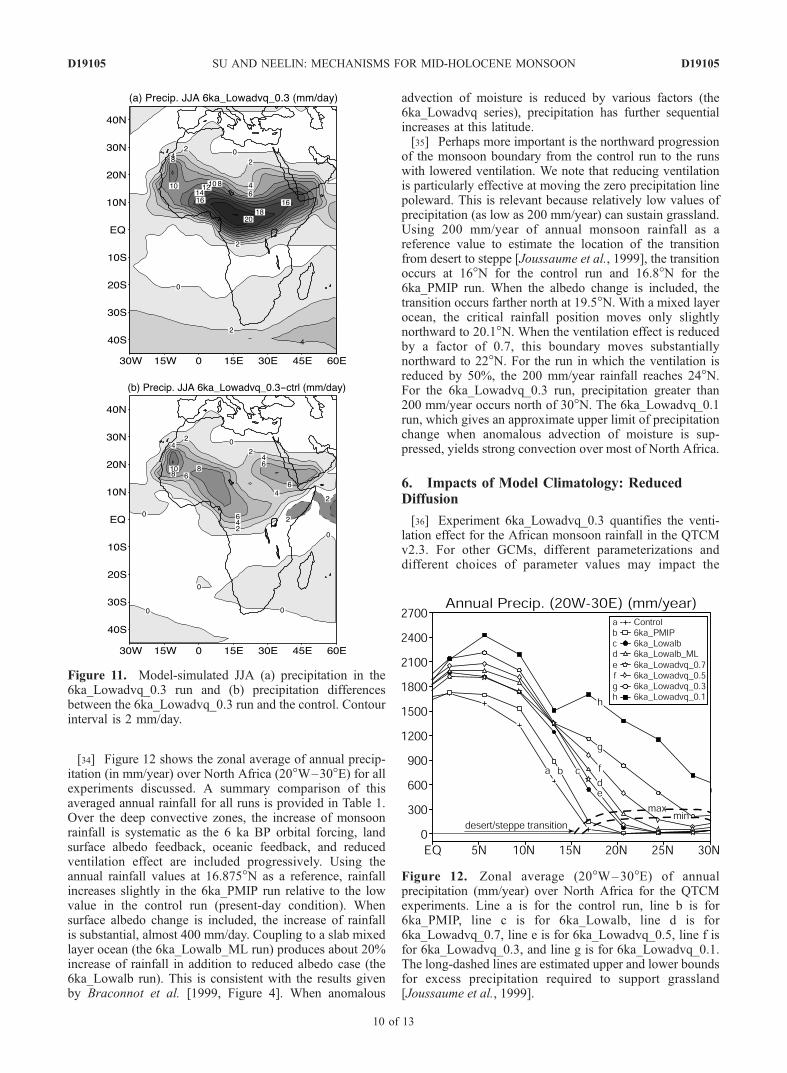
[34] Figure 12 shows the zonal average of annual precip-itation (in mm/year) over North Africa (20�W–30�E) for allexperiments discussed. A summary comparison of thisaveraged annual rainfall for all runs is provided in Table 1.Over the deep convective zones, the increase of monsoonrainfall is systematic as the 6 ka BP orbital forcing, landsurface albedo feedback, oceanic feedback, and reducedventilation effect are included progressively. Using theannual rainfall values at 16.875�N as a reference, rainfallincreases slightly in the 6ka_PMIP run relative to the lowvalue in the control run (present-day condition). Whensurface albedo change is included, the increase of rainfallis substantial, almost 400 mm/day. Coupling to a slab mixedlayer ocean (the 6ka_Lowalb_ML run) produces about 20%increase of rainfall in addition to reduced albedo case (the6ka_Lowalb run). This is consistent with the results givenby Braconnot et al. [1999, Figure 4]. When anomalous
advection of moisture is reduced by various factors (the6ka_Lowadvq series), precipitation has further sequentialincreases at this latitude.[35] Perhaps more important is the northward progression
of the monsoon boundary from the control run to the runswith lowered ventilation. We note that reducing ventilationis particularly effective at moving the zero precipitation linepoleward. This is relevant because relatively low values ofprecipitation (as low as 200 mm/year) can sustain grassland.Using 200 mm/year of annual monsoon rainfall as areference value to estimate the location of the transitionfrom desert to steppe [Joussaume et al., 1999], the transitionoccurs at 16�N for the control run and 16.8�N for the6ka_PMIP run. When the albedo change is included, thetransition occurs farther north at 19.5�N. With a mixed layerocean, the critical rainfall position moves only slightlynorthward to 20.1�N. When the ventilation effect is reducedby a factor of 0.7, this boundary moves substantiallynorthward to 22�N. For the run in which the ventilation isreduced by 50%, the 200 mm/year rainfall reaches 24�N.For the 6ka_Lowadvq_0.3 run, precipitation greater than200 mm/year occurs north of 30�N. The 6ka_Lowadvq_0.1run, which gives an approximate upper limit of precipitationchange when anomalous advection of moisture is sup-pressed, yields strong convection over most of North Africa.
6. Impacts of Model Climatology: ReducedDiffusion
[36] Experiment 6ka_Lowadvq_0.3 quantifies the venti-lation effect for the African monsoon rainfall in the QTCMv2.3. For other GCMs, different parameterizations anddifferent choices of parameter values may impact the
Figure 11. Model-simulated JJA (a) precipitation in the6ka_Lowadvq_0.3 run and (b) precipitation differencesbetween the 6ka_Lowadvq_0.3 run and the control. Contourinterval is 2 mm/day.
Figure 12. Zonal average (20�W–30�E) of annualprecipitation (mm/year) over North Africa for the QTCMexperiments. Line a is for the control run, line b is for6ka_PMIP, line c is for 6ka_Lowalb, line d is for6ka_Lowadvq_0.7, line e is for 6ka_Lowadvq_0.5, line f isfor 6ka_Lowadvq_0.3, and line g is for 6ka_Lowadvq_0.1.The long-dashed lines are estimated upper and lower boundsfor excess precipitation required to support grassland[Joussaume et al., 1999].
D19105 SU AND NEELIN: MECHANISMS FOR MID-HOLOCENE MONSOON
10 of 13
D19105
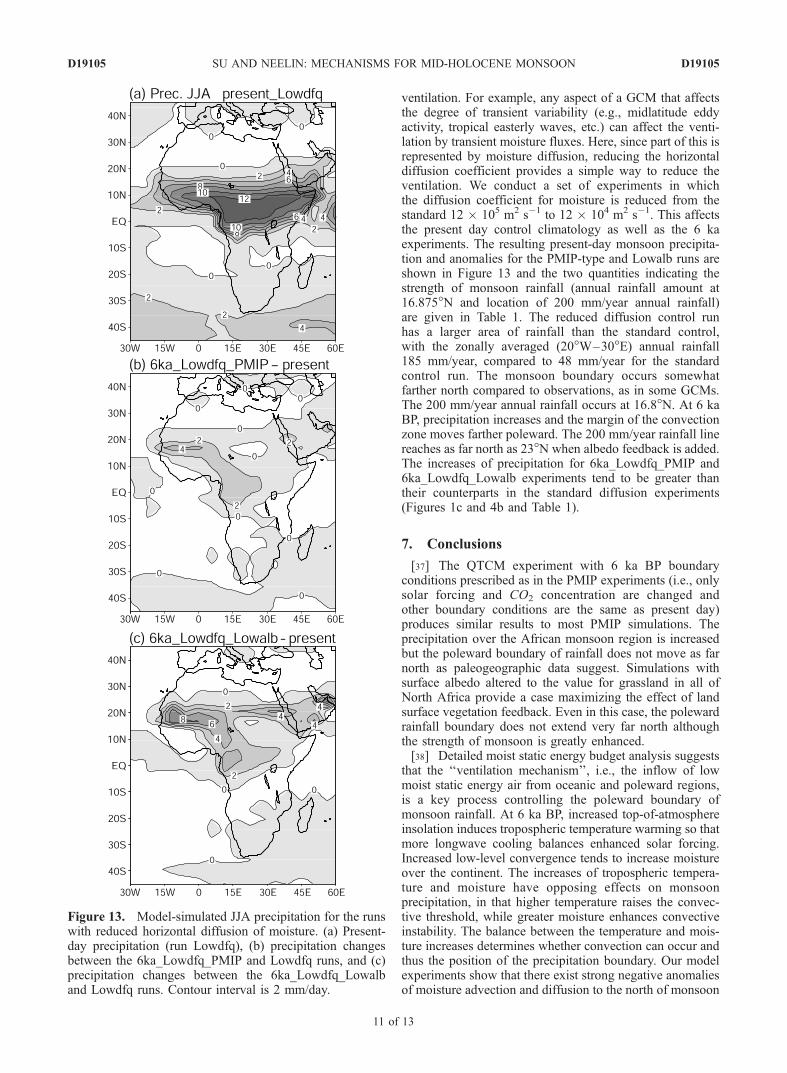
ventilation. For example, any aspect of a GCM that affectsthe degree of transient variability (e.g., midlatitude eddyactivity, tropical easterly waves, etc.) can affect the venti-lation by transient moisture fluxes. Here, since part of this isrepresented by moisture diffusion, reducing the horizontaldiffusion coefficient provides a simple way to reduce theventilation. We conduct a set of experiments in whichthe diffusion coefficient for moisture is reduced from thestandard 12 105 m2 s1 to 12 104 m2 s1. This affectsthe present day control climatology as well as the 6 kaexperiments. The resulting present-day monsoon precipita-tion and anomalies for the PMIP-type and Lowalb runs areshown in Figure 13 and the two quantities indicating thestrength of monsoon rainfall (annual rainfall amount at16.875�N and location of 200 mm/year annual rainfall)are given in Table 1. The reduced diffusion control runhas a larger area of rainfall than the standard control,with the zonally averaged (20�W–30�E) annual rainfall185 mm/year, compared to 48 mm/year for the standardcontrol run. The monsoon boundary occurs somewhatfarther north compared to observations, as in some GCMs.The 200 mm/year annual rainfall occurs at 16.8�N. At 6 kaBP, precipitation increases and the margin of the convectionzone moves farther poleward. The 200 mm/year rainfall linereaches as far north as 23�N when albedo feedback is added.The increases of precipitation for 6ka_Lowdfq_PMIP and6ka_Lowdfq_Lowalb experiments tend to be greater thantheir counterparts in the standard diffusion experiments(Figures 1c and 4b and Table 1).
7. Conclusions
[37] The QTCM experiment with 6 ka BP boundaryconditions prescribed as in the PMIP experiments (i.e., onlysolar forcing and CO2 concentration are changed andother boundary conditions are the same as present day)produces similar results to most PMIP simulations. Theprecipitation over the African monsoon region is increasedbut the poleward boundary of rainfall does not move as farnorth as paleogeographic data suggest. Simulations withsurface albedo altered to the value for grassland in all ofNorth Africa provide a case maximizing the effect of landsurface vegetation feedback. Even in this case, the polewardrainfall boundary does not extend very far north althoughthe strength of monsoon is greatly enhanced.[38] Detailed moist static energy budget analysis suggests
that the ‘‘ventilation mechanism’’, i.e., the inflow of lowmoist static energy air from oceanic and poleward regions,is a key process controlling the poleward boundary ofmonsoon rainfall. At 6 ka BP, increased top-of-atmosphereinsolation induces tropospheric temperature warming so thatmore longwave cooling balances enhanced solar forcing.Increased low-level convergence tends to increase moistureover the continent. The increases of tropospheric tempera-ture and moisture have opposing effects on monsoonprecipitation, in that higher temperature raises the convec-tive threshold, while greater moisture enhances convectiveinstability. The balance between the temperature and mois-ture increases determines whether convection can occur andthus the position of the precipitation boundary. Our modelexperiments show that there exist strong negative anomaliesof moisture advection and diffusion to the north of monsoon
Figure 13. Model-simulated JJA precipitation for the runswith reduced horizontal diffusion of moisture. (a) Present-day precipitation (run Lowdfq), (b) precipitation changesbetween the 6ka_Lowdfq_PMIP and Lowdfq runs, and (c)precipitation changes between the 6ka_Lowdfq_Lowalband Lowdfq runs. Contour interval is 2 mm/day.
D19105 SU AND NEELIN: MECHANISMS FOR MID-HOLOCENE MONSOON
11 of 13
D19105
convective zones. This inflow of low moist static energy airlimits moisture increase and thus tends to oppose theoccurrence of convection. Experiments that deliberatelyalter the strength of the ventilation confirm its importancein this model. It suggests that dynamical mechanisms, heredominantly the ventilation mechanism, are important insetting the poleward boundary of monsoon rainfall. Thedirect solar forcing and its interaction with land surfaceprocesses are mediated through the dynamical mechanisms.The poleward extent of the monsoon is thus determined bythe interplay of ventilation mechanism and land surfacefeedback.[39] Coupling with a slab mixed layer ocean appears to
increase the rainfall by only 10–20% (in the case whereNorth African albedo is set to a grassland value). This isconsistent with the differences between interactive oceanand fixed ocean runs in Braconnot et al. [1999] (withinteractive vegetation).[40] Our results based on an intermediate climate model,
the QTCM, may have limitations in that the model employsa crude treatment of the atmospheric boundary layer. Themoisture structure is limited to one deep convective mode,which may impact the effect of moisture advection (anddiffusion). However, the demonstration of the importance ofthe ventilation mechanism for the position of monsoonrainfall boundary is consistent with, and helps to explain,results using more comprehensive GCMs, such as DeNoblet-Ducoudre et al. [2000]. In their study, under mid-Holocene conditions, the LMD model rainfall (1 mm/daycontour) fails to advance past roughly 15�–18�N in WestAfrica, while that of the ECHAMmodel does (their Figure 8).In this region, the LMD climatology has substantiallystronger winds (their Figure 7), suggesting that strongerventilation may indeed be relevant to the differences insimulations. The mechanism-testing experiments in whichthe moisture advection anomalies are altered artificiallyidentifies the quantitative role of ventilation mechanism.Even when the moisture advection anomalies are reducedby only 30% (the 6ka_Lowadvq_0.7 run), the northwardmovement of monsoon rainfall boundary is substantial(Figure 12), and even larger movement occurs for reductionby 50% or greater. Our experiments suggest that in thepresence of strong ventilation, land surface and orbitaleffects cannot have as much impact on the movement ofmonsoon rainfall as if ventilation is weaker. This points toventilation as a key dynamical process that modulatesorbital forcing and land surface feedbacks. Diagnostics ofthis mechanism in GCMs should be useful in understandingthe mid-Holocene African monsoon response.[41] For the ‘‘Green Sahara’’ problem, both the ventila-
tion mechanism and albedo feedback are important. We findthat the quantitative role of dynamical mechanisms variesunder different surface conditions. When the albedo overthe Sahara is high, as in present-day conditions, reduction ofmoisture advection and diffusion anomalies produces lessincrease of precipitation than when surface albedo is low-ered to values of grassland, as in 6 ka BP (figure notshown). Large surface albedo significantly limits the energyreceived in the atmospheric column and thus convection.Lower albedo allows more room for dynamical processes toimpact the moist static energy variations of the column,which govern occurrence of convection. Conversely, for
models with different strength of the ventilation mechanism,the effect of albedo change may also vary. When one factoris strongly limiting, e.g., high albedo or strong ventilation,the impact of the other tends to be small, but for moderatevalues of either, both come into play. Overall, both dynam-ical mechanisms and land surface feedback are key factorsin determining the poleward boundary of monsoon rainfall.[42] In this study, the effect of land surface feedback is
prescribed by setting the values of albedo and surface type.A follow-on paper by Hales et al. (submitted manuscript,2005) uses a simple interactive vegetation model coupledwith the QTCM. In their results, the ventilation mechanismis still important to the strength and poleward extent of theAfrican monsoon and interaction between the dynamicalmechanisms identified here and vegetation feedback isexplored.
[43] Acknowledgments. This work was supported under NationalScience Foundation grant ATM-0082529. The authors thank J. E. Meyersonfor assistance with computation and graphics. This is UCLA IGPPcontribution 6220.
ReferencesArakawa, A., and W. H. Schubert (1974), Interaction of a cumulus cloudensemble with the large-scale environment, part I, J. Atmos. Sci., 31,674–701.
Betts, A. K., and M. J. Miller (1986), A new convective adjustment scheme.part II: Single column tests using GATE wave, BOMEX, ATEX andarctic air-mass data sets, Q. J. R. Meteorol. Soc., 112, 693–709.
Braconnot, P., S. Joussaume, O. Marti, and N. de Noblet (1999), Synergisticfeedbacks from ocean and vegetation on the African monsoon response tomid-Holocene insolation, Geophys. Res. Lett., 26, 2481–2484.
Braconnot, P., S. Joussaume, N. de Noblet, and G. Ramstein (2000), Mid-Holocene and Last Glacial Maximum African monsoon changes assimulated within the Paleoclimate Modelling Intercomparison Project,Global Planet. Change, 26, 51–66.
Brostrom, A., et al. (1998), Land surface feedbacks and palaeomonsoons innorthern Africa, Geophys. Res. Lett., 25, 3615–3618.
Chou, C. (1997), Simplified radiation and convection treatments for large-scale tropical atmospheric modeling, Ph.D. dissertation, 215 pp., Univ. ofCalif., Los Angeles.
Chou, C., and J. D. Neelin (2001), Mechanisms limiting the southwardextent of the South American summer monsoon, Geophys. Res. Lett.,28, 2433–2436.
Chou, C., and J. D. Neelin (2003), Mechanisms limiting the northwardextent of the northern summer convection zones, J. Clim., 16, 406–425.
Chou, C., J. D. Neelin, and H. Su (2001), Ocean-atmosphere-land feed-backs in an idealized monsoon, Q. J. R. Meteorol. Soc., 127, 1869–1891.
Claussen, M., and V. Gayler (1997), The greening of Sahara during the mid-Holocene results of an interactive atmosphere-biome model, Global Ecol.Biogeogr. Lett., 6, 369–377.
Coe, M. T., and G. B. Bonan (1997), Feedbacks between climate andsurface water in northern Africa during the middle Holocene, J. Geophys.Res., 102, 11,087–11,101.
Crucifix, M., et al. (2002), Climate evolution during the Holocene: A studywith an Earth system model of intermediate complexity, Clim. Dyn., 19,43–60.
Darnell, W. L., W. F. Staylor, S. K. Gupta, N. A. Ritchey, and A. C. Wilber(1992), Seasonal variation of surface radiation budget derived from Inter-national Satellite Cloud Climatology Project C1 data, J. Geophys. Res.,97, 15,741–15,760.
De Noblet-Ducoudre, N., M. Claussen, and C. Prentice (2000), Mid-Holocene greening of the Sahara: First results of the GAIM 6000 yearBP experiment with two asynchronously coupled atmosphere/biomemodels, Clim. Dyn., 16, 643–659.
Dickinson, R. E., A. Henderson-Sellers, and P. J. Kennedy (1993),Biosphere-Atmosphere Transfer Scheme (BATS) version 1e as coupledto the NCAR Community Climate Model, NCAR Tech. Note NCAR/TN-387+STR, 72 pp., Natl. Cent. for Atmos. Res., Boulder, Colo.
Diffenbaugh, N. S., and L. C. Sloan (2002), Global climate sensitivity toland surface change: The mid-Holocene revisited, Geophys. Res. Lett.,29(10), 1476, doi:10.1029/2002GL014880.
D19105 SU AND NEELIN: MECHANISMS FOR MID-HOLOCENE MONSOON
12 of 13
D19105
Doherty, R., J. Kutzbach, J. Foley, and D. Pollard (2000), Fully coupledclimate/dynamical vegetation model simulations over northern Africaduring the mid-Holocene, Clim. Dyn., 16, 561–573.
Emanuel, K. A., J. D. Neelin, and C. S. Bretherton (1994), On large-scalecirculations in convecting atmospheres, Q. J. R. Meteorol. Soc., 120,1111–1143.
Ganopolski, A., et al. (1998), The influence of vegetation-atmosphere-ocean interaction on climate during the mid-Holocene, Science, 280,1916–1919.
Hall, N. M. J., and P. J. Valdes (1997), A GCM simulation of the climate6000 years ago, J. Clim., 10, 3–17.
Harrison, S. P., et al. (1998), Intercomparison of simulated global vegeta-tion distributions in response to 6 kyr BP orbital forcing, J. Clim., 11,2721–2742.
Hewitt, C. D., and J. F. B. Mitchell (1996), GCM simulations of the climateof 6 kyr BP: Mean changes and interdecadal variability, J. Clim., 9,3505–3529.
Hewitt, C. D., and J. F. B. Mitchell (1998), A fully coupled GCM simulationof the climate of the mid-Holocene, Geophys. Res. Lett., 25, 361–364.
Jolly, D., S. P. Harrison, B. Damnati, and R. Bonnefille (1998), Simulatedclimate and biomes of Africa during the late Quaternary: Comparisonwith pollen and lake status data, Quat. Sci. Rev., 17, 629–657.
Joussaume, S., et al. (1999), Monsoon changes for 6000 years ago: Resultsof 18 simulations from the Paleoclimate Modeling Intercomparison Pro-ject (PMIP), Geophys. Res. Lett., 26, 859–862.
Kutzbach, J. E., and Z. Liu (1997), Response of the African monsoon toorbital forcing and ocean feedbacks in the middle Holocene, Science,278, 440–443.
Kutzbach, J. E., and B. L. Otto-Bliesner (1982), The sensitivity of theAfrican-Asian monsoonal climate to orbital parameter changes for 9000years B.P. in a low-resolution general circulation model, J. Atmos. Sci.,39, 1177–1188.
Kutzbach, J. E., and F. A. Street-Perrott (1985), Milankovitch forcing offluctuations in the level of tropical lakes from 18 to 0 kyr BP, Nature,317, 130–134.
Kutzbach, J. E., P. J. Guetter, P. J. Behling, and R. Selin (1993), Simulatedclimatic changes: Results of the COHMAP climate-model experiments,in Global Climates Since the Last Glacial Maximum, edited by H. E.Wright Jr. et al., pp. 24–93, Univ. of Minn. Press, Minneapolis.
Kutzbach, J. E., G. Bonan, J. Foley, and S. P. Harrison (1996), Vegetationand soil feedbacks on the response of the African monsoon to orbitalforcing in the early to middle Holocene, Nature, 384, 623–626.
Neelin, J. D., and H. Su (2005), Moist teleconnection mechanisms for thetropical South American and Atlantic sector, J. Clim., 18, 3928–3950.
Neelin, J. D., and N. Zeng (2000), The quasi-equilibrium tropical circula-tion model– formulation, J. Atmos. Sci., 57, 1741–1766.
Prentice, I., and T. Webb III (1998), BIOME 6000: Reconstructing globalmid-Holocene vegetation patterns from palaeoecological records, J. Bio-geogr., 25, 997–1005.
Qin, B., S. P. Harrison, and J. E. Kutzbach (1998), Evaluation ofmodelled regional water balance using lake status data: A comparisonof 6 ka simulations with the NCAR CCM, Quat. Sci. Rev., 17, 535–548.
Stevens, B., J. Duan, J. C. McWilliams, M. Munnich, and J. D. Neelin(2002), Entrainment, Rayleigh friction and boundary layer winds over thetropical Pacific, J. Clim., 15, 30–44.
Su, H., and J. D. Neelin (2002), Teleconnection mechanisms for tropicalPacific descent anomalies during El Nino, J. Atmos. Sci., 59, 2682–2700.
Su, H., and J. D. Neelin (2003), The scatter in tropical average precipitationanomalies, J. Clim., 16, 3966–3977.
Su, H., J. D. Neelin, and C. Chou (2001), Tropical teleconnection and localresponse to SST anomalies during the 1997–1998 El Nino, J. Geophys.Res., 106, 20,025–20,043.
Su, H., J. D. Neelin, and J. E. Meyerson (2003), Sensitivity of tropicaltropospheric temperature to sea surface temperature forcing, J. Clim.,16, 1283–1301.
TEMPO (1996), Potential role of vegetation feedback in the climate sensi-tivity of high-latitude regions: A case study at 6000 years BP, GlobalBiogeochem. Cycles, 10, 727–736.
Texier, D., et al. (1997), Quantifying the role of biosphere-atmospherefeedbacks in climate change: Coupled model simulations for 6000 yearsBP and comparison with palaeodata for northern Eurasia and northernAfrica, Clim. Dyn., 13, 865–881.
Webster, P. J., T. N. Palmer, M. Yanai, J. Shukla, V. Magana, T. Yasunari,and R. Tomas (1998), The monsoon: Processes, predictability and pre-diction, J. Geophys. Res., 103, 14,451–14,510.
Xie, P., and P. A. Arkin (1997), Global precipitation: A 17-year monthlyanalysis based on gauge observations, satellite estimates and numericalmodel outputs, Bull. Am. Meteorol. Soc., 78, 2539–2558.
Zeng, N., and J. D. Neelin (2000), The role of vegetation-climate interac-tion and interannual variability in shaping the African Savanna, J. Clim.,13, 2665–2670.
Zeng, N., J. D. Neelin, W. K.-M. Lau, and C. J. Tucker (1999), Enhance-ment of interdecadal climate variability in the Sahel by vegetation inter-action, Science, 286, 1537–1540.
Zeng, N., J. D. Neelin, and C. Chou (2000), The first quasi-equilibriumtropical circulation model—Implementation and simulation, J. Atmos.Sci., 57, 1767–1796.
J. D. Neelin, Department of Atmospheric and Oceanic Sciences,
University of California, Los Angeles, 405 Hilgard Avenue, Los Angeles,CA 90095, USA. ([email protected])H. Su, Jet Propulsion Laboratory, California Institute of Technology, M/S
183-701, 4800 Oak Grove Drive, Pasadena, CA 91109, USA.
D19105 SU AND NEELIN: MECHANISMS FOR MID-HOLOCENE MONSOON
13 of 13
D19105