Embed Size (px)
Citation preview

1
Power Electronics/FACTS Installations to Improve Power System Dynamic PerformancePanel Session Presentation on
Dynamic Voltage Support with the Rector SVC in California’s San Joaquin Valley
Presented by
Anthony Johnson, SCEDan Sullivan, MEPPI
April 23, 2008
2008 IEEE/PES Transmission and Distribution Conference & ExpositionChicago, Illinois
MITSUBISHI ELECTRICPOWER PRODUCTS, INC.MITSUBISHI ELECTRICPOWER PRODUCTS, INC.
Presented by: Anthony Johnson, SCE
Dan Sullivan, MEPPIFACTS PANEL SESSION, IEEE/PES T&D Conf. & Expo, Chicago, IL - April 23, 2008Dynamic Voltage Support with the Rector SVC in California’s San Joaquin Valley 2
Transmission System in Big Creek Corridor
Rector to Big Creekapprox. 60 -80 miles
Approximately 15-20 miles of new 230 kV line looping in Rector Substation into Springville-Big Creek No. 3, 230 kV line tobe installed in 2009

2
Presented by: Anthony Johnson, SCE
Dan Sullivan, MEPPIFACTS PANEL SESSION, IEEE/PES T&D Conf. & Expo, Chicago, IL - April 23, 2008Dynamic Voltage Support with the Rector SVC in California’s San Joaquin Valley 3
System AssessmentCorridor Limitations
Age related reliability issuesLarge number of splices in transmission conductors are failingAbsence of transmission towers mean imbalanced loading between phasesTransmission losses during peak utilizationBi-directional power flows in system designed for delivery of hydro power to southern area
Transient Voltage Stability Limitations
Outage of either line between Rector and Big Creek causes low transient voltage at Rector under heavy load conditionsLow transient voltage due to a high percentage of induction motor load served by Rector Without mitigation the low-voltage condition may violate WECC transient voltage dip reliability requirements
Solution200 Mvar SVC for dynamic voltage support and coordinated voltage control
Loop the Big Creek-Springville 230 kV line through Rector substation
Presented by: Anthony Johnson, SCE
Dan Sullivan, MEPPIFACTS PANEL SESSION, IEEE/PES T&D Conf. & Expo, Chicago, IL - April 23, 2008Dynamic Voltage Support with the Rector SVC in California’s San Joaquin Valley 4
Requirements for Voltage Control
Limit the transient voltage dips during major system disturbances
Regulate the 230 kV steady-state voltage at Rector while preserving sufficient SVC dynamic range
Control a local 230 kV, 79 Mvar capacitor bank
Coordinate the 230 kV Big Creek Generating Station operating voltage with the SVC’s control

3
Presented by: Anthony Johnson, SCE
Dan Sullivan, MEPPIFACTS PANEL SESSION, IEEE/PES T&D Conf. & Expo, Chicago, IL - April 23, 2008Dynamic Voltage Support with the Rector SVC in California’s San Joaquin Valley 5
Rector SVC Rating and Design
Rating-120/+200 Mvar continuous at 230 kVLoss of one TCR branch does not reduce the SVC inductive Mvar output by more than 50% (i.e. -60 MVAr)Largest TSC branch shall not result in a voltage rise (at Rector 230 kV) greater than 2.0% under minimum fault dutyAvailability: 98.5% forced outage
TCR/TSC/FC Based DesignDirect LTT-based TCR/TSC valves3rd, 5th, 7th harmonic filtersAuto-reconfigurable degraded mode
ApplicationDynamic voltage/var control
Coordinated ControlLocal 79 Mvar, 230 kV shunt capacitor230 kV Big Creek Generating Station operating voltage
Presented by: Anthony Johnson, SCE
Dan Sullivan, MEPPIFACTS PANEL SESSION, IEEE/PES T&D Conf. & Expo, Chicago, IL - April 23, 2008Dynamic Voltage Support with the Rector SVC in California’s San Joaquin Valley 6
Rector SVC DesignRector 230 kV Bus
200 MVA Total3 x 1-phase
+ Spare230 kV to 9.5 kV
M
9.5 kV kV Bus
M
TSC# 2
+ 40 MVAr
M
TSC# 3
+ 40 MVAr
M
TSC# 3
+ 40 MVAr
TCR# 1- 70
MVAr
M M M
TCR# 2- 70
MVAr
TCR# 3- 70
MVAr
3rd 5th 7th
Harmonic Filters
# 1+ 40
MVAr
M
3rd 5th 7th
Harmonic Filters
# 2+ 40
MVAr
M

4
Presented by: Anthony Johnson, SCE
Dan Sullivan, MEPPIFACTS PANEL SESSION, IEEE/PES T&D Conf. & Expo, Chicago, IL - April 23, 2008Dynamic Voltage Support with the Rector SVC in California’s San Joaquin Valley 7
Rector SVC Site
Main Coupling Transformers (4 x 1-phase)
Thyristor-Controlled Reactors (TCRs)
Harmonic Filter Banks
Thyristor Valves
Cooling
Thyristor-Switched Capacitors (TSCs)
Yard Area - 255 ft x 200 ft(Excluding Building)
Presented by: Anthony Johnson, SCE
Dan Sullivan, MEPPIFACTS PANEL SESSION, IEEE/PES T&D Conf. & Expo, Chicago, IL - April 23, 2008Dynamic Voltage Support with the Rector SVC in California’s San Joaquin Valley 8
Rector SVC Site

5
Presented by: Anthony Johnson, SCE
Dan Sullivan, MEPPIFACTS PANEL SESSION, IEEE/PES T&D Conf. & Expo, Chicago, IL - April 23, 2008Dynamic Voltage Support with the Rector SVC in California’s San Joaquin Valley 9
Rector SVC Site
Presented by: Anthony Johnson, SCE
Dan Sullivan, MEPPIFACTS PANEL SESSION, IEEE/PES T&D Conf. & Expo, Chicago, IL - April 23, 2008Dynamic Voltage Support with the Rector SVC in California’s San Joaquin Valley 10
Coordinated Voltage/Var Control Scheme
The SVC’s primary function is to control the dynamic voltage change at the Rector 230 kV bus (REC-AVR). The SVC steady-state control:
Operates the steady-state reactive power output (SVC-AQR), Provides supplementary regulation of the 230 kV Big Creek #3 bus voltage via phasor measurement unit (PMU) (BC-AVR), and Controls a 79 MVAR, 230 kV shunt capacitor in the Rector substation (SC-Control).

6
Presented by: Anthony Johnson, SCE
Dan Sullivan, MEPPIFACTS PANEL SESSION, IEEE/PES T&D Conf. & Expo, Chicago, IL - April 23, 2008Dynamic Voltage Support with the Rector SVC in California’s San Joaquin Valley 11
V-Q Characteristics of the Rector SVC Coordinated Control
Since three different control loops (REC-AVR, SVC-AQR, and BC-AVR) functiontogether in the steady-state coordinated control, the steady-state SVC output shouldbe controlled based on the V-Q characteristics, in the following order of priority:
1) Maintain Big Creek #3’s 230 kV bus voltage within its upper (VH2) and lower (VL2) limits (BC-AVR) and SVC steady-state output within QCmax and QLmax(SVC-AQR)
2) Maintain Rector 230 kV bus voltage within its upper (VH1) and lower (VL1) limits with Priority #1 maintained (REC-AVR)
3) If Big Creek #3 230 kV bus voltage goes lower than VL2, the SVC should control it within VL2 while maintaining the first two priorities
Presented by: Anthony Johnson, SCE
Dan Sullivan, MEPPIFACTS PANEL SESSION, IEEE/PES T&D Conf. & Expo, Chicago, IL - April 23, 2008Dynamic Voltage Support with the Rector SVC in California’s San Joaquin Valley 12
Conclusion
The Rector SVC was successfully designed, installed, tested, and commissioned in approximately 14 months with an in-service date of June 2007.The application of the Rector SVC and steady-state coordinated controls provide improved short-term voltage stability and dynamic voltage support in the Big Creek Corridor.

7
Presented by: Anthony Johnson, SCE
Dan Sullivan, MEPPIFACTS PANEL SESSION, IEEE/PES T&D Conf. & Expo, Chicago, IL - April 23, 2008Dynamic Voltage Support with the Rector SVC in California’s San Joaquin Valley 13
Rector and Big Creek Voltage Profile with the SVC Out-of-Service
Reactive
Power (M
var)
Vol
tage
(kV
)
Time
SVC Output
Big Creek Voltage
VmaxVavgVmin
Rector Voltage
VmaxVavgVmin
October 21, 2007
Presented by: Anthony Johnson, SCE
Dan Sullivan, MEPPIFACTS PANEL SESSION, IEEE/PES T&D Conf. & Expo, Chicago, IL - April 23, 2008Dynamic Voltage Support with the Rector SVC in California’s San Joaquin Valley 14
Rector and Big Creek Voltage Profile with the SVC In-Service
Reactive
Power (M
var)
Vol
tage
(kV
)
October 28, 2007Time
SVC Output
Big Creek Voltage
VmaxVavgVmin
Rector Voltage
VmaxVavgVmin
8
Presented by: Anthony Johnson, SCE
Dan Sullivan, MEPPIFACTS PANEL SESSION, IEEE/PES T&D Conf. & Expo, Chicago, IL - April 23, 2008Dynamic Voltage Support with the Rector SVC in California’s San Joaquin Valley 15
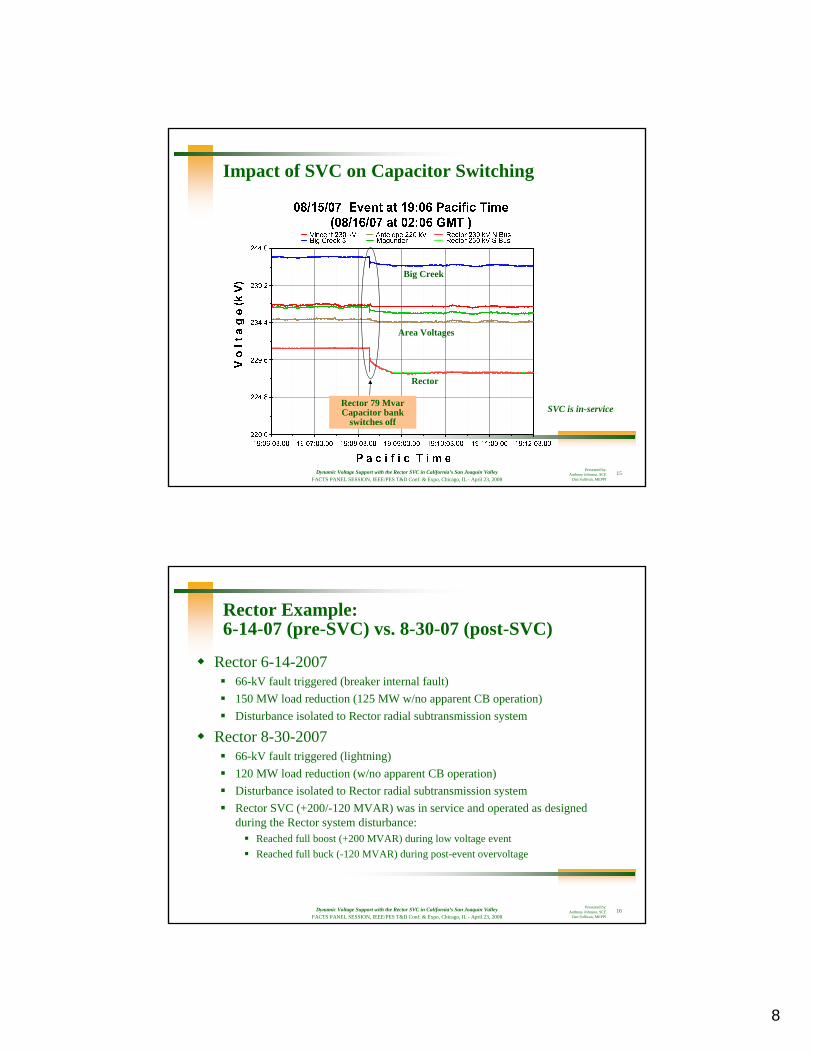
Impact of SVC on Capacitor Switching
Big Creek
Rector
Area Voltages
Rector 79 MvarCapacitor bank
switches offSVC is in-service
Presented by: Anthony Johnson, SCE
Dan Sullivan, MEPPIFACTS PANEL SESSION, IEEE/PES T&D Conf. & Expo, Chicago, IL - April 23, 2008Dynamic Voltage Support with the Rector SVC in California’s San Joaquin Valley 16
Rector Example: 6-14-07 (pre-SVC) vs. 8-30-07 (post-SVC)
Rector 6-14-200766-kV fault triggered (breaker internal fault)150 MW load reduction (125 MW w/no apparent CB operation)Disturbance isolated to Rector radial subtransmission system
Rector 8-30-200766-kV fault triggered (lightning)120 MW load reduction (w/no apparent CB operation)Disturbance isolated to Rector radial subtransmission systemRector SVC (+200/-120 MVAR) was in service and operated as designed during the Rector system disturbance:
Reached full boost (+200 MVAR) during low voltage eventReached full buck (-120 MVAR) during post-event overvoltage

9
Presented by: Anthony Johnson, SCE
Dan Sullivan, MEPPIFACTS PANEL SESSION, IEEE/PES T&D Conf. & Expo, Chicago, IL - April 23, 2008Dynamic Voltage Support with the Rector SVC in California’s San Joaquin Valley 17
Impact of the Rector SVC:6-14-07 (pre-SVC) vs. 8-30-07 (post-SVC)
Magunden Substation Voltage Comparison(Rector Substation Events 6-14-07 and 8-30-07)
220
222
224
226
228
230
232
234
236
238
240
-5.00 0.00 5.00 10.00 15.00 20.00 25.00
Time (seconds)
Mag
unde
n Vo
ltage
(kV)
Rector 8-30-2007 event (POST-SVC) Rector 6-14-2007 event (PRE-SVC)
The Rector SVC had the apparent effect of reducing the magnitude & duration of the fault-induced slow voltage recovery
6-14-2007 (pre-SVC)
8-30-2007 (post-SVC)
NOTE: Voltages shown were measured ~70 miles south of Rector Substation (actual low voltage event was of greater magnitude at Rector substation itself)
Magunden bus voltage
Presented by: Anthony Johnson, SCE
Dan Sullivan, MEPPIFACTS PANEL SESSION, IEEE/PES T&D Conf. & Expo, Chicago, IL - April 23, 2008Dynamic Voltage Support with the Rector SVC in California’s San Joaquin Valley 18
August 30, 2007 AC Stall Event: Rector Voltage
The PMU at Rector was installed as part of the SVC installation. Therefore, events prior to the installation do not have the Rector voltage available.
214.2
218.6
223.0
227.3
231.7
236.1
10:20:35.00 10:20:45.80 10:20:56.60 10:21:07.40 10:21:18.20 10:21:29.00 10:21:39.80P a c i f i c T i m e
V o
l t a
g e
(k V
)
Rector bus voltage

10
Presented by: Anthony Johnson, SCE
Dan Sullivan, MEPPIFACTS PANEL SESSION, IEEE/PES T&D Conf. & Expo, Chicago, IL - April 23, 2008Dynamic Voltage Support with the Rector SVC in California’s San Joaquin Valley 19
Voltage Calibration Need
220
225
230
235
240
245
250
236.
28
4/2/
2007
4/4/
2007
4/6/
2007
4/8/
2007
4/9/
2007
4/11
/200
7
4/13
/200
7
4/15
/200
74/
16/2
007
4/18
/200
74/
20/2
007
4/22
/200
74/
24/2
007
4/25
/200
74/
27/2
007
4/29
/200
75/
1/20
07
5/3/
2007
5/4/
2007
5/6/
2007
5/8/
2007
5/10
/200
7
5/12
/200
75/
13/2
007
5/15
/200
75/
17/2
007
Big Creek Average VoltageRector Average Voltage
Vol
tage
(kV
)
Date and Time
Big Creek bus voltage
Rector bus voltage
Calibration adjustment
Presented by: Anthony Johnson, SCE
Dan Sullivan, MEPPIFACTS PANEL SESSION, IEEE/PES T&D Conf. & Expo, Chicago, IL - April 23, 2008Dynamic Voltage Support with the Rector SVC in California’s San Joaquin Valley 20
Questions?

11
Presented by: Anthony Johnson, SCE
Dan Sullivan, MEPPIFACTS PANEL SESSION, IEEE/PES T&D Conf. & Expo, Chicago, IL - April 23, 2008Dynamic Voltage Support with the Rector SVC in California’s San Joaquin Valley 21
Reference Slides
Presented by: Anthony Johnson, SCE
Dan Sullivan, MEPPIFACTS PANEL SESSION, IEEE/PES T&D Conf. & Expo, Chicago, IL - April 23, 2008Dynamic Voltage Support with the Rector SVC in California’s San Joaquin Valley 22
Transmission System Conditions
Transmission Line Voltage: 230 kV, (0.96 PU to 1.04 PU)
Short Circuit MVA:Maximum = 3,625Minimum = 2,151
Allowed Max. Switching Step 2% (0.02 x 2,151 = 43 Mvar max.)
Ambient Conditions:Elevation 350 FeetMaximum Temperature 50 Degrees C (45 Deg. 24 hr. Avg.)Minimum Temperature - 20 Degrees C

12
Presented by: Anthony Johnson, SCE
Dan Sullivan, MEPPIFACTS PANEL SESSION, IEEE/PES T&D Conf. & Expo, Chicago, IL - April 23, 2008Dynamic Voltage Support with the Rector SVC in California’s San Joaquin Valley 23
Rector SVC Site
Yard Area255 ft x 200 ft
(Excluding Building)