Embed Size (px)
Citation preview
13
Gutiérrez, A. y Ledezma, C. (2017). Dynamic modeling of Mataquito Bridge affected by liquefaction - induced lateral spreading. Obras y Proyectos 21, 13-18
Dynamic modeling of Mataquito Bridge affected by liquefaction - induced lateral spreading
Álvaro Gutiérrez y Christian Ledezma Departamento de Ingeniería Estructural y Geotécnica, Pontificia Universidad Católica de Chile, Vicuña Mackenna 4860, Macul,Santiago, Chile, [email protected], [email protected]
Modelamiento dinámico del Puente Mataquito afectado por licuefacción y corrimiento lateral
Fecha de entrega: 15 de diciembre 2016 Fecha de aceptación: 21 de abril 2017
El puente Mataquito se sitúa al norte del epicentro del terremoto del Maule Mw 8.8 y fue seleccionado para este estudio por la clara evidencia de licuefacción detectada en terreno, y la suficiente información geotécnica disponible para generar el modelo numérico. El modelo numérico fue desarrollado en el software FLAC e incluye modelos constitutivos avanzados como PM4SAND y UBCHYST, los cuales han sido validados para la condición dinámica. Además, la interacción suelo-estructura es considerada mediante los elementos pile disponibles en FLAC, mediante resortes normales y de corte. Para la condición dinámica se aplicó una historia de aceleración registrada en la estación Rapel. El proceso de calibración considerado en esta investigación fue desarrollado a partir de resultados de ensayos SPT y correlaciones geotécnicas. Diversos modelos numéricos fueron analizados para obtener los parámetros de los modelos constitutivos avanzados y de los resortes para los pilotes. Los resultados incluyen desplazamientos laterales y momentos flectores debido al terremoto. Los desplazamientos residuales son alrededor de 10 cm y se concentran en la cabeza de los pilotes. Además, se incluye el aumento de la presión de poros debido al movimiento sísmico, donde la licuefacción se alcanza previa al peak de la aceleración.
Palabras clave: licuefacción, pilotes, puentes, PM4SAND
The Mataquito Bridge is located at the north of the Mw 8.8 Maule earthquake epicenter and it was selected for this study because clear evidence of liquefaction induced lateral spreading was detected at the site and the data available was enough to generate a numerical model. The numerical model was developed in the geotechnical software FLAC and includes advanced soil constitutive models, such as PM4SAND and UBCHYST, which are validated in dynamic condition. Furthermore, the soil-structure interaction is considered with the pile elements available in FLAC, via shear and normal springs. The acceleration history applied in the dynamic condition was registered in Rapel station. The calibration process considered in this research was conducted with SPT results and geotechnical correlations. Several numerical models were solved to obtain the parameters included in the soil constitutive models and in the pile coupling springs. The results include pile lateral displacement and the bending moments due to the earthquake. The residual lateral displacements are about 10 cm and concentrated at the top of the pile. Besides, the pore water pressure increased during the seismic motion and the liquefaction was reached before the peak acceleration.
Keywords: liquefaction, piles, bridges, PM4SAND
IntroductionThe 2010 M
w 8.8 Maule earthquake affected Chilean
lifelines, such as bridges, roads and ports. The liquefaction triggered during this event resulted in significant damage to several structures. One of the most common observations was the impact of liquefied foundation soils on the deformation of approach fills and lateral spreading
(Ledezma et al., 2012). In this paper we study the seismic behavior of the Mataquito Bridge located close to the Pacific Ocean, in the Maule region. The bridge is a reinforced concrete structure 320 m long, supported on piles groups. The north abutment was founded on loose sediments that liquefied and spread towards the river, causing moderate to significant longitudinal deformations. The south abutment

14
Gutiérrez, A. y Ledezma, C. (2017). Obras y Proyectos 21, 13-18
was founded on sands over possibly shallow bedrock and the structural damage and deformations observed were considered negligible (Ledezma et al., 2012). Figure 1a shows the observed fill settlement at the north abutment, Figure 1b presents the liquefaction-induced lateral spreading effects in the surrounding area, Figure 1c shows soil vertical settlement at the interior piers and Figure 1d presents the failure of the handrails.
The bridge’s seismic behavior during the Maule earthquake was studied in a numerical model developed using the commercial FLAC 7.0 software, considering advanced constitutive model such as PM4SAND for the liquefiable layers.
Geotechnical model developmentFigure 2 shows the main soil layers along with the piles’
Figure 1: a) North abutment, b) lateral displacement towards the river, c) soil settlement at interior pier at northeast abutment (FHWA, 2011), and (d) handrail failures at the bridge deck
distribution, the location of the boreholes, and that of the groundwater table. The soil layers and properties were determined from the SPT profiles shown in Figure 3 along with historical field data, hydraulic reports and boring logs. Three main layers of natural soil were identified. The fill soil layer was added and characterized from the bridge drawings. The shallow sand layer is characterized by low SPT blow counts with an average of (N
1)
60 = 10 blows/ft.
This layer is underlain by a medium sand with an average (N
1)
60 = 25 blows/ft. At a depth of about 10 m from the
natural ground surface, a gravel layer is detected. This information was used to define a longitudinal geotechnical profile of the Mataquito Bridge (Figure 2). The plastic and elastic soil properties were estimated from SPT correlations.
Figure 2: Lateral view of Mataquito Bridge, indicating the soil layers, distribution of piles, the location of borings and water table
15
Gutiérrez, A. y Ledezma, C. (2017). Dynamic modeling of Mataquito Bridge affected by liquefaction - induced lateral spreading. Obras y Proyectos 21, 13-18
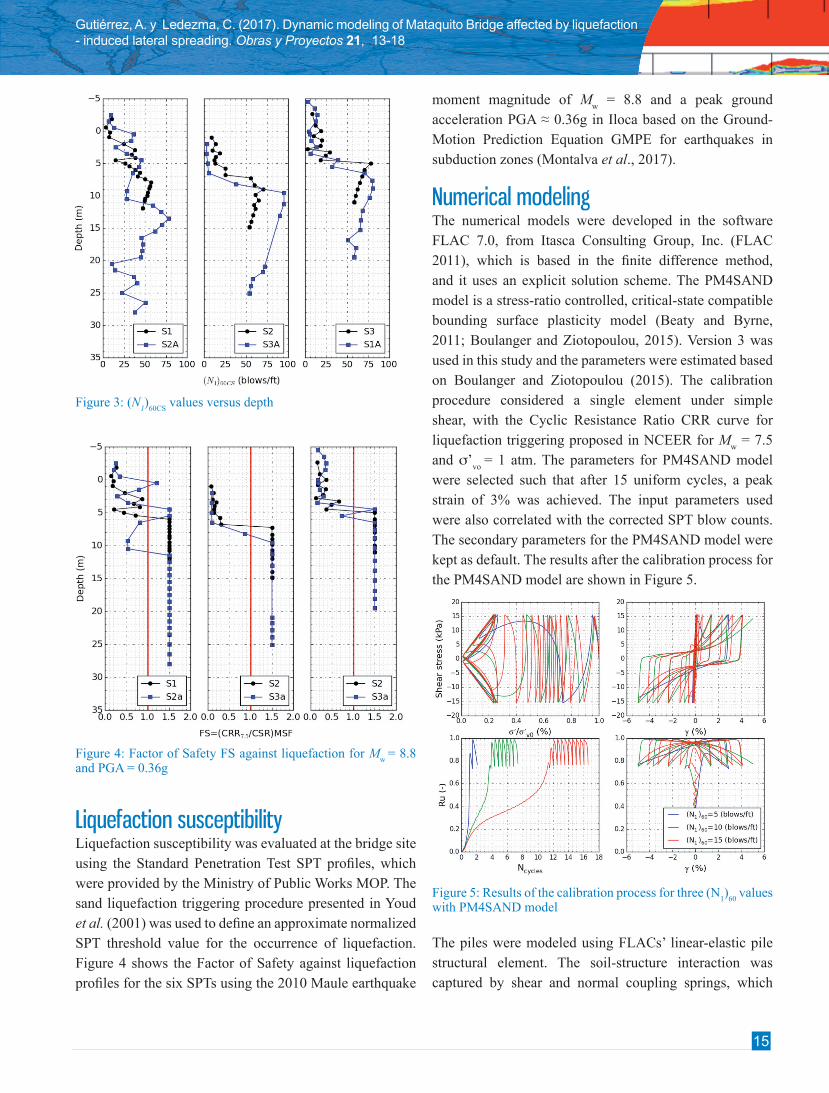
Figure 3: (N1)
60CS values versus depth
Figure 4: Factor of Safety FS against liquefaction for Mw
= 8.8 and PGA = 0.36g
Liquefaction susceptibility Liquefaction susceptibility was evaluated at the bridge site using the Standard Penetration Test SPT profiles, which were provided by the Ministry of Public Works MOP. The sand liquefaction triggering procedure presented in Youd et al. (2001) was used to define an approximate normalized SPT threshold value for the occurrence of liquefaction. Figure 4 shows the Factor of Safety against liquefaction profiles for the six SPTs using the 2010 Maule earthquake
moment magnitude of Mw = 8.8 and a peak ground
acceleration PGA ≈ 0.36g in Iloca based on the Ground-Motion Prediction Equation GMPE for earthquakes in subduction zones (Montalva et al., 2017).
Numerical modelingThe numerical models were developed in the software FLAC 7.0, from Itasca Consulting Group, Inc. (FLAC 2011), which is based in the finite difference method, and it uses an explicit solution scheme. The PM4SAND model is a stress-ratio controlled, critical-state compatible bounding surface plasticity model (Beaty and Byrne, 2011; Boulanger and Ziotopoulou, 2015). Version 3 was used in this study and the parameters were estimated based on Boulanger and Ziotopoulou (2015). The calibration procedure considered a single element under simple shear, with the Cyclic Resistance Ratio CRR curve for liquefaction triggering proposed in NCEER for Mw
= 7.5 and s’
vo = 1 atm. The parameters for PM4SAND model
were selected such that after 15 uniform cycles, a peak strain of 3% was achieved. The input parameters used were also correlated with the corrected SPT blow counts. The secondary parameters for the PM4SAND model were kept as default. The results after the calibration process for the PM4SAND model are shown in Figure 5.
Figure 5: Results of the calibration process for three (N1)
60 values
with PM4SAND model
The piles were modeled using FLACs’ linear-elastic pile structural element. The soil-structure interaction was captured by shear and normal coupling springs, which
16
Gutiérrez, A. y Ledezma, C. (2017). Obras y Proyectos 21, 13-18
connect each node from the pile to the adjacent soil element, and that were characterized by stiffness and friction parameters.
The bridge deck and interior piers were modeled with linear-elastic beam elements. Due to the spacing and non-uniform geometry of the piles and deck, it was necessary to develop equivalent 2D flexural and axial stiffness parameters. Table 1 shows the piles and beams structural properties. The wall abutment was modeled with “soil” elements with concrete properties.
Table 1: Equivalent 2D structural properties
Parameter Piles Deck Interior pier
Elastic modulus, GPa 31.5 4.7 31.5
Moment of inertia, m4 0.042 1.84 0.042
Cross section, m2 0.795 2.8 0.795
Perimeter, m 1.18 - -
Density, kg/m3 600 400 600
Numerical modelsTwo models were used to evaluate the dynamic response of the bridge due to the Maule earthquake. In Model 1 the liquefiable layers were modeled using PM4SAND, and the non-liquefiable layers were modeled using UBCHYST. In Model 2 all the soil layers were modeled using UBCHYST (a constitutive model based on the Mohr-Coulomb’s failure criterion including hysteretic damping) under undrained condition. However, a user-defined function was used to check if during the seismic motion a soil element liquefies, based on the simplified procedure by Youd et al. (2001). If the soil element liquefies, the post-earthquake residual strengths are assigned as an equivalent cohesion with dependence on the effective vertical stress. The post-earthquake residual undrained shear strength was estimated using the recommendations by Ledezma and Bray (2010).
The numerical model was built in stages, trying to capture more realistically the strain–stress condition at the site. During the static stages, boundary conditions consisted on restrained lateral displacements at the sides, and in both directions at the base. During the dynamic stage, the free-field conditions are applied at the vertical sides of the model, and a compliant base was applied at the bottom. The free-field condition is applied to model the propagation
of waves into the far-field, through normal and tangential dashpots. The properties of these boundaries are related to the neighboring properties of the soil before the dynamic stage. The seismic input motion was applied as a time-stress history at the base of the model, where a stiff gravel layer is located. The selected ground motion was recorded in Rapel station.
The mesh size was determined based on the recommendation proposed by FLAC (2011). The equation states that the mesh size cannot be greater than one-tenth of the wavelength associated to the maximum frequency with significant energy content of the ground motion. The largest significant frequency of the input signal was 10 Hz, and the smallest shear wave velocity in the liquefiable layers was 160 m/s, so the maximum element size was 1.6 m. The total width and height of the model were, respectively, 620 m and 90 m, which were determined by an iteration process to ensure that the displacements and stresses at the abutments were not affected by the vertical boundaries, and to reach a bottom layer with a rock-like stiffness.
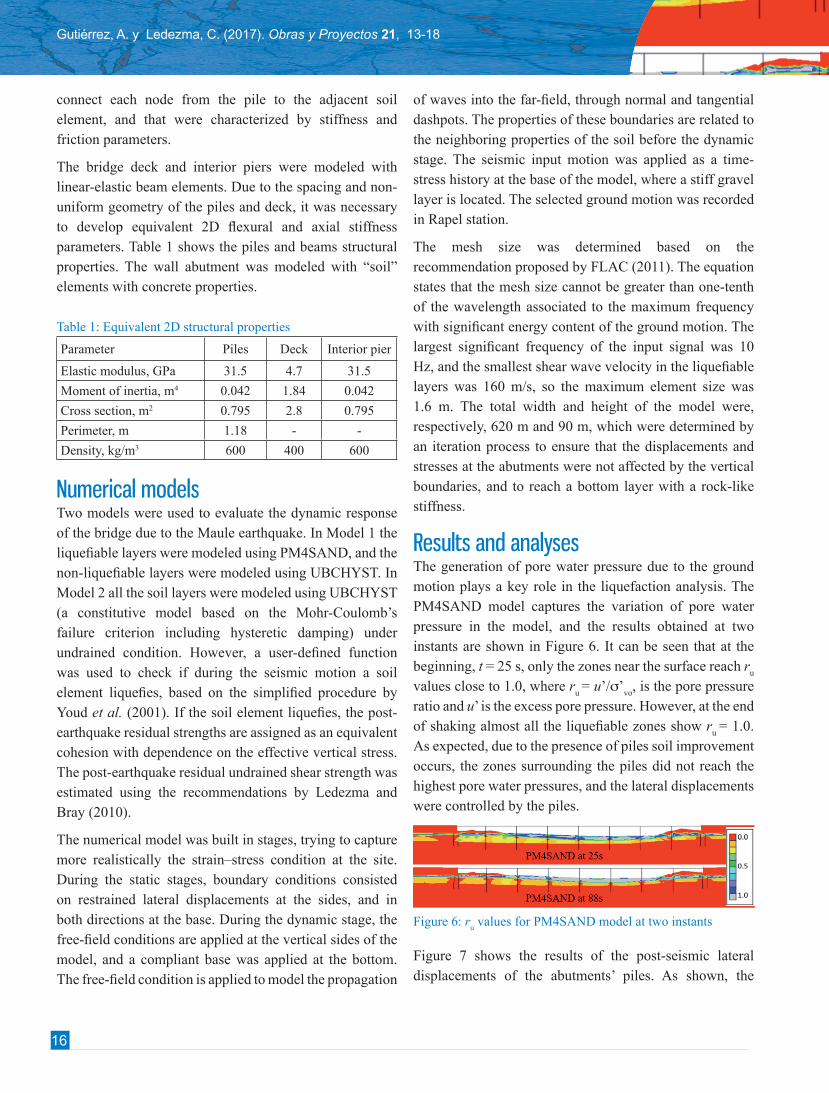
Results and analysesThe generation of pore water pressure due to the ground motion plays a key role in the liquefaction analysis. The PM4SAND model captures the variation of pore water pressure in the model, and the results obtained at two instants are shown in Figure 6. It can be seen that at the beginning, t = 25 s, only the zones near the surface reach r
u
values close to 1.0, where ru = u’/s’
vo, is the pore pressure
ratio and u’ is the excess pore pressure. However, at the end of shaking almost all the liquefiable zones show r
u = 1.0.
As expected, due to the presence of piles soil improvement occurs, the zones surrounding the piles did not reach the highest pore water pressures, and the lateral displacements were controlled by the piles.
Figure 6: ru values for PM4SAND model at two instants
Figure 7 shows the results of the post-seismic lateral displacements of the abutments’ piles. As shown, the

17
Gutiérrez, A. y Ledezma, C. (2017). Dynamic modeling of Mataquito Bridge affected by liquefaction - induced lateral spreading. Obras y Proyectos 21, 13-18
piles tend to move towards the riverbed and the maximum displacements are concentrated at the top. The maximum lateral displacement predicted by the models is about 12 cm at the north abutment and about 7 cm at the south abutment. The models predict similar lateral displacements at the south abutment, despite the simplicity of Model 2. However, at the north abutment, since the thick medium sand layer was not expected to liquefy below 10 m, this approximate model tends to overestimate the lateral support of the piles.
Figure 7: Post-seismic lateral displacements at the abutments’ piles calculated using the two models
The current results compare well with the results presented in Gonzalez and Ledezma (2017), i.e. post-seismic lateral displacement between 4 to 18 cm at the top of the south abutment piles. In Ledezma et al. (2012), it was registered a lateral spreading from the edge of the south abutment wall to the first row of piers of about 54 cm, and the total lateral spreading from the edge of the abutment wall to the river’s edge of about 180 cm. The results predict displacements about 70 cm from the wall to the first row of piles, and about 200 cm from the wall to the river shore.
Figure 8 shows the post-seismic bending moment of the abutment piles. The yielding bending moment of the piles and piers is about 10 MNm, calculated with compressive strength f’c
of 25 MPa for the concrete, and yield fy and
ultimate fu stresses for the steel of 420 MPa and 630 MPa,
respectively. These nominal properties were modified by factors R
c = 1.3, R
y = 1.2 and R
u = 1.2, respectively, to
represent the actual in-situ strength of the piles and piers. These factors are based on the ACI (2008) and AISC (2010). The results show that the ultimate bending moment capacity is higher than the maximum post-seismic moment calculated for the piles. Regarding the post-seismic
and maximum bending moments, there are two critical sections: the pile-abutment connection, and the interface between the liquefiable material (medium sand) and the gravel, which are consistent with previous results.
Figure 8: Post-seismic bending moment for the two models at abutments’ piles
ConclusionsDue to the three dimensional nature of the problem, the results obtained from a 2D plain strain model tend to overestimate the loading and the displacements induced by liquefaction-lateral spreading, because it does not capture out-of-plane displacement nor pile-group effects. Nevertheless, the post-seismic lateral displacements calculated using the models considered in this work are similar to the measured values in the post-earthquake reconnaissance.
Inertial effects should be considered in the design and analysis of these structures. Our results show that during the seismic motion the peak bending moments are about 2 times the post-seismic bending moments, being the most critical zone the deck-pile connection.
FLAC 2D is able to properly model and capture the seismic behavior of sand materials with liquefaction potential. Model 1 could capture the soil behavior during cyclic loading, such as shear stress versus strain behavior, or the variation of pore water pressures.
The advantage of using advanced models is the comprehension and prediction of soil behavior during cyclic loading, but with the disadvantage that the calibration process can be complex and the computational time increases. Model 2 predicts similar displacements and bending moments as the other model in the south abutment, so the use of a basic soil model for a case like that does not

18
Gutiérrez, A. y Ledezma, C. (2017). Obras y Proyectos 21, 13-18
substantially affect the results while providing a reasonably good first-order estimate.
ReferencesACI (2008). Building code requirements for structural concrete
(ACI 318-08) and Commentary. American Concrete Institute,
Farmington Hills, Michigan
AISC (2010). Seismic provisions for structural steel buildings
(ANSI/AISC 341-10). American Institute of Steel Construction,
Chicago, Illinois.
Beaty, M. and Byrne, P.M. (2011). UBCSAND constitutive
model version 904aR. Document report in: http://www. itasca-
udm. com/pages/continuum. html
Boulanger, R. and Ziotopoulou, K. (2015). PM4SAND
(Version3): A sand plasticity model for earthquake engineering
applications. Document Report UCD/CGM-15/01, University of
California, Davis
FHWA (2011). Postearthquake reconnaissance report on
transportation infrastructure impact of the February 27, 2010,
Offshore Maule Earthquake in Chile. Federal Highway
Administration FHWA-HRT-11-030, McLean, VA
FLAC (2011). Fast Lagrangian Analysis of Continua. Version
7.0 software. Itasca Consulting Group, Inc. Minneapolis: Itasca
Gonzalez, D. and Ledezma, C. (2017). Simplified probabilistic
evaluation of the seismic performance of three pile-supported
bridges affected by liquefaction during the M8.8 Maule Chile
Earthquake. Earthquake Spectra (under review)
Ledezma, C. and Bray, D. (2010). Probabilistic performance-
based procedure to evaluate pile foundations at sites with
liquefaction-induced lateral displacement. Journal of
Geotechnical and Geoenvironmental Engineering 136(1), 464-
476
Ledezma, C., Hutchinson, T., Ashford, S.A., Moss, R., Arduino,
P., Bray, J.D., Olson, S., Hashash, Y.M.A., Verdugo, R., Frost,
D., Kayen, R. and Rollins, K. (2012). Effects of ground failure
on bridges, roads, and railroads. Earthquake Spectra 28(1), 119-
143
Montalva, G., Bastías, N. and Rodriguez-Marek, A. (2017).
Ground-motion prediction equation for the Chilean Subduction
Zone. Bulletin of the Seismological Society of America 107(2),
901-911
Youd, T.L., Idriss, I.M., Andrus, R.D., Arango, I., Castro, G.,
Christian, J.T., Dobry, R., Liam Finn, W.D., Harder Jr., L.F.,
Hynes, M.E., Ishihara, K., Koester, J.P., Liao, S., Marcuson
III, W.F., Martin, G.R., Mitchell, J.K., Moriwaki, Y., Power,
M.S., Robertson, P.K., Seed, R.B. and Stokoe II, K.H. (2001).
Liquefaction resistance of soils: summary report from the 1996
NCEER and 1998 NCEER/NSF Workshops on Evaluation of
Liquefaction Resistance of Soils. Journal of Geotechnical and
Geoenvironmental Engineering 127(10), 817-833