Embed Size (px)
Citation preview
48th International Conference on Environmental Systems ICES-2018-319 8-12 July 2018, Albuquerque, New Mexico
Dynamic Modeling of Ammonia Removal with Phosphoric-
Acid-Treated Activated Carbon
Stephanie N. Roohi1
HX5 LLC, Houston, Texas, 77058, USA
Oscar Monje2
Ascentech, Kennedy Space Center, Florida 32899, USA
Jay L. Perry3
NASA George C. Marshall Space Flight Center, Huntsville, Alabama 35812, USA
and
Kevin E. Lange4
Jacobs Technology, Houston, Texas, 77058, USA
This paper describes the initial development of a dynamic model of ammonia removal by
chemisorption using Ammonasorb II (Calgon Carbon), a phosphoric-acid-treated activated
carbon. The model is being developed using a commercial adsorption modeling software
product (Aspen Adsorption™). An adsorption isotherm equation was derived based on
aqueous solution chemistry and compared to measured ammonia capacities for Ammonasorb
II under wet conditions. Predicted capacities using the measured phosphoric acid content of
one carbon and parameters derived from solution chemistry show good agreement with
measurements over a range of ammonia concentration. Both solution-phase and solid-phase
equilibrium simulations were performed in support of the isotherm development. Using the
dynamic model, a preliminary overall linear mass transfer coefficient was estimated by fitting
available ammonia breakthrough data. Additional data are needed to more fully describe and
validate the dynamic performance behavior. The model development is directed at sizing
trace contaminant control beds for low volume applications such as spacesuits and suit loops
where dynamic performance is critical.
Nomenclature
A = isotherm constant (1/bar) w = ammonia loading (mol NH3/g carbon)
B = isotherm constant (dimensionless) w* = equilibrium ammonia loading at the gas-
C = isotherm constant (mol H3PO4/g carbon) phase concentration (mol NH3/g carbon)
HNH3 = Henry’s law constant for ammonia (bar) xi = liquid phase mole fraction of
Kj = equilibrium constant of reaction j on a chemical species i (dimensionless)
mole fraction basis (dimensionless) xH3PO4T = total liquid-phase mole fraction of
k = mass transfer coefficient (1/second) phosphate (dimensionless)
mch = mass of charcoal in the bed (kg) xNH4+ = liquid-phase mole fraction of
mtchu = mass of treated charcoal used (kg) ammonium ions (dimensionless)
pNH3 = partial pressure of ammonia (bar) γi = activity coefficient of
1 Modeling and Simulation Chemical Engineer, Engineering Department, Jacobs Technology, 2224 Bay Area Blvd,
Mail Stop JE-5EA, Houston, TX 77058, USA. 2 Research Scientist, Air Revitalization Laboratory, Kennedy Space Center, Fl 32899, USA. 3 Lead Engineer-Systems, ECLS Systems Development Branch, Space Systems Dept., Mail Stop ES62. 4 Engineering Specialist, Engineering Dept., 2224 Bay Area Blvd, Mail Stop JE-5EA.
International Conference on Environmental Systems
2
chemical species i (dimensionless) MTC = mass transfer coefficient
ηr = fractional ammonia removal NH3 = ammonia
efficiency (dimensionless) NH4+ = ammonium ions
ACHBD = Axial Charcoal Bed Efficiency OH- = hydroxyl ions
H3PO4 = phosphoric acid PO43- = phosphate ions
ISS = International Space Station TCC = trace contaminant control
KSC = Kennedy Space Center TCCS-CP = Trace Contaminant Control Simulation
computer program
I. Introduction
HE design of activated-carbon-based trace contaminant control (TCC) systems for spacesuit ventilation loops or
Orion-type suit-loops has generally been driven by ammonia (NH3) removal.1,2 Metabolic sources such as
breathing or sweating contribute to ammonia generation. Offgassing from materials and solid-amine swing beds are
other possible sources.3 The contributions from each source could potentially expose the crewmember to unacceptable
concentration levels.
For example, applications using a solid-amine carbon dioxide removal system may produce higher concentration
pulses of ammonia when the amine beds are switched (either nominally or off-nominally) after long periods of
isolation. The accumulation of ammonia in this scenario results from slow degradation of the amine.4 Compared to
the large volume of cabin applications, concentration pulses of ammonia can persist in the small total atmosphere
volume of spacesuit and suit-loop applications where perfect mixing is unlikely. The TCC must have the capacity to
handle potential fluctuations in contaminant concentrations.
Another scenario includes large pulses of ammonia due to unanticipated cabin fires or ammonia leaks. The
adsorbent-filled cartridges found in first responder respirator masks and the Orion Smoke-Eater would need the
capacity to handle dynamic inlet conditions. The ability to predict dynamic contaminant removal for these applications
is needed to appropriately size removal beds and to develop operational protocols that protect suited crewmembers.
Phosphoric-acid-(H3PO4)-treated activated carbon is used aboard the International Space Station (ISS) for
ammonia control and is baselined for the Orion crew exploration vehicle.5,6 Treated activated carbon has also been
considered for use in advanced spacesuits.1 The current Barneby Sutcliffe (B-S) Type 3032 phosphoric-acid-treated
activated carbon is reported to contain 10% phosphoric acid by weight.7 Although this carbon is no longer
manufactured, a suggested replacement, Ammonasorb II, is available from Calgon Carbon Corp. who acquired
Barnebey Sutcliffe in 2004. While the development of regenerable ammonia removal technologies have created
interest,8-10 the use of phosphoric-acid-treated activated carbon remains a viable and reliable approach that could
provide advantages under dynamic conditions.
The efforts of the model presented in this paper may serve as a template that provides loading predictions for such
applications. The model may extend to other sorbents of interest and provide predictions for different particle sizes.
Further efforts may incorporate isotherms for physically adsorbed contaminants that consider the interaction between
contaminants on the surface of the sorbent. Contaminant concentrations and remaining sorbent active sites adjust the
relative adsorptive capacities of each contaminant. This effort would offer sizing that factors in the actual
multicomponent systems of these applications, such as other combustion byproducts produced in cabin fires and
volatile organic compounds generated within the spacesuit ventilation loop.
A. Phosphoric-Acid-Treated Activated Carbon
The high porosity and surface area of activated carbon promotes physical adsorption, or physisorption, of
contaminants. Physisorption relies on weak van der Waals interactions between the contaminant and the pore surface.
Retention of ammonia molecules on the untreated carbon surface, however, is temporary and unreliable. Ammonia
molecules, averaging 3 Ångströms in size and portraying basic properties, adsorb preferentially onto small pores with
high surface acidity.11 By comparison, activated carbon has a large average pore size of 15 Ångströms with low
surface acidity.11
Impregnating activated carbon with phosphoric acid promotes chemical adsorption, or chemisorption, by
introducing acidic functional groups to the pore surface. Addition of acidic functional groups creates a highly
microporous and chemically reactive environment, resulting in reliable ammonia retention. The presence of a film of
water on microporous surfaces facilitates the formation of ammonium (NH4+) ions, which bind to Brønsted acidic
groups in an acid-base interaction.12
T
International Conference on Environmental Systems
3
Phosphoric acid impregnation of carbonaceous materials can be performed as part of a chemical activation process
prior to carbonization, or can be performed post activation. In the former case, the acid may be washed out after the
activation process, whereas in the latter case free leachable acid remains within the pores. The method chosen
determines the reactivity and morphology of the final carbon product. Factors include the amount of impregnated
phosphoric acid and the activation or calcination temperature. In chemical activation, increasing the concentration of
phosphoric acid results in greater surface area, enhancing immediately the microporosity and progressively the
macroporosity of the carbon surface.13 Bound functional groups on the pore surface can be formed including
carboxylic acid groups, phenolic groups, and phosphorous oxides.14
B-S Type 3032 activated carbon has been shown to contain a high content of leachable phosphoric acid,7 yet
contributions to ammonia adsorption from both free and bound acidic groups of varying strength are possible.
B. Previous Phosphoric-Acid-Treated Modeling Approaches
The Trace Contaminant Control Simulation computer program (TCCS-CP) is an evolved FORTRAN-based
modeling tool with original development by Lockheed and with application heritage in the design of Spacelab and
Space Station Freedom TCC systems.15,16 For ammonia removal by phosphoric-acid-treated carbon, the program uses
a combination of experimental ammonia loading data and an empirical breakthrough correlation. In Version 8.1, the
approach is implemented in subroutine Axial Charcoal Bed Efficiency (ACHBD). 16 The subroutine assumes a single-
pass removal efficiency of 100% up to a bed utilization of 80%. The fractional removal efficiency (ηr) for the
remaining 20% depends on the total mass of carbon (mch) and the mass of carbon utilized (mtchu) as shown in Eq. 1.
An equilibrium loading of 6.25 mg ammonia/g carbon is assumed for B-S Type 3032 carbon challenged at 25 ppm
ammonia.
𝜂𝑟 = sin [1.57(𝑚𝑐ℎ−𝑚𝑡𝑐ℎ𝑢)
0.2𝑚𝑐ℎ] (1)
This approach implies that the mass transfer zone is a fixed percentage of the bed length.
Another approach previously employed is to assume a fixed residence time to calculate the length of the mass
transfer zone.1,2 Values from 0.25 to 1 second have been assumed.
Both of the above empirical approaches may have applicability over a limited range of design parameters. In
general, however, the length of the mass transfer zone can be expected to depend on fluid velocity, ammonia
concentration, and carbon particle size. A more fundamental approach is needed to account for these dependencies.
II. Approach
A. Modeling
Both solid-phase and aqueous-phase ammonia-phosphoric acid-water systems were initially investigated in the
literature and were modeled as potential analogs of ammonia adsorption by phosphoric-acid-treated activated carbon.
This investigation was performed to help discern the adsorption mechanism with the goal of developing a
theoretically-based adsorption isotherm equation. Solid-phase and aqueous-phase modeling were performed using
the commercial chemical process simulator Aspen Plus®.
1. Solid-Phase Modeling
Solid-phase predictions at 25°C and 1.01325 bar were made using an Aspen Plus® reactor model (RGIBBS) that
minimizes the overall system Gibbs free energy given specified reactants and products. Based on the literature,17,18
the following solid products were included in the simulation: H3PO4(s), H3PO4·0.5H2O(s), NH4H2PO4(s),
(NH4)2HPO4(s) and (NH4)3PO4·3H2O(s). The di-salt NH4H2PO4·H3PO4(s) reported in Ref. 17 was not included. The
required Gibbs free energy of formation was available for each salt except (NH4)2HPO4(s) and (NH4)3PO4·3H2O(s).
For these two salts, reported dissociation pressures19-22 were used in conjunction with the dissociation equilibrium
expression to estimate the Gibbs free energy of formation.
2. Aqueous-Phase Modeling
A model of an ammonia and aqueous phosphoric acid system was developed in Aspen Plus®. Property data
packages (inserts) are offered in Aspen Plus® that have been optimized for specific chemical systems. The selected
data package (enh3po.bkp) uses the ELECNRTL property method and models an electrolyte system of water,
ammonia, and phosphoric acid. A component list generated the dissolved electrolyte form for each species.
International Conference on Environmental Systems
4
The simulation included a flash block with three feeds: pure ammonia, moist air, and aqueous phosphoric acid.
The outlet streams were the gas and liquid products. All simulations were run at 25°C and 1.01325 bar. A sensitivity
analysis, a model analysis tool within Aspen Plus®, was used to assess a variable’s degree of impact in the model. A
design specification, a flowsheeting option within Aspen Plus®, was used to manipulate a variable to meet a preset
condition.
3. Dynamic Adsorption Modeling
Adsorption modeling was implemented in Aspen Adsorption™, a flowsheet simulator that models gas and liquid
adsorption processes. The gas dynamic model provided in the model library was used to construct the process
flowsheet. The flowsheet included a gas bed block, an inlet air/nitrogen stream with ammonia, and the product stream.
The inlet stream temperature and pressure were set at 25°C and 1.01325 bar. The isotherm equation derived based on
aqueous chemistry was placed in the flowsheet constraint section as a user submodel. Oxygen and nitrogen loadings
were set to zero to indicate insignificant adsorption of these components. Experimental test data were fed into the
estimation tool in Aspen Adsorption™ to estimate a constant overall mass transfer coefficient for ammonia and to
generate a predicted loading curve.
B. Experimental
Isotherm characteristics were derived from ammonia capacity data collected by Monje at the Kennedy Space
Center (KSC).23 This study compared the loading of several commercial carbons, including Ammonasorb II.
Ammonasorb II is a coconut shell based carbon treated with phosphoric acid. Adsorptive capacities were determined
from breakthrough experiments performed by flowing a constant stream of nitrogen containing 2-50 ppm ammonia
and 30-40% inlet relative humidity through packed desorption tubes.
The carbon used in Monje’s dynamic experiments was obtained and tested for its leachable phosphoric acid content
by ion chromatography based on the approach used to analyze B-S Type 3032 carbon returned from ISS.7 Each
sample was prepared by first crushing the carbon to a powdered form with a mortar and pestle. The powdered carbon
was vacuum dried at 45°C for 2 hours. A 4-gram sample was dispersed in 50 milliliters of deionized water that had
been purified using a Super Q Plus water purification system. The sample container was initially shaken vigorously
and allowed to stand for 24 hours while being shaken periodically. The carbon was separated from the leachable
phosphoric acid by filtration using Fisherbrand Qualitative P4 Grade plain filter paper. The amount of phosphate
anions in the leachate was determined by ion chromatography using a MetrohmUSA 850 Professional ion
chromatograph equipped with a conductivity detector. A Metrosep A Supp 7-250 4-mm ID column with an eluent
consisting of 3.6 mM sodium bicarbonate was used for the analysis.
Based on triplicate determinations, the leachable phosphoric acid content of the Ammonasorb II averaged 9.75
wt% with a spread from 9.53 wt% to 10.11 wt%. These values are very similar to those measured for B-S Type 3032
activated carbon.
III. Results
A. Solid-Phase Modeling
Measurements of the dissociation pressure of (NH4)2HPO4(s) were found over the temperature range from 80-
130°C and had to be extrapolated to 25°C. Extrapolating the data of Warren20 using the Clausius-Clapeyron equation
yields a value of 0.008 mm Hg, while extrapolating the data of de Passillé21 using the provided Nernst equation yields
a value of 0.021 mm Hg, for an average of 0.015 mm Hg. This value agrees with a measured ammonia partial pressure
of 0.016 mm Hg for an apparent aqueous-NH4H2PO4(s)-(NH4)2HPO4(s) triple point at 25 °C reported by Lenfesty and
Brosheer.22 Taking 0.016 mm Hg as the dissociation pressure, the estimated Gibbs free energy of formation is
−1.253109 J/kmol. Dissociation pressures for (NH4)3PO4·3H2O(s) at 25°C were measured by Huey and Tartar19 and
found to be 4.0 mm Hg for NH3 and 21.2 mm Hg for H2O. The resulting estimated Gibbs free energy of formation is
−1.995109 J/kmol.
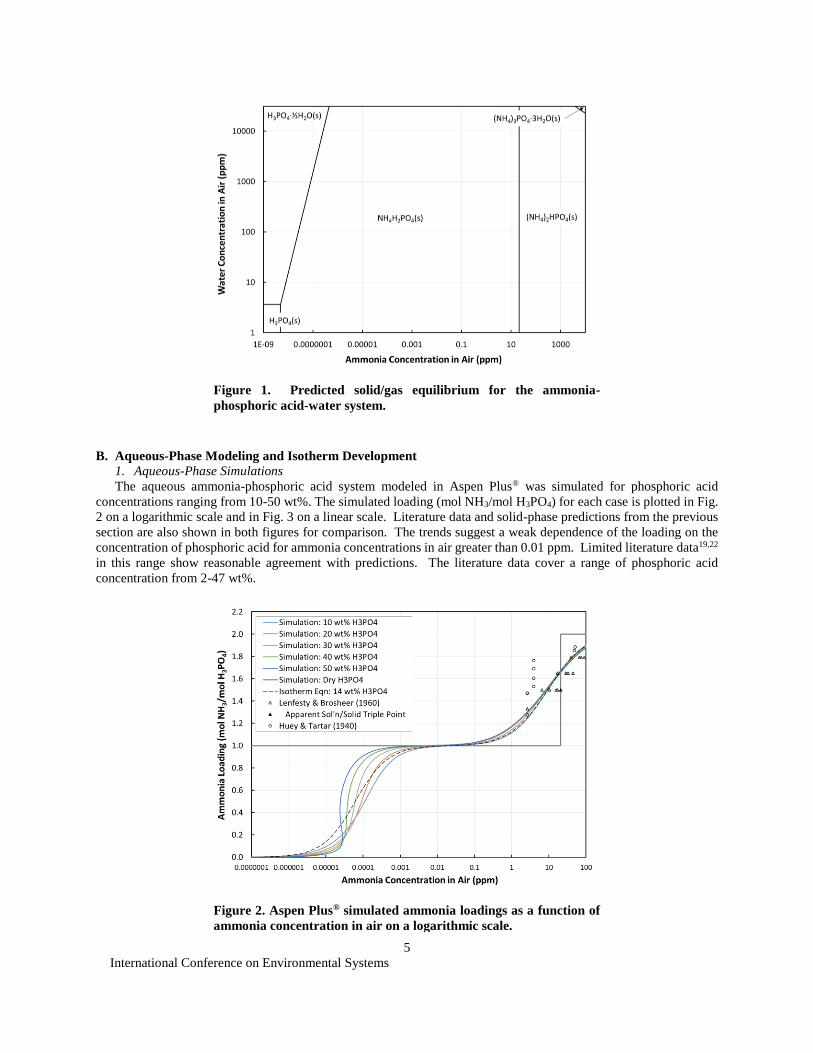
Predicted solid/gas equilibrium products based on Gibbs free energy minimization are shown in Fig. 1 as a function
of the ammonia and water concentrations in air. Under dry and very low humidity conditions where capillary
condensation does not occur, NH4H2PO4(s) is the expected product below 21 ppm ammonia in air, and (NH4)2HPO4(s)
is the expected product above 21 ppm. These correspond to loadings of 1 mole and 2 moles NH3 per mole H3PO4,
respectively. The sharp transition between solid phases is predicted thermodynamically when mixing in the solid
phase can be neglected.24
International Conference on Environmental Systems
5
B. Aqueous-Phase Modeling and Isotherm Development
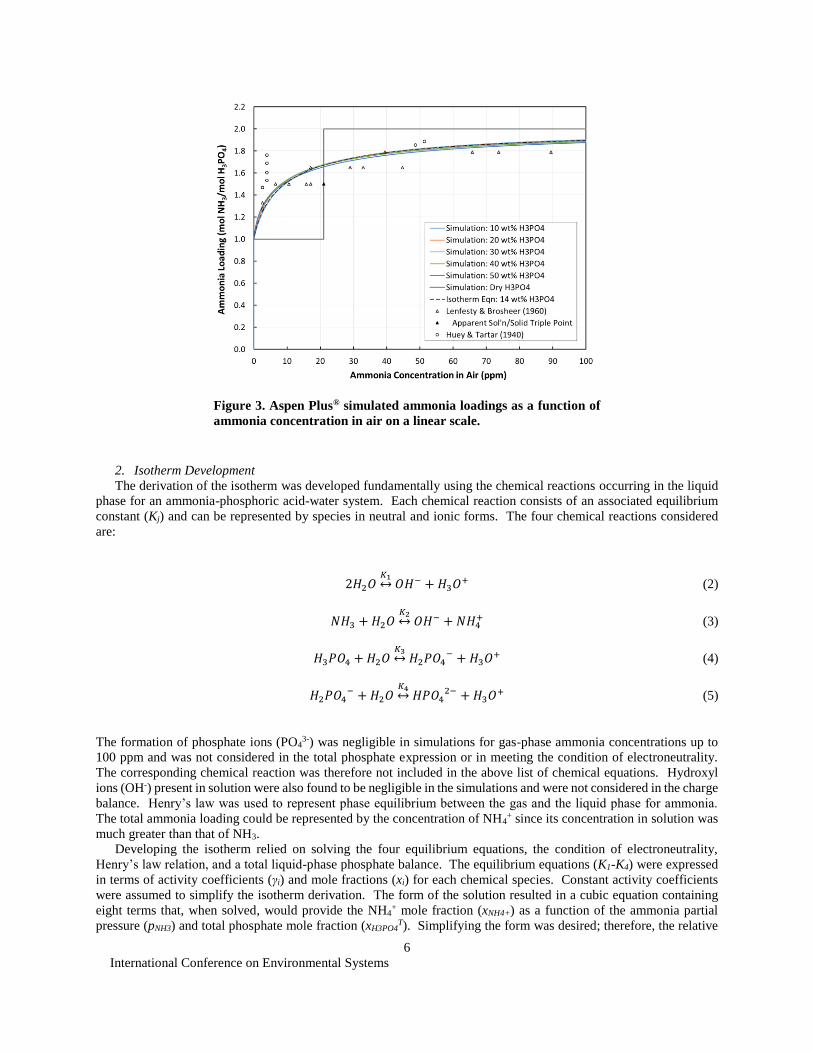
1. Aqueous-Phase Simulations
The aqueous ammonia-phosphoric acid system modeled in Aspen Plus® was simulated for phosphoric acid
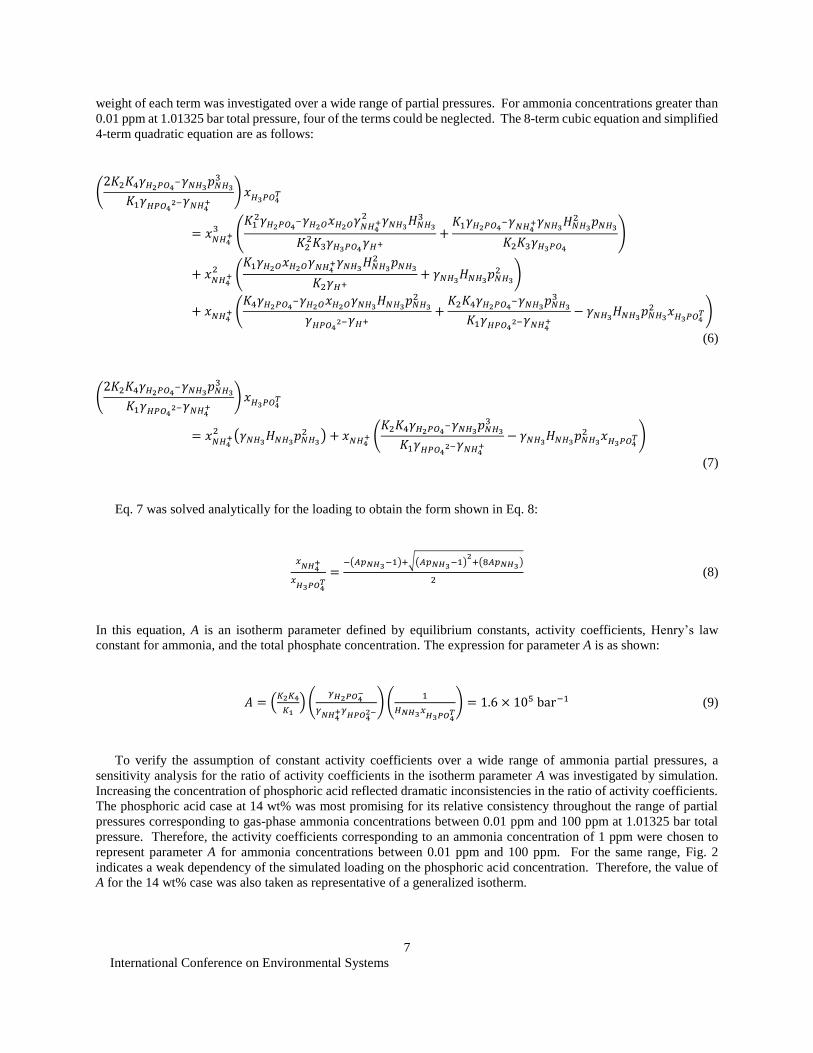
concentrations ranging from 10-50 wt%. The simulated loading (mol NH3/mol H3PO4) for each case is plotted in Fig.
2 on a logarithmic scale and in Fig. 3 on a linear scale. Literature data and solid-phase predictions from the previous
section are also shown in both figures for comparison. The trends suggest a weak dependence of the loading on the
concentration of phosphoric acid for ammonia concentrations in air greater than 0.01 ppm. Limited literature data19,22
in this range show reasonable agreement with predictions. The literature data cover a range of phosphoric acid
concentration from 2-47 wt%.
Figure 1. Predicted solid/gas equilibrium for the ammonia-
phosphoric acid-water system.
Figure 2. Aspen Plus® simulated ammonia loadings as a function of
ammonia concentration in air on a logarithmic scale.
International Conference on Environmental Systems
6
2. Isotherm Development
The derivation of the isotherm was developed fundamentally using the chemical reactions occurring in the liquid
phase for an ammonia-phosphoric acid-water system. Each chemical reaction consists of an associated equilibrium
constant (Kj) and can be represented by species in neutral and ionic forms. The four chemical reactions considered
are:
2𝐻2𝑂𝐾1↔ 𝑂𝐻− + 𝐻3𝑂+ (2)
𝑁𝐻3 + 𝐻2𝑂𝐾2↔ 𝑂𝐻− + 𝑁𝐻4
+ (3)
𝐻3𝑃𝑂4 + 𝐻2𝑂𝐾3↔ 𝐻2𝑃𝑂4
− + 𝐻3𝑂+ (4)
𝐻2𝑃𝑂4− + 𝐻2𝑂
𝐾4↔ 𝐻𝑃𝑂4
2− + 𝐻3𝑂+ (5)
The formation of phosphate ions (PO43-) was negligible in simulations for gas-phase ammonia concentrations up to
100 ppm and was not considered in the total phosphate expression or in meeting the condition of electroneutrality.
The corresponding chemical reaction was therefore not included in the above list of chemical equations. Hydroxyl
ions (OH-) present in solution were also found to be negligible in the simulations and were not considered in the charge
balance. Henry’s law was used to represent phase equilibrium between the gas and the liquid phase for ammonia.
The total ammonia loading could be represented by the concentration of NH4+ since its concentration in solution was
much greater than that of NH3.
Developing the isotherm relied on solving the four equilibrium equations, the condition of electroneutrality,
Henry’s law relation, and a total liquid-phase phosphate balance. The equilibrium equations (K1-K4) were expressed
in terms of activity coefficients (γi) and mole fractions (xi) for each chemical species. Constant activity coefficients
were assumed to simplify the isotherm derivation. The form of the solution resulted in a cubic equation containing
eight terms that, when solved, would provide the NH4+ mole fraction (xNH4+) as a function of the ammonia partial
pressure (pNH3) and total phosphate mole fraction (xH3PO4T). Simplifying the form was desired; therefore, the relative
Figure 3. Aspen Plus® simulated ammonia loadings as a function of
ammonia concentration in air on a linear scale.
International Conference on Environmental Systems
7
weight of each term was investigated over a wide range of partial pressures. For ammonia concentrations greater than
0.01 ppm at 1.01325 bar total pressure, four of the terms could be neglected. The 8-term cubic equation and simplified
4-term quadratic equation are as follows:
(2𝐾2𝐾4𝛾𝐻2𝑃𝑂4
−𝛾𝑁𝐻3𝑝𝑁𝐻3
3
𝐾1𝛾𝐻𝑃𝑂42−𝛾𝑁𝐻4
+) 𝑥𝐻3𝑃𝑂4
𝑇
= 𝑥𝑁𝐻4+
3 (𝐾1
2𝛾𝐻2𝑃𝑂4−𝛾𝐻2𝑂𝑥𝐻2𝑂𝛾
𝑁𝐻4+
2 𝛾𝑁𝐻3𝐻𝑁𝐻3
3
𝐾22𝐾3𝛾𝐻3𝑃𝑂4
𝛾𝐻++
𝐾1𝛾𝐻2𝑃𝑂4−𝛾𝑁𝐻4
+𝛾𝑁𝐻3𝐻𝑁𝐻3
2 𝑝𝑁𝐻3
𝐾2𝐾3𝛾𝐻3𝑃𝑂4
)
+ 𝑥𝑁𝐻4
+2 (
𝐾1𝛾𝐻2𝑂𝑥𝐻2𝑂𝛾𝑁𝐻4+𝛾𝑁𝐻3
𝐻𝑁𝐻32 𝑝𝑁𝐻3
𝐾2𝛾𝐻++ 𝛾𝑁𝐻3
𝐻𝑁𝐻3𝑝𝑁𝐻3
2 )
+ 𝑥𝑁𝐻4+ (
𝐾4𝛾𝐻2𝑃𝑂4−𝛾𝐻2𝑂𝑥𝐻2𝑂𝛾𝑁𝐻3
𝐻𝑁𝐻3𝑝𝑁𝐻3
2
𝛾𝐻𝑃𝑂42−𝛾𝐻+
+𝐾2𝐾4𝛾𝐻2𝑃𝑂4
−𝛾𝑁𝐻3𝑝𝑁𝐻3
3
𝐾1𝛾𝐻𝑃𝑂42−𝛾𝑁𝐻4
+− 𝛾𝑁𝐻3
𝐻𝑁𝐻3𝑝𝑁𝐻3
2 𝑥𝐻3𝑃𝑂4𝑇)
(6)
(2𝐾2𝐾4𝛾𝐻2𝑃𝑂4
−𝛾𝑁𝐻3𝑝𝑁𝐻3
3
𝐾1𝛾𝐻𝑃𝑂42−𝛾𝑁𝐻4
+) 𝑥𝐻3𝑃𝑂4
𝑇
= 𝑥𝑁𝐻4+
2 (𝛾𝑁𝐻3𝐻𝑁𝐻3
𝑝𝑁𝐻32 ) + 𝑥𝑁𝐻4
+ (𝐾2𝐾4𝛾𝐻2𝑃𝑂4
−𝛾𝑁𝐻3𝑝𝑁𝐻3
3
𝐾1𝛾𝐻𝑃𝑂42−𝛾𝑁𝐻4
+− 𝛾𝑁𝐻3
𝐻𝑁𝐻3𝑝𝑁𝐻3
2 𝑥𝐻3𝑃𝑂4𝑇)
(7)
Eq. 7 was solved analytically for the loading to obtain the form shown in Eq. 8:
𝑥
𝑁𝐻4+
𝑥𝐻3𝑃𝑂4
𝑇=
−(𝐴𝑝𝑁𝐻3−1)+√(𝐴𝑝𝑁𝐻3−1)2
+(8𝐴𝑝𝑁𝐻3)
2 (8)
In this equation, A is an isotherm parameter defined by equilibrium constants, activity coefficients, Henry’s law
constant for ammonia, and the total phosphate concentration. The expression for parameter A is as shown:
𝐴 = (𝐾2𝐾4
𝐾1) (
𝛾𝐻2𝑃𝑂4−
𝛾𝑁𝐻4
+𝛾𝐻𝑃𝑂4
2−) (
1
𝐻𝑁𝐻3𝑥𝐻3𝑃𝑂4
𝑇) = 1.6 × 10⁵ bar−1 (9)
To verify the assumption of constant activity coefficients over a wide range of ammonia partial pressures, a
sensitivity analysis for the ratio of activity coefficients in the isotherm parameter A was investigated by simulation.
Increasing the concentration of phosphoric acid reflected dramatic inconsistencies in the ratio of activity coefficients.
The phosphoric acid case at 14 wt% was most promising for its relative consistency throughout the range of partial
pressures corresponding to gas-phase ammonia concentrations between 0.01 ppm and 100 ppm at 1.01325 bar total
pressure. Therefore, the activity coefficients corresponding to an ammonia concentration of 1 ppm were chosen to
represent parameter A for ammonia concentrations between 0.01 ppm and 100 ppm. For the same range, Fig. 2
indicates a weak dependency of the simulated loading on the phosphoric acid concentration. Therefore, the value of
A for the 14 wt% case was also taken as representative of a generalized isotherm.
International Conference on Environmental Systems
8
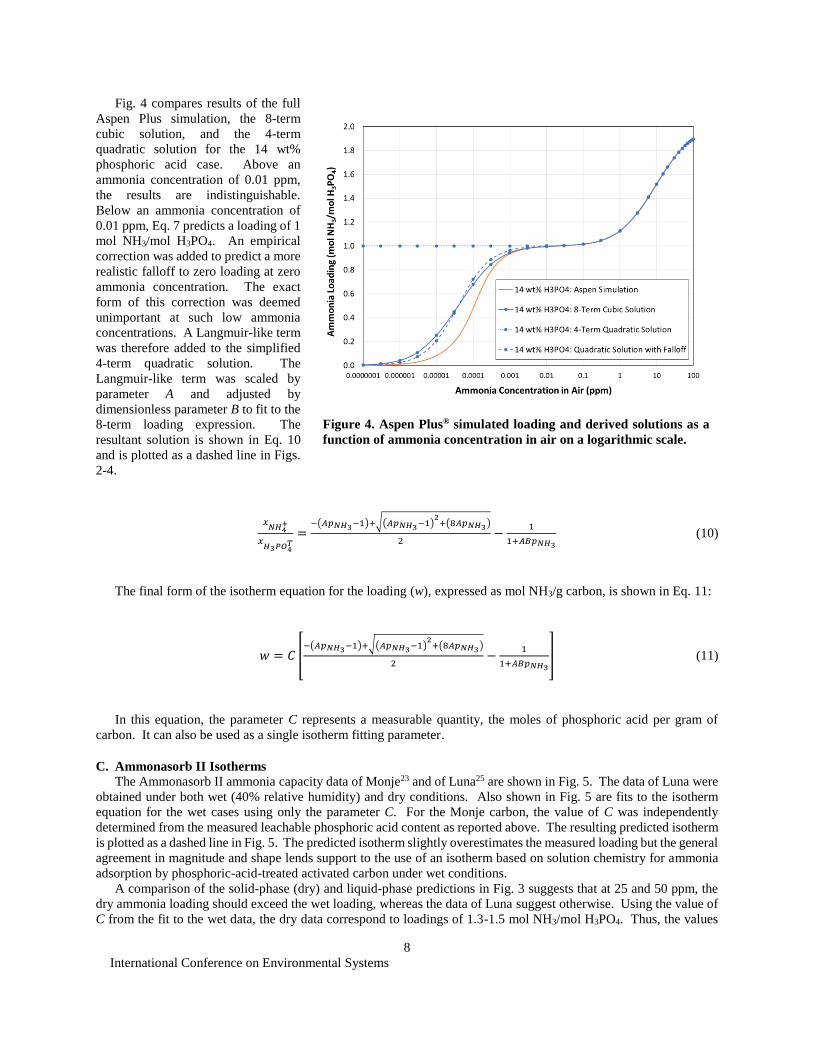
Fig. 4 compares results of the full
Aspen Plus simulation, the 8-term
cubic solution, and the 4-term
quadratic solution for the 14 wt%
phosphoric acid case. Above an
ammonia concentration of 0.01 ppm,
the results are indistinguishable.
Below an ammonia concentration of
0.01 ppm, Eq. 7 predicts a loading of 1
mol NH3/mol H3PO4. An empirical
correction was added to predict a more
realistic falloff to zero loading at zero
ammonia concentration. The exact
form of this correction was deemed
unimportant at such low ammonia
concentrations. A Langmuir-like term
was therefore added to the simplified
4-term quadratic solution. The
Langmuir-like term was scaled by
parameter A and adjusted by
dimensionless parameter B to fit to the
8-term loading expression. The
resultant solution is shown in Eq. 10
and is plotted as a dashed line in Figs.
2-4.
𝑥
𝑁𝐻4+
𝑥𝐻3𝑃𝑂4
𝑇=
−(𝐴𝑝𝑁𝐻3−1)+√(𝐴𝑝𝑁𝐻3−1)2
+(8𝐴𝑝𝑁𝐻3)
2−
1
1+𝐴𝐵𝑝𝑁𝐻3
(10)
The final form of the isotherm equation for the loading (w), expressed as mol NH3/g carbon, is shown in Eq. 11:
𝑤 = 𝐶 [−(𝐴𝑝𝑁𝐻3−1)+√(𝐴𝑝𝑁𝐻3−1)
2+(8𝐴𝑝𝑁𝐻3)
2−
1
1+𝐴𝐵𝑝𝑁𝐻3
] (11)
In this equation, the parameter C represents a measurable quantity, the moles of phosphoric acid per gram of
carbon. It can also be used as a single isotherm fitting parameter.
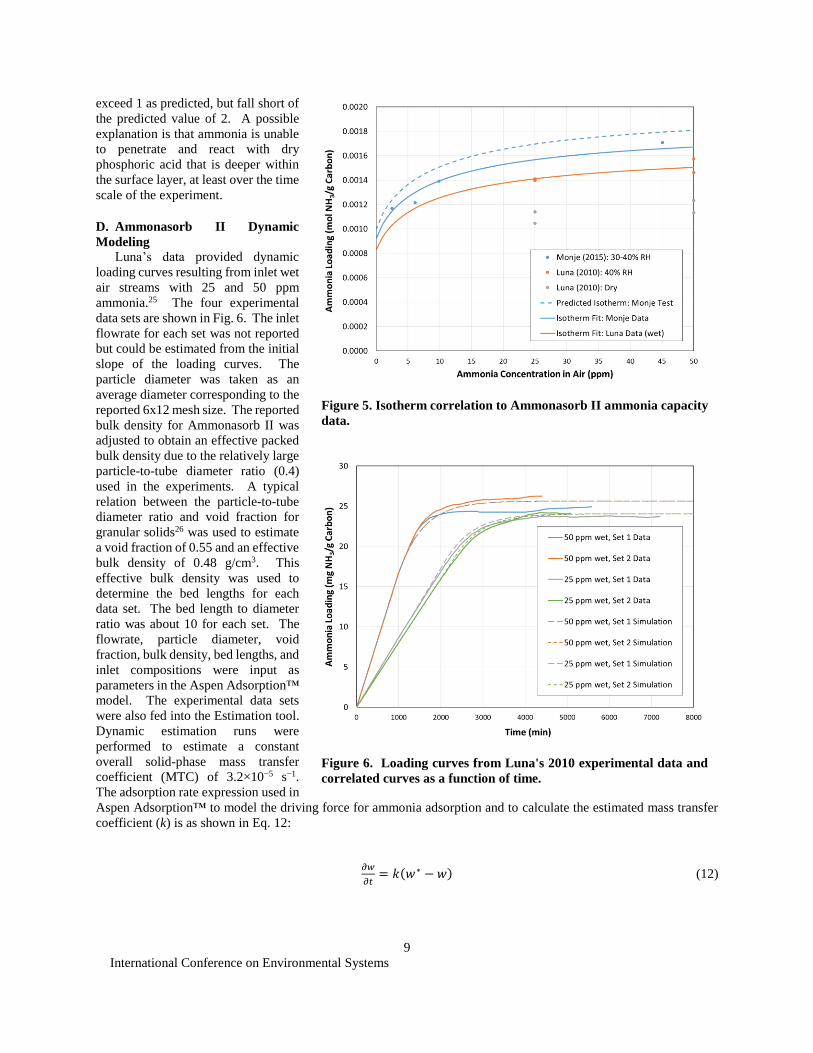
C. Ammonasorb II Isotherms
The Ammonasorb II ammonia capacity data of Monje23 and of Luna25 are shown in Fig. 5. The data of Luna were
obtained under both wet (40% relative humidity) and dry conditions. Also shown in Fig. 5 are fits to the isotherm
equation for the wet cases using only the parameter C. For the Monje carbon, the value of C was independently
determined from the measured leachable phosphoric acid content as reported above. The resulting predicted isotherm
is plotted as a dashed line in Fig. 5. The predicted isotherm slightly overestimates the measured loading but the general
agreement in magnitude and shape lends support to the use of an isotherm based on solution chemistry for ammonia
adsorption by phosphoric-acid-treated activated carbon under wet conditions.
A comparison of the solid-phase (dry) and liquid-phase predictions in Fig. 3 suggests that at 25 and 50 ppm, the
dry ammonia loading should exceed the wet loading, whereas the data of Luna suggest otherwise. Using the value of
C from the fit to the wet data, the dry data correspond to loadings of 1.3-1.5 mol NH3/mol H3PO4. Thus, the values
Figure 4. Aspen Plus® simulated loading and derived solutions as a
function of ammonia concentration in air on a logarithmic scale.
International Conference on Environmental Systems
9
exceed 1 as predicted, but fall short of
the predicted value of 2. A possible
explanation is that ammonia is unable
to penetrate and react with dry
phosphoric acid that is deeper within
the surface layer, at least over the time
scale of the experiment.
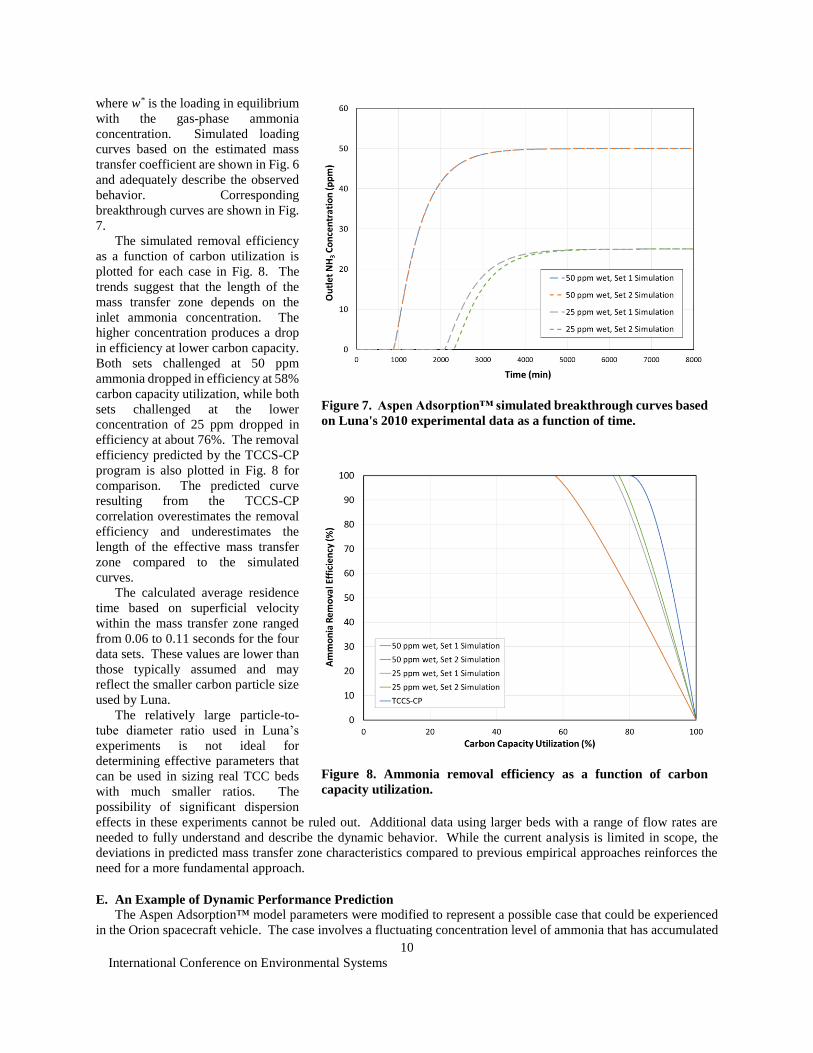
D. Ammonasorb II Dynamic
Modeling
Luna’s data provided dynamic
loading curves resulting from inlet wet
air streams with 25 and 50 ppm
ammonia.25 The four experimental
data sets are shown in Fig. 6. The inlet
flowrate for each set was not reported
but could be estimated from the initial
slope of the loading curves. The
particle diameter was taken as an
average diameter corresponding to the
reported 6x12 mesh size. The reported
bulk density for Ammonasorb II was
adjusted to obtain an effective packed
bulk density due to the relatively large
particle-to-tube diameter ratio (0.4)
used in the experiments. A typical
relation between the particle-to-tube
diameter ratio and void fraction for
granular solids26 was used to estimate
a void fraction of 0.55 and an effective
bulk density of 0.48 g/cm3. This
effective bulk density was used to
determine the bed lengths for each
data set. The bed length to diameter
ratio was about 10 for each set. The
flowrate, particle diameter, void
fraction, bulk density, bed lengths, and
inlet compositions were input as
parameters in the Aspen Adsorption™
model. The experimental data sets
were also fed into the Estimation tool.
Dynamic estimation runs were
performed to estimate a constant
overall solid-phase mass transfer
coefficient (MTC) of 3.2×10⁻⁵ s−1.
The adsorption rate expression used in
Aspen Adsorption™ to model the driving force for ammonia adsorption and to calculate the estimated mass transfer
coefficient (k) is as shown in Eq. 12:
𝜕𝑤
𝜕𝑡= 𝑘(𝑤∗ − 𝑤) (12)
Figure 6. Loading curves from Luna's 2010 experimental data and
correlated curves as a function of time.
Figure 5. Isotherm correlation to Ammonasorb II ammonia capacity
data.
International Conference on Environmental Systems
10
where w* is the loading in equilibrium
with the gas-phase ammonia
concentration. Simulated loading
curves based on the estimated mass
transfer coefficient are shown in Fig. 6
and adequately describe the observed
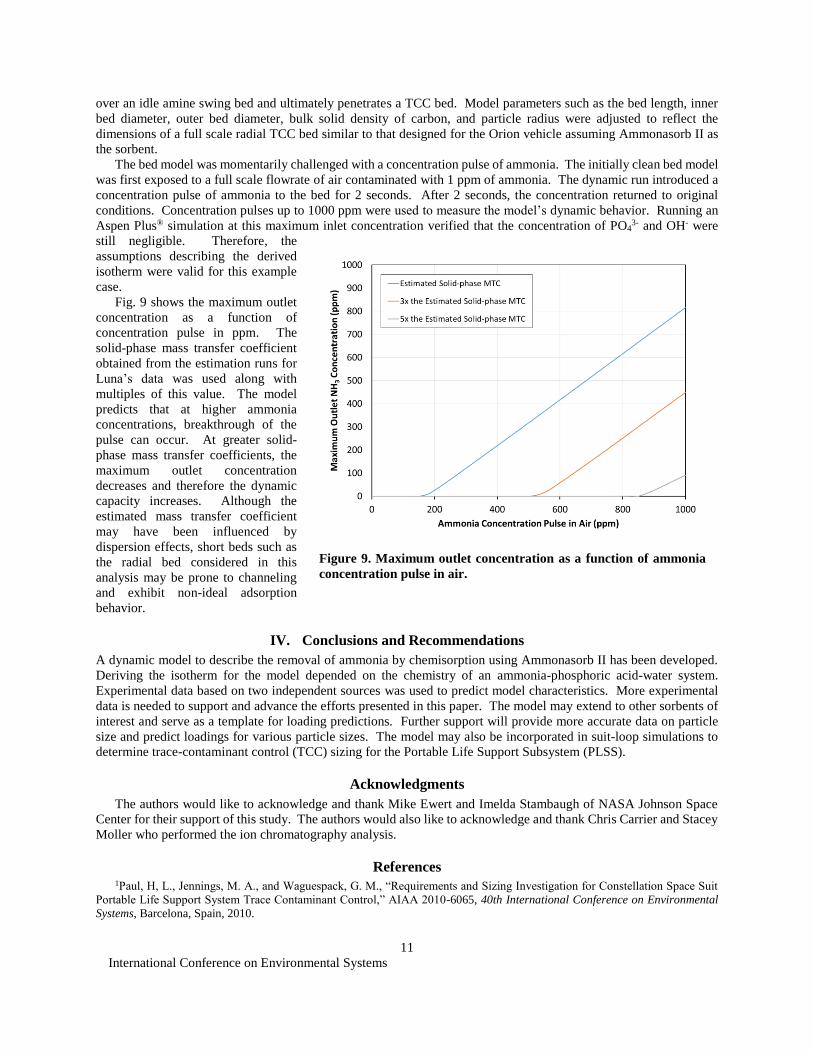
behavior. Corresponding
breakthrough curves are shown in Fig.
7.
The simulated removal efficiency
as a function of carbon utilization is
plotted for each case in Fig. 8. The
trends suggest that the length of the
mass transfer zone depends on the
inlet ammonia concentration. The
higher concentration produces a drop
in efficiency at lower carbon capacity.
Both sets challenged at 50 ppm
ammonia dropped in efficiency at 58%
carbon capacity utilization, while both
sets challenged at the lower
concentration of 25 ppm dropped in
efficiency at about 76%. The removal
efficiency predicted by the TCCS-CP
program is also plotted in Fig. 8 for
comparison. The predicted curve
resulting from the TCCS-CP
correlation overestimates the removal
efficiency and underestimates the
length of the effective mass transfer
zone compared to the simulated
curves.
The calculated average residence
time based on superficial velocity
within the mass transfer zone ranged
from 0.06 to 0.11 seconds for the four
data sets. These values are lower than
those typically assumed and may
reflect the smaller carbon particle size
used by Luna.
The relatively large particle-to-
tube diameter ratio used in Luna’s
experiments is not ideal for
determining effective parameters that
can be used in sizing real TCC beds
with much smaller ratios. The
possibility of significant dispersion
effects in these experiments cannot be ruled out. Additional data using larger beds with a range of flow rates are
needed to fully understand and describe the dynamic behavior. While the current analysis is limited in scope, the
deviations in predicted mass transfer zone characteristics compared to previous empirical approaches reinforces the
need for a more fundamental approach.
E. An Example of Dynamic Performance Prediction
The Aspen Adsorption™ model parameters were modified to represent a possible case that could be experienced
in the Orion spacecraft vehicle. The case involves a fluctuating concentration level of ammonia that has accumulated
Figure 7. Aspen Adsorption™ simulated breakthrough curves based
on Luna's 2010 experimental data as a function of time.
Figure 8. Ammonia removal efficiency as a function of carbon
capacity utilization.
International Conference on Environmental Systems
11
over an idle amine swing bed and ultimately penetrates a TCC bed. Model parameters such as the bed length, inner
bed diameter, outer bed diameter, bulk solid density of carbon, and particle radius were adjusted to reflect the
dimensions of a full scale radial TCC bed similar to that designed for the Orion vehicle assuming Ammonasorb II as
the sorbent.
The bed model was momentarily challenged with a concentration pulse of ammonia. The initially clean bed model
was first exposed to a full scale flowrate of air contaminated with 1 ppm of ammonia. The dynamic run introduced a
concentration pulse of ammonia to the bed for 2 seconds. After 2 seconds, the concentration returned to original
conditions. Concentration pulses up to 1000 ppm were used to measure the model’s dynamic behavior. Running an
Aspen Plus® simulation at this maximum inlet concentration verified that the concentration of PO43- and OH- were
still negligible. Therefore, the
assumptions describing the derived
isotherm were valid for this example
case.
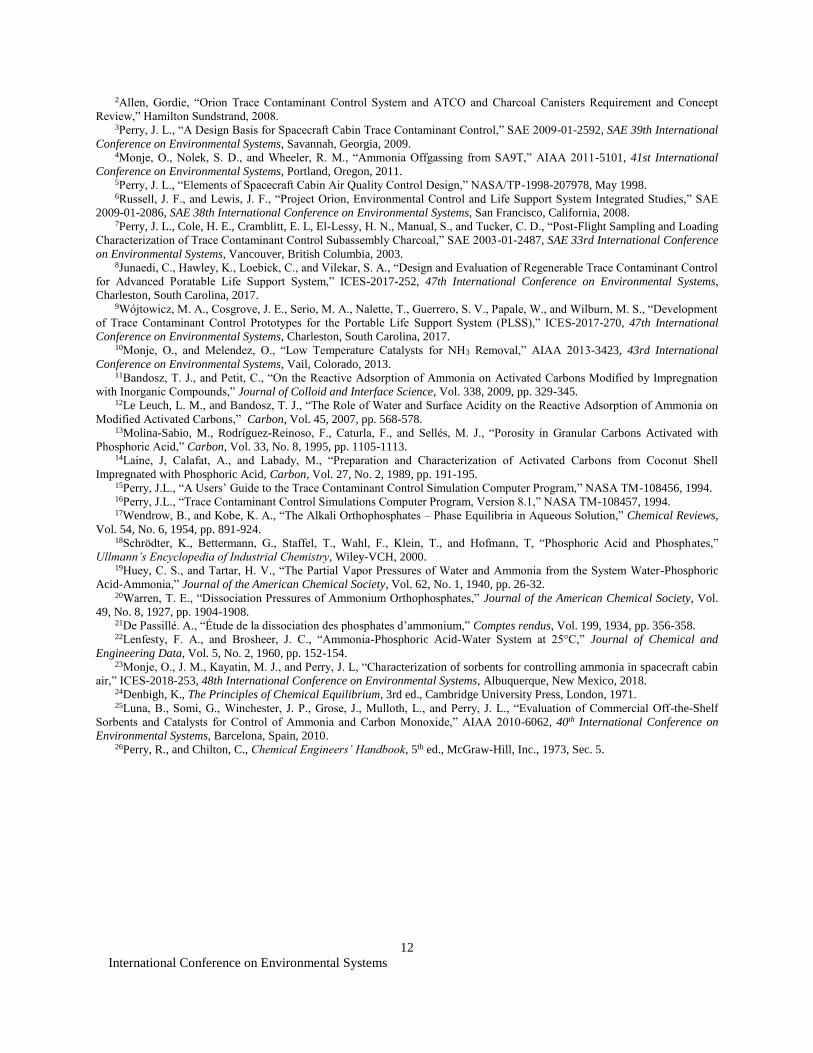
Fig. 9 shows the maximum outlet
concentration as a function of
concentration pulse in ppm. The
solid-phase mass transfer coefficient
obtained from the estimation runs for
Luna’s data was used along with
multiples of this value. The model
predicts that at higher ammonia
concentrations, breakthrough of the
pulse can occur. At greater solid-
phase mass transfer coefficients, the
maximum outlet concentration
decreases and therefore the dynamic
capacity increases. Although the
estimated mass transfer coefficient
may have been influenced by
dispersion effects, short beds such as
the radial bed considered in this
analysis may be prone to channeling
and exhibit non-ideal adsorption
behavior.
IV. Conclusions and Recommendations
A dynamic model to describe the removal of ammonia by chemisorption using Ammonasorb II has been developed.
Deriving the isotherm for the model depended on the chemistry of an ammonia-phosphoric acid-water system.
Experimental data based on two independent sources was used to predict model characteristics. More experimental
data is needed to support and advance the efforts presented in this paper. The model may extend to other sorbents of
interest and serve as a template for loading predictions. Further support will provide more accurate data on particle
size and predict loadings for various particle sizes. The model may also be incorporated in suit-loop simulations to
determine trace-contaminant control (TCC) sizing for the Portable Life Support Subsystem (PLSS).
Acknowledgments
The authors would like to acknowledge and thank Mike Ewert and Imelda Stambaugh of NASA Johnson Space
Center for their support of this study. The authors would also like to acknowledge and thank Chris Carrier and Stacey
Moller who performed the ion chromatography analysis.
References 1Paul, H, L., Jennings, M. A., and Waguespack, G. M., “Requirements and Sizing Investigation for Constellation Space Suit
Portable Life Support System Trace Contaminant Control,” AIAA 2010-6065, 40th International Conference on Environmental
Systems, Barcelona, Spain, 2010.
Figure 9. Maximum outlet concentration as a function of ammonia
concentration pulse in air.
International Conference on Environmental Systems
12
2Allen, Gordie, “Orion Trace Contaminant Control System and ATCO and Charcoal Canisters Requirement and Concept
Review,” Hamilton Sundstrand, 2008. 3Perry, J. L., “A Design Basis for Spacecraft Cabin Trace Contaminant Control,” SAE 2009-01-2592, SAE 39th International
Conference on Environmental Systems, Savannah, Georgia, 2009. 4Monje, O., Nolek, S. D., and Wheeler, R. M., “Ammonia Offgassing from SA9T,” AIAA 2011-5101, 41st International
Conference on Environmental Systems, Portland, Oregon, 2011. 5Perry, J. L., “Elements of Spacecraft Cabin Air Quality Control Design,” NASA/TP-1998-207978, May 1998. 6Russell, J. F., and Lewis, J. F., “Project Orion, Environmental Control and Life Support System Integrated Studies,” SAE
2009-01-2086, SAE 38th International Conference on Environmental Systems, San Francisco, California, 2008. 7Perry, J. L., Cole, H. E., Cramblitt, E. L, El-Lessy, H. N., Manual, S., and Tucker, C. D., “Post-Flight Sampling and Loading
Characterization of Trace Contaminant Control Subassembly Charcoal,” SAE 2003-01-2487, SAE 33rd International Conference
on Environmental Systems, Vancouver, British Columbia, 2003. 8Junaedi, C., Hawley, K., Loebick, C., and Vilekar, S. A., “Design and Evaluation of Regenerable Trace Contaminant Control
for Advanced Poratable Life Support System,” ICES-2017-252, 47th International Conference on Environmental Systems,
Charleston, South Carolina, 2017. 9Wójtowicz, M. A., Cosgrove, J. E., Serio, M. A., Nalette, T., Guerrero, S. V., Papale, W., and Wilburn, M. S., “Development
of Trace Contaminant Control Prototypes for the Portable Life Support System (PLSS),” ICES-2017-270, 47th International
Conference on Environmental Systems, Charleston, South Carolina, 2017. 10Monje, O., and Melendez, O., “Low Temperature Catalysts for NH3 Removal,” AIAA 2013-3423, 43rd International
Conference on Environmental Systems, Vail, Colorado, 2013. 11Bandosz, T. J., and Petit, C., “On the Reactive Adsorption of Ammonia on Activated Carbons Modified by Impregnation
with Inorganic Compounds,” Journal of Colloid and Interface Science, Vol. 338, 2009, pp. 329-345. 12Le Leuch, L. M., and Bandosz, T. J., “The Role of Water and Surface Acidity on the Reactive Adsorption of Ammonia on
Modified Activated Carbons,” Carbon, Vol. 45, 2007, pp. 568-578. 13Molina-Sabio, M., Rodríguez-Reinoso, F., Caturla, F., and Sellés, M. J., “Porosity in Granular Carbons Activated with
Phosphoric Acid,” Carbon, Vol. 33, No. 8, 1995, pp. 1105-1113. 14Laine, J, Calafat, A., and Labady, M., “Preparation and Characterization of Activated Carbons from Coconut Shell
Impregnated with Phosphoric Acid, Carbon, Vol. 27, No. 2, 1989, pp. 191-195. 15Perry, J.L., “A Users’ Guide to the Trace Contaminant Control Simulation Computer Program,” NASA TM-108456, 1994. 16Perry, J.L., “Trace Contaminant Control Simulations Computer Program, Version 8.1,” NASA TM-108457, 1994. 17Wendrow, B., and Kobe, K. A., “The Alkali Orthophosphates – Phase Equilibria in Aqueous Solution,” Chemical Reviews,
Vol. 54, No. 6, 1954, pp. 891-924. 18Schrödter, K., Bettermann, G., Staffel, T., Wahl, F., Klein, T., and Hofmann, T, “Phosphoric Acid and Phosphates,”
Ullmann’s Encyclopedia of Industrial Chemistry, Wiley-VCH, 2000. 19Huey, C. S., and Tartar, H. V., “The Partial Vapor Pressures of Water and Ammonia from the System Water-Phosphoric
Acid-Ammonia,” Journal of the American Chemical Society, Vol. 62, No. 1, 1940, pp. 26-32. 20Warren, T. E., “Dissociation Pressures of Ammonium Orthophosphates,” Journal of the American Chemical Society, Vol.
49, No. 8, 1927, pp. 1904-1908. 21De Passillé. A., “Étude de la dissociation des phosphates d’ammonium,” Comptes rendus, Vol. 199, 1934, pp. 356-358. 22Lenfesty, F. A., and Brosheer, J. C., “Ammonia-Phosphoric Acid-Water System at 25°C,” Journal of Chemical and
Engineering Data, Vol. 5, No. 2, 1960, pp. 152-154. 23Monje, O., J. M., Kayatin, M. J., and Perry, J. L, “Characterization of sorbents for controlling ammonia in spacecraft cabin
air,” ICES-2018-253, 48th International Conference on Environmental Systems, Albuquerque, New Mexico, 2018. 24Denbigh, K., The Principles of Chemical Equilibrium, 3rd ed., Cambridge University Press, London, 1971. 25Luna, B., Somi, G., Winchester, J. P., Grose, J., Mulloth, L., and Perry, J. L., “Evaluation of Commercial Off-the-Shelf
Sorbents and Catalysts for Control of Ammonia and Carbon Monoxide,” AIAA 2010-6062, 40th International Conference on
Environmental Systems, Barcelona, Spain, 2010. 26Perry, R., and Chilton, C., Chemical Engineers’ Handbook, 5th ed., McGraw-Hill, Inc., 1973, Sec. 5.