Embed Size (px)
Citation preview

Ammonia Removal from Water by Liquid-Liquid Membrane Contactor under Closed Loop Regime. E. Licon*1, S. Casas1, A. Alcaraz1, J.L. Cortina1, C. Valderrama1 1Universitat Politècnica de Catalunya, Barcelona, Spain *Corresponding author: Av. Diagonal 647 Edif. H 4th floor Barcelona Spain 08028, [email protected] Abstract: Ammonia separation from water by a membrane contactor was simulated on transient state and compared with experimental data. Aqueous low concentrated solution of ammonium with high pH has been pumped inside a hydrophobic hollow fiber (lumen), sulfuric acid solution in the outside part and the feeding solutions are in closed loop configuration. In order to simulate the separation process, the equations were developed considering radial and axial diffusion and convection in the lumen with a well-developed parabolic velocity profile. The model proposed shows minimal deviations when is compared against experimental data. This study shows that the most important parameters to control during the operation are the flow rate and the pH, mainly the last one, due to high dependence in chemical equilibrium of ammonium reaction to ammonia. Keywords: Ammonia removal, Membrane contactor, recirculation. 1. Introduction In this Study, water of a waste water treatment plant was used to remove ammonium by a liquid-liquid membrane contactor. This technology will be applied in the Hydrogen and Oxygen production by electrolysis via renewable energies, an outline of the process is shown in Appendix. The aim of this work relies on fulfill the process requirements in the electrolysis, since the efficiency of this step is inversely proportionally to conductivity. The ammonia concentration before membrane distillation step is usually between 1-5 ppm with not variations after this process. Then to use a liquid-liquid membrane contactor is proposed to reduce ammonium (NH+4) concentration before Membranes distillation step.
1.1 Ammonia-Ammonium equilibrium Ammonia is a colorless gas with a characteristic odor, very soluble in water. Its aqueous solutions are alkaline and have a corrosive effect in front to metals and tissue. Ammonia in water exists in free and ionic forms under equilibrium as is shown in equation 1:
)()(42)(3 aqaqaq OHNHOHNH −+ +⇔+ (1)
Figure 1 shows the predominant species for the ammonium equilibrium in water at different values of pH. For values below the pKa (9.3), ion ammonium is greater than ammonia. When pH is higher than the pKa, we found ammonia as predominant compound. Ammonia reacts with OH-ions present in the water, leading to gaseous ammonia molecule NH3. This gas pass through the hydrophobic membrane porous and reacts with the acid solution, where it is immediately dissolved as is shown in Figure 2-b. Since the membrane is hydrophobic, it prevents passage of feed aqueous solution through the pores and the pores are filled with air.
Figure 1. Dependence of the Ammonia-Ammonium equilibrium with respect to pH.

Figure 2. a) Cross section of a membrane module showing the fibers. b) Hollow fiber with the transport phenomena. c) Membrane contactor. d) Side view of the entrance to the hollow fibers. 2. Experimental 2.1 Materials The hydrophobic membrane contactor HFMC, (Liqui-Cel X30HF, Celgard, USA)., consists on hollow fibers, its properties are given in the Appendix (Table 1). The reagents used were ammonium chloride, sodium hydroxide to increase the pH of the dissolution, sulfuric acid (H2SO4 98% v/v) in the receiving compartment and borax as a buffer for maintain the pH in the feeding tank. 2.2 Set-up and procedure Aqueous solutions of NH3 were prepared by dissolving ammonium chloride in water for concentrations between 5 and 15 ppm, which will be referred as feeding solutions. The pH of the feed solutions was set higher than the usual value of pKa with NaOH. Borax buffer has been used to keep the pH. The acid solution was prepared dissolving 5 ml of H2SO4 in 5 L of water. The concentration of dissolved NH3 in the water was measured by Ion Chromatography System (ICS-1000 Dionex, USA). The solution pH was measured by pH meter (pH meter GLP22 Crison, Spain). Figure 3 shows the experimental set-up used in the present study. It consisted on the HFMC module, two peristaltic pumps and two tanks,
one for the ammonium solution and the other for the receiving solution.
Figure 3. Experimental setup. The feed was delivered inside the hollow fiber (lumen) with different flow rates from a 10L tank containing aqueous NH4
+ solution and was continuously recycled. In the other hand, the acid solution contained in a 5 L tank was delivered in the outside os the fibers inside the HFMC (shell) side of the module at constant flow rate in a countercurrent mode and was continuously recycled. At regular time intervals of 10 min, samples of 20ml were taken from the feed tank by opening. Then each sample was analyzed by chromatography system. At the end of the experiment, both flows were stopped. The system was properly shut down and cleaned by passing DI water through both sides to remove the remaining solution. 3. Equations Following assumptions that have been made for many authors1-4, it has been considered that unsteady state and isothermal conditions, Henry's law is applicable for feed-membrane interface, no pore blockage occurs, the feed aqueous solution do not fills the membrane pores, the reaction of ammonia with the sulfuric acid is instantaneous and always occurs in excess. Flow rates of both ammonia solution and sulfuric acid are constant and Feed tank operates at the perfect mixing mode.

The transport of both ammonia and ammonium ions in the lumen is expressed through a convective-diffusive equation:
jjjjj RCDCU
tC
+∇=∇⋅+∂
∂ 2~ (2)
where Cj is concentration of ammonia and ammonium ions (mol·m-3), D is diffusivity of the component in water (m2·s-1), Rj is the rate of generation due to the chemical reaction (mol·s-
1·m-3), U is the velocity vector (m·s-1). In this process there is no chemical reaction in the lumen side, so the symmetry assumed inside the lumen is cylindrical. Further, Ur (Radial velocity), which is due to the diffusion of ammonia in the radial direction, also becomes zero. This is because the rate of diffusion of ammonia in water is negligible and the flow is in the Z direction. Now, the equation can be modified as follows:
∂
∂+
∂
∂
∂∂
=∂
∂+
∂
∂2
21ZC
rC
rrr
DZC
Ut
C jjj
jz
j
(3) The velocity distribution in the fiber under laminar flow conditions can be written as:
−=
2
12)(hf
z rrUrU (4)
r is radial coordinate (m) and rhf is radius of the fiber. Defining U to be the average velocity of the fluid inside the lumen:
2hfrN
QUπ
= (5)
Q is the flow rate (m3/s) and N is the number of fibers in the HFMC. Once defined the equations for the mass balance within fiber, the boundary conditions are:
kZj CC tan0, == (6)
00
=
∂
∂
=r
j
rC
(7)
=
∂
∂−
=TR
pkr
CD
g
ag
poregrr
jj
hf
int,, (8)
It can be seen that the flux of ammonia in aqueous phase equals the flux of the gaseous ammonia diffused through the pore as defines equation (8). For determinate the equation (8) must be defined the mass transfer coefficient inside the pore (m/s):
=
bDk porecaporeg τ
ε,,,
(9) Da,c,pore is diffusivity of ammonia (m2·s-1), ε is porosity of the membrane, b is membrane thickness (m) and τ is tortuosity of the pore given by:
2
1ε
τ = (10)
Diffusivity of ammonia in the pore is calculated by:
airaporeakporeca DDD ,,,,,
111+=
(11) Dk,a, pore is Knudsen diffusion (m2·s-1), Da,air is diffusivity of ammonia in the air (m2·s-1). Further, the Knudsen diffusion is given by:
2/1
,,
83
=
a
gporeporeak M
TRdD
π (12) dpore is diameter of pore (m),. Rg is universal gas constant (J·mol-1·K-1), T is temperature (K) and Ma is molecular weight of ammonia (g·mol-1). As previously defined, Cj is the concentration of ammonia and ammonium ions (mol·m-3):
[ ] [ ]++= 43 NHNHC j (13)

Where [NH3] is concentration of ammonia (mol·m-3) and [NH4
+] is concentration of ammonium. On the other hand, at the liquid-gas interface located at the pore interface, Henry’s law may be applicable:
[ ]int3int, NHHP aag ⋅= (14)
Ha is Henry’s constant (Pa ·m3·mol-1) and [NH3]int is concentration of ammonia at liquid-gas interface (mol·m-3). As explained at the previous section 1.1, in aqueous solution equilibrium is established between dissolved ammonia gas and ammonium ions. A substantial fraction remains in the molecular form in solution. In other words, ammonia is a weak base where according to equation (1) the ionization constant of ammonia is.
[ ][ ][ ]3
4
NHOHNHkb
−+
= (15)
Since the pH is maintained during the process, the concentration of the base is kept constant in the lumen and is given by [ ] 1410 −− = pHOH (16) Substituting the equation 16 in equation 15 it is observed that kb is a function of pH. At higher pH values, the kb will be smaller and the equilibrium move towards the formation of ammonium. By the other hand, a mass balance over ammonia tank under the assumption of uniform mixing can be written:
)( tan,tan
kLzjk CCQ
dtdCV −= =
(18) Initial Condition: at t= 0
kCC tan0 = (19) 4. Use of COMSOL Multiphysics One single hollow fiber is simulated using a 2D axisymmetric model. The equations were nondimensionalized only in terms of the aspect ratio of the fiber, then in order to solve equation (3) using the PDE coefficient form the
coordinates are Z=z/L and R=r/rhf., where L and rhf are the hollow fiber length and radius respectively. The coefficient values for the settings of the coefficient form would be: Diffusion coefficient:
=
2
2
0
0
LD
rD
c hf (20)
Convection coefficient
( )
−
−=
LRUrD hf
/12/
2β (21)
Mass coefficient 1=ad (22)
In order to obtain the transport phenomena in the boundary condition equal to R=1, a flux boundary condition is set:
=
∂
∂−
=TR
pr
kRC
Dg
ag
hf
poreg
R
jj
int,,
1
(23)
The partial pressure of ammonia in the interface is according to equations 9-16:
+
=
−
=
14
1,int,
101 pH
b
Rjaa
g
KCH
p (24)
Recirculation is taken into account as a boundary condition in Z=1, where equation (18) is taken in to account as a global equation that describes the concentration in the tank:
( )tCC kZj tan0, == (25) The pH of the solution in the tank was considered as a time dependant function, fitted in a previous step in MATLAB from experimental results with the equation (26), see Figure 3.
( )2/34
2/30
0 10*58.6)(
ttpHpHpHtpH end
+−
+= (26)

Figure 4. Evolution of pH in an experiment without buffer solution. 5. Results: In the Figure 5 is shown how the concentration is decreasing wuen the fluid pass the lumen of a fiber, at R=1 the transport of the ammonia trough the membrane to the acid solution is occurring. Different simulations have been done. From the Figure 6 is evident that this model is independent of the initial concentration set in the tank with ammonium chloride. According to Figure 7 and Figure 8, the improvement in the efficiency of this separation process by rising the pH or the flow rate is limited by some extend and this information can be used to optimize the resources and energy needed to carry out the experiments. This information corresponds with the results obtained in previous works done before without the use of COMSOL1,2
Figure 5. Distribution of Cj over plane inside the fiber for a t=10000 seconds.
Figure 6. Normalized concentration evolution in the feeding tank at different initial concentrations from 0.5 ppm of ammonium to 3with a Q=4.392e-6 m3/s and pH=10.3.
Figure 7. Normalized concentration evolution in the feeding tank at different pH at Q= 4.392e-6 m3/s and Co=15 ppm.
Figure 8. Normalized concentration evolution in the feeding tank at different flow rates (Q in m3/s) Co=15ppm and pH=10.3.
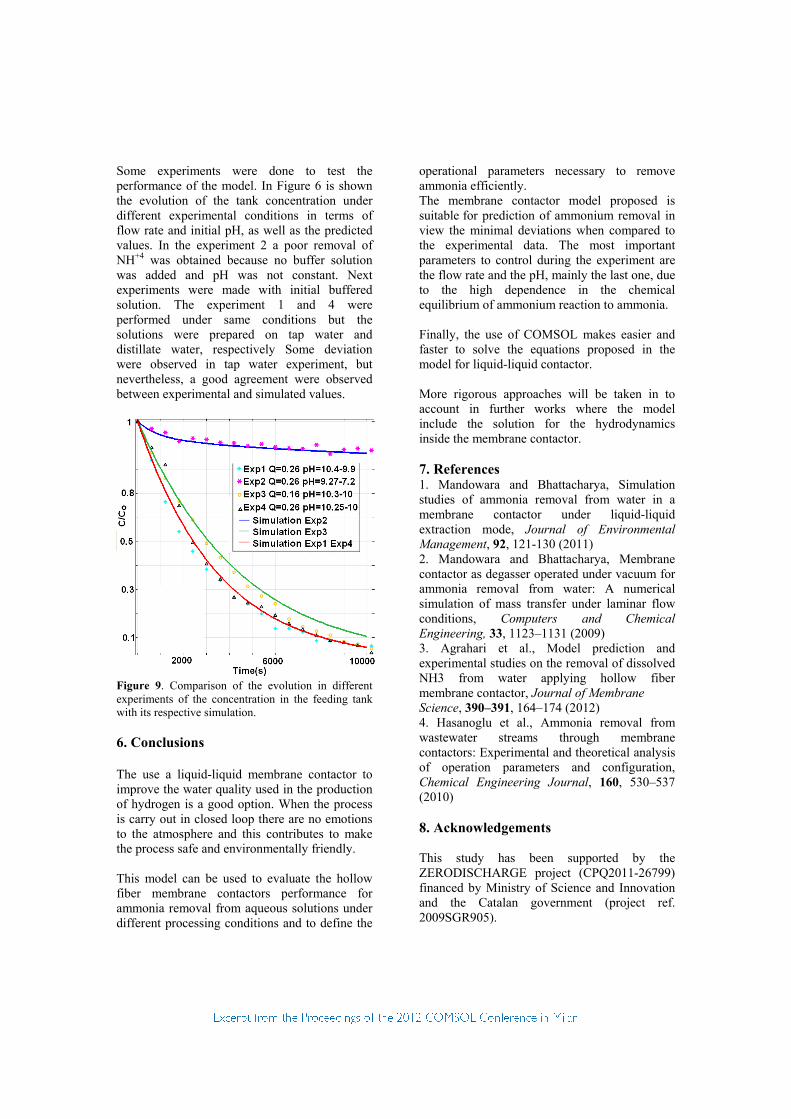
Some experiments were done to test the performance of the model. In Figure 6 is shown the evolution of the tank concentration under different experimental conditions in terms of flow rate and initial pH, as well as the predicted values. In the experiment 2 a poor removal of NH+4 was obtained because no buffer solution was added and pH was not constant. Next experiments were made with initial buffered solution. The experiment 1 and 4 were performed under same conditions but the solutions were prepared on tap water and distillate water, respectively Some deviation were observed in tap water experiment, but nevertheless, a good agreement were observed between experimental and simulated values.
Figure 9. Comparison of the evolution in different experiments of the concentration in the feeding tank with its respective simulation. 6. Conclusions The use a liquid-liquid membrane contactor to improve the water quality used in the production of hydrogen is a good option. When the process is carry out in closed loop there are no emotions to the atmosphere and this contributes to make the process safe and environmentally friendly. This model can be used to evaluate the hollow fiber membrane contactors performance for ammonia removal from aqueous solutions under different processing conditions and to define the
operational parameters necessary to remove ammonia efficiently. The membrane contactor model proposed is suitable for prediction of ammonium removal in view the minimal deviations when compared to the experimental data. The most important parameters to control during the experiment are the flow rate and the pH, mainly the last one, due to the high dependence in the chemical equilibrium of ammonium reaction to ammonia. Finally, the use of COMSOL makes easier and faster to solve the equations proposed in the model for liquid-liquid contactor. More rigorous approaches will be taken in to account in further works where the model include the solution for the hydrodynamics inside the membrane contactor. 7. References 1. Mandowara and Bhattacharya, Simulation studies of ammonia removal from water in a membrane contactor under liquid-liquid extraction mode, Journal of Environmental Management, 92, 121-130 (2011) 2. Mandowara and Bhattacharya, Membrane contactor as degasser operated under vacuum for ammonia removal from water: A numerical simulation of mass transfer under laminar flow conditions, Computers and Chemical Engineering, 33, 1123–1131 (2009) 3. Agrahari et al., Model prediction and experimental studies on the removal of dissolved NH3 from water applying hollow fiber membrane contactor, Journal of Membrane Science, 390–391, 164–174 (2012) 4. Hasanoglu et al., Ammonia removal from wastewater streams through membrane contactors: Experimental and theoretical analysis of operation parameters and configuration, Chemical Engineering Journal, 160, 530–537 (2010) 8. Acknowledgements This study has been supported by the ZERODISCHARGE project (CPQ2011-26799) financed by Ministry of Science and Innovation and the Catalan government (project ref. 2009SGR905).

9. Appendix
Table 1: Properties of the membrane contactor. Membrane Contactor Property
Typical Values
Units
Porosity 40 %
Pore Dimensions
0.04 x 0.10 µm
µm
Effective Pore Size
0.04 µm
Burst Strength 220 PSI (15.5 kg/cm2)
Tensile Break Strength
175 gr/filament
Resistance to Air Flow
25-45 Gurley sec.
Shrinkage, Axial Direction
5 %
Internal Diameter
240 µm
Wall Thickness 30 µm
Outer Diameter 300 µm
Figure 10. Outline of the Greenlysis project.