Embed Size (px)
Citation preview
Energy Conversion and Management 64 (2012) 256–262
Contents lists available at SciVerse ScienceDirect
Energy Conversion and Management
journal homepage: www.elsevier .com/locate /enconman
Dynamic knock detection and quantification in a spark ignition engineby means of a pressure based method
Enzo Galloni ⇑Department of Mechanical and Civil Engineering, University of Cassino, Via G. De Biasio, 43, 03043 Cassino, Italy
a r t i c l e i n f o
Article history:Received 2 January 2012Accepted 20 May 2012Available online 26 September 2012
Keywords:KnockExperimental analysisPressure based methodKnock-limited spark advance
0196-8904/$ - see front matter � 2012 Elsevier Ltd. Ahttp://dx.doi.org/10.1016/j.enconman.2012.05.015
⇑ Tel.: +39 776 2994005; fax: +39 776 2994365.E-mail address: [email protected]
a b s t r a c t
In spark ignition engines, knock onset limits the maximum spark advance. An inaccurate identification ofthis limit penalises the fuel conversion efficiency. Thus it is very important to define a knock detectionmethod able to assess the knock intensity of an engine operating point.
Usually, in engine development, knock event is evaluated by analysing the in-cylinder pressure trace.Data are filtered and processed in order to obtain some indices correlated to the knock intensity, then thecalculated value is compared to a predetermined threshold. The calibration of this threshold is complexand difficult; statistical approach should be used, but often empirical values are considered.
In this paper a method that dynamically calculates the knock threshold necessary to determine theknock event is proposed. The purpose is to resolve cycle by cycle the knock intensity related to an indi-vidual engine cycle without setting a predetermined threshold.
The method has been applied to an extensive set of experimental data relative to a gasoline spark-ignition engine.
Results are correlated to those obtained considering a traditional method, where a statistical approachhas been used to detect knock.
� 2012 Elsevier Ltd. All rights reserved.
1. Introduction
Nowadays, the reduction of fuel consumption has become amandatory goal in the development and optimisation of internalcombustion engines.
For the world passenger car market, the designing of new gaso-line engines is focussed on the improvement of thermal efficiencyat part load. Higher thermal efficiency at part load is realised byincreasing the compression ratio or by means of supercharging(downsizing concept). For both of these concepts, knock is one ofthe major barriers to achieving higher thermal efficiencies whenthe engine operates at high loads.
Engine knock can be explained with the thermal auto-ignitionof one or more local regions of the air–fuel mixture in the combus-tion chamber ahead the propagating turbulent flame. Both inho-mogeneous mixture composition and temperature distribution inthe end gas affect the location of auto-ignition centres [1]. Due tothe cyclic variation [2], at each cycle local temperature time-history, charge composition and flow field details in the end-gascould change determining the knock development at differentlocations and times in the combustion chamber.
ll rights reserved.
Cycles which burn faster tend to knock more intensely and ear-lier than cycles which burn slower [3]. As a consequence, highearly peak pressures correspond to early knock occurrence andearly knock onset results in heavier knock [4].
The mean knock intensity increases, if the mean unburned gasmass fraction at knock occurrence increases [5]. But Chun andHeywood [5] shows also that the individual knock intensities donot correlate well with unburned gas mass fractions at knock on-set. They suggest that this lack of correlation on an individual cyclebasis is due to that the end gas changes its position cycle-by-cycle.Furthermore, their analyses show that the thermodynamic statehistory prior to knock is more important than the state at knockonset.
The mixture auto-ignition proceeds according to differentchemical paths depending on both temperature and charge com-position. In each case self-ignition involves a lot of simultaneous,interdependent reactions characterised by a finite chemistry rate.This determines an ignition delay followed by a very rapid reactionrate characterised by the energy release.
Spontaneous ignition of the end gas causes high rates of energyrelease producing very high local pressure; so, the non-uniformpressure distribution produces pressure waves or shock waves thatpropagate across the chamber [6]. This shock wave propagationmay excites the chamber to resonate at its natural frequency [7].Knock is audible caused by resonances of the combustion chamber.
E. Galloni / Energy Conversion and Management 64 (2012) 256–262 257
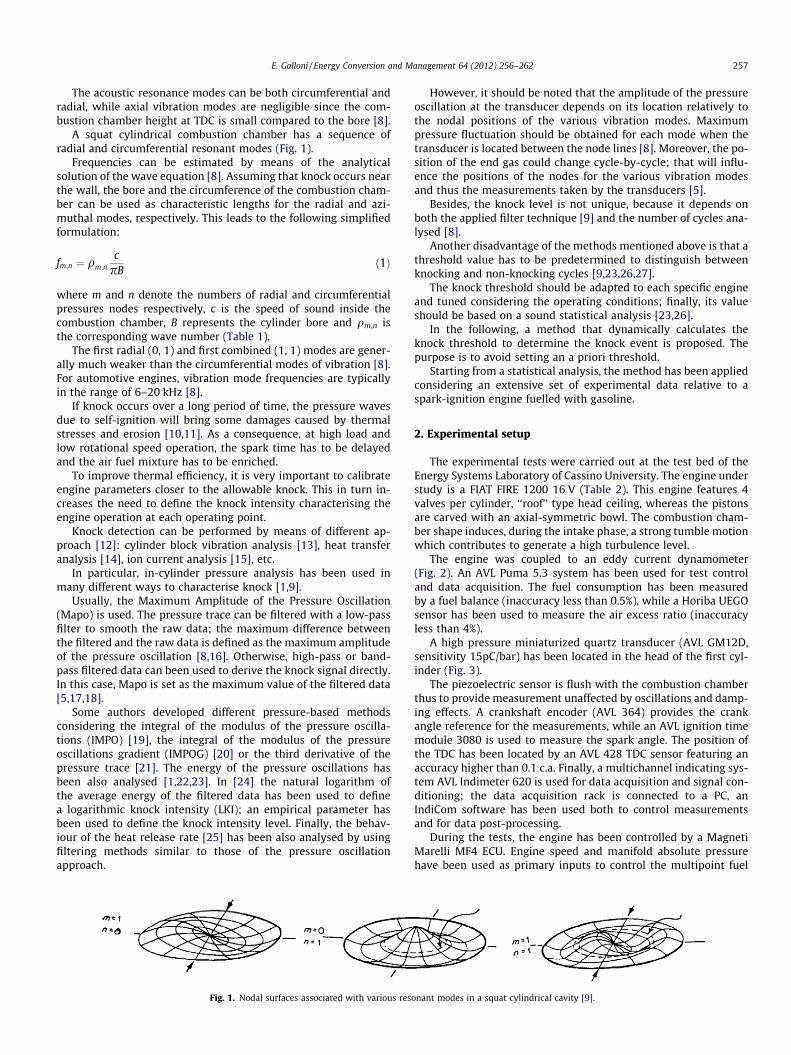
The acoustic resonance modes can be both circumferential andradial, while axial vibration modes are negligible since the com-bustion chamber height at TDC is small compared to the bore [8].
A squat cylindrical combustion chamber has a sequence ofradial and circumferential resonant modes (Fig. 1).
Frequencies can be estimated by means of the analyticalsolution of the wave equation [8]. Assuming that knock occurs nearthe wall, the bore and the circumference of the combustion cham-ber can be used as characteristic lengths for the radial and azi-muthal modes, respectively. This leads to the following simplifiedformulation:
fm;n ¼ qm;ncpB
ð1Þ
where m and n denote the numbers of radial and circumferentialpressures nodes respectively, c is the speed of sound inside thecombustion chamber, B represents the cylinder bore and qm,n isthe corresponding wave number (Table 1).
The first radial (0, 1) and first combined (1, 1) modes are gener-ally much weaker than the circumferential modes of vibration [8].For automotive engines, vibration mode frequencies are typicallyin the range of 6–20 kHz [8].
If knock occurs over a long period of time, the pressure wavesdue to self-ignition will bring some damages caused by thermalstresses and erosion [10,11]. As a consequence, at high load andlow rotational speed operation, the spark time has to be delayedand the air fuel mixture has to be enriched.
To improve thermal efficiency, it is very important to calibrateengine parameters closer to the allowable knock. This in turn in-creases the need to define the knock intensity characterising theengine operation at each operating point.
Knock detection can be performed by means of different ap-proach [12]: cylinder block vibration analysis [13], heat transferanalysis [14], ion current analysis [15], etc.
In particular, in-cylinder pressure analysis has been used inmany different ways to characterise knock [1,9].
Usually, the Maximum Amplitude of the Pressure Oscillation(Mapo) is used. The pressure trace can be filtered with a low-passfilter to smooth the raw data; the maximum difference betweenthe filtered and the raw data is defined as the maximum amplitudeof the pressure oscillation [8,16]. Otherwise, high-pass or band-pass filtered data can been used to derive the knock signal directly.In this case, Mapo is set as the maximum value of the filtered data[5,17,18].
Some authors developed different pressure-based methodsconsidering the integral of the modulus of the pressure oscilla-tions (IMPO) [19], the integral of the modulus of the pressureoscillations gradient (IMPOG) [20] or the third derivative of thepressure trace [21]. The energy of the pressure oscillations hasbeen also analysed [1,22,23]. In [24] the natural logarithm ofthe average energy of the filtered data has been used to definea logarithmic knock intensity (LKI); an empirical parameter hasbeen used to define the knock intensity level. Finally, the behav-iour of the heat release rate [25] has been also analysed by usingfiltering methods similar to those of the pressure oscillationapproach.
Fig. 1. Nodal surfaces associated with various res
However, it should be noted that the amplitude of the pressureoscillation at the transducer depends on its location relatively tothe nodal positions of the various vibration modes. Maximumpressure fluctuation should be obtained for each mode when thetransducer is located between the node lines [8]. Moreover, the po-sition of the end gas could change cycle-by-cycle; that will influ-ence the positions of the nodes for the various vibration modesand thus the measurements taken by the transducers [5].
Besides, the knock level is not unique, because it depends onboth the applied filter technique [9] and the number of cycles ana-lysed [8].
Another disadvantage of the methods mentioned above is that athreshold value has to be predetermined to distinguish betweenknocking and non-knocking cycles [9,23,26,27].
The knock threshold should be adapted to each specific engineand tuned considering the operating conditions; finally, its valueshould be based on a sound statistical analysis [23,26].
In the following, a method that dynamically calculates theknock threshold to determine the knock event is proposed. Thepurpose is to avoid setting an a priori threshold.
Starting from a statistical analysis, the method has been appliedconsidering an extensive set of experimental data relative to aspark-ignition engine fuelled with gasoline.
2. Experimental setup
The experimental tests were carried out at the test bed of theEnergy Systems Laboratory of Cassino University. The engine understudy is a FIAT FIRE 1200 16 V (Table 2). This engine features 4valves per cylinder, ‘‘roof’’ type head ceiling, whereas the pistonsare carved with an axial-symmetric bowl. The combustion cham-ber shape induces, during the intake phase, a strong tumble motionwhich contributes to generate a high turbulence level.
The engine was coupled to an eddy current dynamometer(Fig. 2). An AVL Puma 5.3 system has been used for test controland data acquisition. The fuel consumption has been measuredby a fuel balance (inaccuracy less than 0.5%), while a Horiba UEGOsensor has been used to measure the air excess ratio (inaccuracyless than 4%).
A high pressure miniaturized quartz transducer (AVL GM12D,sensitivity 15pC/bar) has been located in the head of the first cyl-inder (Fig. 3).
The piezoelectric sensor is flush with the combustion chamberthus to provide measurement unaffected by oscillations and damp-ing effects. A crankshaft encoder (AVL 364) provides the crankangle reference for the measurements, while an AVL ignition timemodule 3080 is used to measure the spark angle. The position ofthe TDC has been located by an AVL 428 TDC sensor featuring anaccuracy higher than 0.1 c.a. Finally, a multichannel indicating sys-tem AVL Indimeter 620 is used for data acquisition and signal con-ditioning; the data acquisition rack is connected to a PC, anIndiCom software has been used both to control measurementsand for data post-processing.
During the tests, the engine has been controlled by a MagnetiMarelli MF4 ECU. Engine speed and manifold absolute pressurehave been used as primary inputs to control the multipoint fuel
onant modes in a squat cylindrical cavity [9].
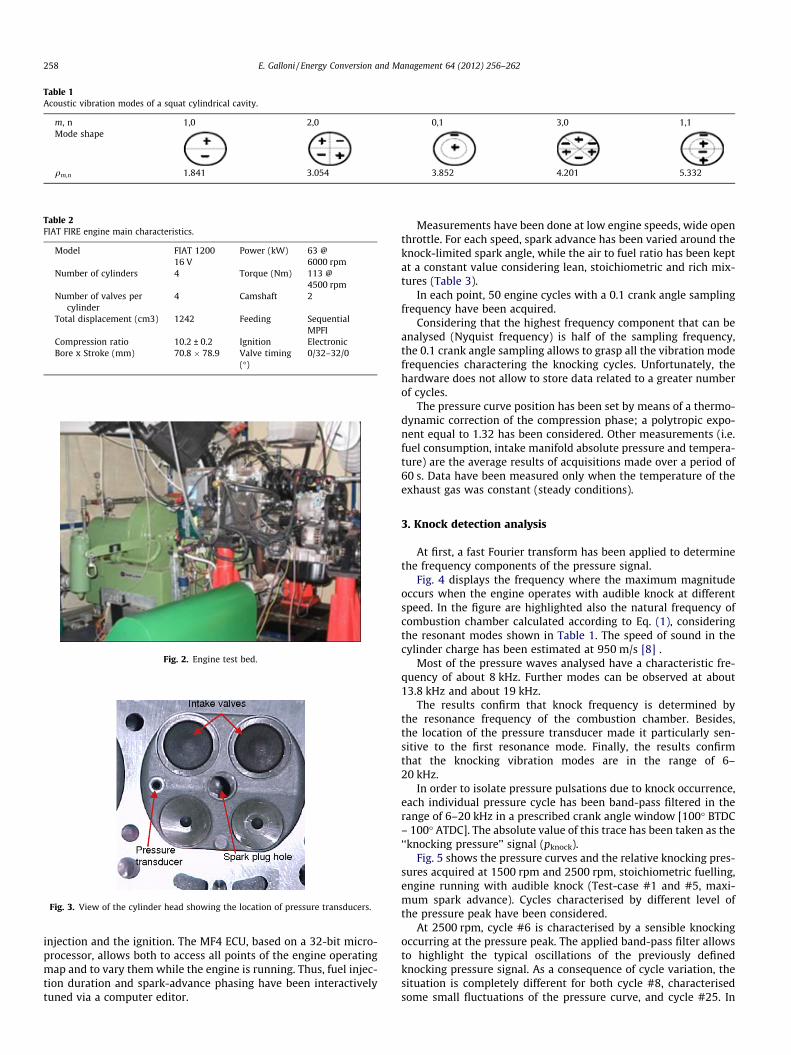
Table 1Acoustic vibration modes of a squat cylindrical cavity.
m, n 1,0 2,0 0,1 3,0 1,1Mode shape
qm,n 1.841 3.054 3.852 4.201 5.332
Table 2FIAT FIRE engine main characteristics.
Model FIAT 120016 V
Power (kW) 63 @6000 rpm
Number of cylinders 4 Torque (Nm) 113 @4500 rpm
Number of valves percylinder
4 Camshaft 2
Total displacement (cm3) 1242 Feeding SequentialMPFI
Compression ratio 10.2 ± 0.2 Ignition ElectronicBore x Stroke (mm) 70.8 � 78.9 Valve timing
(�)0/32–32/0
Fig. 2. Engine test bed.
Fig. 3. View of the cylinder head showing the location of pressure transducers.
258 E. Galloni / Energy Conversion and Management 64 (2012) 256–262
injection and the ignition. The MF4 ECU, based on a 32-bit micro-processor, allows both to access all points of the engine operatingmap and to vary them while the engine is running. Thus, fuel injec-tion duration and spark-advance phasing have been interactivelytuned via a computer editor.
Measurements have been done at low engine speeds, wide openthrottle. For each speed, spark advance has been varied around theknock-limited spark angle, while the air to fuel ratio has been keptat a constant value considering lean, stoichiometric and rich mix-tures (Table 3).
In each point, 50 engine cycles with a 0.1 crank angle samplingfrequency have been acquired.
Considering that the highest frequency component that can beanalysed (Nyquist frequency) is half of the sampling frequency,the 0.1 crank angle sampling allows to grasp all the vibration modefrequencies charactering the knocking cycles. Unfortunately, thehardware does not allow to store data related to a greater numberof cycles.
The pressure curve position has been set by means of a thermo-dynamic correction of the compression phase; a polytropic expo-nent equal to 1.32 has been considered. Other measurements (i.e.fuel consumption, intake manifold absolute pressure and tempera-ture) are the average results of acquisitions made over a period of60 s. Data have been measured only when the temperature of theexhaust gas was constant (steady conditions).
3. Knock detection analysis
At first, a fast Fourier transform has been applied to determinethe frequency components of the pressure signal.
Fig. 4 displays the frequency where the maximum magnitudeoccurs when the engine operates with audible knock at differentspeed. In the figure are highlighted also the natural frequency ofcombustion chamber calculated according to Eq. (1), consideringthe resonant modes shown in Table 1. The speed of sound in thecylinder charge has been estimated at 950 m/s [8] .
Most of the pressure waves analysed have a characteristic fre-quency of about 8 kHz. Further modes can be observed at about13.8 kHz and about 19 kHz.
The results confirm that knock frequency is determined bythe resonance frequency of the combustion chamber. Besides,the location of the pressure transducer made it particularly sen-sitive to the first resonance mode. Finally, the results confirmthat the knocking vibration modes are in the range of 6–20 kHz.
In order to isolate pressure pulsations due to knock occurrence,each individual pressure cycle has been band-pass filtered in therange of 6–20 kHz in a prescribed crank angle window [100� BTDC– 100� ATDC]. The absolute value of this trace has been taken as the‘‘knocking pressure’’ signal (pknock).
Fig. 5 shows the pressure curves and the relative knocking pres-sures acquired at 1500 rpm and 2500 rpm, stoichiometric fuelling,engine running with audible knock (Test-case #1 and #5, maxi-mum spark advance). Cycles characterised by different level ofthe pressure peak have been considered.
At 2500 rpm, cycle #6 is characterised by a sensible knockingoccurring at the pressure peak. The applied band-pass filter allowsto highlight the typical oscillations of the previously definedknocking pressure signal. As a consequence of cycle variation, thesituation is completely different for both cycle #8, characterisedsome small fluctuations of the pressure curve, and cycle #25. In
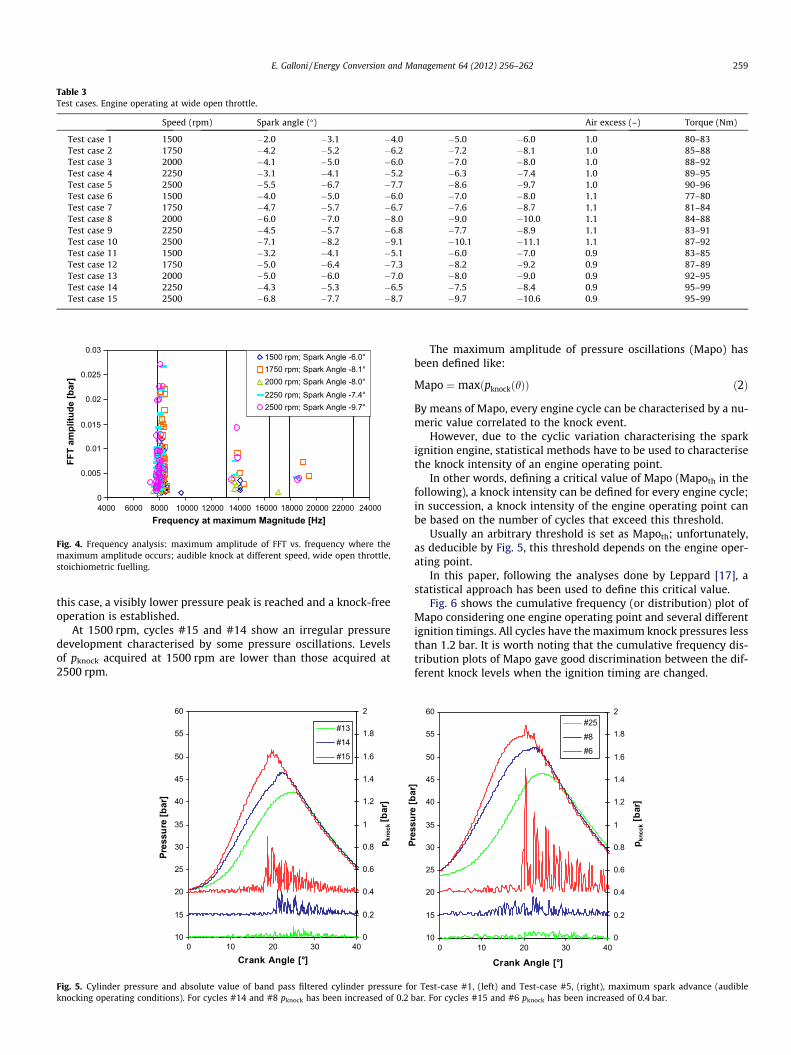
Table 3Test cases. Engine operating at wide open throttle.
Speed (rpm) Spark angle (�) Air excess (–) Torque (Nm)
Test case 1 1500 �2.0 �3.1 �4.0 �5.0 �6.0 1.0 80–83Test case 2 1750 �4.2 �5.2 �6.2 �7.2 �8.1 1.0 85–88Test case 3 2000 �4.1 �5.0 �6.0 �7.0 �8.0 1.0 88–92Test case 4 2250 �3.1 �4.1 �5.2 �6.3 �7.4 1.0 89–95Test case 5 2500 �5.5 �6.7 �7.7 �8.6 �9.7 1.0 90–96Test case 6 1500 �4.0 �5.0 �6.0 �7.0 �8.0 1.1 77–80Test case 7 1750 �4.7 �5.7 �6.7 �7.6 �8.7 1.1 81–84Test case 8 2000 �6.0 �7.0 �8.0 �9.0 �10.0 1.1 84–88Test case 9 2250 �4.5 �5.7 �6.8 �7.7 �8.9 1.1 83–91Test case 10 2500 �7.1 �8.2 �9.1 �10.1 �11.1 1.1 87–92Test case 11 1500 �3.2 �4.1 �5.1 �6.0 �7.0 0.9 83–85Test case 12 1750 �5.0 �6.4 �7.3 �8.2 �9.2 0.9 87–89Test case 13 2000 �5.0 �6.0 �7.0 �8.0 �9.0 0.9 92–95Test case 14 2250 �4.3 �5.3 �6.5 �7.5 �8.4 0.9 95–99Test case 15 2500 �6.8 �7.7 �8.7 �9.7 �10.6 0.9 95–99
0
0.005
0.01
0.015
0.02
0.025
0.03
4000 6000 8000 10000 12000 14000 16000 18000 20000 22000 24000Frequency at maximum Magnitude [Hz]
FFT
ampl
itude
[bar
]
1500 rpm; Spark Angle -6.0°1750 rpm; Spark Angle -8.1°2000 rpm; Spark Angle -8.0°2250 rpm; Spark Angle -7.4°2500 rpm; Spark Angle -9.7°
Fig. 4. Frequency analysis: maximum amplitude of FFT vs. frequency where themaximum amplitude occurs; audible knock at different speed, wide open throttle,stoichiometric fuelling.
E. Galloni / Energy Conversion and Management 64 (2012) 256–262 259
this case, a visibly lower pressure peak is reached and a knock-freeoperation is established.
At 1500 rpm, cycles #15 and #14 show an irregular pressuredevelopment characterised by some pressure oscillations. Levelsof pknock acquired at 1500 rpm are lower than those acquired at2500 rpm.
10
15
20
25
30
35
40
45
50
55
60
Crank Angle [°]
Pres
sure
[bar
]
0
0.2
0.4
0.6
0.8
1
1.2
1.4
1.6
1.8
2
p knoc
k [b
ar]
#13
#14
#15
0 10 20 30 40
Fig. 5. Cylinder pressure and absolute value of band pass filtered cylinder pressure foknocking operating conditions). For cycles #14 and #8 pknock has been increased of 0.2 b
The maximum amplitude of pressure oscillations (Mapo) hasbeen defined like:
Mapo ¼maxðpknockðhÞÞ ð2Þ
By means of Mapo, every engine cycle can be characterised by a nu-meric value correlated to the knock event.
However, due to the cyclic variation characterising the sparkignition engine, statistical methods have to be used to characterisethe knock intensity of an engine operating point.
In other words, defining a critical value of Mapo (Mapoth in thefollowing), a knock intensity can be defined for every engine cycle;in succession, a knock intensity of the engine operating point canbe based on the number of cycles that exceed this threshold.
Usually an arbitrary threshold is set as Mapoth; unfortunately,as deducible by Fig. 5, this threshold depends on the engine oper-ating point.
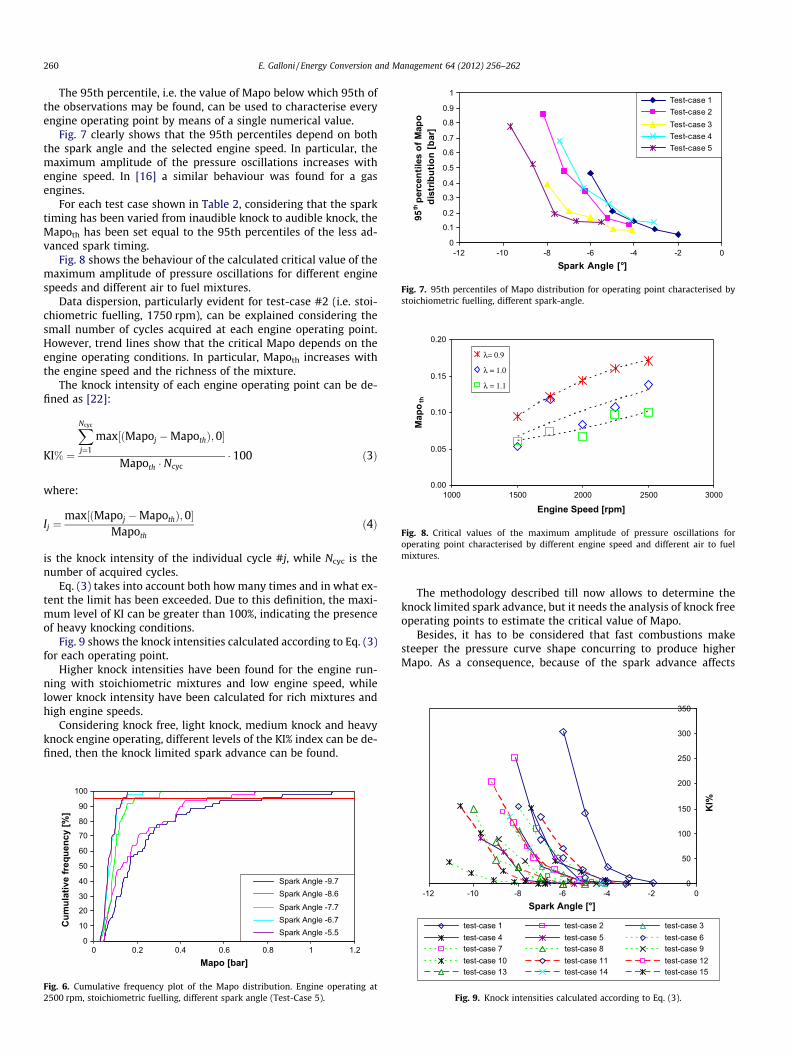
In this paper, following the analyses done by Leppard [17], astatistical approach has been used to define this critical value.
Fig. 6 shows the cumulative frequency (or distribution) plot ofMapo considering one engine operating point and several differentignition timings. All cycles have the maximum knock pressures lessthan 1.2 bar. It is worth noting that the cumulative frequency dis-tribution plots of Mapo gave good discrimination between the dif-ferent knock levels when the ignition timing are changed.
10
15
20
25
30
35
40
45
50
55
60
0 10 20 30 40
Crank Angle [°]
Pres
sure
[bar
]
0
0.2
0.4
0.6
0.8
1
1.2
1.4
1.6
1.8
2
p kncc
k [ba
r]
#25
#8
#6
r Test-case #1, (left) and Test-case #5, (right), maximum spark advance (audiblear. For cycles #15 and #6 pknock has been increased of 0.4 bar.
0
0.1
0.2
0.3
0.4
0.5
0.6
0.7
0.8
0.9
1
-12 -10 -8 -6 -4 -2 0Spark Angle [°]
95th p
erce
ntile
s of
Map
o di
strib
utio
n [b
ar]
Test-case 1Test-case 2Test-case 3Test-case 4Test-case 5
Fig. 7. 95th percentiles of Mapo distribution for operating point characterised bystoichiometric fuelling, different spark-angle.
0.00
0.05
0.10
0.15
0.20
1000 1500 2000 2500 3000
Engine Speed [rpm]
Map
oth
λ= 0.9
λ = 1.0
λ = 1.1
Fig. 8. Critical values of the maximum amplitude of pressure oscillations foroperating point characterised by different engine speed and different air to fuelmixtures.
250
300
350
260 E. Galloni / Energy Conversion and Management 64 (2012) 256–262
The 95th percentile, i.e. the value of Mapo below which 95th ofthe observations may be found, can be used to characterise everyengine operating point by means of a single numerical value.
Fig. 7 clearly shows that the 95th percentiles depend on boththe spark angle and the selected engine speed. In particular, themaximum amplitude of the pressure oscillations increases withengine speed. In [16] a similar behaviour was found for a gasengines.
For each test case shown in Table 2, considering that the sparktiming has been varied from inaudible knock to audible knock, theMapoth has been set equal to the 95th percentiles of the less ad-vanced spark timing.
Fig. 8 shows the behaviour of the calculated critical value of themaximum amplitude of pressure oscillations for different enginespeeds and different air to fuel mixtures.
Data dispersion, particularly evident for test-case #2 (i.e. stoi-chiometric fuelling, 1750 rpm), can be explained considering thesmall number of cycles acquired at each engine operating point.However, trend lines show that the critical Mapo depends on theengine operating conditions. In particular, Mapoth increases withthe engine speed and the richness of the mixture.
The knock intensity of each engine operating point can be de-fined as [22]:
KI% ¼
XNcyc
j¼1
max½ðMapoj �MapothÞ;0�
Mapoth � Ncyc� 100 ð3Þ
where:
Ij ¼max½ðMapoj �MapothÞ; 0�
Mapothð4Þ
is the knock intensity of the individual cycle #j, while Ncyc is thenumber of acquired cycles.
Eq. (3) takes into account both how many times and in what ex-tent the limit has been exceeded. Due to this definition, the maxi-mum level of KI can be greater than 100%, indicating the presenceof heavy knocking conditions.
Fig. 9 shows the knock intensities calculated according to Eq. (3)for each operating point.
Higher knock intensities have been found for the engine run-ning with stoichiometric mixtures and low engine speed, whilelower knock intensity have been calculated for rich mixtures andhigh engine speeds.
Considering knock free, light knock, medium knock and heavyknock engine operating, different levels of the KI% index can be de-fined, then the knock limited spark advance can be found.
0
10
20
30
40
50
60
70
80
90
100
0 0.2 0.4 0.6 0.8 1 1.2Mapo [bar]
Cum
ulat
ive
freq
uenc
y [%
]
Spark Angle -9.7Spark Angle -8.6Spark Angle -7.7Spark Angle -6.7Spark Angle -5.5
Fig. 6. Cumulative frequency plot of the Mapo distribution. Engine operating at2500 rpm, stoichiometric fuelling, different spark angle (Test-Case 5).
The methodology described till now allows to determine theknock limited spark advance, but it needs the analysis of knock freeoperating points to estimate the critical value of Mapo.
Besides, it has to be considered that fast combustions makesteeper the pressure curve shape concurring to produce higherMapo. As a consequence, because of the spark advance affects
0
50
100
150
200
-12 -10 -8 -6 -4 -2 0Spark Angle [°]
KI%
test-case 1 test-case 2 test-case 3test-case 4 test-case 5 test-case 6test-case 7 test-case 8 test-case 9test-case 10 test-case 11 test-case 12test-case 13 test-case 14 test-case 15
Fig. 9. Knock intensities calculated according to Eq. (3).
10
20
30
40
50
123456789
10 Kno
ck O
nset
[ °]
Kno
ck In
tens
ity [
-]
I2(k=1.5)
I2(k=2.0)I2(k=2.5)
I
0
11
E. Galloni / Energy Conversion and Management 64 (2012) 256–262 261
the burning rate, the critical value of Mapo should depend on thespark timing also.
In the following, a method that overcome these difficulties isproposed: the goal is resolving the knock intensity of an individualcycle within the same cycle.
Fig. 5 highlights that the knock onset is pointed out by a suddengrowth of the pressure oscillation.
Then, a comparison between pressure oscillations characteris-ing the first phase of the combustion and those characterisingthe pressure peak can be done to evaluate the presence of knock.
Considering a certain cycle, a specific threshold value is calcu-lated like:
0Cycle Number
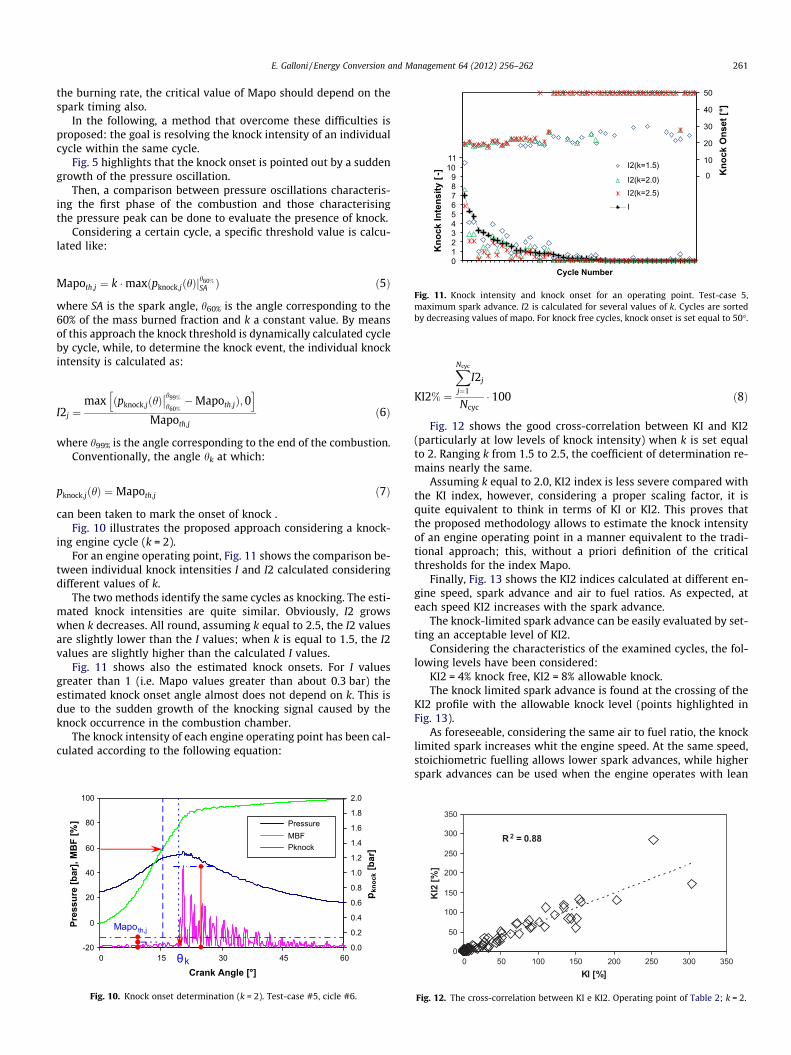
Fig. 11. Knock intensity and knock onset for an operating point. Test-case 5,maximum spark advance. I2 is calculated for several values of k. Cycles are sortedby decreasing values of mapo. For knock free cycles, knock onset is set equal to 50�.
Mapoth;j ¼ k �maxðpknock;jðhÞjh60%
SA Þ ð5Þ
where SA is the spark angle, h60% is the angle corresponding to the60% of the mass burned fraction and k a constant value. By meansof this approach the knock threshold is dynamically calculated cycleby cycle, while, to determine the knock event, the individual knockintensity is calculated as:
I2j ¼max ðpknock;jðhÞ
��h99%
h60%�Mapoth;jÞ;0
h i
Mapoth;jð6Þ
where h99% is the angle corresponding to the end of the combustion.Conventionally, the angle hk at which:
pknock;jðhÞ ¼Mapoth;j ð7Þ
can been taken to mark the onset of knock .Fig. 10 illustrates the proposed approach considering a knock-
ing engine cycle (k = 2).For an engine operating point, Fig. 11 shows the comparison be-
tween individual knock intensities I and I2 calculated consideringdifferent values of k.
The two methods identify the same cycles as knocking. The esti-mated knock intensities are quite similar. Obviously, I2 growswhen k decreases. All round, assuming k equal to 2.5, the I2 valuesare slightly lower than the I values; when k is equal to 1.5, the I2values are slightly higher than the calculated I values.
Fig. 11 shows also the estimated knock onsets. For I valuesgreater than 1 (i.e. Mapo values greater than about 0.3 bar) theestimated knock onset angle almost does not depend on k. This isdue to the sudden growth of the knocking signal caused by theknock occurrence in the combustion chamber.
The knock intensity of each engine operating point has been cal-culated according to the following equation:
-20
0
20
40
60
80
100
0 15 30 45 60
Crank Angle [°]
Pres
sure
[bar
], M
BF
[%]
0.0
0.2
0.4
0.6
0.8
1.0
1.2
1.4
1.6
1.8
2.0
p kno
ck [b
ar]
PressureMBFPknock
θk
Mapoth,j
Fig. 10. Knock onset determination (k = 2). Test-case #5, cicle #6.
KI2% ¼
XNcyc
j¼1
I2j
Ncyc� 100 ð8Þ
Fig. 12 shows the good cross-correlation between KI and KI2(particularly at low levels of knock intensity) when k is set equalto 2. Ranging k from 1.5 to 2.5, the coefficient of determination re-mains nearly the same.
Assuming k equal to 2.0, KI2 index is less severe compared withthe KI index, however, considering a proper scaling factor, it isquite equivalent to think in terms of KI or KI2. This proves thatthe proposed methodology allows to estimate the knock intensityof an engine operating point in a manner equivalent to the tradi-tional approach; this, without a priori definition of the criticalthresholds for the index Mapo.
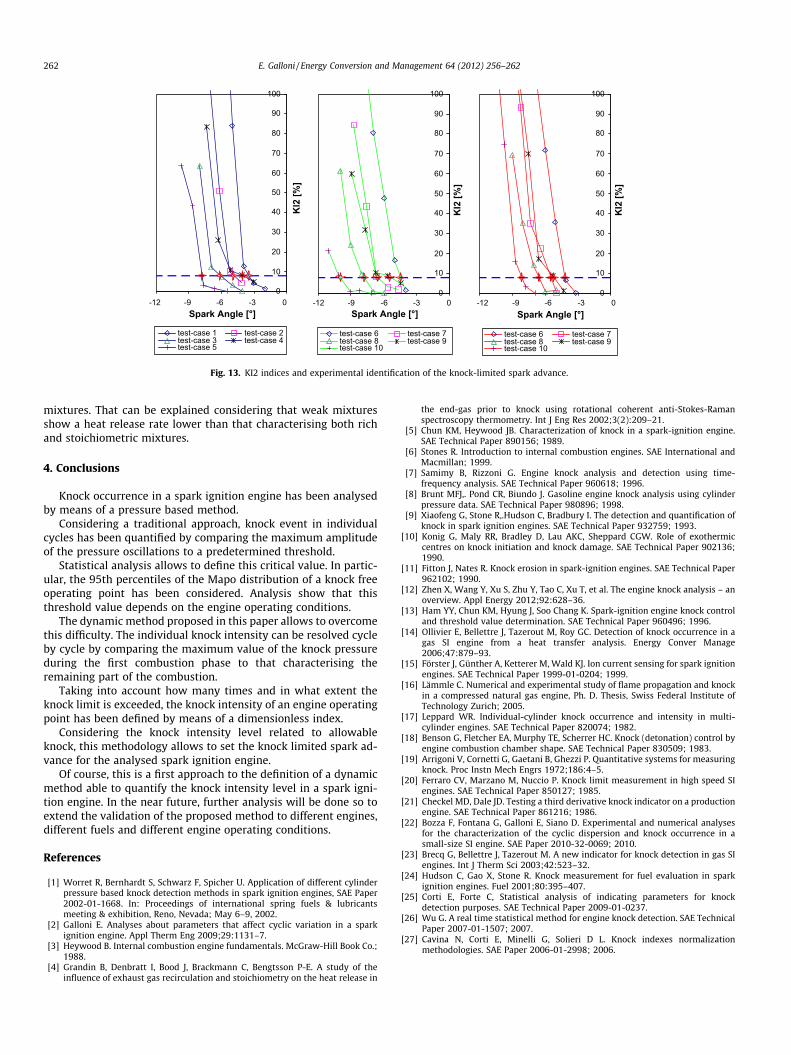
Finally, Fig. 13 shows the KI2 indices calculated at different en-gine speed, spark advance and air to fuel ratios. As expected, ateach speed KI2 increases with the spark advance.
The knock-limited spark advance can be easily evaluated by set-ting an acceptable level of KI2.
Considering the characteristics of the examined cycles, the fol-lowing levels have been considered:
KI2 = 4% knock free, KI2 = 8% allowable knock.The knock limited spark advance is found at the crossing of the
KI2 profile with the allowable knock level (points highlighted inFig. 13).
As foreseeable, considering the same air to fuel ratio, the knocklimited spark increases whit the engine speed. At the same speed,stoichiometric fuelling allows lower spark advances, while higherspark advances can be used when the engine operates with lean
R 2 = 0.88
0
50
100
150
200
250
300
350
0 50 100 150 200 250 300 350KI [%]
KI2
[%]
Fig. 12. The cross-correlation between KI e KI2. Operating point of Table 2; k = 2.
0
10
20
30
40
50
60
70
80
90
100
KI2
[%]
0
10
20
30
40
50
60
70
80
90
100
KI2
[%]
0
10
20
30
40
50
60
70
80
90
100
KI2
[%]
-12 -9 -6 -3 0Spark Angle [°]
test-case 1 test-case 2test-case 3 test-case 4test-case 5
-12 -9 -6 -3 0Spark Angle [°]
test-case 6 test-case 7test-case 8 test-case 9test-case 10
-12 -9 -6 -3 0Spark Angle [°]
test-case 6 test-case 7test-case 8 test-case 9test-case 10
Fig. 13. KI2 indices and experimental identification of the knock-limited spark advance.
262 E. Galloni / Energy Conversion and Management 64 (2012) 256–262
mixtures. That can be explained considering that weak mixturesshow a heat release rate lower than that characterising both richand stoichiometric mixtures.
4. Conclusions
Knock occurrence in a spark ignition engine has been analysedby means of a pressure based method.
Considering a traditional approach, knock event in individualcycles has been quantified by comparing the maximum amplitudeof the pressure oscillations to a predetermined threshold.
Statistical analysis allows to define this critical value. In partic-ular, the 95th percentiles of the Mapo distribution of a knock freeoperating point has been considered. Analysis show that thisthreshold value depends on the engine operating conditions.
The dynamic method proposed in this paper allows to overcomethis difficulty. The individual knock intensity can be resolved cycleby cycle by comparing the maximum value of the knock pressureduring the first combustion phase to that characterising theremaining part of the combustion.
Taking into account how many times and in what extent theknock limit is exceeded, the knock intensity of an engine operatingpoint has been defined by means of a dimensionless index.
Considering the knock intensity level related to allowableknock, this methodology allows to set the knock limited spark ad-vance for the analysed spark ignition engine.
Of course, this is a first approach to the definition of a dynamicmethod able to quantify the knock intensity level in a spark igni-tion engine. In the near future, further analysis will be done so toextend the validation of the proposed method to different engines,different fuels and different engine operating conditions.
References
[1] Worret R, Bernhardt S, Schwarz F, Spicher U. Application of different cylinderpressure based knock detection methods in spark ignition engines, SAE Paper2002-01-1668. In: Proceedings of international spring fuels & lubricantsmeeting & exhibition, Reno, Nevada; May 6–9, 2002.
[2] Galloni E. Analyses about parameters that affect cyclic variation in a sparkignition engine. Appl Therm Eng 2009;29:1131–7.
[3] Heywood B. Internal combustion engine fundamentals. McGraw-Hill Book Co.;1988.
[4] Grandin B, Denbratt I, Bood J, Brackmann C, Bengtsson P-E. A study of theinfluence of exhaust gas recirculation and stoichiometry on the heat release in
the end-gas prior to knock using rotational coherent anti-Stokes-Ramanspectroscopy thermometry. Int J Eng Res 2002;3(2):209–21.
[5] Chun KM, Heywood JB. Characterization of knock in a spark-ignition engine.SAE Technical Paper 890156; 1989.
[6] Stones R. Introduction to internal combustion engines. SAE International andMacmillan; 1999.
[7] Samimy B, Rizzoni G. Engine knock analysis and detection using time-frequency analysis. SAE Technical Paper 960618; 1996.
[8] Brunt MFJ,. Pond CR, Biundo J. Gasoline engine knock analysis using cylinderpressure data. SAE Technical Paper 980896; 1998.
[9] Xiaofeng G, Stone R,.Hudson C, Bradbury I. The detection and quantification ofknock in spark ignition engines. SAE Technical Paper 932759; 1993.
[10] Konig G, Maly RR, Bradley D, Lau AKC, Sheppard CGW. Role of exothermiccentres on knock initiation and knock damage. SAE Technical Paper 902136;1990.
[11] Fitton J, Nates R. Knock erosion in spark-ignition engines. SAE Technical Paper962102; 1990.
[12] Zhen X, Wang Y, Xu S, Zhu Y, Tao C, Xu T, et al. The engine knock analysis – anoverview. Appl Energy 2012;92:628–36.
[13] Ham YY, Chun KM, Hyung J, Soo Chang K. Spark-ignition engine knock controland threshold value determination. SAE Technical Paper 960496; 1996.
[14] Ollivier E, Bellettre J, Tazerout M, Roy GC. Detection of knock occurrence in agas SI engine from a heat transfer analysis. Energy Conver Manage2006;47:879–93.
[15] Förster J, Günther A, Ketterer M, Wald KJ. Ion current sensing for spark ignitionengines. SAE Technical Paper 1999-01-0204; 1999.
[16] Lämmle C. Numerical and experimental study of flame propagation and knockin a compressed natural gas engine, Ph. D. Thesis, Swiss Federal Institute ofTechnology Zurich; 2005.
[17] Leppard WR. Individual-cylinder knock occurrence and intensity in multi-cylinder engines. SAE Technical Paper 820074; 1982.
[18] Benson G, Fletcher EA, Murphy TE, Scherrer HC. Knock (detonation) control byengine combustion chamber shape. SAE Technical Paper 830509; 1983.
[19] Arrigoni V, Cornetti G, Gaetani B, Ghezzi P. Quantitative systems for measuringknock. Proc Instn Mech Engrs 1972;186:4–5.
[20] Ferraro CV, Marzano M, Nuccio P. Knock limit measurement in high speed SIengines. SAE Technical Paper 850127; 1985.
[21] Checkel MD, Dale JD. Testing a third derivative knock indicator on a productionengine. SAE Technical Paper 861216; 1986.
[22] Bozza F, Fontana G, Galloni E, Siano D. Experimental and numerical analysesfor the characterization of the cyclic dispersion and knock occurrence in asmall-size SI engine. SAE Paper 2010-32-0069; 2010.
[23] Brecq G, Bellettre J, Tazerout M. A new indicator for knock detection in gas SIengines. Int J Therm Sci 2003;42:523–32.
[24] Hudson C, Gao X, Stone R. Knock measurement for fuel evaluation in sparkignition engines. Fuel 2001;80:395–407.
[25] Corti E, Forte C, Statistical analysis of indicating parameters for knockdetection purposes. SAE Technical Paper 2009-01-0237.
[26] Wu G. A real time statistical method for engine knock detection. SAE TechnicalPaper 2007-01-1507; 2007.
[27] Cavina N, Corti E, Minelli G, Solieri D L. Knock indexes normalizationmethodologies. SAE Paper 2006-01-2998; 2006.