Embed Size (px)
Citation preview

Dynamic-CBT – Router Queue Management forImproved Multimedia Performance on the Internet
by
Jae Won Chung
A Thesis
Submitted to the Faculty
of the
WORCESTER POLYTECHNIC INSTITUTE
In partial fulfillment of the requirements for the
Degree of Master of Science
in
Computer Science
by
May 2000
APPROVED:
Professor Mark Claypool, Major Advisor
Professor Robert Kinicki, Thesis Reader
Professor Micha Hofri, Head of Department

i
Abstract
The explosive increase in Internet traffic has placed a growing emphasis on congestion
control and fairness in Internet routers. Approaches to the problem of congestion, such as
active queue management schemes like Random Early Detection (RED) that are
successful with TCP flows, use congestion avoidance techniques. Approaches to the
problem of fairness, such as Fair Random Early Drop (FRED), punish misbehaved, non-
TCP flows. Unfortunately, these punishment mechanisms result in a significant
performance drop for multimedia flows that are well behaved. We propose a new active
queue management mechanism as an extension to RED called Dynamic Class-Based
Threshold (D-CBT) to improve multimedia performance on the Internet. Also, as an
effort to further improve multimedia performance especially on jitter, we propose a
lightweight packet scheduling called Cut-In Packet Scheduling (ChIPS) as an alternative
to FIFO packet scheduling. The performance of our proposed mechanisms is measured,
analyzed and compared with other mechanisms (RED and CBT) in terms of throughput,
fairness and multimedia jitter through simulation using NS. The study concludes that D-
CBT improves fairness among different classes of flows and ChIPS improves multimedia
jitter without degrading fairness. The contributions we make are the design,
implementation and evaluation of D-CBT and ChIPS, the first study of multimedia jitter
due to network queue management policy, and a simulator implementation of CBT, D-
CBT and ChIPS.
ii
Table of Contents
1. Introduction 1
2. Related Work 9
2.1 Flow Control 9
2.2 Multimedia Performance 11
3. Approach 14
3.1 Flow-Controlled Multimedia 15
3.1.1 Design and Implementation 15
3.1.2 Simulation Test and Analysis 23
3.2 CBT Implementation and Validation 32
3.3 Dynamic-CBT and Cut-In Packet Scheduling 41
3.3.1 Dynamic-CBT (D-CBT) 41
3.3.2 Cut-In Packet Scheduling (ChIPS) 46
4. Results and Analysis 50
4.1 Performance Measurement Metrics 50
4.2 Simulation Setup 55
4.3 Throughput and Fairness 58
4.3.1 Class’ Average Per-Flow Throughput 58
4.3.2 Jain’s Fairness Measurement 66
4.3.3 Congested Link Utilization 68
4.4 Analysis of ChIPS 70
5. Future Work 73
6. Conclusion 76
7. References 80

iii
Acknowledgements
I would like to express my gratitude to my academic and thesis advisor Professor Mark
Claypool for his advise, support and help not only on this thesis but also on all academic
and personal matters. His kindness, trust and support gave me another chance to further
expose myself to the excitement of computer science and multimedia networking.
Also, I would like to specially thank to my reader Professor Robert Kinicki, who was
previously my Major Qualifying Project (MQP) advisor. He kindly taught me how to
research in my undergraduate years, introduced me to the joy of computer networks.
I would like to specially thank to my parents who love me and encourage me all the time,
and supported me to pursue my graduate study. Especially, my father’s love for
knowledge and study, and my mother’s pray was the driving force behind my current
achievement. Also, I would like to thank with love to Youjin Ji who loves and cares
about me so much.
This thesis is dedicated to my dear God who gave me insights, the power and ability to
think, and always lead and guide me with his own arms.

1
1. Introduction
The Internet has moved from a data communication network for a few privileged
professions to an essential part of public life similar to the public telephone networks,
while assuming the role of the underlying communication network for multimedia
applications such as Internet phone, video conferencing and video on demand (VOD).
As a consequence, the volume of traffic and the number of simultaneous active flows that
an Internet router handles has increased dramatically, placing new emphasis on
congestion control and traffic fairness. Complicating traditional congestion control is the
presence of multimedia traffic that has strict timing constraints, specifically delay
constraints and variance in delay, or jitter constraints [lc95, GP97, AP97]. This paper
presents a router queue management mechanism that addresses the problem of congestion
and fairness, and improves multimedia performance on the Internet. Figure 1.1 shows
some of the current and the proposed router queue mechanisms.
<Figure 1.1> Router Queue Mechanisms (shaded are proposed)

2
There have been two major approaches suggested to handle congestion by means other
than traditional drop-tail FIFO queuing. The first approach uses packet or link
scheduling on multiple logical or physical queues to explicitly reserve and allocate output
bandwidth to each class of traffic, where a class can be a single flow or a group of similar
flows. This is the basic idea of various Fair Queuing (FQ) disciplines [DH90] and the
Class-Based Queuing (CBQ) algorithm [FJ95, Fl]. The main advantage of this approach
is in its ability to assign network resources to classes of flows in a predefined manner.
Moreover, when coupled with admission control, the mechanism not only suggests a
solution to the problem of congestion but also offers potential performance guarantees for
the multimedia traffic class. However, the explicit resource reservation approach would
change the “best effort” nature of the current Internet, and the fairness definition of the
traditional Internet may no longer be preserved. Adopting this mechanism would require
a change in the network management and billing practices. Also, the algorithmic
complexity and state requirements of scheduling make its deployment difficult [PJS99].
The second approach, called Active Queue Management, uses advanced packet queuing
disciplines other than traditional FIFO drop-tail queuing on an outbound queue of a
router to actively handle (or avoid) congestion with the help of cooperative traffic
sources. This approach is based on the observation that packets from a connection
usually take the same path, and depend on the ability of the traffic source to respond to
the congestion in the network. In the Internet, TCP recognizes packet loss as an indicator
of network congestion, and its back-off algorithm reduces transmission load when

3
network congestion is detected [Fl94]. Recently, active queue management has become
the subject of interest within the Internet research committee [PJS99].
The most well-known and basic active queue management mechanism is Random Early
Detection (RED), which prevents congestion through monitoring outbound buffers to
detect impending congestion, and randomly chooses and notifies senders of network
congestion so that they can reduce their transmission rate [FJ93, FF97]. More precisely,
RED uses a weighted-average queue size and minimum-maximum thresholds to detect
impending congestion, and randomly drops incoming packets according to the calculated
rate based on the average queue size during impending congestion. While fairly handling
congestion for only TCP flows, RED reveals the critical problem that non-TCP flows that
are unresponsive or have greedier flow-control mechanisms than TCP take more share of
the output bandwidth than TCP flows [LM97, PJS99]. In the worst case, it is possible for
non-TCP flows, especially for unresponsive ones, to monopolize the output bandwidth
while TCP connections are forced to transmit at their minimum rates. This unfairness
occurs because non-TCP flows reduce transmission load relatively less than TCP flows or
do not reduce at all, and the same drop rate is applied to every flow. This problem may
become critical as the number of multimedia flows increases. Delay sensitive Internet
multimedia applications use UDP rather than TCP because they require in-time packet
delivery and can tolerate loss, rather than the guaranteed packet delivery with potentially
unbounded end-to-end delay that TCP produces. Also, they prefer periodic packet
transmission characteristics of UDP rather than bursty packet transmission characteristics
of TCP that can introduce higher receiver side jitter. The multimedia UDP applications

4
either do not use any flow-control mechanism or use their own application-level flow
control mechanisms that are rate-based rather than window based and tend to be greedier
than that of TCP taking the multimedia Quality of Service (QoS) requirements into
account.
In addressing the problem of fairness, there have been a strong argument that
unresponsive or misbehaving flows should be penalized to protect well-behaved TCP
flows1. As a result, various extensions to RED, such as Fair Random Early Drop
(FRED), have been suggested [LM97]. FRED adds per-active-flow accounting to RED,
isolating each flow from the effect of others. It enforces fairness in terms of output
buffer space by strictly penalizing unresponsive or misbehaving flows to have an equal
fair share while assuring packets from flows that do not consume their fair share are
transmitted without loss. FRED serves its purpose not only in protecting TCP flows from
unresponsive and misbehaving flows but also in protecting fragile TCP connections from
robust TCP connections. However, the per-active-flow accounting is an expensive
process that might slow down the performance of routers as the number of flow increase.
FRED also has a potential problem that its TCP favored per-flow punishment could
unnecessarily discourages flow-controlled interactive multimedia flows. Under FRED,
incoming packets for a well-behaved TCP flow consuming more than their fair share are
randomly dropped applying RED’s drop rate. However, once a flow, although flow
controlled, is marked as a non-TCP friendly flow, it is regarded as an unresponsive flow
1 A well-behaved flow is defined as a flow that behaves like a TCP flow with a correct congestionavoidance implementation. A flow-controlled flow that acts different (or greedier) than well-behaved flowis a misbehaving flow.

5
and all incoming packets of the flow are dropped when it is using more than its fair share.
As a result, a flow-controlled multimedia UDP flow, which may have a higher chance to
be marked, will experience more packet loss than a TCP flow and be forced to have less
than its fair share of bandwidth.
Recently, Jeffay et al., [PJS99] proposes a new active queue management scheme called
Class-Based Threshold (CBT), which releases UDP flows from strict per-flow
punishment while protecting TCP flows by adding a simple class-based static bandwidth
reservation mechanism to RED. In fact, CBT implements an explicit resource reservation
feature of CBQ on a single queue that is fully or partially managed by RED without using
packet scheduling. Instead, it uses class thresholds that determine ratios between the
number of queue elements that each class may use during congestion. CBT defines three
classes: tagged (multimedia) UDP2, untagged (other) UDP and TCP. For each of the two
UDP classes, CBT assigns a pre-determined static threshold and maintains a weighted-
average number of enqueued packets that belong to the class. When a UDP packet
arrives, the weighted-average for the appropriate class is updated and compared against
the threshold for the class to decide whether to drop the packet before optionally applying
the RED test. For the TCP class, CBT does not apply a threshold test but directly passes
incoming packets to the RED test unit. Thus, by applying a threshold test to each UDP
class, CBT protects TCP flows from unresponsive or misbehaving UDP flows, and also
protects multimedia UDP flows from the effect of other UDP flows. CBT avoids
congestion as well as RED, has less overhead and improves multimedia throughput and

6
packet drop rates compared to FRED. However, as in the case of CBQ, the static
resource reservation mechanism of CBT could result in poor performance for rapidly
changing traffic mixes and is arguably unfair since it changes the best effort nature of the
Internet.
To eliminate the limitations due to the explicit resource reservation of CBT while
preserving its good features from class-based isolation, we propose Dynamic-CBT (D-
CBT). D-CBT fairly allocates the bandwidth of a congested link to the traffic classes by
dynamically assigning the UDP thresholds such that the sum of the fair share of flows in
each class is assigned to the class at any given time. As in CBT, D-CBT categorizes
flows into three classes. However, unlike the class categorization of CBT in which flow-
controlled multimedia flows are not distinguished from unresponsive multimedia flows,
we propose that only flow-controlled multimedia UDP flows are tagged leaving the
unresponsive UDP flows untagged. We categorize UDP traffic this way, since
multimedia applications are the primary sources of UDP traffic and generate high
bandwidth flows. By differentiating flow-controlled multimedia flows from unresponsive
flows, D-CBT not only protects flow-controlled multimedia flows from unresponsive
multimedia flows, but also encourages multimedia applications to use congestion
avoidance mechanisms.
In addition, as a means to improve multimedia jitter, we propose a lightweight
multimedia-favored packet scheduling mechanism, Cut-In Packet Scheduling (ChIPS), as
2 Tagged (multimedia) UDP flows can be distinguished from other (untagged) UDP flows by setting an

7
an alternative to FIFO packet scheduling under D-CBT and possibly under other RED
like active queue management mechanisms. ChIPS monitors average enqueue rates of
tagged and the other flows, and is invoked when the tagged flows are using a relatively
smaller fraction of bandwidth than the TCP flows. On transient congestion in which the
queue length is greater than the average queue length, ChIPS awards well-behaved (flow-
controlled) multimedia flows by allowing their packets to “cut” in the line of queue
where the average queue length points. We believe that the overhead of ChIPS will be
small while significantly improving multimedia jitter when a relatively small number of
multimedia flows are competing for the bandwidth with a large number of TCP flows.
To evaluate the proposed mechanisms, we use an event driven network simulator called
NS (version 2) that simulates variety of IP networks [ns2]. NS implements most of
common IP network components including RED. However, it does not have a traffic
generator that simulates a flow-controlled multimedia application, which is essential to
evaluate the proposed mechanisms. Therefore, we design and implement a general-
purpose multimedia traffic generator and a trace-driven MPEG-1 video traffic generator
that utilizes a rate-based flow control mechanism called media scaling, in which a
transmission rate is determined by a media encoding and transmission policy pair that the
source uses [DHH+93]. The multimedia applications, which show greedier bandwidth
utilization behavior and better jitter performance than TCP under RED queue
management, are used for the evaluation of D-CBT and ChIPS.
unused bit of the Type of Service field in the IP header (Version 4).

8
We also implemented CBT in NS, and ran a validation test that simulates an experiment
on Jeffay’s paper [PJS99]. By comparing our simulated result with Jeffay’s experimental
results, we not only validate that our CBT implementation is correct, but also confirm
that the simulator implementations of RED and TCP behave similar to the ones used for
the experiment. Then, we built D-CBT by extending the CBT implementation, add
ChIPS into D-CBT, and compare the performance of D-CBT and D-CBT with ChIPS
with that of RED and CBT. In the evaluation, our primary focus is on the effect of
heterogeneously flow-controlled traffic on the behavior of the queue management
mechanisms especially on fairness, and the effect of queue management on the
performance of well-behaved (flow-controlled) multimedia flows.
The next chapter presents related work, and Chapter 3 presents our approaches in detail
including the design and performance of the flow-controlled multimedia traffic
generators, the validation of our CBT implementation on NS, and the details of D-CBT
and ChIPS. Chapter 4 evaluates and analyzes D-CBT and ChIPS, Chapter 5 discusses
future work, and Chapter 6 concludes the thesis.

9
2. Related Work
This chapter is intended to serve as a roadmap to work that is related to this thesis: flow
control and perceptual quality of multimedia. We omitted router queue management
mechanisms from this chapter, since they are introduced in Chapter 1 and also are
discussed in detail throughout this thesis.
2.1 Flow Control
Van Jacobson and Michael J. Karels discussed the fundamentals of the TCP (Tahoe) flow
control mechanism [JK88]. This paper presented the slow-start and congestion avoidance
mechanisms of TCP, designed after the linear system theory that says that an unstable
system can be stabilized by adding some exponential damping to its primary excitation.
This paper also discussed the TCP’s Round Trip Time (RTT) estimation method. For
information on additional TCP (Reno) congestion control mechanisms, refer to RFC2001
[rfc2001].
Sally Floyd and Kevin Fall discussed potential unfairness and congestion collapse due to
non-TCP friendly flows, defined as any flow with a long-term arrival rate that exceeds
that of any conformant TCP in same circumstance [FF98], and insisted that these flows
should be regulated. This paper also introduced methods to detect non-TCP friendly and
unresponsive flows.
10
Hari Balakrishnan, Hariharan S. Rahul and Srinivsan Seshan introduced an end-system
architecture, in which a Congestion Manager (CM) ensures proper congestion behavior
and allows applications to easily adapt to network congestion [BRS99]. The main
objective behind this work is to prevent users from misusing the network without proper
congestion control mechanism by letting CM take care of flow control, while giving
flexible options for the streams with different reliability requirements by separating
congestion control from the function of loss recovery. Internally, CM used a window-
based flow control algorithm, a scheduler to regulate transmissions and a lightweight
protocol to elicit feedback from receivers. Their result showed that TCP connections
using CM could effectively share bandwidth and obtain consistent performance, without
adversely affecting other network flows. It also showed that CM enables audio
applications to adapt to congestion conditions without having to perform congestion
control or bandwidth probing on their own.
Luca Delgrossi et al., presented a media scaling mechanism that is proposed to make the
Heidelberg Transport System (HeiTS), a multimedia communication system for real-time
delivery of digital audio and video, work with networks with no reservation mechanisms
such as Ethernet [DHH+93]. Media scaling, which refers to a mechanism in which media
encoding is modified according to the bandwidth available in the underlying networks, is
essentially a rate-based flow control mechanism. However, in their study, media scaling
was not used as a congestion control mechanism. Their paper discussed transparent and
non-transparent scaling methods, and continuous and discrete scaling method that were
used in the HeiTS system.

11
We used the above references to study the behavior of TCP and also to design a rate-
based multimedia flow control mechanism, which uses media scaling as a mean to avoid
congestion in response to network congestion. The simulator that we used to evaluate
our proposed queue mechanisms does not support any flow-controlled multimedia traffic
generators. Therefore, we built a general purpose and a trace-driven MPEG-1 traffic
generators, of which the flow-control is modeled after fast recovery and congestion
avoidance mechanisms of TCP (Reno), although it is rate-based rather than window-
based. The design and implementation of our multimedia flow-control mechanism is
presented in detail in Chapter 3.1.
2.2 Multimedia Performance
Jonathan Walpole et al., introduced a media scaling mechanism that is based on an
MPEG-1 video stream, which dynamically adapts to changes in available bandwidth
[WKC+97]. The paper described in detail an MPEG-1 frame selection method, which
carefully considered the frame dependencies, and discussed a resolution-changing
method. However, their media scaling approach was more concerned about the end-
system performance rather than its effect on the network. The purpose of their media
scaling was described as to avoid waste of resources and improve perceptual quality by
monitoring the end-to-end performance and selectively dropping packets at the sender,
taking frame dependencies into account. It is reported that the method was effective in
running streams over Internet connections of up to 28 hops and across networks with
several orders of magnitude variation in available bandwidth. We used the MPEG-1

12
frame section policies described in their paper as the transmission policies for our
MPEG-1 traffic generator, as described in Chapter 3.1.
Mark Handley measured Mbone multicast performance in 1997 [Ha97]. He examined
routing tables to monitor route stability, and observed traffic as it arrived at sites (to
which they had access) to look at individual packet losses. The research showed that 50%
of receivers had a mean loss rate of about 10% or lower, while 80% reported a loss rate
less than 20%. Around 80% of receivers have some interval during the day when no loss
was observed. On the other hand, 80 % of sites reported some interval during the way
when the loss rate was greater than 20%. About 30% of sites reported at least one
interval where the loss rate was above 95% at some time during the day. The research
also shows that although not as dominant as single loss, packet losses tend to occur in a
bursty manner.
Vicky Hardman, Martina Angela Sasse and Isidor Kouvelas presented an audio
piggybacking method, in which a low quality version of an audio frame is piggybacked
onto the next frame so that it can be played when its high quality version of frame is lost
[HSK98]. This study (a user study) shows that, using this method, a single copy of
redundancy is good enough to provide packet loss protection for loss rates of up to 20-
30%, assuming that packet loss follows a random pattern. Similarly, Yanlin Liu and
Mark Claypool showed that video (MPEG-1) redundancy, which gives about 10%
overhead, is a reasonable repair method when the loss rate is under 20% [LC00].
13
In this thesis, Handley’s research result is used as a reference to real-world multimedia
packet drop rates, and the result of the audio and video piggybacking redundancy studies
is used as a rough guide line of what is the maximum packet drop rate that does not affect
multimedia perceptual quality. We used these results to see whether the multimedia
packet drop rate that D-CBT gives is reasonable, although the drop rate is also largely
determined by multimedia traffic source behaviors and the amount of network traffic
load.
Mark Claypool and Jonathan Tanner compared the effect of jitter and packet loss on
perceptual quality [CT99]. In this study, packet loss (8%) and residual jitter (from the
same trace) were induced into video clips based on Internet traces that sent simulated
video from locations across the United States and New Zealand to Worcester,
Massachusetts [GBC98], and perceptual quality was measured through a user study. The
study showed that the effect of jitter on perceptual quality could be nearly as important as
that of packet loss. Our approach to reduce multimedia jitter at network routers using
ChIPS originates from and is supported by this user study.
14
3. Approach
Throughout the thesis, an event driven network simulator called NS (version 2) is used
[ns2] to evaluate and compare the performance of Dynamic-CBT and ChIPS with that of
RED and CBT. NS has most of the common IP network components implemented
including TCP (Tahoe, Reno and Vegas) and UDP transport agents, and RED router
queues. We implemented CBT, and our proposed Dynamic-CBT and ChIPS into NS.
We also designed and implemented two traffic generators that simulate multimedia
applications with an application-level flow control mechanism, and modified the IP
packet header to represent tagged (multimedia) flows. This distinguishes well-behaved
UDP flows (flow-controlled multimedia traffic) from unresponsive UDP flows at the IP
level.
The first section of this chapter describes the design of the multimedia traffic generators,
and shows their behavior when put together with TCP flows under RED queue
management through simulation. This section also presents a simulation result showing
that TCP is not the transport agent of choice for multimedia applications because it
results in poor performance. The next section is devoted to describing and validating our
CBT implementation. The last two sections describe in detail the design and
implementation of Dynamic-CBT and ChIPS.

15
3.1 Flow-Controlled Multimedia
As mentioned briefly in Chapter 1, we are interested in the effect of queue management
on performance of well-behaved (or flow-controlled) multimedia flows, as well as
heterogeneously flow controlled traffics’ effect on the behavior of the queue management
mechanisms, especially on fairness. However, NS does not have a traffic generator that
simulates a well-behaved multimedia application, which is essential to evaluate D-CBT.
Also, the fact that evaluating the queue management mechanisms with well-behaved
multimedia traffic generators would result in far more accurate than with unresponsive
general-purpose CBR or VBR traffic generators already present in NS, pretending to be
well-behaved, encourages us to build them in NS.
3.1.1 Design and Implementation
We designed and implemented in NS two slightly different multimedia traffic generators
(or multimedia applications) that respond to network congestion using media scaling,
based on the work in [DHH+93]. The two traffic generators have the same congestion
control and avoidance (or flow control) mechanism, while the traffic they generate in
response to congestion notification from the network is different. The first one, called
MM-APP, reduces or increases transmission rate by decreasing or increasing the
transmission interval with a fixed frame size. The second one, called trace-driven
MPEG-APP (or MPEG-APP for short), changes the transmission rate by selecting frames
to transmit from an input MPEG trace, where frame sizes vary while the transmission
interval of frames in the file are fixed in terms of frames per second. The next couple of
16
paragraphs explain the congestion control and avoidance mechanism of the multimedia
applications.
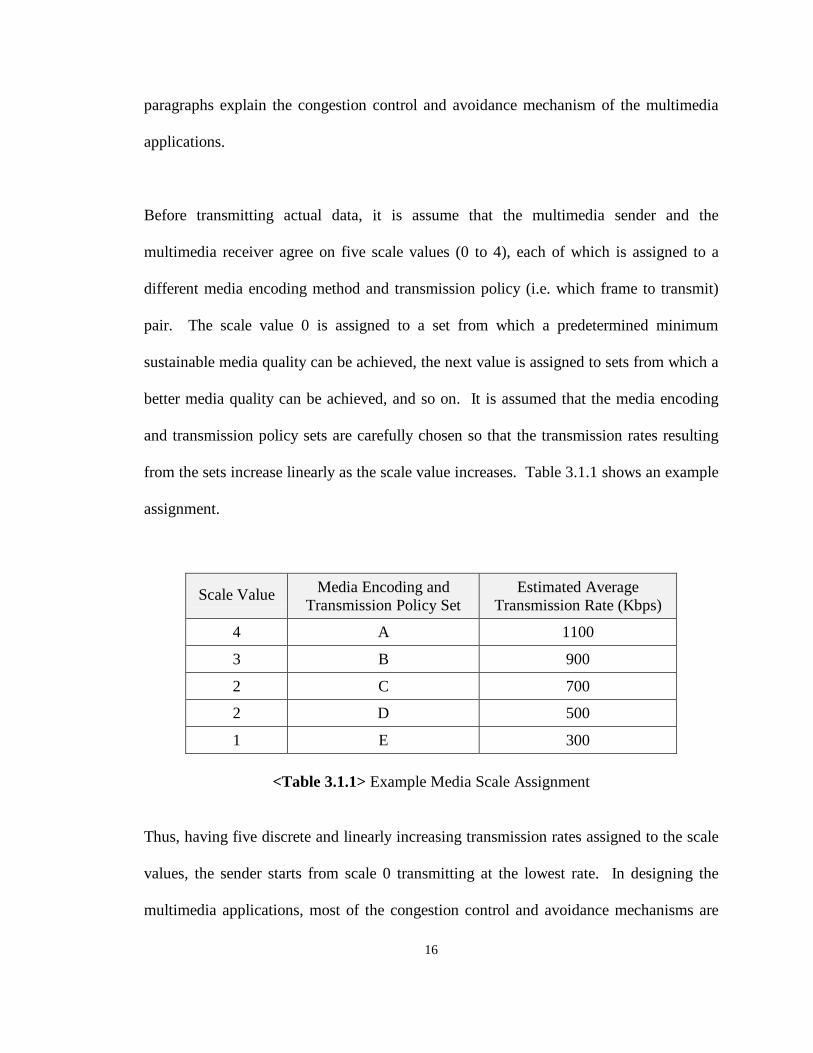
Before transmitting actual data, it is assume that the multimedia sender and the
multimedia receiver agree on five scale values (0 to 4), each of which is assigned to a
different media encoding method and transmission policy (i.e. which frame to transmit)
pair. The scale value 0 is assigned to a set from which a predetermined minimum
sustainable media quality can be achieved, the next value is assigned to sets from which a
better media quality can be achieved, and so on. It is assumed that the media encoding
and transmission policy sets are carefully chosen so that the transmission rates resulting
from the sets increase linearly as the scale value increases. Table 3.1.1 shows an example
assignment.
Scale Value Media Encoding andTransmission Policy Set
Estimated AverageTransmission Rate (Kbps)
4 A 1100
3 B 900
2 C 700
2 D 500
1 E 300
<Table 3.1.1> Example Media Scale Assignment
Thus, having five discrete and linearly increasing transmission rates assigned to the scale
values, the sender starts from scale 0 transmitting at the lowest rate. In designing the
multimedia applications, most of the congestion control and avoidance mechanisms are
17
placed as receiver side functions. More precisely, the receiver detects congestion,
determines the next transmission rate of the sender in terms of scale value, and notifies
the sender of this scale value. The sender, being notified of the scale value, simply
changes the transmission rate by using media encoding and transmission policy assigned
to the scale value.
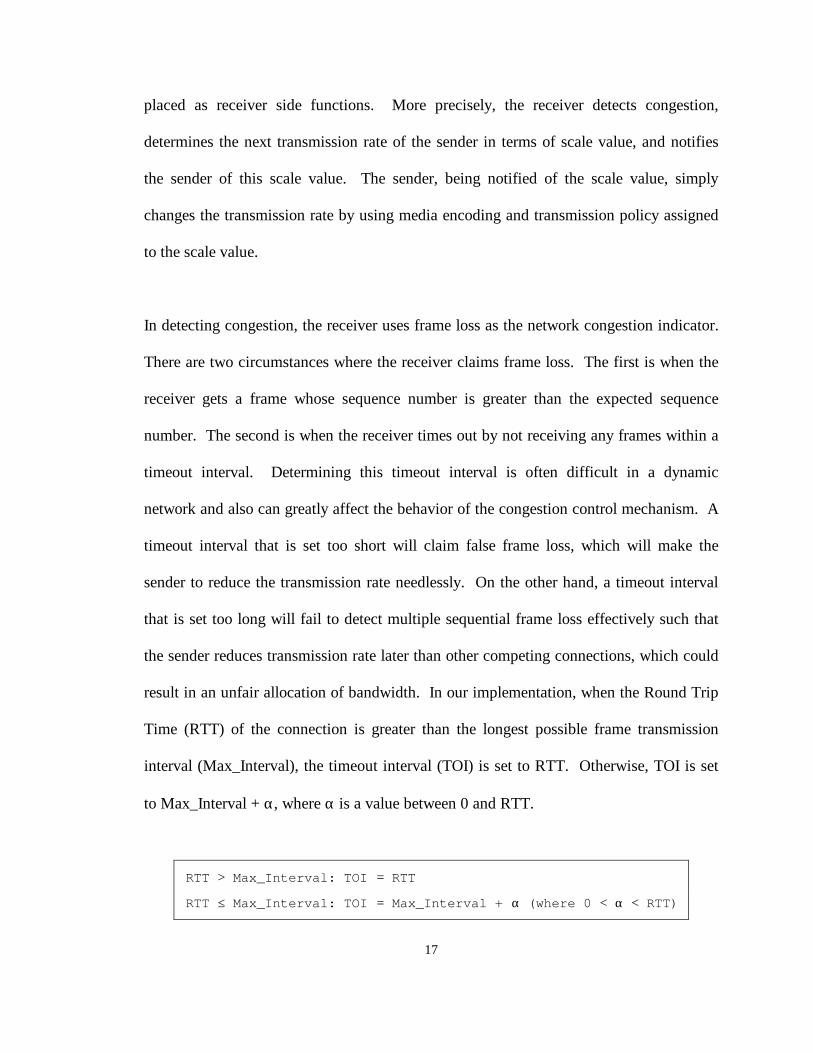
In detecting congestion, the receiver uses frame loss as the network congestion indicator.
There are two circumstances where the receiver claims frame loss. The first is when the
receiver gets a frame whose sequence number is greater than the expected sequence
number. The second is when the receiver times out by not receiving any frames within a
timeout interval. Determining this timeout interval is often difficult in a dynamic
network and also can greatly affect the behavior of the congestion control mechanism. A
timeout interval that is set too short will claim false frame loss, which will make the
sender to reduce the transmission rate needlessly. On the other hand, a timeout interval
that is set too long will fail to detect multiple sequential frame loss effectively such that
the sender reduces transmission rate later than other competing connections, which could
result in an unfair allocation of bandwidth. In our implementation, when the Round Trip
Time (RTT) of the connection is greater than the longest possible frame transmission
interval (Max_Interval), the timeout interval (TOI) is set to RTT. Otherwise, TOI is set
to Max_Interval + α, where α is a value between 0 and RTT.
RTT > Max_Interval: TOI = RTT
RTT ≤ Max_Interval: TOI = Max_Interval + α (where 0 < α < RTT)

18
The receiver, when detecting congestion, reduces its scale value to half (integer division)
and notifies the sender of this value by sending a small packet. The receiver, when no
network congestion is detected within a RTT from the last checkpoint, increases the scale
value by one and notifies the sender of this value. This design of drop scale to half at
congestion, and increase one scale up at a RTT is motivated by the fast recovery
algorithm that is found in TCP Reno implementations [FF96] and the TCP-friendly
definition: “TCP-friendly assumes TCP can be characterized by a congestion response of
reducing its congestion window at least by half upon indication of congestion, and of
increasing its congestion window by a constant rate of at most one packet per round trip
time” [FF98].
In fact, the congestion control mechanism of our multimedia applications, although its
exponential back off mechanism is conforming to linear system theory that says “if a
system is stable, the stability is exponential” [JK88], could be greedier than that of TCP
because of the following reasons. First, reducing the scale value to one-half at congestion
is not necessarily dropping the transmission rate in half, and increasing one scale value at
a RTT can increase more than one packet within a RTT. Second, the multimedia
applications always transmit frames at least at the lowest rate and never time out. When
the available network bandwidth is decreased, TCP reduces transmission rate by
decreasing its congestion window size, which could make the connection fragile.
Multimedia applications, on the other hand, as the available network bandwidth gets
lower and lower, have a congestion control mechanism operating at low scales that does
not effectively respond to network congestion, since it cannot decrease transmission rate
19
exponentially or at all. Because of the above difference, the multimedia streams can
unfairly use bandwidth over the competing TCP connections.
The last reason is that the multimedia flow-control mechanism is based on the
transmission rate while TCP is based on the congestion window. The rate-based
multimedia applications could get greedier than TCP as round trip time (or end-to-end
delay) is increased. Consider a situation that the two differently flow-controlled streams
competing in an IP network with high end-to-end delay. When congestion occurs, the
network notifies the senders of this event by dropping packets or marking the ECN bit
[Fl94]. However, it will take a while (at least half the RTT) for the senders to be notified
this event. Meanwhile, the multimedia applications with the rate-based mechanism keep
sending packet at the last rate. However, the congestion window based TCP agents after
sending packets up to the size of the congestion window wait for an ACK packet to
arrive. Assuming that the end-to-end delay is large enough to make flows significantly
bursty (less responsive) and to make the sender’s waiting time significantly large, the
flows with the rate-based mechanism transmit considerably more packets during each
congestion notification delay than the TCP flows. Moreover, the additional multimedia
packets injected in the network can cause greater congestion, in which bursty TCP flows
could be more severely punished than rather continuous multimedia flows by sequential
packet drops. This effect would be enlarged as the available bandwidth share is
decreased due to the increased number of active flows, and as the ratio between the
number of multimedia flows and the number of TCP flows is increased.

20
Now that the congestion control part of the multimedia traffic generators has been
examined, the specifics of how MM_APP and MPEG_APP generate traffic associated
with scales are presented below. As briefly mentioned earlier, MM_APP directly
associates transmission rates to scale values without particular media encoding and
transmission policy pairs in mind. It assumes that every media encoding and
transmission policy pair associated to the scale values generates traffic with a fixed frame
size. In other words, it assumes that the transmission intervals are the only factor that
causes the rate changes. Therefore, the resulting traffic can be characterized by CBR
traffic of fixed frame size and various transmission intervals associated with scale values.
Although not targeted at a specific multimedia application, MM_APP is useful in that it
is easy to change rate associated to scale values and to test the media scaling scheme
eliminating the effect of a specific traffic characteristic of a particular application.
MPEG_APP, on the other hand, simulates a very specific video application that is based
on MPEG-1 encoding scheme [MPFG97]. It implements five sets of MPEG-1 encoding
and transmission policies and associates them with scale values – in fact, it only changes
the frame transmission policy leaving the encoding scheme unchanged. MPEG-1
encodes motion pictures at a given interval and quality. It generates a stream of inter-
dependent frames of types, I, P and B, in a specific pattern such as IBBPBBPBB. Among
the three frame types, only I-frames can be decoded on their own. The decoding of a B-
frame relies on a pair of I-frame and/or P-frame that comes before and after the B-frame
and the decoding of a P-frame relies on an I-frame or P-frame that comes before the P-
frame. MPEG_APP supports MPEG-1 streams using the common pattern of

21
IBBPBBPBB and IBBPBBPBBPBB. Table 3.1.2 shows the transmission policies on the
two stream patterns, which are carefully selected keeping the frame dependencies in mind
[WCK+97].
Scale Transmission Policy (Pattern 1) Transmission Policy (Pattern 2)
4 I B B P B B P B B I I B B P B B P B B P B B I
3 I B P B P B I I B P B P B P B I
2 I P P I I P P P I
1 I P I I P I
0 I I I I
<Table 3.1.2> MPEG Transmission Policy Associated with Scale Values
The MPEG_APP gets a MPEG-1 trace file that contains frame information for a stream
with the maximum frame rate (scale 4) as input along with the maximum frame rate and
the longest possible frame transmission interval that is used for congestion detection at
the receiver side. At every scale 4 transmission interval, MPEG_APP reads the frame
information from the input file, and determines whether or not to transmit this frame
using the current scale value and the transmission policy associated with the scale value.
Figure 3.1.1 (a) shows an example input file that contains frame information for 30
frames per second IBBPBBPBB pattern stream in which the sizes of I-frames P-frames
and B-frames are 11 KB, 8 KB and 2 KB. The frame sizes used in this example are the
mean frame size of each type obtained while playing a short, high-quality MPEG-1 news
clip. Figure 3.1.1 (b) shows each transmission policy assigned to scale values with the
estimated average transmission rate for the input trace file.

22
Maximum Frame Rate (Scale 4) = 30 frame/sec
Scale Transmission Policy(Pattern 1)
Estimated AverageTransmission Rate
(Kbps)
4 I B B P B B P B B I 10563 I B P B P B I 8962 I P P I 7361 I P I 544
I 11000B 2000B 2000P 8000B 2000B 2000P 8000B 2000B 2000I 11000. .. .. . 0 I I 352
(a) Input Trace File (bytes) (b) Transmission Policies and Associated Rates
<Figure 3.1.1> Example Input Trace File and Average Transmission Rates
Figure 3.1.2 visualizes the estimated transmission rate in Figure 3.1.1 (b). The almost
linearly growing estimated average transmission rates shows that the assignment of the
transmission policies to the scale values works well with the given example MPEG-1
stream. This is because the linear increment of scale results in a linear increment of
transmission rate and the exponential decrement of scale results in exponential decrement
of transmission rate.
<Figure 3.1.2> Estimated AverageTransmission Rate of the Examplein Figure 3.1.1
The transmission rate resulting fromthe transmission policies assigned forthe scale value for the given MPEG-1encoded news clip stream growslinearly as scale value increases.
Estimated Average Transmisson Rate
0
200
400
600
800
1000
1200
0 1 2 3 4
Scale
Kbp
s

23
3.1.2 Simulation Test and Analysis
We ran a series of simulations to validate the NS implementation of MM_APP and
MPEG_APP, and to measure their fairness when competing for bandwidth with TCP
flows under RED queue management. Here, we present the results of two simulations
that exhibit the behavior of MM_APP and MPEG_APP. The simulations, referred to as
SIM_MM1 and SIM_MM2, are designed to show the effect of available bandwidth and
end-to-end delay on fairness. Figure 3.1.3 shows the network topology and the
application scenario used for the simulations. Note that the only difference between
SIM_MM1 and SIM_MM2 is the delay for the link that connects the two network nodes
(n1-n2).
<Figure 3.1.3> SIM_MM1 and SIM_MM2 Scenario and Topology
Each link that connects a source or destination node and a network node is set to have 10
Mbps link capacity and 5ms of delay. The link that connects the two network nodes is set
to have 6 Mbps of link capacity and 20ms of delay for SIM_MM1 and 60ms of delay for
24
SIM_MM2. The network node n1 uses RED queue management, for which the
parameter set used, shown in Figure 3.1.3 (b), is chosen from one of the sets that are
recommended by Floyd and Jacobson [RK99].
For traffic sources, 6 FTP, 2 MM_APP and 2 MPEG_APP traffic generators are used,
where FTP uses TCP Reno and the others use UDP as the underlying transport agent. All
the TCP agents are set to have a maximum congestion window size of 20 packets and a
maximum packet size of 1500 bytes. The UDP agents are also set to have a maximum
packet size of 1500 bytes. The MM_APP traffic generators use the transmission rates
shown in Table 3.1.1, that is 300, 500, 700, 900, 1100 Kbps, for scale 0 to 4 transmission
rates. The MPEG_APP traffic generators use the transmission policies and the trace file
shown in Figure 3.1.1, which generates traffic rates of 352 Kbps to 1056 Kbps.
Both simulations start with five FTP, and 1 MM_APP and 1 MPEG_APP in action, and
at 15 seconds the remaining traffic sources join. For the first 15 seconds, the available
bandwidth share for each connection is about 857 Kbps, and for the next 10 seconds, the
share goes down to 600 Kbps. Figure 3.1.4 and Figure 3.1.5 in the next two pages show
the results of SIM_MM1 and SIM_MM2. For the throughput measurements, we omitted
the first 5 seconds to eliminate the effect of the initially unstable TCP and RED behaviors
on the fairness.

25
(a) Per-flow Throughput Data (Kbps)
(b) Average Per-flow Throughput (c) Throughput Gains over FTP-TCP
(d) RED Queue Size (e) Congested Link Throughput
5 – 15 (Sec) 15 – 25 (Sec)FTP-TCP1 733.2 505.2FTP-TCP2 888.0 464.4FTP-TCP3 717.6 552.0FTP-TCP4 958.8 412.8FTP-TCP5 841.2 428.4FTP-TCP6 367.2
MM-UDP1 868.8 669.6MM-UDP2 727.8
MPEG-UDP1 809.6 826.8MPEG-UDP2 647.2
Fair Share 857.1 600.0
<Figure 3.1.4> SIM_MM1 – SimulationTest of MM_APP and MPEG_APP #1
This simulation is set to have the FTPapplications over TCP and the flow-controlled multimedia applications to fairlyshare the output bandwidth for the first 10seconds (5 to 15 seconds). For the next 10seconds when three more sources joindecreasing the available bandwidth share, themultimedia applications get more bandwidththan the TCP flows.
Average Per-flow Throughput
827.8
455.0
868.8
698.4809.6
737.0
0.0
200.0
400.0
600.0
800.0
1000.0
1200.0
5 - 15 (Sec) 15 - 25 (Sec)
Kbp
s FTP-TCPMM-UDPMPEG-UDP
Average Throughput Gains over FTP-TCP
5%
53%
-2%
62%
-10%
0%
10%
20%
30%
40%
50%
60%
70%
80%
5 - 15 (Sec) 15 - 25 (Sec)
Gai
n P
erce
ntag
e
MM-UDPMPEG-UDP

26
(a) Per-flow Throughput Data (Kbps)
(b) Average Per-flow Throughput (c) Throughput Gains over FTP-TCP
(d) RED Queue Size (e) Congested Link Throughput
<Figure 3.1.5> SIM_MM2 – SimulationTest of MM_APP and MPEG_APP #2
SIM_MM2 shows the effect of a longer end-to-end delay on fairness. The only differencefrom SIM_MM1 is that the network link is setto have longer delay. Comparing thethroughput gain over FTP-TCP graph withthat of Figure 3.1.4, one can easily see that themultimedia applications become greedier asthe end-to-end delay is increased.
5 – 15 (Sec) 15 – 25 (Sec)FTP-TCP1 910.8 464.4FTP-TCP2 734.4 453.6FTP-TCP3 952.8 324.0FTP-TCP4 493.2 465.6FTP-TCP5 718.8 268.8FTP-TCP6 552.0
MM-UDP1 976.8 804.0MM-UDP2 746.4
MPEG-UDP1 888.4 699.2MPEG-UDP2 723.2
Fair Share 857.1 600.0
Average Per-flow Throughput
762.0
421.4
976.8
775.2
888.4
711.2
0.0
200.0
400.0
600.0
800.0
1000.0
1200.0
5 - 15 (Sec) 15 - 25 (Sec)
Kbp
s FTP-TCP
MM-UDP
MPEG-UDP
Average Throughput Gains over FTP-TCP
28%
84%
17%
69%
0%
10%
20%
30%
40%
50%
60%
70%
80%
90%
5 - 15 (Sec) 15 - 25 (Sec)
Gai
n P
erce
ntag
e
MM-UDP
MPEG-UDP

27
In SIM_MM1, as shown in Figure 3.1.4 (c), the multimedia streams that consume about
the same amount of bandwidth as the TCP streams during the first 10 seconds become
greedier as the available fair bandwidth share for each flow goes down to 600 Kbps for
the next 10 seconds. Although difficult to pinpoint, the unfairness is mainly caused by
the average reduction of TCP’s congestion window size, and the widely fluctuating and
higher RED’s average queue length that is shown in Figure 3.1.4 (d). As discussed in the
earlier section that describes the flow control mechanism of MM_APP and MPEG_APP,
reducing the congestion window size makes the TCP connection more fragile. This could
result in TCP (Reno) performing more slow starts than fast recovery, and even timeouts,
especially when RED applies higher early-drop rates as the average queue length gets
high.
SIM_MM2 exhibits the “end-to-end delay effect on fairness” discussed in the section that
describes the multimedia flow control mechanism. As shown in the queue size graphs and
congested link throughput graphs of SIM_MM1 and SIM_MM2 (graphs (c) and (d)), as
the end-to-end delay is increased the router experiences more bursty packet reception,
because the congestion notification delay is also increased. Comparing the throughput
gain graphs in Figure 3.1.4 and Figure 3.1.5, one can easily see that the longer end-to-end
delay significantly increases the unfairness. The following calculates and compares the
number of transmitted packet during a congestion notification delay for a TCP and a
MM_APP in SIM_MM2.
28
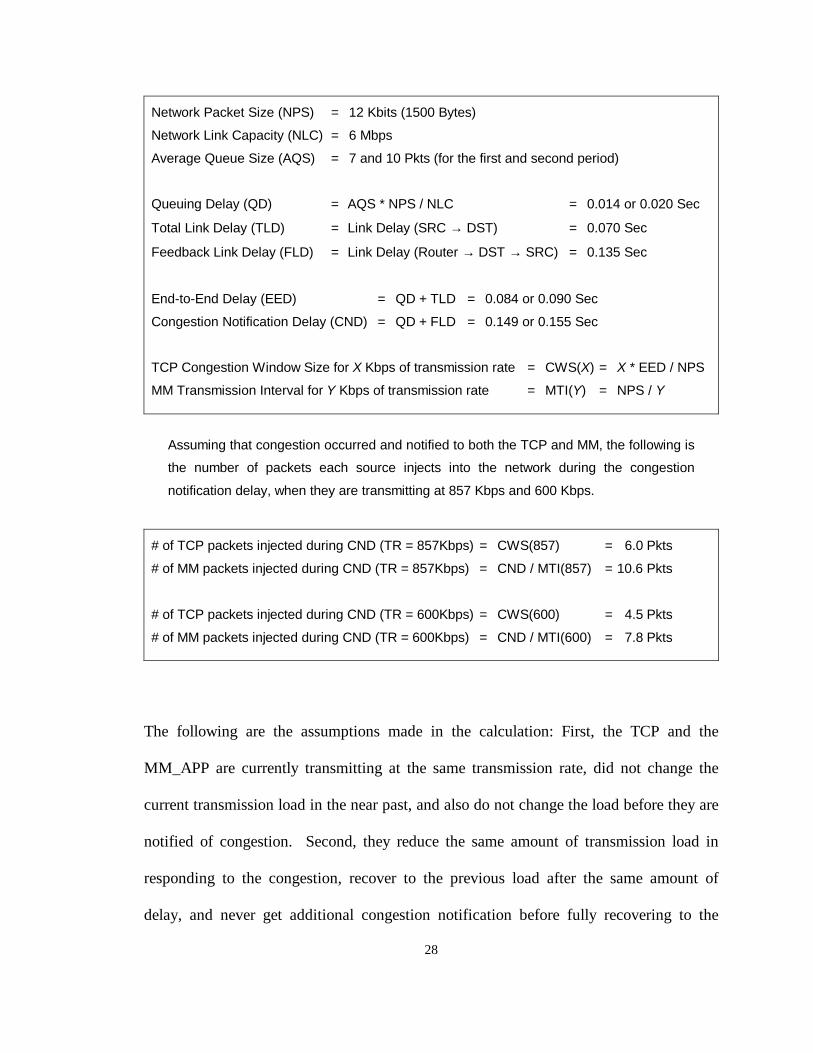
Network Packet Size (NPS) = 12 Kbits (1500 Bytes)
Network Link Capacity (NLC) = 6 Mbps
Average Queue Size (AQS) = 7 and 10 Pkts (for the first and second period)
Queuing Delay (QD) = AQS * NPS / NLC = 0.014 or 0.020 Sec
Total Link Delay (TLD) = Link Delay (SRC → DST) = 0.070 Sec
Feedback Link Delay (FLD) = Link Delay (Router → DST → SRC) = 0.135 Sec
End-to-End Delay (EED) = QD + TLD = 0.084 or 0.090 Sec
Congestion Notification Delay (CND) = QD + FLD = 0.149 or 0.155 Sec
TCP Congestion Window Size for X Kbps of transmission rate = CWS(X) = X * EED / NPS
MM Transmission Interval for Y Kbps of transmission rate = MTI(Y) = NPS / Y
Assuming that congestion occurred and notified to both the TCP and MM, the following is
the number of packets each source injects into the network during the congestion
notification delay, when they are transmitting at 857 Kbps and 600 Kbps.
# of TCP packets injected during CND (TR = 857Kbps) = CWS(857) = 6.0 Pkts
# of MM packets injected during CND (TR = 857Kbps) = CND / MTI(857) = 10.6 Pkts
# of TCP packets injected during CND (TR = 600Kbps) = CWS(600) = 4.5 Pkts
# of MM packets injected during CND (TR = 600Kbps) = CND / MTI(600) = 7.8 Pkts
The following are the assumptions made in the calculation: First, the TCP and the
MM_APP are currently transmitting at the same transmission rate, did not change the
current transmission load in the near past, and also do not change the load before they are
notified of congestion. Second, they reduce the same amount of transmission load in
responding to the congestion, recover to the previous load after the same amount of
delay, and never get additional congestion notification before fully recovering to the

29
previous state. Third, the TCP and the MM_APP are able to adjust the window size or
the transmission interval exactly to the given transmission rate, although this is not
possible since they discretely adjust window sizes or transmission intervals. Last, to
make the calculation easy, it is assumed that ECN marking is used for congestion
notification (although packet drop is used in the simulation). The calculation is made for
the transmission rate of 857 Kbps that is the fair share during the first period and for the
rate of 600 Kbps that is the fair share during the second period. Under SIM_MM2,
whenever both the TCP and MM_APP packets are marked for the network congestion,
MM_APP injected 4.6 and 3.3 more packets to the network during the notification delay
before reducing the transmission load for the first and the second period. This gives an
instant bandwidth gain of 370 Kbps and 255 Kbps for the multimedia applications during
the notification delay of 0.149 and 0.155 second. Assume that the TCP and the
MM_APP received the same number of congestion notifications at the same time, and the
notification delay total takes half the total simulation time. The MM_APP will get 185
Kbps of bandwidth more than the TCP in the first period, and will get 146 Kbps more in
the second period. Although this observation is based on the assumptions that would
never happen in a real life, it gives an intuition of how end-to-end delay could contribute
the unfairness.
SIM_MM1 and SIM_MM2 showed that the multimedia applications that use the rate-
based flow control mechanism could be greedier than TCP agents that use window-based
flow control mechanism. It is likely that this is not only the problem with the flow
control mechanism we build, but with most of rate-based mechanisms. In general,

30
interactive multimedia applications today would not want to use TCP as the underlying
transport agent, but use UDP with no or their own flow control mechanism that is
possibly rate-based or window-based with transmission scheduling [BRS99]. Figure
3.1.6 that shows the TCP and MM_APP jitter in terms of inter-packet arrival time gives
an explanation why.
<Figure 3.1.6> FTP-TCP and MM-UDP Jitter under RED (Inter-Packet Arrival Time)
TCP’s bursty transmission policy that transmits data packets up to the minimum of
congestion and receiver side window at a time without using any particular transmission
scheduling introduces high jitter compared to the continuous transmission policy.
Furthermore, from time to time, TCP’s timeouts add huge peaks. Delay sensitive
interactive multimedia applications degrade in quality under high jitter, since they need to
play out the multimedia data at a specific time interval. They could use relatively large
buffers to normalize the jitter effect, however this gives extra delays that might not
satisfy the users of the application. In addition, the fact that TCP does not separate flow
control from loss recovery discourages multimedia applications from using it [BRS99],

31
since this gives possibly unbounded transmission delays for a multimedia packet that is
useless after a specific period due to the retransmission attempts for the previous packets.
In this section, we described the design and showed the behavior of the multimedia
applications (or traffic generators) that use a flow-control mechanism based on media
scaling, which we built and used to evaluate the proposed router queue management and
scheduling mechanisms. As shown in the simulation results, the multimedia applications
become greedier than TCP when the round trip time is relatively high and the available
bandwidth share is relatively low. This is mainly due to the transmission characteristics
of the rate-based mechanism and the minimum bandwidth requirements. We also
demonstrated that TCP is not the transport agent of choice for multimedia applications by
showing its poor performance on jitter and delay that is due to its transmission policy.
The next section presents the implementation and validation of CBT on NS.

32
3.2 CBT Implementation and Validation
As briefly mentioned in Chapter 1, the main idea behind the design of CBT [PJS99] is
applying class-based isolation on a single queue that is fully or partially managed by
RED without using packet scheduling. Instead of using packet scheduling on multiple
logical queues, CBT regulates congestion-time output bandwidth for n classes of flows
using a RED queue management mechanism and a threshold for each of the n-1 classes
of flows, which is average number of queue units that a class may use. CBT categorizes
flows into three classes, which are TCP, tagged (multimedia) UDP and untagged (other)
UDP, and assigns a pre-determined static threshold for each of the two UDP classes,
assuming that UDP flows are mostly unresponsive or misbehaving and need to be
regulated. When a UDP packet arrives, the weighted-average for the appropriate class is
updated and compared against the threshold for the class to decide whether to drop the
packet before passing it to the RED algorithm. For the TCP class, CBT does not apply a
threshold test but directly passes incoming packets to the RED test unit. This is Jeffay’s
first design of CBT, called “CBT with RED for all”. The conceptual view of the first
CBT design is shown in Figure 3.2.1 in the next page.
In Jeffay’s second design, called “CBT with RED for TCP”, only TCP packets are
subjected to RED’s early drop test, and UDP packets that survive a threshold test are
directly enqueued to the outbound queue that is managed by RED. Another difference
from the first design is that the RED’s average queue size is calculated only using the
number of enqueued TCP packets. CBT with RED for TCP is based on the assumption
that tagged (multimedia) UDP flows as well as untagged (other) UDP flows are mostly

33
unresponsive, and it is of no use to notify these traffic sources of congestion earlier. CBT
with RED for TCP improves the UDP packet drop rate by not applying the early drop
test, and thus improves multimedia performance compared to the first design [PJS99].
We implemented CBT with RED for all into NS, from which our proposed mechanism
D-CBT is extended, and validated the implementation by simulating an experiment from
Jeffay’s paper of which title is “Lightweight Active Router – Queue Management for
Multimedia Networking” [PJS99]. This section presents the implementation and
validation. In the rest of this thesis, CBT refers to CBT with RED for all.
<Figure 3.2.1> CBT (with RED for all) Conceptual View
CBT recognizes the three different classes of flows at the IP level. In IP, this can be done
by using a protocol field that tells it what the transport protocol is and an unused bit of
type-of-service field in IPv4 header [PJS99, NJZ97]. Likewise, we used the protocol
field variable in the header structure to distinguish UDP packets from TCP packets.

34
However, to distinguish tagged UDP from untagged UDP, we decided to use a priority
variable, and modified the UDP agent to set the priority variable of the outgoing packets
to 15 when requested by the multimedia application (or traffic generator). This was
because the type-of-service field parameter was not defined in the original NS IP header
definition, and we did not want to modify the header structure. Indeed, the NS IP header
has the IPv4 parameters (but not all) and also has IPv6 parameters such as a priority field
at the same time. Therefore, it is up to users which version of the header to assume.
<Figure 3.2.2> CBT (with RED for all) Implementation Diagram
We took the RED implementation in NS and extended it to CBT (with RED for all) as
described in Jeffay’s paper [PJS99]. The CBT implementation is shown in Figure 3.2.2.
When a packet arrives, it is classified into one of the three classes. For an incoming UDP
packet, an appropriate class average is updated and the class’ threshold test is applied. If
the packet survives the threshold test, it is given to the RED unit. An incoming TCP
packet is directly given to the RED unit. As a packet, either a UDP packet that survived a

35
threshold test or a TCP packet, arrives the RED unit updates the average queue length
and applies its early drop test on it, in which one of three possible decisions is made.
First, when the average is less than the minimum threshold, the packet is given to the
queue manager. Second, when the average is greater than the minimum and less than the
maximum threshold and the packet is selected for an early drop, the early drop test unit
drops the packet. Third, when the average is greater than the maximum threshold, the
unit passes the packet to the queue management unit and signals congestion, where the
queue management unit enqueues this packet at the end, randomly selects a packet in the
queue and drops it 3. When the actual queue overflows, the queue manager performs this
random drop without a congestion signal from the test unit.
<Figure 3.2.3> Jeffay’s Experimental Network
After the implementation, we validated the RED and the CBT implementations by
simulating Jeffay’s experiment and comparing his RED and CBT results with the
simulated ones. Figure 3.2.3 shows his experimental network consisted of two switched
100 Mbps Ethernet LANs (source and destination LAN) that were interconnected by a
3 This is not the behavior of standard RED. Standard RED drops all incoming packets when the average isgreater than the maximum threshold.
36
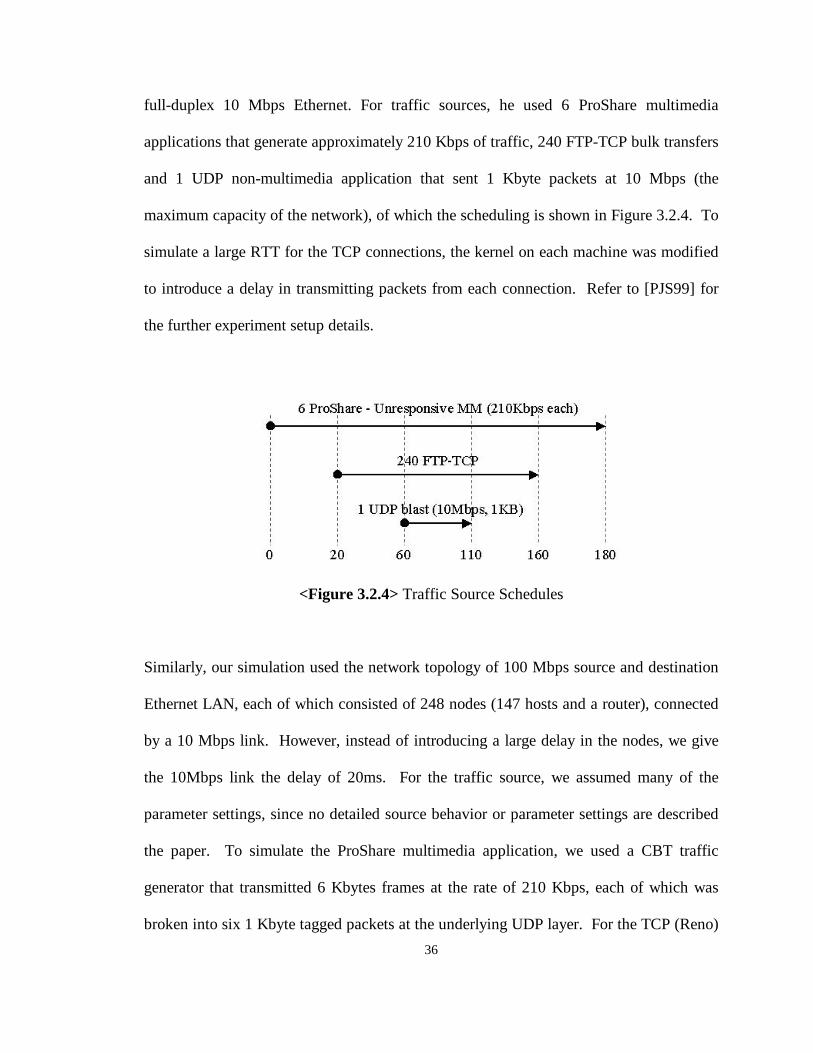
full-duplex 10 Mbps Ethernet. For traffic sources, he used 6 ProShare multimedia
applications that generate approximately 210 Kbps of traffic, 240 FTP-TCP bulk transfers
and 1 UDP non-multimedia application that sent 1 Kbyte packets at 10 Mbps (the
maximum capacity of the network), of which the scheduling is shown in Figure 3.2.4. To
simulate a large RTT for the TCP connections, the kernel on each machine was modified
to introduce a delay in transmitting packets from each connection. Refer to [PJS99] for
the further experiment setup details.
<Figure 3.2.4> Traffic Source Schedules
Similarly, our simulation used the network topology of 100 Mbps source and destination
Ethernet LAN, each of which consisted of 248 nodes (147 hosts and a router), connected
by a 10 Mbps link. However, instead of introducing a large delay in the nodes, we give
the 10Mbps link the delay of 20ms. For the traffic source, we assumed many of the
parameter settings, since no detailed source behavior or parameter settings are described
the paper. To simulate the ProShare multimedia application, we used a CBT traffic
generator that transmitted 6 Kbytes frames at the rate of 210 Kbps, each of which was
broken into six 1 Kbyte tagged packets at the underlying UDP layer. For the TCP (Reno)

37
connection, we set the maximum packet size to 300 Bytes and the maximum congestion
window size to 10 packets.
• RED Settings:
qsize = 60 pktsmax-th = 30 pktsmin-th = 15 pktsqweight = 0.002 (not specified in the paper)max-pro = 0.1 (not specified in the paper)
• CBT Settings: the above settings plus
mm-th = 10 pktsudp-th = 2 pkts
<Table 3.2.1> RED and CBT Settings
Table 3.2.1 shows the RED and CBT parameter settings used for the experiment and the
simulation. Each router is set to have a 60 packet long output queue. For RED, the
maximum and minimum thresholds were 30 packets and 15 packets, the weight was
0.002 for the weighted queue average calculation, and the maximum early drop
probability was 0.1. For CBT, in addition to the RED settings, the tagged UDP class
threshold (mm-th) was set to 10 packets, and the untagged UDP class threshold (udp-th)
was set to 2 packets. These class thresholds were determined based on an assumption
that the average of the average queue length would be about 26 packets throughout the
experiments (or the simulation), and all packets are of the same size. By assigning the
maximum average of a 10-packet space of the queue to the tagged flow class, it
approximately gets the maximum bandwidth of 3.8 Mbps, 10/26 of the network link
bandwidth, at congestion. This was enough for the 6 ProShare flows whose aggregated

38
average bandwidth requirement was approximately 1.3 Mbps. Similarly, for the
untagged UDP flows, by assigning the average of a 2-packet space the class for
congestion, approximately 0.8 Mbps of output was reserved for the class. From the
above calculation, the aggregated throughput of TCP, which should have been about 8.7
Mbps (or 1088 Kbytes/Sec) when TCP flows are sharing the bandwidth with the
ProShare flows, should have dropped down to approximately 7.9 Mbps (or 988
Kbytes/Sec) when the UDP blast joins. However, TCP flows got a little bit less
bandwidth than the calculation due to their smaller packet size. By using smaller packets,
TCP agents would operate in a larger congestion window size and transmit more packets
into the network resulting in more TCP packet drops at the router. However, since the
TCP bandwidth loss due to a packet drop was reduced, the TCP bandwidth loss was not
that much.
Figure 3.2.4 shows the aggregated TCP throughput (in Kbytes/Sec) under RED and CBT
for the experiment and the simulation – the throughput graph for the experiments is
copied from Jeffay’s paper. By comparing the experimental result and the simulated
result under RED, one can see that the traffic source parameter settings we guessed for
the unspecified ones are similar to the settings used in the experiments. Also, the results
imply that the TCP and RED implementation on NS are comparable to the ones used in
the experiment. Next, the aggregated TCP throughputs under CBT for the experiment and
the simulation show that our NS implementation is correct, although the experimental
result shows several sharply dropping aggregated TCP throughputs during the period

39
when the UDP blast joins. We believe that this phenomenon is caused by experimental
“noises” from the real world.
RED CBT with RED for all
(a) Jeffay’s Experimental Results
RED CBT with RED for all
(b) NS Simulated Results
<Figure 3.2.4> Aggregate TCP Throughput (X-axis = Seconds, Y-axis = Kbytes/Sec)
Comparing the experimental and the simulated results carefully, one would notice the
delayed throughput of the experiment at the beginning and at the end. This could be
40
simply from the fact that Jeffay used a transmission source scheduling that is slightly
different than shown in Figure 3.2.3. Assuming that the same schedule is used, it is
possible that this difference comes from the mechanism in the host kernels that
introduces a delay for TCP packet transmissions could be set to have a higher delay than
that of the network link in the simulation. Another possible factor is the routing delays of
the routers in the experiment. In fact, the router implementation in NS does not have a
routing delay and thus does not have an inbound queue. It appears that each router in the
experiment is set to have a large inbound queue. In this situation, when a severe overload
occurs in the inbound link that is considerably off the router’s switching capacity (or
processing delay), the incoming packets wait a significant time in the inbound queue to
be processed or even dropped. At the period when TCPs start transmission the overload
occurs due to the slow start algorithm with the relatively large congestion window sizes.
Likewise, it seems that when the UDP blast starts, a very significant overload occurred at
the inbound link. These effects, we believe, contributed to the delayed transmission at
the router, and possibly the sharply dropping aggregated TCP throughput during the
period of 60 to 110 seconds.
This section described our CBT implementation on NS, and the validation of the TCP,
RED and the newly added CBT implementations. By simulating the Jeffay experiment
and comparing the results with the experimental results, we showed that the TCP, RED,
and the CBT implementations are comparable to the ones used in his experiments. The
next section presents the design and implementation of our proposed mechanism, D-CBT
and ChIPS.
41
3.3 Dynamic-CBT and Cut-In Packet Scheduling
Dynamic-CBT (D-CBT) is an active queue management mechanism that is derived from
CBT and based on RED, and Cut-In Packet Scheduling (ChIPS) is a lightweight
multimedia favored packet scheduling mechanism that can be used under RED and its
variants. While the two mechanisms can be used separately, we implemented ChIPS into
D-CBT and measured the performance of D-CBT w/o ChIPS and D-CBT w/ ChIPS.
This section presents the design and implementation of D-CBT and ChIPS.
3.3.1 Dynamic-CBT (D-CBT)
D-CBT is an extension of CBT (with RED for all) that enforces fairness among classes of
flows, and gives UDP classes better queuing resource utilization. Figure 3.3.1 in the next
page shows the design of D-CBT. The key difference from CBT is (1) the dynamically
moving fair thresholds and (2) the UDP class threshold test that actively monitors and
responds to RED indicated congestion. To be more specific, by dynamically assigning
the UDP thresholds such that the sum of the fair average queue resource share of flows in
each class is assigned to the class at any given time, D-CBT fairly allocates the
bandwidth of a congested link to the traffic classes. Also, the threshold test units, which
are activated when RED declares impending congestion (i.e. red_avg > red_min),
coupled with the fair class thresholds, allow the UDP classes to use the available queue
resources more effectively than in CBT, in which each UDP class uses the queue
elements an average of no more than its fixed threshold at any time. Looking at it from a
42
different view as shown in Figure 3.1.1, D-CBT can be thought of a Class-Based FRED-
like mechanism that does per-class-accounting on the three classes of flows.
As in CBT, D-CBT categorizes flows into TCP, tagged UDP and untagged UDP classes.
However, different from the class categorization of CBT in which flow-controlled
multimedia flows are not distinguished from unresponsive multimedia flows (all tagged),
D-CBT classifies UDP flows into flow-controlled multimedia (tagged) UDP and other
(untagged) UDP. The objective behind this classification is to protect flow-controlled
multimedia flows from unresponsive multimedia flows, and encourage multimedia
applications to use congestion avoidance mechanisms, which may be different than those
of TCP. We believe that there are advantages in categorizing UDP traffic in this way for
the following reasons: First, multimedia applications are the primary flows that use UDP
and generate high bandwidth. Second, by categorizing flows by their congestion
responsiveness characteristic (i.e. TCP friendly, flow-controlled but misbehaving
multimedia and unresponsive flows), different management can be applied to the classes
of differently flow-controlled flows.
In fact, in determining the fair4 UDP thresholds, D-CBT calculates the fair average output
buffer share of the tagged UDP class from the average queue length that is maintained by
RED, and that of untagged UDP class from the RED’s minimum threshold (plus a small
allowance). This is based on the assumption that tagged flows (or flow-controlled
multimedia) can respond to network congestion and will actively try to lower the average
4 Fair share of a class is the number of active flows in a class divided by total number of active flows.

43
length of a congested queue on notification of congestion. Therefore, they are allowed to
use the impending congestion state queue buffers (i.e. red_avg – red_min when red_avg
> red_min) up to their fair share of the average. However, unresponsive (untagged)
flows, which have no ability to respond to network congestion, are not allowed to use the
impending state queue buffers at impending congestion. Actually, we allow the
unresponsive UDP class to use a small fraction of the impending state queue buffers,
which is 10% of (red_max – red_min) * untagged_UDP_share when the maximum early
drop rate is 0.1, to compensate the effect of needless additional early drops for the class.
<Figure 3.3.1> Design and Implementation of D-CBT
Figure 3.3.1 shows the design and also the implementation of D-CBT, in which the
existence of the active flow counting unit is a big structural difference from CBT. In
order to calculate a fair threshold (or average queue resource share) for each class, D-
CBT needs class state information, and therefore keeps track of the number of active

44
flows in each class. Generally, as in FRED, active flows are defined as ones whose
packet is in the outbound queue [LM97]. However, we took slightly different approach
in detecting active flows, in that an active flow is one whose packet has entered the
outbound queue unit during a certain predefined interval since the last time checked. In
D-CBT, an active flow counting unit that comes right after the classifier maintains a
sorted linked list, which contains a flow descriptor and its last packet reception time, and
a flow counter for each class. Currently, the flow descriptor consists of a destination IP
address and the flow ID (IPv6). However, assuming IPv4, this could be replaced by
source and destination address, although this would redefine a flow as per source-
destination pair.
For an incoming packet after the classification, the counting unit updates an appropriate
data structure by inserting or updating the flow information and the current local time.
When inserting new flow information, the flow counter of the class is also increased by
one. The counting unit, at a given interval (set to 300ms in our implementation),
traverses each class’ linked list, deletes the old flow information and decreases the flow
counter. The objective behind this probabilistic active flow counting approach is
twofold: First, D-CBT does not necessarily require an exact count of active flows as do
other queue mechanisms that are based on flow-based-accounting, although a more exact
count is better for exercising fairness among flow classes. Second, it might be possible to
improve the mechanism’s packet processing delay by localizing the counting unit with
the help of router’s operating system and/or device. For example, the traversing delete is
a garbage collection-like operation that could be performed at the router’s idle time or
45
possibly processed by a dedicated processor in a multiprocessor environment. In our
implementation, we used a sorted linked list data structure that has the inserting and
updating complexity of O(n), and the traversing complexity of O(n), where n is the
number of flows of a class. Assuming that a simple hash table is used instead, the
complexity of inserting and updating operation drops to O(1), while the complexity of the
traverse delete will remain O(n).
For a incoming packet that is updated or inserted for its flow identification to its class
data structure at the counting unit, D-CBT updates the RED queue average, the tagged
UDP average and the untagged UDP average, and passes the packet to an appropriate test
unit as shown in Figure 3.3.1. Note that for every incoming packet all of the averages are
updated using the same weight. This is to apply the same updating ratio to the weighted-
averages, so that a snapshot in time at any state gives the correct average usage ratio
among the classes. Using the three averages and the active flow count for each class, the
UDP threshold test units calculate the fair thresholds for the tagged and untagged UDP
classes as described earlier, and apply the threshold test to incoming packets of the class
when the RED queue indicates impending congestion. The rest D-CBT work the same in
CBT, which are explained in the previous section.
Thus, D-CBT is designed to exercise the traditional fairness between flows of different
characteristics by classifying and applying different enqueue policies to them, and restrict
each UDP class to use the queue buffer space up to their share in average. We
hypothesize that the advantages of D-CBT are the following: First, D-CBT avoids
46
congestion as RED with the help of responsive traffic sources. Second, assuming that the
flows in a class (especially the tagged UDP) use flow control mechanisms of which the
congestion responsiveness characteristics are almost the same, D-CBT will fairly assign
bandwidth to each flow with much less overhead than FRED, which requires per-flow
state information. Even if the tagged flows do not use their fair share, D-CBT will still
successfully assign bandwidth fairly to each class of flows, protecting TCP from the
effect of misbehaving and unresponsive flows and also protecting the misbehaving (flow-
controlled multimedia) flows from the effect of unresponsive flows. Lastly, D-CBT
gives tagged (flow-controlled multimedia) flows better chance to fairly consume the
output bandwidth than under FRED by performing per-class punishments instead of the
strict per-flow punishment. Also, D-CBT may more flexibly assign the bandwidth share
within the class.
3.3.2 Cut-In Packet Scheduling (ChIPS)
ChIPS is a light-weight multimedia favored packet scheduling mechanism that can
replace the FCFS enqueue style packet scheduling of a RED-managed queue for CBT, D-
CBT and possibly other RED-like mechanism, which is specifically targeted to improve
multimedia jitter. ChIPS monitors average enqueue rates of tagged and the other flows,
and is activated when the tagged flows are using a relatively smaller fraction of
bandwidth than TCP flows. On transient congestion in which the queue length is greater
than the average queue length, ChIPS awards tagged (flow-controlled multimedia) flows
by allowing their packets to “cut” in the line of queue where the average queue length

47
points. Figure 3.3.2 in the next page shows the design of ChIPS (the virtual queue is
described later).
<Figure 3.3.2> ChIPS (Tagged Packet Insertion on Transition Congestion)
By inserting tagged UDP packets at the average queue length on transition congestion,
ChIPS improves flow-controlled multimedia jitter. However, this could harm TCP flows
and even make them time out by introducing a large extra delay when the multimedia
traffic is taking a considerable portion of the output bandwidth. Under the normal RED
queue mechanism that has no means to regulate the queue buffer usage among the classes
of flows, it is essential for ChIPS to monitor the average enqueue ratio between the
tagged and other flows and turn on its function only when the ratio is small. However,
under CBT, in which the tagged threshold can be explicitly set to use a small fraction of
the available queue buffer, this automatic turn on/off function is not really necessary.
When used with D-CBT, the ratio that turns off the ChIPS could be set relatively large

48
(tested for up to 50% in our simulations with the RED minimum threshold of 5 and the
maximum of 15) without degrading the fairness because of the “self-adjusting” ability of
D-CBT. When a relatively large number of tagged flows compete for the bandwidth with
TCP flows, ChIPS could instantly lower the TCP throughputs. However, this will also
lower the average queue length of the queue, and therefore the fair threshold for the
tagged class will be reduced and the tagged class throughput will be reduced as well.
Thus, ChIPS may cause the average queue length to fluctuate a bit more but does not
reduce fairness significantly. Chapter 4 has more detailed results.
Another issue in implementing ChIPS is that the increment of the tagged packet dequeue
rate caused by the insertion could degrade the fairness when the packet enqueue decision
makes use of each class’ buffer usage as in CBT and D-CBT. This faster tagged packet
drain rate is not an issue for RED since it enqueue decision has nothing to do with the
drain rate. However, in CBT and D-CBT, the faster drain rate lowers the average number
of enqueued packets for the tagged class, which could result in the tagged class getting
more bandwidth than its fair share. To prevent this effect, we used a virtual queue for
counting the number of enqueued packets for the UDP classes, in which the class
information of an enqueuing packet is always enqueued at the end, even though ChIPS
cuts a tagged packet in the line of the real queue. In this way, a virtual queue can deceive
the class average counting units by telling that the tagged packets that have been
transmitted already are still in the queue. Thus, the actual tagged packet drain rate does
not affect the calculation of the average number of enqueued packets for the tagged class.

49
Looking at the complexity of the design, ChIPS has O(1) behavior, since the insertion
complexity is O(1) and the virtual queue maintenance complexity is also O(1). We
believe that ChIPS, which noticeably improves tagged flow (flow-controlled multimedia)
jitter, along with D-CBT would further encourage multimedia applications to use a flow
control mechanism. An important issue that is not addressed in this paper is who is going
to monitor and tag the flow-controlled multimedia flows. However, we believe that this
job has to be done in the Internet Service Provider (ISP) level or the local network
management level at the gateways to the public networks, and leave the routers of the
public networks free from this issue. The next chapter presents the simulated
performance and evaluation of the proposed mechanisms.

50
4. Results and Analysis
To evaluate our research approach, the performance of RED, CBT, D-CBT, and D-CBT
with ChIPS are measured and compared in terms of congested link throughput, fairness
among the different classes of flows and multimedia jitter through a series of simulations,
in which TCP, flow-controlled multimedia and unresponsive flows coexist. For the flow-
controlled multimedia traffic sources we used the multimedia traffic generators described
in Chapter 3.1. The first section of this chapter discusses the performance measurement
metrics used for the evaluation, and the second section presents the simulation setup. The
third and the last sections present the simulation results and analysis.
4.1 Performance Measurement Metrics
The objective behind the design of D-CBT and ChIPS is to improve fairness among
different classes of flows and to reduce multimedia jitter. This section presents the
fairness and jitter measurement metrics used to evaluate our proposed mechanism. To
measure the fairness among the three different classes of flows and also to visualize the
fairness among individual flows, we use the following two metrics. The first one is the
direct comparison of the average per-flow throughput in each class, which is an average
aggregated class throughput divided by the number of flows in the class. We believe that
this is a good indicator of how fairly the output bandwidth is assigned to each class
considering the number of flows in the class. However, it does not tell how fairly each
individual flow is assigned of the output bandwidth. Therefore, we use a second fairness

51
measurement metric, called Jain’s fairness index, to visualize the fairness among
individual flows [Ja91]. Figure 4.1.1 shows the formula that calculates Jain’s fairness.
<Figure 4.1.1> Jain’s Fairness ( f ): xi is the average throughput of ith flow
Jain’s fairness formula gets the average throughputs of the flows of which the fairness is
measured as an input, and produces a normalized number between 0 and 1, where 0
indicates the total unfairness and 1 indicates the greatest fairness. However, looking at
the original Jain’s formula, which is used for our fairness calculations, it is hard to see
what it really measures. Therefore, to better understand the formula, we rewrote the
formula into more meaningful form by converting the throughputs of flows into an offset
presentation, in which the throughput of the i th flow is written as throughput of the 0 th
flow (x0) plus the displacement from x0 that is denoted as d i. The derived formula
indicates that the variation on the throughput displacements decreases the index value by
f (x0+d0 , x0+d1 , x0+d2 ,… , x0+dn)
f (x0, x1, x2,… , xn) =( xi )2Σi=0
n
Σi=0n
xi2n
( xi )2Σi=0n
(di - dj)2Σj=i+1nΣi=0
n-1+( xi )2Σi=0
n=
=
(Original)
(Derived)
(Offset Form)
0 ≤ f ≤ 1 (Greatest Fairness)

52
increasing the denominator. Indeed, Jain’s fairness index is a good indicator of how
fairly each flow shares the output bandwidth, since it is the scaled displacement of each
flow’s bandwidth that determines the Jain’s value. For example, when a couple of flows
are severely punished and have far less throughput than the others, the Jain’s fairness
value will decrease dramatically indicating that the system is unfair, although the class
average measurement would show that the system is fair. We decided to use Jain’s
fairness index along with the direct comparison of the per-flow average throughput in
each class to visualize the system’s fairness on each flow as well as on the classes.
<Figure 4.1.2> MultimediaJitter – An Example: Thisfigure models packet videobetween sender and receiver.Each si is the time at whichthe sender transmits videoframe i. Each ri is the timeat which the receiverreceives frame i. [CT99]
Another network system performance factor we want to measure especially for
multimedia streams is the variance in packet delivery or jitter. In a wide area multimedia
networking, jitter, which directly affects multimedia perceptual quality and also can
indirectly increase end-to-end delay, is an important performance factor as well as end-
to-end delay and packet loss [CT99]. Figure 4.1.2 depicts an example of jitter.
sender s0 s1 s2 s3 s4
receiver r0 r1 r2 r3 r4
sender s0 s1 s2 s3 s4
receiver r0 r1 r2 r3 r4
A Jitter Free Stream
A Stream with Jitter

53
“In the absence of jitter and packet loss, video frames can be played asthey are received, resulting in a smooth playout, as depicted in Figure4.1.2-top. However, in the presence of jitter, inter-arrival times will vary,as depicted in Figure 4.1.2-bottom. In Figure 4.1.2-bottom, the thirdframe arrives late at r2. In this scenario, the user would see the frozenimage of the most recently delivered frame (frame two) until the tardyframe (frame three) arrived. The tardy frame (frame three) would then beplayed only briefly in order to preserve the timing for the subsequentframe (frame four).” [CT99]
Jitter introduced by the Internet could degrade a multimedia perceptual quality
significantly especially on video. In order to ameliorate the jitter effect, a receiver could
add a delay in the playout, which is called delay buffering. However, delay buffering
results in increasing of end-to-end delay, which can degrade quality for interactive
multimedia applications.
Now that the impact of jitter on multimedia applications has been discussed, the next
issue is determining its measurement method. First, jitter can be measured in terms of
variance in inter-frame arrival time at the receiver, which is a receiver-oriented
observation on the variance. This is a useful and also an easy measurement method,
since this is what a receiver application actually experiences and what can be easily
measured at the end systems in a real network environment. However, it has a limitation
that when a source application changes it transmission rate or the frame rate often as in
the case of a flow-controlled multimedia application, what it measures may no properly
visualize the effect of the underlying system on jitter. Actually, we used this method in
comparing the performance of TCP and MM_APP on multimedia streams in Chapter 3.1,
in which we showed that TCP is not the choice for the transport agent for the multimedia
applications because of its bursty transmission characteristics. In this case, the method
54
visualized the effect of TCP’s transmission policy well, because the effect was
tremendous. However, more often than not the underlying network system’s effect on
jitter would be relatively smaller than the one contributed by the flow-controlled
application’s transmission policy.
The second method of measuring jitter is in terms of variance in end-to-end delay. This
is a more network-oriented observation of the variance and a direct indicator of a
network, an operating system, or their subsystem’s performance on multimedia streams
compared to the first method, since it eliminates the inter-packet transmission periods of
the source. However, in real environments, it is hard to measure jitter in this way
because of asynchronized clocks of the source and the destination. However, in our
simulation environment where only one logical clock is used for the whole system, it is
very easy to measure actual variance end-to-end delay. Moreover, this method can even
visualize the effect of queuing delays of a single router on jitter well. Therefore, we
decided to use this second method in evaluating the effect of ChIPS on multimedia jitter.
Using the fairness metrics and jitter measurement metric discussed in this section, we
evaluated RED, CBT, D-CBT and D-CBT with ChIPS in terms of fairness in output
bandwidth allocation and multimedia jitter. We also measured the congested link
throughput to visualize the effect of the mechanisms on the link utilization. However,
since this is very primitive and well-known metric, it is not discussed in this section. The
next section presents the simulation setup in detail.

55
4.2 Simulation Setup
The purpose of this simulation study is twofold. The first purpose is to measure the
effect of RED, CBT and D-CBT on congested link utilization and fairness when different
classes of flows coexist. The second purpose is, by comparing the performance of D-
CBT and D-CBT with ChIPS, to see if ChIPS affects fairness and/or improves jitter. We
ran a simulation for each of RED, CBT, D-CBT and D-CBT with ChIPS. Every
simulation had the exactly same settings except for the network routers, each of which is
set to use one of the above four outbound queue management mechanisms. The network
topology and the traffic source schedules are shown in Figure 4.2.1.
<Figure 4.2.1> Simulation Scenario and Network Setup
s1
n1
s2
s66
s67
n2
r2
r2
r66
r67
25Mbps, 20ms
25Mbps, 5ms25Mbps, 5ms
0 10 20 30
25 FTP-TCP
30 FTP-TCP
2 CBR-UDP(5Mbps each)
10 MM-UDP
(Second)
n1-n2: q_size = 60
RED: max_ th = 15 min_ th = 5 qweight = 0.002 max_ prb = 0.1
CBT: mmu_th = 2.9 udp_th = 0.6

56
In each simulation, we had 67 source nodes connected to one router and 67 destination
nodes connected to the other router, which are interconnected by a link with 25Mbps
bandwidth and 20ms of delay. Each link that connects a source (or destination) node and
a router was set to have 25Mbps of bandwidth and 5ms of delay. For traffic sources, 55
FTP, 10 flow-controlled MM_APP (tagged) and 2 CBR (untagged) traffic generators
were used, where FTP used TCP Reno and the others used UDP as the underlying
transport agent. All the TCP agents were set to have a maximum congestion window size
of 20 packets and maximum packet size of 1Kbyte, with which a TCP agent could
transmit at the average rate of up to 4.6Mbps (the calculation is based on the average
queue size of 15 packets). The UDP agents are also set to have maximum packet size of
1Kbyte, so that all the packets in the network are the same size. The MM_APP traffic
generators (flow-controlled multimedia applications) used the transmission rates shown
in Table 3.1.1 (Chapter 3.1), that is 300, 500, 700, 900, 1100 Kbps, for scale 0 to 4
transmission rates, with the fixed packet size of 1Kbyte. The CBR sources were set to
generate 1Kbyte packets at 5Mbps.
We scheduled the traffic sources such that 25 TCP flows and 10 MM_APP flows are
competing for the bandwidth during 0 to 10 seconds. At this period the fair bandwidth
share for each connection is about 714Kbps (25Mbps / 35 flows). In the next period (10
to 20 seconds), the two high bandwidth CBR blasts join trying to aggressively use the
output bandwidth of which the average fair share was about 675Kbps (25Mbps / 37
flows). Later at 20 seconds, 30 more TCP flows came into the network lowering the
average fair share during the last 10 seconds to about 373Kbps (25Mbps / 67 flows).

57
Network routers were assigned of a 60-packet long physical outbound queue. For RED
queue management, the maximum and minimum thresholds were set to 15 and 5 packets,
the weight for the weighted queue average was set to 0.002, and the maximum early drop
probability was set to 0.1. These RED parameters were chosen from one of the sets that
are recommended by Floyd and Jacobson [RK99]. For CBT, beside the RED parameters,
the tagged threshold (denoted as mmu_th in the figure) was set to 2.9 packets and the
untagged threshold (denoted as udp_th) was set to 0.6 packets. These thresholds were
selected to force the UDP classes to get about their fair bandwidth shares during 0 to 20
seconds. Assuming the average queue size is 10 packets, by reserving an average of 2.9-
packet space, the tagged class could get an average bandwidth of 7250Kbps (25Mbps *
2.9 / 10) at congestion, which is about 10 times (10 tagged flows) the fair share during 0
to 10 seconds. Likewise, by reserving 0.6-packet space in the queue, the untagged class
could get an average of 1500Kbps, that is little bit more than 2 times (2 untagged flows)
the fair share during 10 to 20 seconds.
D-CBT also shares the RED settings, however, since each threshold is assigned
dynamically to the fair share of each class, no threshold setup was necessary. Finally,
ChIPS was set to turn off its cut-in scheduling feature when the ratio between the number
of tagged flows and the other flows are greater than 50%. However, under our
simulation, ChIPS was always on since the ratio was always under 50 %.
Thus, the simulations were designed to give an environment under which every queue
management mechanism manages output bandwidth fairness during the first 10 seconds,

58
RED fails during the second 10 seconds, and CBT fails during the last 10 period. Then,
we wanted to see if D-CBT could dynamically offer fair bandwidth allocation in every
situation. Also, by comparing the results (fairness and jitter) of D-CBT with ChIPS with
the basic D-CBT, we could measure the effect of ChIPS on fairness and multimedia jitter.
The next two sections present the simulation results and analysis.
4.3 Throughput and Fairness
This section presents our simulation results and analysis on RED, CBT, D-CBT and D-
CBT with ChIPS. In the first part of the section, the fairness of the mechanisms in
managing bandwidth is shown using the fairness measurement metrics discussed in
Section 4.1. Then, we showed the efficiency of the mechanisms in utilizing the output
bandwidth by visualizing the congested link throughput.
4.3.1 Class’ Average Per-Flow Throughput
Figure 4.3.1 (a) through (d) in the next page compares the periodic (i.e., 0-10, 10-20 and
20-30 seconds) average per-flow throughput for each class under the four queue
mechanisms.

59
(a) RED (b) CBT
(c) D-CBT (d) D-CBT with ChIPS
<Figure 4.3.1> Average Per-Flow Throughput for TCP, Tagged UDP andUntagged UDP Classes under RED, CBT, D-CBT and D-CBT with ChIPS
As shown in Figure 4.3.1 (a), RED absolutely failed to assign bandwidth fairly to each
class of flows from 10 seconds when the two high bandwidth untagged UDP flows
(unresponsive CBR) join transmitting at the total of 10Mbps, about 40% of the link
bandwidth. During 0-10 seconds, when 25 TCP and 10 tagged (flow-controlled
MM_APP) flows are competing for the bandwidth, it was somewhat unfair as a tagged
flow gets an average of 37% more bandwidth than a TCP flow, but RED was able to
RED: Class Average Per-Flow Throughput
537293 161
851 720 601
46814503
0
500
1000
1500
2000
2500
3000
3500
4000
4500
5000
0 ~ 10 Sec 10 ~ 20 Sec 20 ~ 30 Sec
Kbp
s TCPTAG_UDPUTAG_UDP
D-CBT: Class Average Per-Flow Throughput
622659
356
653 660
378
637
313
0
100
200
300
400
500
600
700
800
900
1000
0 ~ 10 Sec 10 ~ 20 Sec 20 ~ 30 Sec
Kbp
s TCPTAG_UDPUTAG_UDP
D-CBT with ChIPS: Class Average Per-Flow Throughput
608666
355
673 664
384
563
297
0
100
200
300
400
500
600
700
800
900
1000
0 ~ 10 Sec 10 ~ 20 Sec 20 ~ 30 Sec
Kbp
s TCPTAG_UDPUTAG_UDP
CBT: Class Average Per-Flow Throughput
587 613
305
760 739
657624
318
0
100
200
300
400
500
600
700
800
900
1000
0 ~ 10 Sec 10 ~ 20 Sec 20 ~ 30 Sec
Kbp
s TCPTAG_UDPUTAG_UDP

60
manage the bandwidth. However, when the untagged UDP blast came into the system,
RED was totally unable to manage bandwidth. The 2 untagged UDP flows got most of
the bandwidth they needed (average of 4.68Mbps out of 5Mbps), and the remaining flows
used the leftover bandwidth. Especially, the 25 TCP flows got severely punished and
transmitted at an average of 293Kbps per flow. An interesting observation here is that
the tagged (MM_APP) flows were not punished much but each flow in average was
transmitting (720Kbps) over the fair share of the second period, that is 675Kbps. This
was mainly because TCP (Reno) often failed to perform fast recovery and went back to
slow start mode [rfc2001], and/or even timed out due to a high packet drop rate at the
router. Fairness got worse as 30 more TCP flows joined at 20 seconds, and experienced
starvation.
Figure 4.3.1 (b) shows that CBT can avoid the great unfairness of RED using fixed
thresholds for the UDP classes. However, CBT was not assigning the output bandwidth
to each class as expected. When designing the simulation, we set the UDP thresholds
such that during 0-10 seconds each tagged UDP flow should get 725Kbps (7250Kbps /
10) in average. During 10-20 seconds, we expected that each tagged flow’s average
bandwidth would remain the same and each untagged UDP flow would get an average of
750Kbps (1500Kbps / 2). Also, we expected that during the last period (20-30 seconds),
the tagged and untagged flows would get a large portion of the bandwidth that is close to
the figure during 10-20 seconds and the TCP flows would get much less than the fair
share during this period. However, the simulation result shows that the tagged UDP class

61
got more bandwidth than the expected values especially during the last period, while the
untagged UDP class got much less bandwidth than expected.
We found out that this is mainly due to how and when CBT updates each UDP class
threshold and RED queue average. As shown in Figure 3.2.2 (Chapter 3.2), CBT updates
each UDP class average only for incoming packets that belong to the class, and the RED
unit updates its queue average for all incoming TCP packets and for UDP packets that
passed an appropriate threshold test. Therefore, the class averages and the RED queue
average are almost independently updated at different speeds that are closely related the
number of incoming packets that belong to the class. In addition, the RED average has a
higher chance of being updated faster than the UDP class averages. In this situation,
which we call unsynchronized weighted-average updates, whoever (i.e. a class) updates
its weighted-average more often will get less bandwidth by having a larger weighted-
average than the average of others for the same amount of class output bandwidth, and
the output bandwidth is controlled using the averages at the UDP threshold test units.
Figure 4.3.2 shows this effect by comparing two situations where a UDP class that has an
initial class weighted-average of 1, a weight of 0.1 and a class threshold of 1.02, is
experiencing two different incoming packet rates. Figure 4.3.2 (a) is the case when the
incoming packet rate is 0.5 packets per packet transmission delay, and Figure 4.3.2 (b) is
the case when the class is receiving packets at the rate of 1.0 packets per packet
transmission delay. In this example, it is assumed that the traffic sources are
unresponsive CBR applications. One thing to note in the figure is that the class average

62
shown at the left bottom of each queue in each state is its value before making the
enqueue admission decision for an incoming packet at that state. As you can see in the
figure, as the number of incoming packets for a class increases, packets are enqueued in a
bursty manner, and more importantly, its class average gets larger. As the average is
updated more frequently, not only is a newly enqueued packet added to the average (with
the weight of 0.1), but also the existence of the other already enqueued packet are added
to the average. For example, the existence of the first (red colored) packet is added to the
average (with the weight of 0.1) 2 times more for the second situation than for the first
situation.
<Figure 4.3.2> A CBT Class’s Weighted Average underTwo Different Incoming Packet Rates
(b) Incoming Packet Rate = 1.0 pkts / pkt-transmission-delay(Dropped packets are not shown)
(a) Incoming Packet Rate = 0.5 pkts / pkt-transmission-delay

63
The weighted-average calculation method works fine when the purpose of measuring an
average queue size is to detect impending congestion as in RED. However, when the
method is used to assign bandwidth to different classes of flows by comparing each class’
weighted-average number of enqueued packets, special care is needed in deciding how
and when to measure the averages. We have determined that all the weighted-averages
should be updated at the same time and at an equal frequency to give a correct output
bandwidth utilization ratio among the classes. In the case of CBT, by measuring each
UDP class average and the RED average independently, the classes’ bandwidth
utilization could not measured correctly by comparing the class averages. By comparing
the fairness measurement in Figure 4.3.1 (b) and the CBT’s outbound queue averages in
Figure 4.3.3, especially for 20-30 seconds, one can easily see that CBT’s attempt of using
unsynchronously updated weighted-averages to regulate class bandwidth was misleading.
Figure 4.3.3 indicates that during 20-30 seconds, 10 tagged flows used an average of
about 2.5 packet-spaces in the queue that is 0.25 packet-spaces per each flow, and the 2
untagged flow used an average of about 0.6 packet-spaces that is 0.3 packet-spaces per
each flow. However, as shown in Figure 4.3.1 (b), each tagged flow used about 657
Kbps of bandwidth and each untagged flow used about 318 Kbps, about one half of the
per-flow bandwidth of a tagged flow.

64
<Figure 4.3.3> CBT Queue Averages: The ratio between the averages doesnot correctly indicate the ratio between each class’ average bandwidthutilization because of the effect of unsynchronized weighted-average updates.
From the above observation, we conclude that the current CBT design can only prevent a
great unfairness caused by unresponsive or misbehaving flows, and it needs some
adjustment on weighted-average calculation. Indeed, we tried the average calculation
method that is used in D-CBT in CBT and got a much better result, that is the ratio
between the three averages indicates the ratio between the actual classes’ bandwidth
utilization. However, we did not include the result in this paper, since the method is used
in only D-CBT and we are presenting D-CBT in the next paragraph.

65
Figure 4.3.1 (c) shows the D-CBT result, which indicates that D-CBT fairly manages
bandwidth during all periods by dynamically allocating the right amount of output queue
space to each flow class. It also shows that by updating each class and RED average at
the same time in a synchronized manner, the ratio between the averages is a good
indicator of the ratios between each class’ bandwidth utilization. One thing to note in the
figure is that although we strictly regulate the untagged class by assigning a fair threshold
calculated from RED’s minimum threshold, the untagged class did get most of its share.
This is because the high bandwidth untagged (unresponsive) packets were allowed to
enter the queue without its threshold test, when RED indicated no congestion. As a
reference, we show the queue averages of D-CBT in Figure 4.3.4, in which each class
average is actively moving proportional to RED’s average.
<Figure 4.3.4> D-CBT Queue Averages

66
Figure 4.3.1 (d) shows the result of D-CBT with ChIPS. The result confirms that ChIPS,
when used with D-CBT, does not affect fairness between each class of flows, due to the
virtual queue and D-CBT’s self adjusting capability described in Section 3.3.3. In the
simulation, the ratio between tagged flows and all flows was about 28% during 0-20
seconds, and was about 15% during the last 10 seconds. The next section presents the
fairness measurement of the simulations using Jain’s Fairness index, which visualizes
system’s fairness on individual flows in a normalized number.
4.3.2 Jain’s Fairness Measurement
Figure 4.3.5 shows the simulated systems’ fairness on individual flows using Jain’s
Fairness Index, where the periodic (0-10, 10-20 and 20-30) average throughput of each
individual flow was given as input to the original Jain’s equation.
<Figure 4.3.5> Jain’s Fairness Comparison
Jain's Fairness
0.00.10.20.30.40.50.60.70.80.91.0
0 ~ 10 Sec 10 ~ 20 Sec 20 ~ 30 Sec
REDCBTD-CBTD-CBT-ChIPS

67
The Jain’s fairness measurement shows that the simulated system that use RED queue
management fails to fairly assign bandwidth to each individual flow from 10 seconds
when the unresponsive flows join in the system. The low Jain’s index value for the RED
system indicates that some flows are experiencing severe starvation during 10-20 seconds
and even more severe during 20-30 seconds when 30 extra TCP flows join.
The system that uses the CBT queue management mechanism was fair overall in
distributing bandwidth to each flow. However, during 20-30 seconds, the system’s
fairness was degraded because the 10 tagged (multimedia) flows got about twice as much
bandwidth as the other flows. One thing to note is that the CBT’s fairness was
engineered. In a circumstance where traffic mixes change a lot, CBT might show more
degraded fairness.
On the other hand, the systems that use D-CBT or D-CBT with ChIPS were dynamically
adjusting to changing flow mixes, and were very fair not only to the classes of flows but
also to individual flows as Jain’s index numbers indicate. The Jain’s fairness
measurement results on D-CBT and D-CBT with ChIPS also reconfirmed that ChIPS did
not degrade the system’s fairness. The next section shows the congested link utilization,
and the section after presents the improved multimedia jitter performance of the system
that used ChIPS.

68
4.3.3 Congested Link Utilization
In the previous section, we showed that D-CBT and D-CBT with ChIPS outperforms
RED and CBT in term of fairness in managing bandwidth. However, the ability of a
system to exercise fairness without efficiently utilizing available resources is not always
acceptable. Therefore, to compare efficiency of D-CBT and D-CBT with ChIPS with
that of RED and CBT, we present the congested link throughput for the simulated
systems.
(a) RED (b) CBT
(c) D-CBT (d) D-CBT with ChIPS
<Figure 4.3.6> Congested Link Utilization (Throughput)
RED: Congested Link Utilization
0
5
10
15
20
25
30
0 10 20 30
Seconds
Mbp
s
0~10 Avg (22.29 Mbps)
10~20 Avg (24.28 Mbps)
20~30 Avg (24.58 Mbps)
0~30 Avg (23.72 Mbps)
D-CBT: Congested Link Utilization
0
5
10
15
20
25
30
0 10 20 30
Seconds
Mbp
s
0~10 Avg (22.43 Mbps)
10~20 Avg (24.77 Mbps)
20~30 Avg (24.86 Mbps)
0~30 Avg (24.02 Mbps)
D-CBT with ChIPS: Congested Link Utilization
0
5
10
15
20
25
30
0 10 20 30
Seconds
Mbp
s
0~10 Avg (22.29 Mbps)
10~20 Avg (24.82 Mbps)
20~30 Avg (24.85 Mbps)
0~30 Avg (23.99 Mbps)
CBT: Congested Link Utilization
0
5
10
15
20
25
30
0 10 20 30
Seconds
Mbp
s
0~10 Avg (22.68 Mbps)
10~20 Avg (24.37 Mbps)
20~30 Avg (24.81 Mbps)
0~30 Avg (23.95 Mbps)
69
Figure 4.3.6 shows that the efficiency of the systems that use D-CBT or D-CBT with
ChIPS was comparable with that of the systems that use RED or CBT. All the systems
get to a stable state within few seconds after the start of the simulation, and generally
used the link bandwidth up close to the maximum. During 10-30 seconds when the UDP
flows joined, D-CBT and D-CBT with ChIPS were even a bit more efficient than RED
and CBT. This was mainly because UDP packets were admitted without its threshold test
and without forcing packets from responsive connections (i.e. TCP or Tagged UDP) to be
dropped, when the RED unit indicates no congestion.
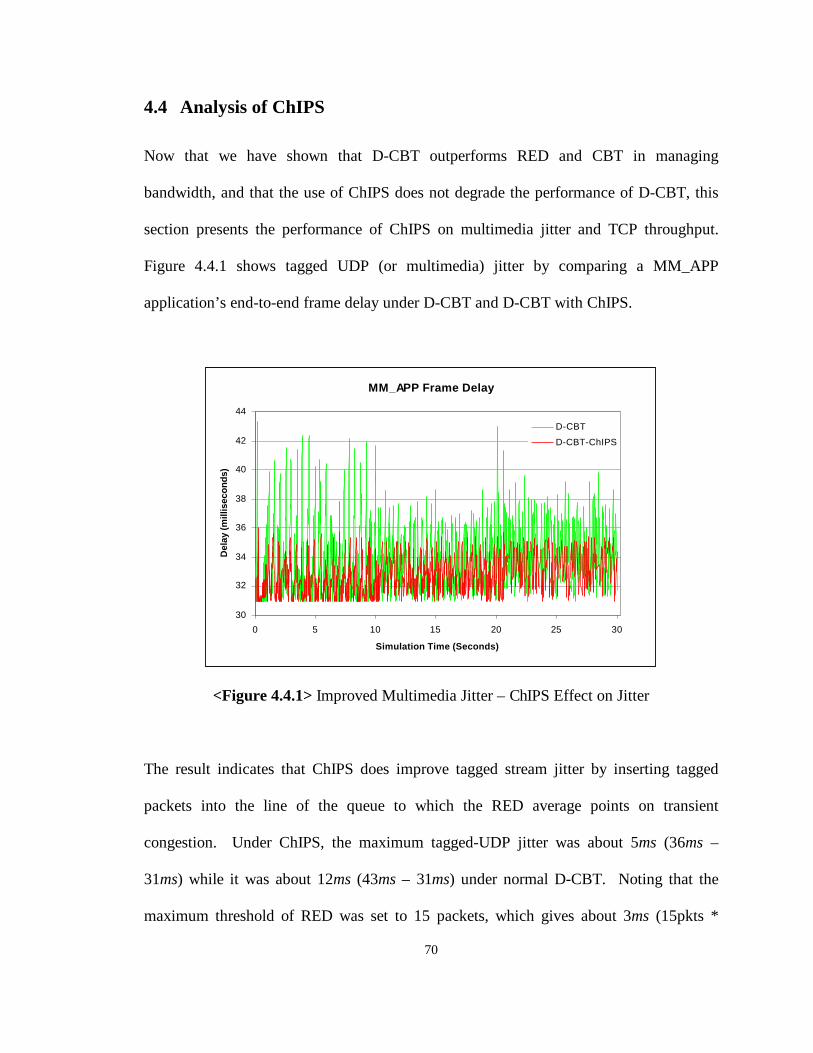
70
4.4 Analysis of ChIPS
Now that we have shown that D-CBT outperforms RED and CBT in managing
bandwidth, and that the use of ChIPS does not degrade the performance of D-CBT, this
section presents the performance of ChIPS on multimedia jitter and TCP throughput.
Figure 4.4.1 shows tagged UDP (or multimedia) jitter by comparing a MM_APP
application’s end-to-end frame delay under D-CBT and D-CBT with ChIPS.
<Figure 4.4.1> Improved Multimedia Jitter – ChIPS Effect on Jitter
The result indicates that ChIPS does improve tagged stream jitter by inserting tagged
packets into the line of the queue to which the RED average points on transient
congestion. Under ChIPS, the maximum tagged-UDP jitter was about 5ms (36ms –
31ms) while it was about 12ms (43ms – 31ms) under normal D-CBT. Noting that the
maximum threshold of RED was set to 15 packets, which gives about 3ms (15pkts *
MM_APP Frame Delay
30
32
34
36
38
40
42
44
0 5 10 15 20 25 30
Simulation Time (Seconds)
Del
ay (m
illis
econ
ds)
D-CBT
D-CBT-ChIPS

71
8Kbits / 25Mbps) of queuing delay, ChIPS was able to regulate the maximum tagged
stream jitter around the queuing delay of the RED’s maximum threshold.
We believe that ChIPS effect on improved multimedia jitter could be very significant
because of the following two reasons. First, what we show in Figure 4.4.1 is the jitter
gain due to a single router. Assuming that a multimedia connection that is configured
similar to our multimedia traffic generator has to go through 10 routers that use D-CBT
with ChIPS and set the maximum threshold of RED to 15. In this environment, the
application can almost completely remove the jitter effect on perceptual quality by using
a delay buffer of only 50ms, while it would be extremely difficult to determine the
optimal amount of the playout delay under the traditional Internet environment. Second,
in the simulation, we used multimedia frames that are the same size as that of a network
packet, meaning that no frame fragmentation occurs in the IP layer. Assuming that a
multimedia application uses frames that are larger than a network packet and are chopped
into multiple packets in the network, the jitter improvement due to ChIPS could be even
more significant, since the multimedia packets have better chance to be transmitted close
to each other at routers. Thus, we believe that the potential of ChIPS to improve
multimedia jitter is larger than shown in our experiments.
In summary, we present TCP packet accounting and tagged packet accounting for the
simulation in Table 4.4.1 and Table 4.4.2. Table 4.4.1 shows the TCP packet drop rate
and throughput under ChIPS is very compatible with those of basic D-CBT. The TCP
throughput under ChIPS was about 99.6% of the throughput under basic D-CBT. This
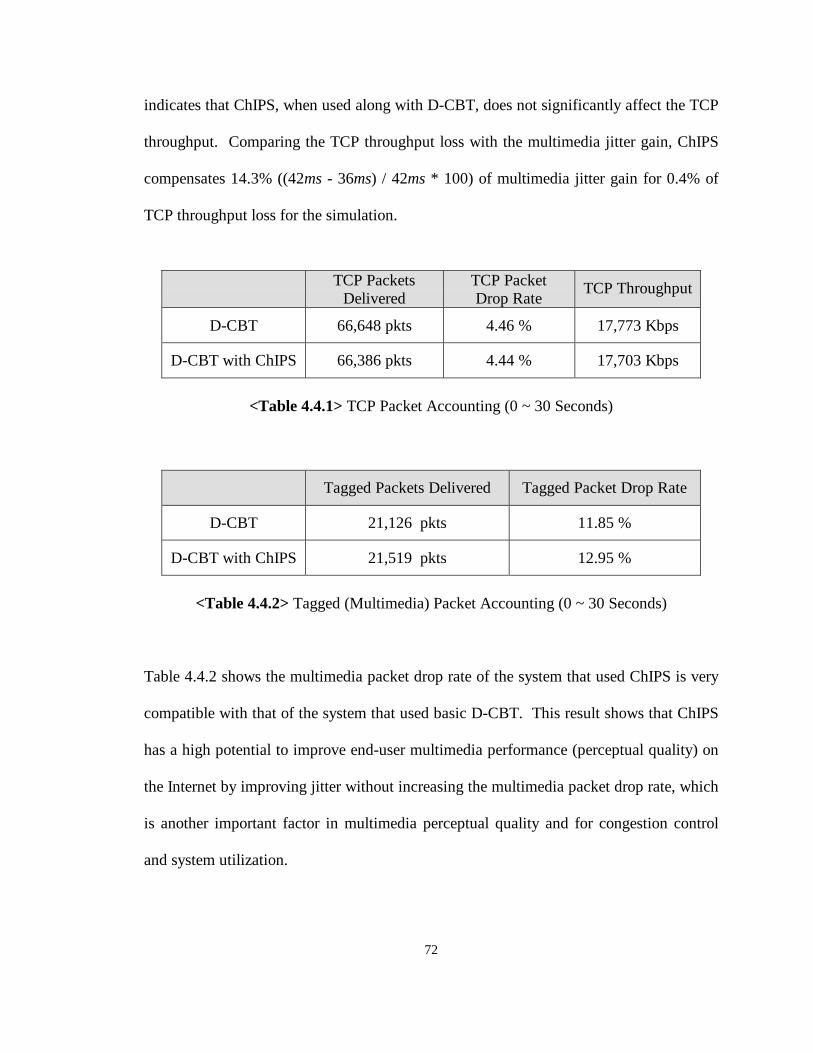
72
indicates that ChIPS, when used along with D-CBT, does not significantly affect the TCP
throughput. Comparing the TCP throughput loss with the multimedia jitter gain, ChIPS
compensates 14.3% ((42ms - 36ms) / 42ms * 100) of multimedia jitter gain for 0.4% of
TCP throughput loss for the simulation.
TCP PacketsDelivered
TCP PacketDrop Rate
TCP Throughput
D-CBT 66,648 pkts 4.46 % 17,773 Kbps
D-CBT with ChIPS 66,386 pkts 4.44 % 17,703 Kbps
<Table 4.4.1> TCP Packet Accounting (0 ~ 30 Seconds)
Tagged Packets Delivered Tagged Packet Drop Rate
D-CBT 21,126 pkts 11.85 %
D-CBT with ChIPS 21,519 pkts 12.95 %
<Table 4.4.2> Tagged (Multimedia) Packet Accounting (0 ~ 30 Seconds)
Table 4.4.2 shows the multimedia packet drop rate of the system that used ChIPS is very
compatible with that of the system that used basic D-CBT. This result shows that ChIPS
has a high potential to improve end-user multimedia performance (perceptual quality) on
the Internet by improving jitter without increasing the multimedia packet drop rate, which
is another important factor in multimedia perceptual quality and for congestion control
and system utilization.

73
5. Future Work
As shown in Chapter 4, our queue management approaches (D-CBT and ChIPS) were
mostly examined from the viewpoint of the network, concentrating on fairness and
multimedia jitter. However, there still remain many performance aspects to be evaluated.
The first research would be to extend this study to evaluate D-CBT and ChIPS with TCP
Vegas, especially on fairness and TCP throughput. The second research would be to
evaluate D-CBT and ChIPS under the environment where fragile and robust TCP
connections as well as multimedia connections with different end-to-end delay coexist in
the system.
The third essential research would be to extend this study to evaluate the limitation of
ChIPS on the fairness and the link utilization offered by D-CBT. As denoted earlier in
Chapter 3.3.2, ChIPS introduces an additional delay to other traffic which may affect
TCP throughput. Therefore, in order for the use of ChIPS to be more practical, future
work suggests an extended study to determine the maximum average ChIPS enqueue
ratio between tagged and the other classes of flows without degrading fairness or link
utilization. Another study that we could not do due to the lack of time but suggest as a
future work is to compare the performance of the D-CBT with that of FRED. We expect
that CBT could give better throughput performance for tagged UDP flows than FRED,
since it frees flow-controlled multimedia flows from the strict per-flow punishment.
74
Another area for future work is measure of D-CBT and ChIPS on jitter, packet and/or
frame drop rates and the drop patterns for current Internet multimedia applications in
order to evaluate the effect on perceptual quality. This work would involve a user study
as well as a network performance study, and could be carried out in two ways. The first
approach is through simulations using NS, which may require implementing application
behavior of real world such as MPEG-2 or H.261 into NS. The second approach is
through experiments. This requires implementing D-CBT and ChIPS into an operating
system’s kernel such as Linux, which is currently a standalone project. Andrew Chillar,
Nicolas Leazard, Miguel Maldonado and Edwin Mercado are implementing the
mechanisms into a Linux kernel as their Major Qualifying Project (MQP), which is a
senior project at Worcester Polytechnic Institute (WPI) [CLM+00].
Another area for future work is combining simulation techniques with experiments.
Currently, NS is starting to support emulation, in which a machine running the simulator
gets a stream of packets from a host through a network interface, simulates a network
adding its effects to the stream and passes it to another host. Although it may sound
attractive, emulation has a limitation that the size and capacity of a network that NS can
emulate is strictly determined by the processing power of the machine. For example,
simulating the network shown in Chapter 4 took much more than the simulated time
under the Linux powered Intel Pentium 200Mhz machine with 64M memory and a
relatively slow hard disk drive. However, it appears that emulating a small size network
is more than possible even with low performance machines such as the one we used, and
offers lots of options to researchers. For example, in experiments, it is hard to generate a

75
relatively large link delay. But using emulation this job can be simply done by setting up
a virtual network of two nodes that is connected by a link with desired delay.
The last future work that may be interesting is to apply the dynamic three-class
bandwidth management concept of D-CBT into Class-Based Queuing (CBQ) [FJ95, Fl].
This would be similar to variety of Fair Queuing (FQ) [DH90] in that the output
bandwidth is dynamically managed. However, the mechanism, say D-CBQ, is different
from common FQ mechanisms in that bandwidth management is done in class level, and
thus reduces the overhead of per-flow accounting. It appears that CBQ is a mechanism
that could possibly offer a significant improvement for multimedia jitter due to its packet
or link scheduling. However, the downside of CBQ is the complexity of the scheduling
that supports hierarchical queues, its potential unfairness in bandwidth management and
lack of a congestion avoidance mechanism. Therefore, reinforcing its fairness with a
simple three-class dynamic scheduling and adding an appropriate congestion avoidance
mechanism to the queues for responsive flows could be a very interesting combination.

76
6. Conclusion
In this thesis, we have presented the design and evaluation of our proposed router queue
mechanisms, Dynamic Class-Based Threshold (D-CBT) and Cut-In Packet Scheduling
(ChIPS), by comparing their performance with that of RED and CBT. D-CBT is a new
active queue management mechanism that addresses the problem of fairness by grouping
flows into TCP, tagged (flow-controlled multimedia) UDP and untagged (other) UDP
classes and regulating the average queue usage of the UDP classes to their fair shares.
ChIPS is a multimedia-favored lightweight packet scheduling mechanism that can
substitute the FCFS enqueue style packet scheduling part of a RED-managed queue for
D-CBT and possibly for other RED-like queue mechanisms.
Prior to the evaluation, we built a general purpose and a trace driven MPEG-1
multimedia traffic generator that use a rate-based flow control mechanism since NS did
not support such traffic generators, while tagged multimedia flows were essential to
evaluate D-CBT and ChIPS. While designing and testing the multimedia traffic
generators trying to make their congestion response behavior similar to TCP, we found
out that multimedia applications that use a rate-based flow control mechanism can be
greedier than TCP that uses a window-based mechanism. This is because a rate-based
multimedia application will inject packets into the network at the rate lastly determined
while TCP could be waiting for ACK packets after transmit up to the congestion window
size, or even get timed out. However, we found a strong reason why multimedia
applications today do not want to use TCP as the underlying transport agent. That is,
77
TCP’s bursty transmission policy introduces high jitter, and the fact that it does not
separate flow control from loss recovery gives possibly unbounded delays.
After developing the traffic generators, we implemented CBT, D-CBT and ChIPS on NS,
and validated CBT by simulating previous CBT experiments. Then, we compared the
performance of RED, CBT, D-CBT and D-CBT with ChIPS under heterogeneous traffic
mixes in which tagged flows were generated with the general-purpose multimedia
application. In the comparison, we primarily focused on fairness and congested link
utilization in order to evaluate the improved performance of D-CBT and to measure
ChIPS effect on fairness and link utilization. Also, we measured and compared tagged
multimedia jitter and packet drop rate for the systems that use D-CBT and D-CBT with
ChIPS.
As expected, RED, that has shown to be fair among TCP, showed an extreme unfairness
with mixed traffic. The result showed that under RED, high bandwidth unresponsive
flows get most of the bandwidth up to close to their transmission rates while TCP flows
suffer from severe starvation. CBT that uses a fixed threshold on UDP classes was able
to avoid extreme unfairness. However, during the analysis, we found that CBT has a
potential defect in its design, which we refer to as “unsynchronized weighted-average
updates”. That is, the ratio between independently updated UDP class averages and RED
average does not correctly indicate the actual class bandwidth utilization ratio, since
whichever flows updates the average more frequently will have higher weighted-average
than the others will, although they all use the same amount of bandwidth. Therefore, in

78
CBT, bandwidth utilization ratio between each class was not only determined by the UDP
thresholds but also considerably affected by the number of incoming packets that
belonged to each class.
D-CBT fixes CBT’s problem by dynamically determining the UDP thresholds to
cooperate with RED by fairly assigning the output bandwidth to each class for all traffic
mixes. The simulation result shows that ChIPS, when used with D-CBT, does not
degrade the fairness when the packet enqueue ratio between tagged and other flows are
about 30%, and improves tagged (flow-controlled multimedia) jitter significantly. Table
6.1.1 shows summary of our results.
Fair to TCP Fair to Mixed(Fixed)
Fair to Mixed(Variable)
Improve MMJitter
RED 3
CBT 3 3
D-CBT 3 3 3
D-CBTw/ ChIPS
3 3 3 3
<Table 6.1.1> Comparison of the Queue Mechanisms ( 3= yes )
Thus, we have shown that D-CBT, through the class-based accounting, protects TCP
from the effect of UDP flows and also fairly protects tagged UDP flows from untagged
flows. We also have shown that ChIPS can improve multimedia jitter without degrading
the fairness. Further contributions we made through this thesis are the design and

79
implementation of two flow-controlled multimedia traffic generators in NS as well as D-
CBT and ChIPS, and the first study of multimedia jitter due to network queue
management policy.
80
7. References
[AL97] Ahonen, J. and Laine, A., “Realtime speech and voice transmission on theInternet”, In Proceedings of the HUT Internetworking Seminar,Department of Computer Science, Helsinki University of Technology,Espoo, Finland, May 1997, URL: http://www.tcm.hut.fi/Opinnot/Tik-110.551/1997/seminar_paper.html
[AP97] Anttila, I. And Paakkunainen, M., “Transferring real-time video on theInternet”, In Proceedings of the HUT Internetworking Seminar,Department of Computer Science, Helsinki University of Technology,Espoo, Finland, May 1997, URL: http://www.tcm.hut.fi/Opinnot/Tik-110.551/1997/iwsem.html
[BRS99] Balakrishnan, H., Rahul, H. S. and Seshan, S., “An Integrated CongestionManagement Architecture for Internet Hosts”, In Proceedings ofSIGCOMM ’99, Cambridge, MA, September 1999
[CLM+00] Chiller, A., Leazard, N., Maldonado, M. and Mercado E.,“Implementation of Dynamic CBT”, MQP-MLC-DC99, Spring 2000
[CT99] Claypool, M. and Tanner, J., “The Effects of Jitter on the PerceptualQuality of Video”, ACM Multimedia Conference, Volume 2, Orlando, FL,October 30 - November 5, 1999
[DH90] Davin, J. R. and Heybey, A. T., “A Simulation Study of Fair Queueingand Policy Enforcement”, Computer Communication Review, Vol. 20,No. 5, pp. 23-29, October 1990
[DHH+93] Delgrossi, L., Halstrick, C., Hehmann, D., Herrtwich, R. G., Krone, O.,Sandvoss, J. and Vogt, C., “Media Scaling for AudiovisualCommunication with the Heidelberg Transport System”, In Proceedingsof the conference on Multimedia ’93, Anaheim, CA, August 1993
[FF96] Floyd, S. and Fall, K., “Simulation-based Comparisons of Tahoe, Reno,and SACK TCP”, Computer Communication Review, V.26 N.3, July1996, pp. 5-21
[FF97] Floyd, S. and Fall, K., “NS Simulator Tests for Random Early Detection(RED) Queue Management”, Lawrence Berkeley Laboratory, OneCyclotron Road, Berkeley, CA 94704, April 29, 1997

81
[FF98] Floyd, S. and Fall, K., “Promoting the Use of End-to-End CongestionControl in the Internet”, IEEE/ACM Transactions on Networking,February 1998
[FJ93] Floyd, S. and Jacobson, V., “Random Early Detection Gateways forCongestion Avoidance”, IEEE/ACM Transactions on Networking, August1993
[FJ95] Floyd, S. and Jacobson, V., “Link-sharing and Resource managementModels for Packet Networks”, IEEE/ACM Transactions on Networking,Vol. 3 No. 4, August 1995
[Fl] Floyd, S., “References on CBQ (Class-Based Queueing)”, URLhttp://www-nrg.ee.lbl.gov/floyd/cbq.html
[Fl94] Floyd, S., “TCP and Explicit Congestion Notification”, ComputerCommunication Review, October 1994
[GBC98] Gerek, J., Buchanan, W. and Claypool, M., “MMLIB – a library for end-to-end simulation of multimedia over a WAN”, Technical Report MQPMLC-ML98, Worcester Polytechnic Institute, May 1998
[GP97] Guo, X. and Pattinson, C., “Quality of Service Requirements forMultimedia Communications”, In Proceedings of Time and the WebWorkshop, Staffordshire University, Staffordshire, UK, June 1997,appeared in SIGCHI Bulletin, January 1998, URL:http://www.soc.staffs.ac.uk/seminars/web97/papers/guo.html
[Ha97] Handley, M., “An Examination of Mbone Performance”, USCInformation of Science Institute Research Report: ISI/RR-97-450, 1997
[HSK98] Hardman, V., Sasse, M. A. and Kouvelas, I., “Successful MultipartyAudio Communication”, Communications of the ACM, May 1998, vol.41, No. 5
[Ja91] Jain, R., “The Art of Computer Systems Performance Analysis:Techniques for Experimental Design, Measurement, Simulation, andModeling”, John Wiley & Sons, Inc., New York, NY, 1991
[Jv88] Jacobson, V., “Congestion Avoidance and Control”, In Proceedings ofSIGCOMM ’88, Stanford, CA, August 1988
[LC00] Liu, Y. and Claypool, M., “Using Redundancy to Repair Video Damagedby Network Data Loss”, In Proceedings of IS&T/ACM/SPIE MultimediaComputing and Networking 2000 (MMCN00) January 25-27, 2000. SanJose, California, USA

82
[lc95] Multimedia Communications Forum, Inc. “Multimedia CommunicationsQuality of Service”, MMCF/95-010, Approved Rev 1.0, 1995, URL:http://www.luxcom.com/library/2000/mm_qos/qos.htm
[LM97] Lin, D. and Morris R., “Dynamics of Random Early Detection”, InProceedings of SIGCOMM ’97, Cannes, France, September 1997
[MPFG97] Mitchell, J.L., Pennebaker, W.B., Fogg, C.E. and LeGall, D.J., "MPEGVideo Compression Standard", In Digital Multimedia Standards Series,Chapman & Hall, New York, NY, 1997
[NJZ97] Nichols, K., Jacobson, V., Zhang, L., “Two-bit Differentiated ServicesArchitecture for the Internet”, Internet draft, work in progress, 1997
[ns2] VINT, “Virtual InterNetwork Testbed, A Collaboration among USC/ISI,Xerox PARC, LBNL, and UCB”, URL: http://netweb.usc.edu/vint/
[PJS99] Parris, M., Jeffay, K. and Smith, F. D., “Lightweight Active Router-Queue Management for Multimedia Networking”, Multimedia Computingand Networking, SPIE Proceedings Series, Vol. 3020, San Jose, CA,January 1999
[rfc2001] Stevens, W., “TCP Slow Start, Congestion Avoidance, Fast Retransmit,and Fast Recovery Algorithms”, Internet Request for Comment 2001,Network Working Group, January 1997, URL: http://www.cis.ohio-state.edu/htbin/rfc/rfc2001.html
[RK99] Raghavendra, A. M. and Kinicki, R. E., “A Simulation PerformanceStudy of TCP Vegas and Random Early Detection”, IPCCC99, February1999
[WKC+97] Walpole, J., Koster R., Cen, S., Cowan, C., Maier, D., McNamee, D., Pu,C., Steere, D. and Yu, L., “A player for adaptive MPEG video streamingover the Internet”, In Proceedings 26th Applied Imagery PatternRecognition Workshop AIPR-97, SPIE, Washington DC, October 1997