Embed Size (px)
Citation preview
Dynamic Behavior of Taipei 101 Tower: Field Measurementand Numerical Analysis
Q. S. Li, M.ASCE1; Lun-Hai Zhi2; Alex Y. Tuan3; Chin-Sheng Kao4; Sheng-Chung Su5; and Chien-Fu Wu6
Abstract: This paper presents selected results measured from a monitoring system with 30 accelerometers installed at six floor levels in508-m high Taipei 101 Tower located in Taipei City, Taiwan where earthquakes and strong typhoons are common occurrences. Emphasisis placed on analyzing the data recorded during three typhoons �Matsa, Talim, and Krosa� and a seismic event �Wenchuan earthquakeoccurred on May 12, 2008 in Shichuan, China� to investigate the effects of wind and seismic on the supertall building. Dynamiccharacteristics of the tall building such as natural frequencies, mode shapes, and damping ratios determined from the measured data arepresented and compared with those calculated from the finite-element model of the high-rise structure. The seismic performance of thissupertall building to a long distance earthquake �Wenchuan earthquake� is assessed based on the field measurements and numericalanalysis. The findings of this study are expected to be of considerable interest and practical use to professionals and researchers involvedin the design of supertall buildings.
DOI: 10.1061/�ASCE�ST.1943-541X.0000264
CE Database subject headings: Buildings, high-rise; Wind loads; Seismic effect; Finite element method; Numerical analysis;Measurement.
Author keywords: Tall building; Wind effect; Seismic effect; Dynamic characteristics; Finite-element method; Full-scale measurement.
Introduction
Due to the growing use of light weight and high-strength materi-als, modern tall buildings tend to be more flexible and lightlydamped than those built in the past. As a result, these tall build-ings are more sensitive to dynamic excitations by wind or seismicloads. It is thus required to investigate wind or seismic effects onsuch dynamic-sensitive structures. Generally, full-scale measure-ment is recognized as the most reliable way for evaluating dy-namic behavior of tall buildings. In fact, monitoring dynamiceffects on tall buildings can give practical validation of designprocedures and assurance of acceptable behavior. Furthermore,field measurement results can be used to improve model test tech-niques and to refine the numerical models for structural analysisas well.
With the development of data acquisition techniques duringthe last three decades, a number of full-scale measurements ofwind or seismic effects on tall buildings have been made through-
1Associate Professor, Dept. of Building and Construction, City Univ.of Hong Kong, Kowloon, Hong Kong �corresponding author�.E-mail:[email protected]
2Ph.D. Candidate, College of Civil Engineering, Hunan Univ., Chang-sha, Hunan 410082, China.
3Assistant Professor, Dept. of Civil Engineering, Tamkang Univ.,Tamsui, Taiwan.
4Associate Professor, Dept. of Civil Engineering, Tamkang Univ.,Tamsui, Taiwan.
5Junior Technical Specialist, Central Weather Bureau, Taipei, Taiwan.6Chief, Central Weather Bureau, Taipei, Taiwan.Note. This manuscript was submitted on December 23, 2009; ap-
proved on June 6, 2010; published online on June 15, 2010. Discussionperiod open until June 1, 2011; separate discussions must be submittedfor individual papers. This paper is part of the Journal of StructuralEngineering, Vol. 137, No. 1, January 1, 2011. ©ASCE, ISSN 0733-
9445/2011/1-143–155/$25.00.JOURNA
Downloaded 15 Dec 2010 to 129.25.131.235. Redistrib
out the world �Jeary 1986; Ohkuma et al. 1991; Çelebi and Şafak1992; Şafak and Çelebi 1992; Littler and Ellis 1992; Çelebi 1993;Tamura and Suganuma 1996; Li et al. 1998, 2004, 2005, 2006; Liand Wu 2004; Kijewski and Kareem 2001�, including the mea-surement programs on four Chicago tall buildings currently beingundertaken by Notre Dame University and the University ofWestern Ontario �Kijewski and Kareem 2001� and on 10 supertallbuildings in Hong Kong and Mainland China by City Universityof Hong Kong �Li et al. 1998, 2004, 2005, 2006; Li and Wu2004�. However, as commented by Tamura et al. �2005�, thechance to conduct full-scale measurements is quite rare, and ob-tained data are very important and valuable. In particular, litera-ture review reveals that comprehensive full-scale measurementsof wind or seismic effects on supertall buildings �building height�500 m� have never been conducted in the past. There is there-fore a strong case for conducting such a study, since a number ofsupertall buildings are being designed and constructed around theworld.
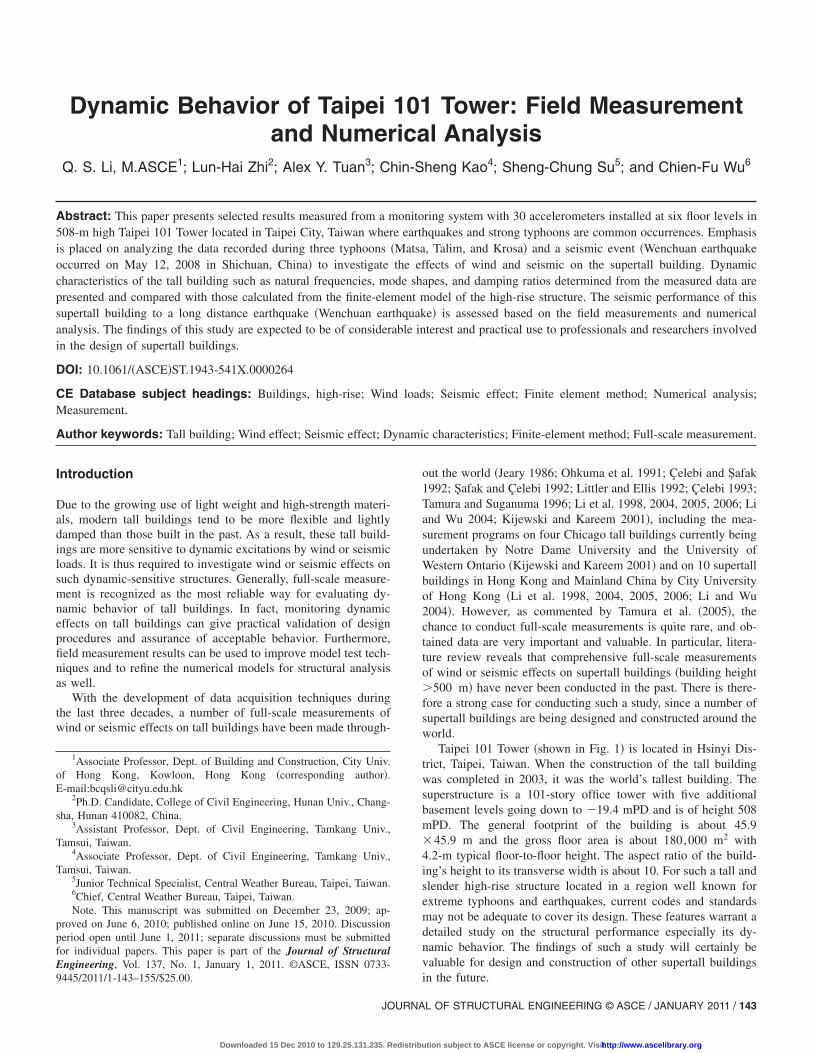
Taipei 101 Tower �shown in Fig. 1� is located in Hsinyi Dis-trict, Taipei, Taiwan. When the construction of the tall buildingwas completed in 2003, it was the world’s tallest building. Thesuperstructure is a 101-story office tower with five additionalbasement levels going down to �19.4 mPD and is of height 508mPD. The general footprint of the building is about 45.9�45.9 m and the gross floor area is about 180,000 m2 with4.2-m typical floor-to-floor height. The aspect ratio of the build-ing’s height to its transverse width is about 10. For such a tall andslender high-rise structure located in a region well known forextreme typhoons and earthquakes, current codes and standardsmay not be adequate to cover its design. These features warrant adetailed study on the structural performance especially its dy-namic behavior. The findings of such a study will certainly bevaluable for design and construction of other supertall buildings
in the future.L OF STRUCTURAL ENGINEERING © ASCE / JANUARY 2011 / 143
ution subject to ASCE license or copyright. Visithttp://www.ascelibrary.org
To evaluate the performance of the supertall building undertyphoon and earthquake actions, a monitoring system was in-stalled in the building, including 30 accelerometers at six differentfloor levels in the building. Significant field data have been ac-quired from the instrumented tower over the last several years,including measurements made during the passage of several ty-phoons and under earthquake excitations. This paper presents se-lected results of the data analysis based on the measurementsmade during three typhoons and a recent seismic event. Further-more, the measured data are also used to compare with numericalresults for improvement of numerical modeling and developmentof design guidelines. The main objective of this study is to furtherthe understanding of wind and seismic effects on supertall build-ings as well as to apply such knowledge to design.
Structure and Monitoring System
Taipei 101 Tower is a composite steel/concrete structure. A pin-nacle on top of the 448-m high building brings the total height to508 m. The superstructure contains a steel frame with H-shapesteel beams and composite floors, constructed with concrete slabsand metal decks �Research Institute of Building and Construction2003�. Belt trusses, one or two-story high, are placed every eight-
Fig. 1. Elevation view of Taipei 101 Tower
story interval at the perimeter frame, and the brace core is con-
144 / JOURNAL OF STRUCTURAL ENGINEERING © ASCE / JANUARY 201
Downloaded 15 Dec 2010 to 129.25.131.235. Redistrib
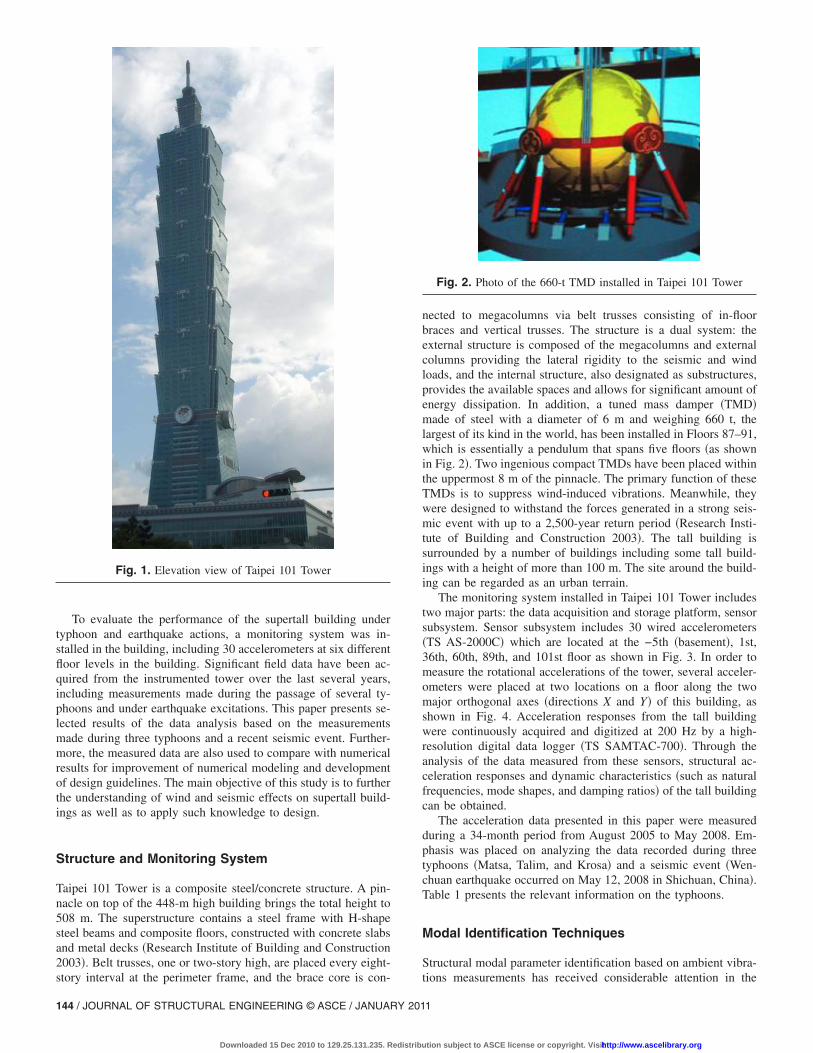
nected to megacolumns via belt trusses consisting of in-floorbraces and vertical trusses. The structure is a dual system: theexternal structure is composed of the megacolumns and externalcolumns providing the lateral rigidity to the seismic and windloads, and the internal structure, also designated as substructures,provides the available spaces and allows for significant amount ofenergy dissipation. In addition, a tuned mass damper �TMD�made of steel with a diameter of 6 m and weighing 660 t, thelargest of its kind in the world, has been installed in Floors 87–91,which is essentially a pendulum that spans five floors �as shownin Fig. 2�. Two ingenious compact TMDs have been placed withinthe uppermost 8 m of the pinnacle. The primary function of theseTMDs is to suppress wind-induced vibrations. Meanwhile, theywere designed to withstand the forces generated in a strong seis-mic event with up to a 2,500-year return period �Research Insti-tute of Building and Construction 2003�. The tall building issurrounded by a number of buildings including some tall build-ings with a height of more than 100 m. The site around the build-ing can be regarded as an urban terrain.
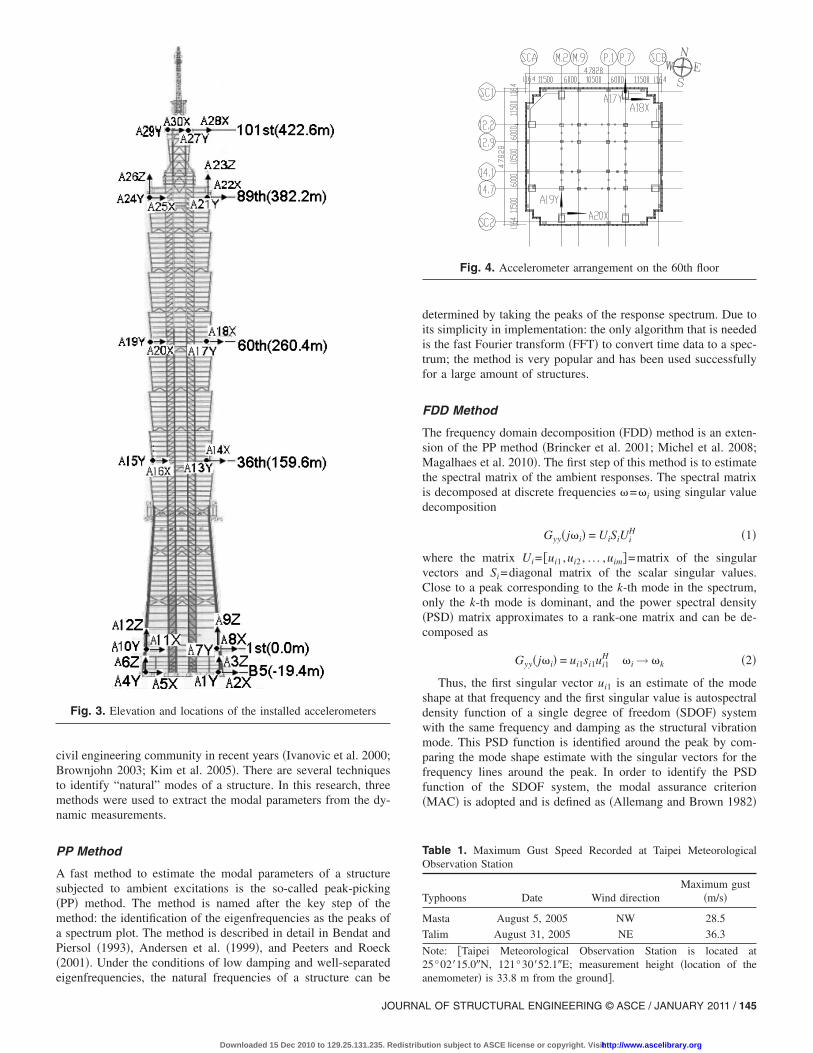
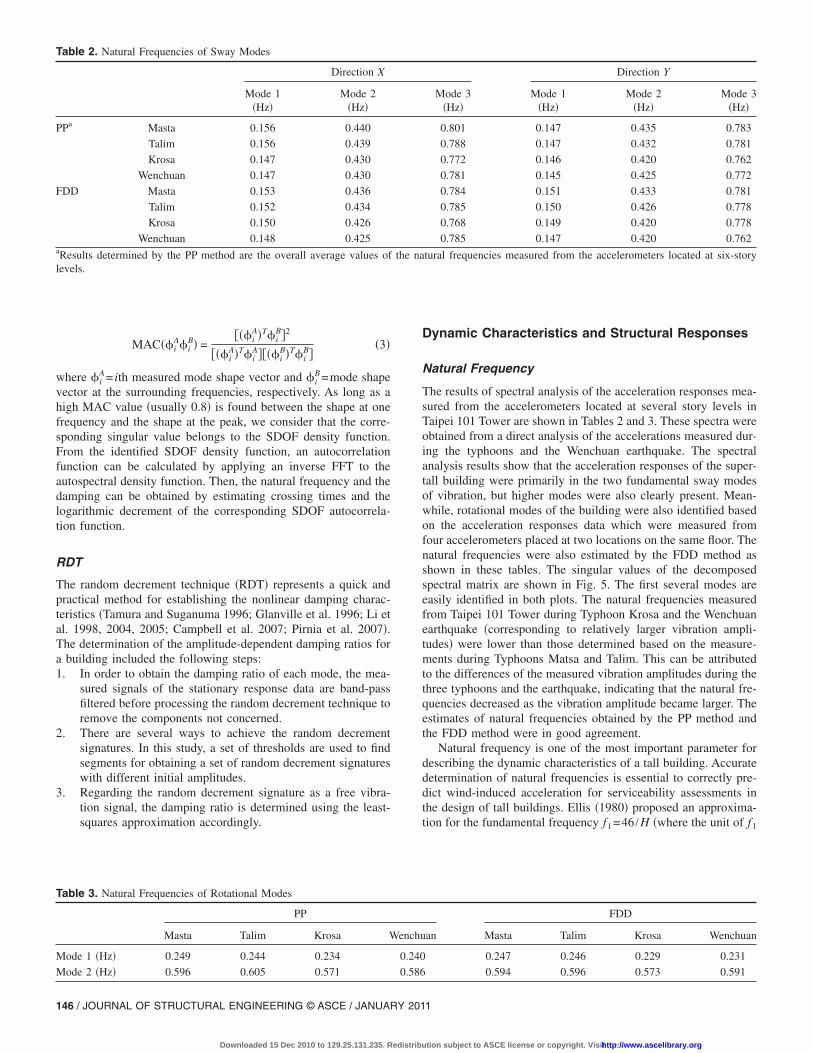
The monitoring system installed in Taipei 101 Tower includestwo major parts: the data acquisition and storage platform, sensorsubsystem. Sensor subsystem includes 30 wired accelerometers�TS AS-2000C� which are located at the −5th �basement�, 1st,36th, 60th, 89th, and 101st floor as shown in Fig. 3. In order tomeasure the rotational accelerations of the tower, several acceler-ometers were placed at two locations on a floor along the twomajor orthogonal axes �directions X and Y� of this building, asshown in Fig. 4. Acceleration responses from the tall buildingwere continuously acquired and digitized at 200 Hz by a high-resolution digital data logger �TS SAMTAC-700�. Through theanalysis of the data measured from these sensors, structural ac-celeration responses and dynamic characteristics �such as naturalfrequencies, mode shapes, and damping ratios� of the tall buildingcan be obtained.
The acceleration data presented in this paper were measuredduring a 34-month period from August 2005 to May 2008. Em-phasis was placed on analyzing the data recorded during threetyphoons �Matsa, Talim, and Krosa� and a seismic event �Wen-chuan earthquake occurred on May 12, 2008 in Shichuan, China�.Table 1 presents the relevant information on the typhoons.
Modal Identification Techniques
Structural modal parameter identification based on ambient vibra-
Fig. 2. Photo of the 660-t TMD installed in Taipei 101 Tower
tions measurements has received considerable attention in the
1
ution subject to ASCE license or copyright. Visithttp://www.ascelibrary.org
civil engineering community in recent years �Ivanovic et al. 2000;Brownjohn 2003; Kim et al. 2005�. There are several techniquesto identify “natural” modes of a structure. In this research, threemethods were used to extract the modal parameters from the dy-namic measurements.
PP Method
A fast method to estimate the modal parameters of a structuresubjected to ambient excitations is the so-called peak-picking�PP� method. The method is named after the key step of themethod: the identification of the eigenfrequencies as the peaks ofa spectrum plot. The method is described in detail in Bendat andPiersol �1993�, Andersen et al. �1999�, and Peeters and Roeck�2001�. Under the conditions of low damping and well-separated
Fig. 3. Elevation and locations of the installed accelerometers
eigenfrequencies, the natural frequencies of a structure can be
JOURNA
Downloaded 15 Dec 2010 to 129.25.131.235. Redistrib
determined by taking the peaks of the response spectrum. Due toits simplicity in implementation: the only algorithm that is neededis the fast Fourier transform �FFT� to convert time data to a spec-trum; the method is very popular and has been used successfullyfor a large amount of structures.
FDD Method
The frequency domain decomposition �FDD� method is an exten-sion of the PP method �Brincker et al. 2001; Michel et al. 2008;Magalhaes et al. 2010�. The first step of this method is to estimatethe spectral matrix of the ambient responses. The spectral matrixis decomposed at discrete frequencies �=�i using singular valuedecomposition
Gyy�j�i� = UiSiUiH �1�
where the matrix Ui= �ui1 ,ui2 , . . . ,uim�=matrix of the singularvectors and Si=diagonal matrix of the scalar singular values.Close to a peak corresponding to the k-th mode in the spectrum,only the k-th mode is dominant, and the power spectral density�PSD� matrix approximates to a rank-one matrix and can be de-composed as
Gyy�j�i� = ui1si1ui1H �i → �k �2�
Thus, the first singular vector ui1 is an estimate of the modeshape at that frequency and the first singular value is autospectraldensity function of a single degree of freedom �SDOF� systemwith the same frequency and damping as the structural vibrationmode. This PSD function is identified around the peak by com-paring the mode shape estimate with the singular vectors for thefrequency lines around the peak. In order to identify the PSDfunction of the SDOF system, the modal assurance criterion�MAC� is adopted and is defined as �Allemang and Brown 1982�
Table 1. Maximum Gust Speed Recorded at Taipei MeteorologicalObservation Station
Typhoons Date Wind directionMaximum gust
�m/s�
Masta August 5, 2005 NW 28.5
Talim August 31, 2005 NE 36.3
Note: �Taipei Meteorological Observation Station is located at25°02�15.0�N, 121°30�52.1�E; measurement height �location of the
Fig. 4. Accelerometer arrangement on the 60th floor
anemometer� is 33.8 m from the ground�.
L OF STRUCTURAL ENGINEERING © ASCE / JANUARY 2011 / 145
ution subject to ASCE license or copyright. Visithttp://www.ascelibrary.org
MAC��iA�i
B� =���i
A�T�iB�2
���iA�T�i
A����iB�T�i
B��3�
where �iA= ith measured mode shape vector and �i
B=mode shapevector at the surrounding frequencies, respectively. As long as ahigh MAC value �usually 0.8� is found between the shape at onefrequency and the shape at the peak, we consider that the corre-sponding singular value belongs to the SDOF density function.From the identified SDOF density function, an autocorrelationfunction can be calculated by applying an inverse FFT to theautospectral density function. Then, the natural frequency and thedamping can be obtained by estimating crossing times and thelogarithmic decrement of the corresponding SDOF autocorrela-tion function.
RDT
The random decrement technique �RDT� represents a quick andpractical method for establishing the nonlinear damping charac-teristics �Tamura and Suganuma 1996; Glanville et al. 1996; Li etal. 1998, 2004, 2005; Campbell et al. 2007; Pirnia et al. 2007�.The determination of the amplitude-dependent damping ratios fora building included the following steps:1. In order to obtain the damping ratio of each mode, the mea-
sured signals of the stationary response data are band-passfiltered before processing the random decrement technique toremove the components not concerned.
2. There are several ways to achieve the random decrementsignatures. In this study, a set of thresholds are used to findsegments for obtaining a set of random decrement signatureswith different initial amplitudes.
3. Regarding the random decrement signature as a free vibra-tion signal, the damping ratio is determined using the least-squares approximation accordingly.
Table 2. Natural Frequencies of Sway Modes
Direction X
Mode 1�Hz�
Mode 2�Hz�
PPa Masta 0.156 0.440
Talim 0.156 0.439
Krosa 0.147 0.430
Wenchuan 0.147 0.430
FDD Masta 0.153 0.436
Talim 0.152 0.434
Krosa 0.150 0.426
Wenchuan 0.148 0.425aResults determined by the PP method are the overall average values oflevels.
Table 3. Natural Frequencies of Rotational Modes
PP
Masta Talim Krosa W
Mode 1 �Hz� 0.249 0.244 0.234
Mode 2 �Hz� 0.596 0.605 0.571
146 / JOURNAL OF STRUCTURAL ENGINEERING © ASCE / JANUARY 201
Downloaded 15 Dec 2010 to 129.25.131.235. Redistrib
Dynamic Characteristics and Structural Responses
Natural Frequency
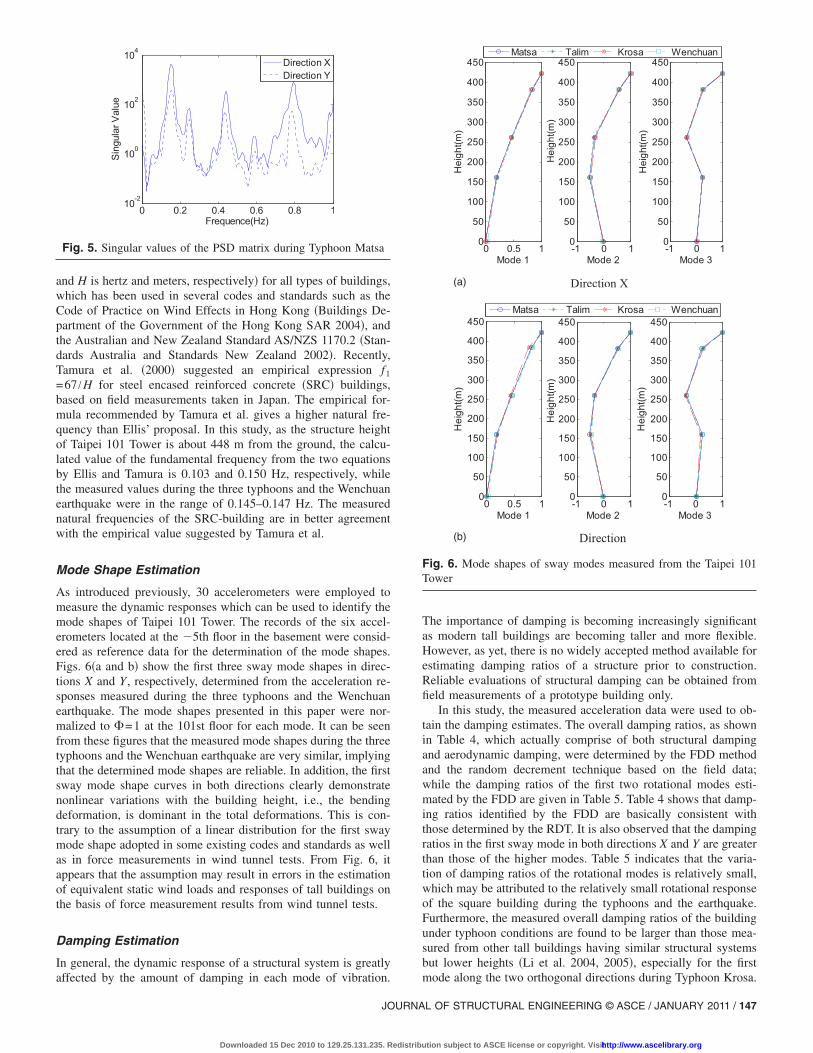
The results of spectral analysis of the acceleration responses mea-sured from the accelerometers located at several story levels inTaipei 101 Tower are shown in Tables 2 and 3. These spectra wereobtained from a direct analysis of the accelerations measured dur-ing the typhoons and the Wenchuan earthquake. The spectralanalysis results show that the acceleration responses of the super-tall building were primarily in the two fundamental sway modesof vibration, but higher modes were also clearly present. Mean-while, rotational modes of the building were also identified basedon the acceleration responses data which were measured fromfour accelerometers placed at two locations on the same floor. Thenatural frequencies were also estimated by the FDD method asshown in these tables. The singular values of the decomposedspectral matrix are shown in Fig. 5. The first several modes areeasily identified in both plots. The natural frequencies measuredfrom Taipei 101 Tower during Typhoon Krosa and the Wenchuanearthquake �corresponding to relatively larger vibration ampli-tudes� were lower than those determined based on the measure-ments during Typhoons Matsa and Talim. This can be attributedto the differences of the measured vibration amplitudes during thethree typhoons and the earthquake, indicating that the natural fre-quencies decreased as the vibration amplitude became larger. Theestimates of natural frequencies obtained by the PP method andthe FDD method were in good agreement.
Natural frequency is one of the most important parameter fordescribing the dynamic characteristics of a tall building. Accuratedetermination of natural frequencies is essential to correctly pre-dict wind-induced acceleration for serviceability assessments inthe design of tall buildings. Ellis �1980� proposed an approxima-tion for the fundamental frequency f1=46 /H �where the unit of f1
Direction Y
Mode 3�Hz�
Mode 1�Hz�
Mode 2�Hz�
Mode 3�Hz�
0.801 0.147 0.435 0.783
0.788 0.147 0.432 0.781
0.772 0.146 0.420 0.762
0.781 0.145 0.425 0.772
0.784 0.151 0.433 0.781
0.785 0.150 0.426 0.778
0.768 0.149 0.420 0.778
0.785 0.147 0.420 0.762
tural frequencies measured from the accelerometers located at six-story
FDD
an Masta Talim Krosa Wenchuan
0.247 0.246 0.229 0.231
0.594 0.596 0.573 0.591
the na
enchu
0.240
0.586
1
ution subject to ASCE license or copyright. Visithttp://www.ascelibrary.org
and H is hertz and meters, respectively� for all types of buildings,which has been used in several codes and standards such as theCode of Practice on Wind Effects in Hong Kong �Buildings De-partment of the Government of the Hong Kong SAR 2004�, andthe Australian and New Zealand Standard AS/NZS 1170.2 �Stan-dards Australia and Standards New Zealand 2002�. Recently,Tamura et al. �2000� suggested an empirical expression f1
=67 /H for steel encased reinforced concrete �SRC� buildings,based on field measurements taken in Japan. The empirical for-mula recommended by Tamura et al. gives a higher natural fre-quency than Ellis’ proposal. In this study, as the structure heightof Taipei 101 Tower is about 448 m from the ground, the calcu-lated value of the fundamental frequency from the two equationsby Ellis and Tamura is 0.103 and 0.150 Hz, respectively, whilethe measured values during the three typhoons and the Wenchuanearthquake were in the range of 0.145–0.147 Hz. The measurednatural frequencies of the SRC-building are in better agreementwith the empirical value suggested by Tamura et al.
Mode Shape Estimation
As introduced previously, 30 accelerometers were employed tomeasure the dynamic responses which can be used to identify themode shapes of Taipei 101 Tower. The records of the six accel-erometers located at the �5th floor in the basement were consid-ered as reference data for the determination of the mode shapes.Figs. 6�a and b� show the first three sway mode shapes in direc-tions X and Y, respectively, determined from the acceleration re-sponses measured during the three typhoons and the Wenchuanearthquake. The mode shapes presented in this paper were nor-malized to �=1 at the 101st floor for each mode. It can be seenfrom these figures that the measured mode shapes during the threetyphoons and the Wenchuan earthquake are very similar, implyingthat the determined mode shapes are reliable. In addition, the firstsway mode shape curves in both directions clearly demonstratenonlinear variations with the building height, i.e., the bendingdeformation, is dominant in the total deformations. This is con-trary to the assumption of a linear distribution for the first swaymode shape adopted in some existing codes and standards as wellas in force measurements in wind tunnel tests. From Fig. 6, itappears that the assumption may result in errors in the estimationof equivalent static wind loads and responses of tall buildings onthe basis of force measurement results from wind tunnel tests.
Damping Estimation
In general, the dynamic response of a structural system is greatly
0 0.2 0.4 0.6 0.8 110-2
100
102
104
Frequence(Hz)
SingularValue
Direction XDirection Y
Fig. 5. Singular values of the PSD matrix during Typhoon Matsa
affected by the amount of damping in each mode of vibration.
JOURNA
Downloaded 15 Dec 2010 to 129.25.131.235. Redistrib
The importance of damping is becoming increasingly significantas modern tall buildings are becoming taller and more flexible.However, as yet, there is no widely accepted method available forestimating damping ratios of a structure prior to construction.Reliable evaluations of structural damping can be obtained fromfield measurements of a prototype building only.
In this study, the measured acceleration data were used to ob-tain the damping estimates. The overall damping ratios, as shownin Table 4, which actually comprise of both structural dampingand aerodynamic damping, were determined by the FDD methodand the random decrement technique based on the field data;while the damping ratios of the first two rotational modes esti-mated by the FDD are given in Table 5. Table 4 shows that damp-ing ratios identified by the FDD are basically consistent withthose determined by the RDT. It is also observed that the dampingratios in the first sway mode in both directions X and Y are greaterthan those of the higher modes. Table 5 indicates that the varia-tion of damping ratios of the rotational modes is relatively small,which may be attributed to the relatively small rotational responseof the square building during the typhoons and the earthquake.Furthermore, the measured overall damping ratios of the buildingunder typhoon conditions are found to be larger than those mea-sured from other tall buildings having similar structural systemsbut lower heights �Li et al. 2004, 2005�, especially for the first
0 0.5 10
50
100
150
200
250
300
350
400
450
Mode 1
Height(m)
Matsa Talim Krosa Wenchuan
-1 0 10
50
100
150
200
250
300
350
400
450
Mode 2
Height(m)
-1 0 10
50
100
150
200
250
300
350
400
450
Mode 3
Height(m)
Direction X(a)
0 0.5 10
50
100
150
200
250
300
350
400
450
Mode 1
Height(m)
Matsa Talim Krosa Wenchuan
-1 0 10
50
100
150
200
250
300
350
400
450
Mode 2
Height(m)
-1 0 10
50
100
150
200
250
300
350
400
450
Mode 3
Height(m)
Direction(b)
Fig. 6. Mode shapes of sway modes measured from the Taipei 101Tower
mode along the two orthogonal directions during Typhoon Krosa.
L OF STRUCTURAL ENGINEERING © ASCE / JANUARY 2011 / 147
ution subject to ASCE license or copyright. Visithttp://www.ascelibrary.org
These differences may be attributed to several reasons, includingthe relatively large vibration amplitudes of Taipei 101 Tower andthe existence of the TMD installed on the Floors 87–91.
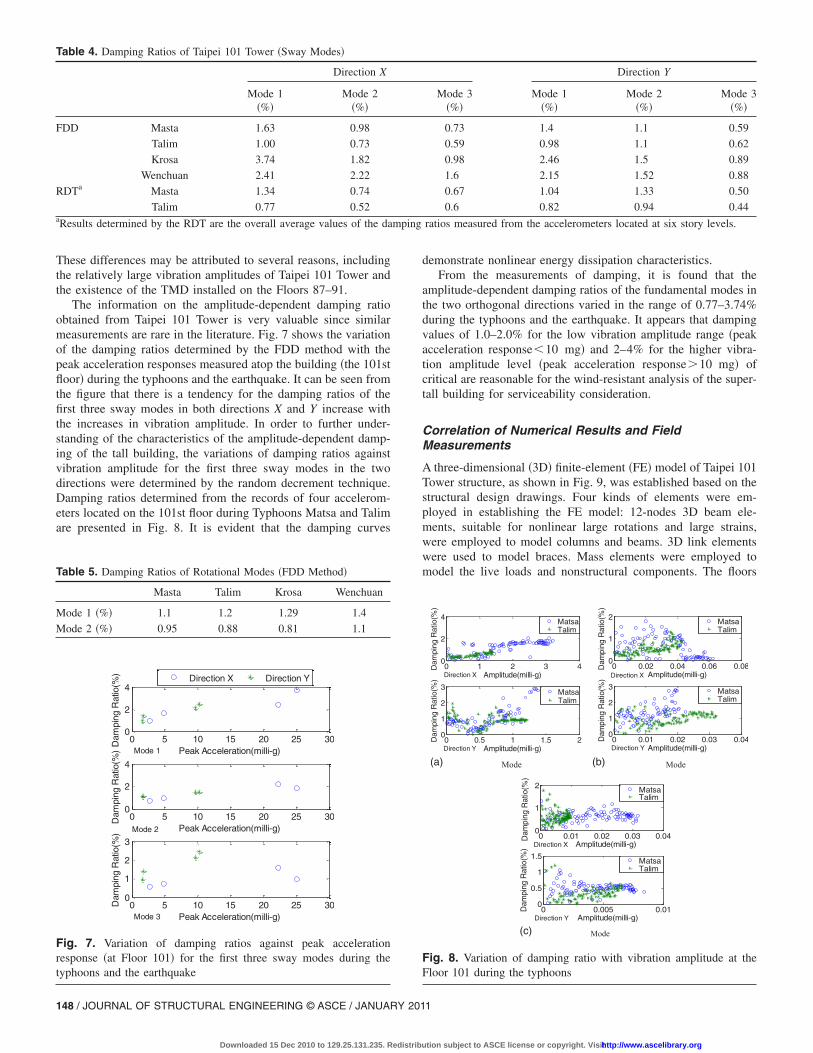
The information on the amplitude-dependent damping ratioobtained from Taipei 101 Tower is very valuable since similarmeasurements are rare in the literature. Fig. 7 shows the variationof the damping ratios determined by the FDD method with thepeak acceleration responses measured atop the building �the 101stfloor� during the typhoons and the earthquake. It can be seen fromthe figure that there is a tendency for the damping ratios of thefirst three sway modes in both directions X and Y increase withthe increases in vibration amplitude. In order to further under-standing of the characteristics of the amplitude-dependent damp-ing of the tall building, the variations of damping ratios againstvibration amplitude for the first three sway modes in the twodirections were determined by the random decrement technique.Damping ratios determined from the records of four accelerom-eters located on the 101st floor during Typhoons Matsa and Talimare presented in Fig. 8. It is evident that the damping curves
Table 4. Damping Ratios of Taipei 101 Tower �Sway Modes�
Direction X
Mode 1�%�
Mode 2�%�
FDD Masta 1.63 0.98
Talim 1.00 0.73
Krosa 3.74 1.82
Wenchuan 2.41 2.22
RDTa Masta 1.34 0.74
Talim 0.77 0.52aResults determined by the RDT are the overall average values of the da
Table 5. Damping Ratios of Rotational Modes �FDD Method�
Masta Talim Krosa Wenchuan
Mode 1 �%� 1.1 1.2 1.29 1.4
Mode 2 �%� 0.95 0.88 0.81 1.1
0 5 10 15 20 25 300
2
4
Peak Acceleration(milli-g)
Dam
ping
Rat
io(%
) Direction X Direction Y
0 5 10 15 20 25 300
2
4
Peak Acceleration(milli-g)
Dam
ping
Rat
io(%
)
0 5 10 15 20 25 300
1
2
3
Peak Acceleration(milli-g)
Dam
ping
Rat
io(%
)
Mode 1
Mode 3
Mode 2
Fig. 7. Variation of damping ratios against peak accelerationresponse �at Floor 101� for the first three sway modes during thetyphoons and the earthquake
148 / JOURNAL OF STRUCTURAL ENGINEERING © ASCE / JANUARY 201
Downloaded 15 Dec 2010 to 129.25.131.235. Redistrib
demonstrate nonlinear energy dissipation characteristics.From the measurements of damping, it is found that the
amplitude-dependent damping ratios of the fundamental modes inthe two orthogonal directions varied in the range of 0.77–3.74%during the typhoons and the earthquake. It appears that dampingvalues of 1.0–2.0% for the low vibration amplitude range �peakacceleration response�10 mg� and 2–4% for the higher vibra-tion amplitude level �peak acceleration response�10 mg� ofcritical are reasonable for the wind-resistant analysis of the super-tall building for serviceability consideration.
Correlation of Numerical Results and FieldMeasurements
A three-dimensional �3D� finite-element �FE� model of Taipei 101Tower structure, as shown in Fig. 9, was established based on thestructural design drawings. Four kinds of elements were em-ployed in establishing the FE model: 12-nodes 3D beam ele-ments, suitable for nonlinear large rotations and large strains,were employed to model columns and beams. 3D link elementswere used to model braces. Mass elements were employed tomodel the live loads and nonstructural components. The floors
Direction Y
Mode 3�%�
Mode 1�%�
Mode 2�%�
Mode 3�%�
0.73 1.4 1.1 0.59
0.59 0.98 1.1 0.62
0.98 2.46 1.5 0.89
1.6 2.15 1.52 0.88
0.67 1.04 1.33 0.50
0.6 0.82 0.94 0.44
ratios measured from the accelerometers located at six story levels.
0 1 2 3 40
2
4
Amplitude(milli-g)
Dam
ping
Rat
io(%
)
MatsaTalim
0 0.5 1 1.5 20
1
2
3
Amplitude(milli-g)
Dam
ping
Rat
io(%
)
MatsaTalim
Direction X
Direction Y
Mode
0 0.02 0.04 0.06 0.080
1
2
Amplitude(milli-g)
Dam
ping
Rat
io(%
)
MatsaTalim
0 0.01 0.02 0.03 0.040
1
2
3
Amplitude(milli-g)
Dam
ping
Rat
io(%
)
MatsaTalim
Direction X
Direction Y
Mode
0 0.01 0.02 0.03 0.040
1
2
Amplitude(milli-g)
Dam
ping
Rat
io(%
)
MatsaTalim
0 0.005 0.010
0.5
1
1.5
Amplitude(milli-g)
Dam
ping
Rat
io(%
)
MatsaTalim
Direction X
Direction Y
Mode
(b)(a)
(c)
Fig. 8. Variation of damping ratio with vibration amplitude at theFloor 101 during the typhoons
mping
1
ution subject to ASCE license or copyright. Visithttp://www.ascelibrary.org
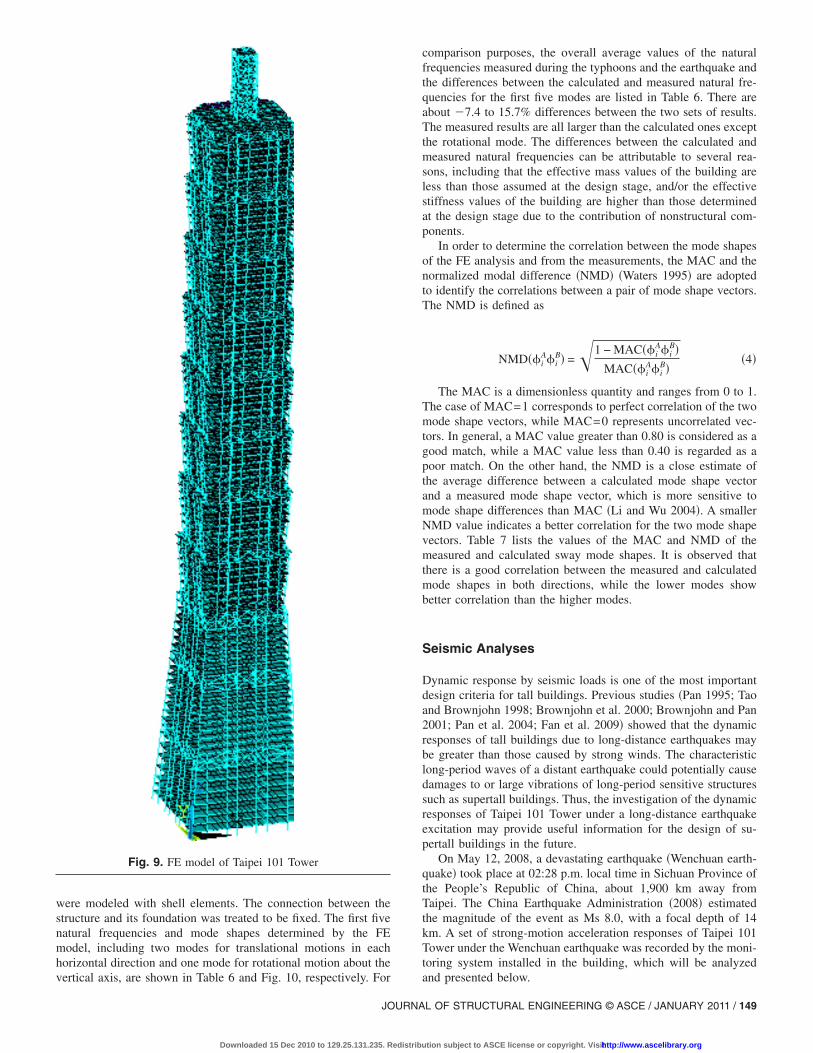
were modeled with shell elements. The connection between thestructure and its foundation was treated to be fixed. The first fivenatural frequencies and mode shapes determined by the FEmodel, including two modes for translational motions in eachhorizontal direction and one mode for rotational motion about the
Fig. 9. FE model of Taipei 101 Tower
vertical axis, are shown in Table 6 and Fig. 10, respectively. For
JOURNA
Downloaded 15 Dec 2010 to 129.25.131.235. Redistrib
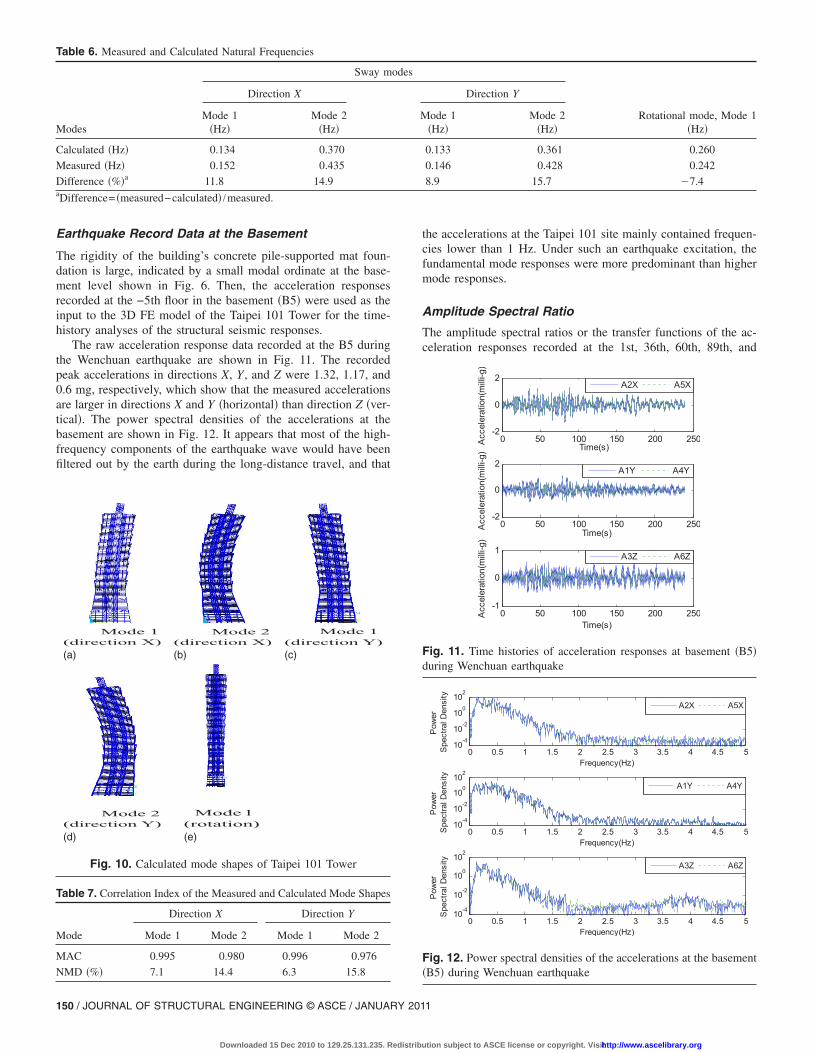
comparison purposes, the overall average values of the naturalfrequencies measured during the typhoons and the earthquake andthe differences between the calculated and measured natural fre-quencies for the first five modes are listed in Table 6. There areabout �7.4 to 15.7% differences between the two sets of results.The measured results are all larger than the calculated ones exceptthe rotational mode. The differences between the calculated andmeasured natural frequencies can be attributable to several rea-sons, including that the effective mass values of the building areless than those assumed at the design stage, and/or the effectivestiffness values of the building are higher than those determinedat the design stage due to the contribution of nonstructural com-ponents.
In order to determine the correlation between the mode shapesof the FE analysis and from the measurements, the MAC and thenormalized modal difference �NMD� �Waters 1995� are adoptedto identify the correlations between a pair of mode shape vectors.The NMD is defined as
NMD��iA�i
B� =�1 − MAC��iA�i
B�MAC��i
A�iB�
�4�
The MAC is a dimensionless quantity and ranges from 0 to 1.The case of MAC=1 corresponds to perfect correlation of the twomode shape vectors, while MAC=0 represents uncorrelated vec-tors. In general, a MAC value greater than 0.80 is considered as agood match, while a MAC value less than 0.40 is regarded as apoor match. On the other hand, the NMD is a close estimate ofthe average difference between a calculated mode shape vectorand a measured mode shape vector, which is more sensitive tomode shape differences than MAC �Li and Wu 2004�. A smallerNMD value indicates a better correlation for the two mode shapevectors. Table 7 lists the values of the MAC and NMD of themeasured and calculated sway mode shapes. It is observed thatthere is a good correlation between the measured and calculatedmode shapes in both directions, while the lower modes showbetter correlation than the higher modes.
Seismic Analyses
Dynamic response by seismic loads is one of the most importantdesign criteria for tall buildings. Previous studies �Pan 1995; Taoand Brownjohn 1998; Brownjohn et al. 2000; Brownjohn and Pan2001; Pan et al. 2004; Fan et al. 2009� showed that the dynamicresponses of tall buildings due to long-distance earthquakes maybe greater than those caused by strong winds. The characteristiclong-period waves of a distant earthquake could potentially causedamages to or large vibrations of long-period sensitive structuressuch as supertall buildings. Thus, the investigation of the dynamicresponses of Taipei 101 Tower under a long-distance earthquakeexcitation may provide useful information for the design of su-pertall buildings in the future.
On May 12, 2008, a devastating earthquake �Wenchuan earth-quake� took place at 02:28 p.m. local time in Sichuan Province ofthe People’s Republic of China, about 1,900 km away fromTaipei. The China Earthquake Administration �2008� estimatedthe magnitude of the event as Ms 8.0, with a focal depth of 14km. A set of strong-motion acceleration responses of Taipei 101Tower under the Wenchuan earthquake was recorded by the moni-toring system installed in the building, which will be analyzed
and presented below.L OF STRUCTURAL ENGINEERING © ASCE / JANUARY 2011 / 149
ution subject to ASCE license or copyright. Visithttp://www.ascelibrary.org
Earthquake Record Data at the Basement
The rigidity of the building’s concrete pile-supported mat foun-dation is large, indicated by a small modal ordinate at the base-ment level shown in Fig. 6. Then, the acceleration responsesrecorded at the −5th floor in the basement �B5� were used as theinput to the 3D FE model of the Taipei 101 Tower for the time-history analyses of the structural seismic responses.
The raw acceleration response data recorded at the B5 duringthe Wenchuan earthquake are shown in Fig. 11. The recordedpeak accelerations in directions X, Y, and Z were 1.32, 1.17, and0.6 mg, respectively, which show that the measured accelerationsare larger in directions X and Y �horizontal� than direction Z �ver-tical�. The power spectral densities of the accelerations at thebasement are shown in Fig. 12. It appears that most of the high-frequency components of the earthquake wave would have beenfiltered out by the earth during the long-distance travel, and that
Table 6. Measured and Calculated Natural Frequencies
Modes
Sway m
Direction X
Mode 1�Hz�
Mode 2�Hz�
Calculated �Hz� 0.134 0.370
Measured �Hz� 0.152 0.435
Difference �%�a 11.8 14.9aDifference= �measured−calculated� /measured.
Table 7. Correlation Index of the Measured and Calculated Mode Shapes
Mode
Direction X Direction Y
Mode 1 Mode 2 Mode 1 Mode 2
MAC 0.995 0.980 0.996 0.976
NMD �%� 7.1 14.4 6.3 15.8
Mode 1(direction X)
(a)
Mode 2(direction X)
Mode 1(direction Y)
Mode 2(direction Y)
Mode1(rotation)
(b) (c)
(d) (e)
Fig. 10. Calculated mode shapes of Taipei 101 Tower
150 / JOURNAL OF STRUCTURAL ENGINEERING © ASCE / JANUARY 201
Downloaded 15 Dec 2010 to 129.25.131.235. Redistrib
the accelerations at the Taipei 101 site mainly contained frequen-cies lower than 1 Hz. Under such an earthquake excitation, thefundamental mode responses were more predominant than highermode responses.
Amplitude Spectral Ratio
The amplitude spectral ratios or the transfer functions of the ac-celeration responses recorded at the 1st, 36th, 60th, 89th, and
Rotational mode, Mode 1�Hz�
Direction Y
ode 1�Hz�
Mode 2�Hz�
0.133 0.361 0.260
0.146 0.428 0.242
8.9 15.7 �7.4
0 50 100 150 200 250-2
0
2
Time(s)Acceleration(milli-g)
A2X A5X
0 50 100 150 200 250-2
0
2
Time(s)Acceleration(milli-g)
A1Y A4Y
0 50 100 150 200 250-1
0
1
Time(s)
Acceleration(milli-g)
A3Z A6Z
Fig. 11. Time histories of acceleration responses at basement �B5�during Wenchuan earthquake
0 0.5 1 1.5 2 2.5 3 3.5 4 4.5 510-410-2100102
Frequency(Hz)
Power
SpectralDensity
A2X A5X
0 0.5 1 1.5 2 2.5 3 3.5 4 4.5 510-410-2100102
Frequency(Hz)
Power
SpectralDensity
A1Y A4Y
0 0.5 1 1.5 2 2.5 3 3.5 4 4.5 510-410-2100102
Frequency(Hz)
Power
SpectralDensity A3Z A6Z
Fig. 12. Power spectral densities of the accelerations at the basement�B5� during Wenchuan earthquake
odes
M
1
ution subject to ASCE license or copyright. Visithttp://www.ascelibrary.org
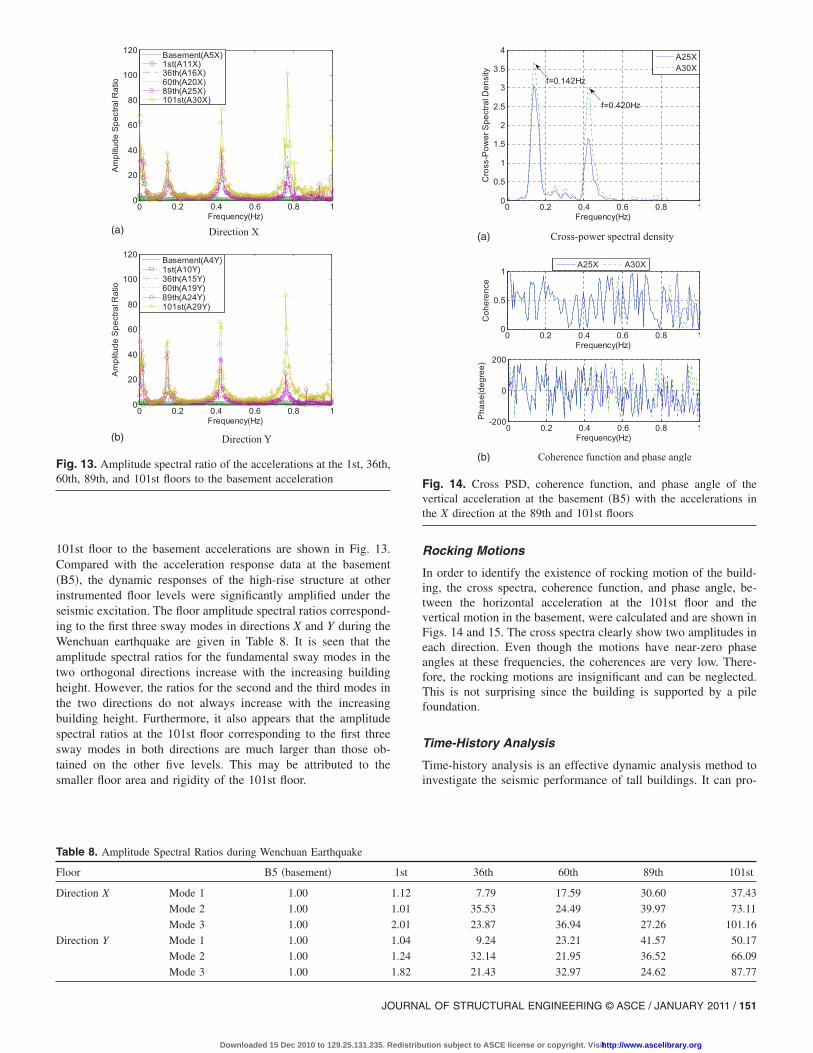
101st floor to the basement accelerations are shown in Fig. 13.Compared with the acceleration response data at the basement�B5�, the dynamic responses of the high-rise structure at otherinstrumented floor levels were significantly amplified under theseismic excitation. The floor amplitude spectral ratios correspond-ing to the first three sway modes in directions X and Y during theWenchuan earthquake are given in Table 8. It is seen that theamplitude spectral ratios for the fundamental sway modes in thetwo orthogonal directions increase with the increasing buildingheight. However, the ratios for the second and the third modes inthe two directions do not always increase with the increasingbuilding height. Furthermore, it also appears that the amplitudespectral ratios at the 101st floor corresponding to the first threesway modes in both directions are much larger than those ob-tained on the other five levels. This may be attributed to thesmaller floor area and rigidity of the 101st floor.
Table 8. Amplitude Spectral Ratios during Wenchuan Earthquake
Floor B5 �basement�
Direction X Mode 1 1.00
Mode 2 1.00
Mode 3 1.00
Direction Y Mode 1 1.00
Mode 2 1.00
Mode 3 1.00
0 0.2 0.4 0.6 0.8 10
20
40
60
80
100
120
Frequency(Hz)
AmplitudeSpectralRatio
Basement(A5X)1st(A11X)36th(A16X)60th(A20X)89th(A25X)101st(A30X)
Direction X(a)
0 0.2 0.4 0.6 0.8 10
20
40
60
80
100
120
Frequency(Hz)
AmplitudeSpectralRatio
Basement(A4Y)1st(A10Y)36th(A15Y)60th(A19Y)89th(A24Y)101st(A29Y)
Direction Y(b)
Fig. 13. Amplitude spectral ratio of the accelerations at the 1st, 36th,60th, 89th, and 101st floors to the basement acceleration
JOURNA
Downloaded 15 Dec 2010 to 129.25.131.235. Redistrib
Rocking Motions
In order to identify the existence of rocking motion of the build-ing, the cross spectra, coherence function, and phase angle, be-tween the horizontal acceleration at the 101st floor and thevertical motion in the basement, were calculated and are shown inFigs. 14 and 15. The cross spectra clearly show two amplitudes ineach direction. Even though the motions have near-zero phaseangles at these frequencies, the coherences are very low. There-fore, the rocking motions are insignificant and can be neglected.This is not surprising since the building is supported by a pilefoundation.
Time-History Analysis
Time-history analysis is an effective dynamic analysis method toinvestigate the seismic performance of tall buildings. It can pro-
36th 60th 89th 101st
7.79 17.59 30.60 37.43
35.53 24.49 39.97 73.11
23.87 36.94 27.26 101.16
9.24 23.21 41.57 50.17
32.14 21.95 36.52 66.09
21.43 32.97 24.62 87.77
0 0.2 0.4 0.6 0.8 10
0.5
1
1.5
2
2.5
3
3.5
4
Frequency(Hz)
Cross-PowerSpectralDensity
A25XA30X
f=0.142Hz
f=0.420Hz
Cross-power spectral density(a)
0 0.2 0.4 0.6 0.8 10
0.5
1
Frequency(Hz)
Coherence
A25X A30X
0 0.2 0.4 0.6 0.8 1-200
0
200
Frequency(Hz)
Phase(degree)
Coherence function and phase angle(b)
Fig. 14. Cross PSD, coherence function, and phase angle of thevertical acceleration at the basement �B5� with the accelerations inthe X direction at the 89th and 101st floors
1st
1.12
1.01
2.01
1.04
1.24
1.82
L OF STRUCTURAL ENGINEERING © ASCE / JANUARY 2011 / 151
ution subject to ASCE license or copyright. Visithttp://www.ascelibrary.org
vide useful information for the earthquake-resistant design andthe design of active and passive control devices for reduction ofstructural vibrations. The approach is composed of a step-by-stepdirect integration, in which the time domain is discretized into alarge number of small increments, and the equations of motionare solved for each time interval to obtain the structural responsessuch as accelerations and displacements, etc. In this study, theaccelerations recorded by accelerometers 1Y, 2X, and 3Z at thebasement �B5� during the Wenchuan earthquake were selected asinput for the time-history analysis. The modal damping ratioswere selected based on the measured results during the earth-quake, as shown in Tables 4 and 5. The measured damping ratiosfor the first two sway modes of the building in both directionswere in the range between 2.15 and 2.4% except for the secondmode in direction Y. The averaged value of 2.26% was used forall modes of the tall building in the present dynamic analysis.
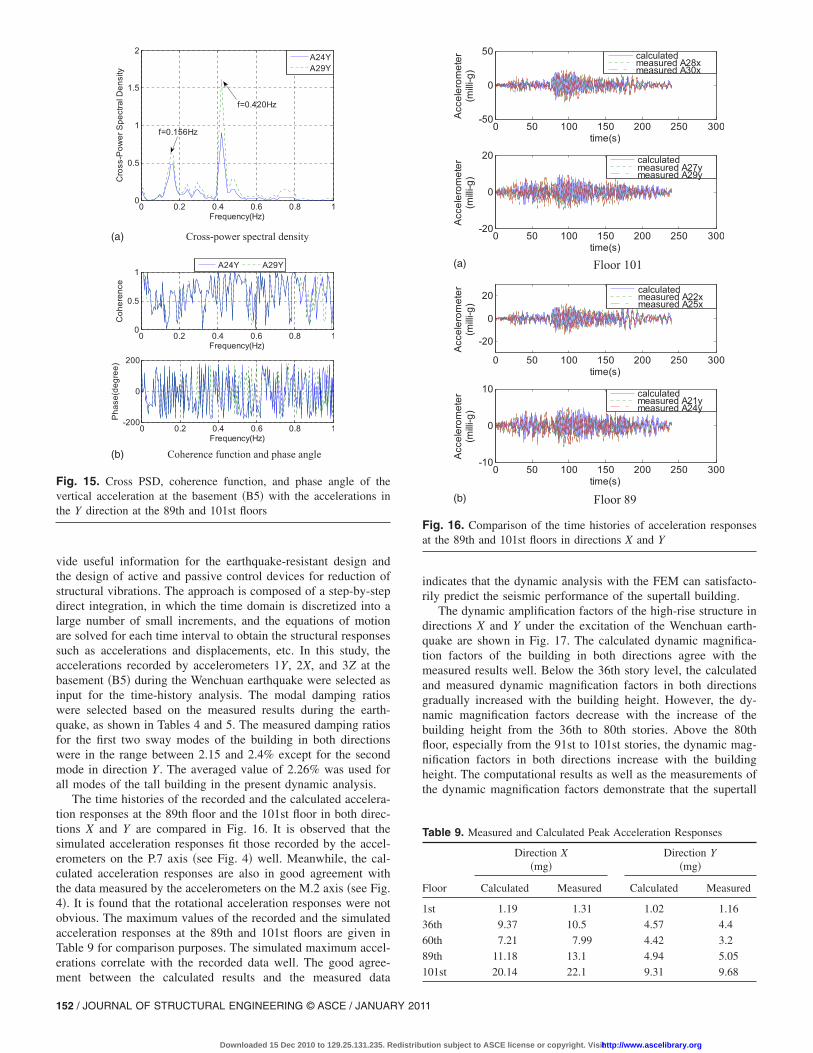
The time histories of the recorded and the calculated accelera-tion responses at the 89th floor and the 101st floor in both direc-tions X and Y are compared in Fig. 16. It is observed that thesimulated acceleration responses fit those recorded by the accel-erometers on the P.7 axis �see Fig. 4� well. Meanwhile, the cal-culated acceleration responses are also in good agreement withthe data measured by the accelerometers on the M.2 axis �see Fig.4�. It is found that the rotational acceleration responses were notobvious. The maximum values of the recorded and the simulatedacceleration responses at the 89th and 101st floors are given inTable 9 for comparison purposes. The simulated maximum accel-erations correlate with the recorded data well. The good agree-
0 0.2 0.4 0.6 0.8 10
0.5
1
1.5
2
Frequency(Hz)
Cross-PowerSpectralDensity
A24YA29Y
f=0.156Hz
f=0.420Hz
Cross-power spectral density(a)
0 0.2 0.4 0.6 0.8 10
0.5
1
Frequency(Hz)
Coherence
A24Y A29Y
0 0.2 0.4 0.6 0.8 1-200
0
200
Frequency(Hz)
Phase(degree)
Coherence function and phase angle(b)
Fig. 15. Cross PSD, coherence function, and phase angle of thevertical acceleration at the basement �B5� with the accelerations inthe Y direction at the 89th and 101st floors
ment between the calculated results and the measured data
152 / JOURNAL OF STRUCTURAL ENGINEERING © ASCE / JANUARY 201
Downloaded 15 Dec 2010 to 129.25.131.235. Redistrib
indicates that the dynamic analysis with the FEM can satisfacto-rily predict the seismic performance of the supertall building.
The dynamic amplification factors of the high-rise structure indirections X and Y under the excitation of the Wenchuan earth-quake are shown in Fig. 17. The calculated dynamic magnifica-tion factors of the building in both directions agree with themeasured results well. Below the 36th story level, the calculatedand measured dynamic magnification factors in both directionsgradually increased with the building height. However, the dy-namic magnification factors decrease with the increase of thebuilding height from the 36th to 80th stories. Above the 80thfloor, especially from the 91st to 101st stories, the dynamic mag-nification factors in both directions increase with the buildingheight. The computational results as well as the measurements ofthe dynamic magnification factors demonstrate that the supertall
Table 9. Measured and Calculated Peak Acceleration Responses
Floor
Direction X�mg�
Direction Y�mg�
Calculated Measured Calculated Measured
1st 1.19 1.31 1.02 1.16
36th 9.37 10.5 4.57 4.4
60th 7.21 7.99 4.42 3.2
89th 11.18 13.1 4.94 5.05
101st 20.14 22.1 9.31 9.68
0 50 100 150 200 250 300-50
0
50
time(s)
Accelerometer
(milli-g)
calculatedmeasured A28xmeasured A30x
0 50 100 150 200 250 300-20
0
20
time(s)
Accelerometer
(milli-g)
calculatedmeasured A27ymeasured A29y
Floor 101(a)
0 50 100 150 200 250 300
-20
0
20
time(s)
Accelerometer
(milli-g)
calculatedmeasured A22xmeasured A25x
0 50 100 150 200 250 300-10
0
10
time(s)
Accelerometer
(milli-g)
calculatedmeasured A21ymeasured A24y
Floor 89(b)
Fig. 16. Comparison of the time histories of acceleration responsesat the 89th and 101st floors in directions X and Y
1
ution subject to ASCE license or copyright. Visithttp://www.ascelibrary.org
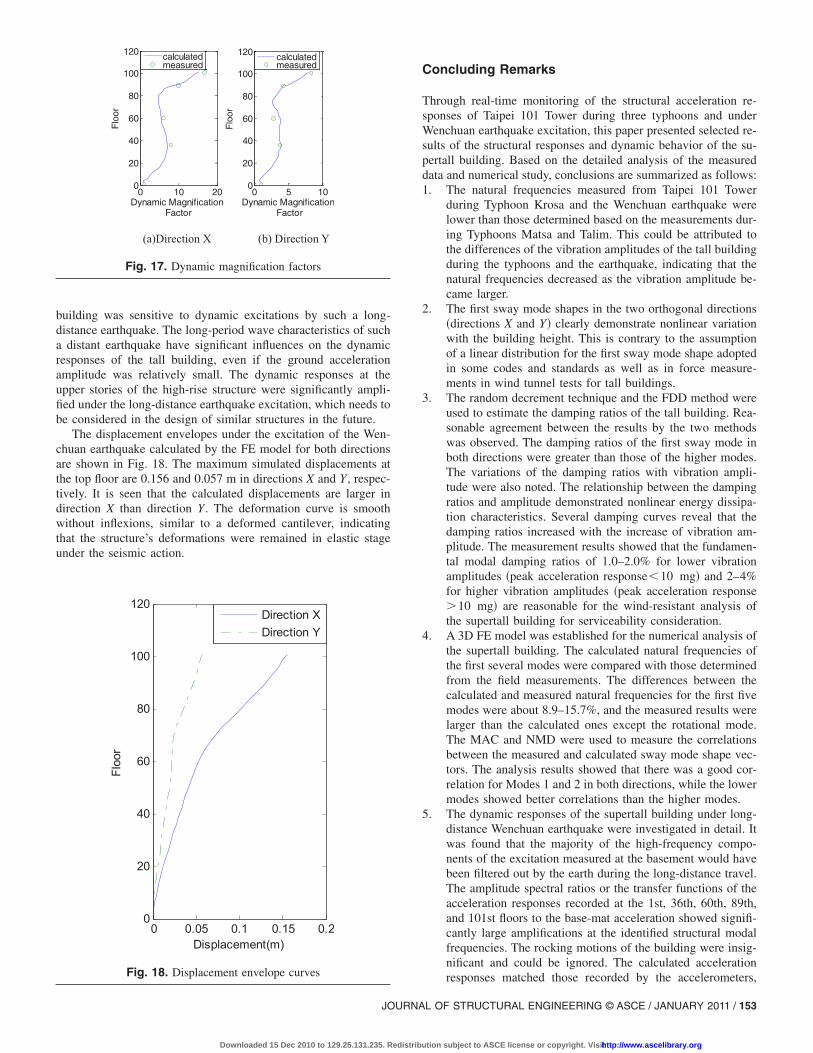
building was sensitive to dynamic excitations by such a long-distance earthquake. The long-period wave characteristics of sucha distant earthquake have significant influences on the dynamicresponses of the tall building, even if the ground accelerationamplitude was relatively small. The dynamic responses at theupper stories of the high-rise structure were significantly ampli-fied under the long-distance earthquake excitation, which needs tobe considered in the design of similar structures in the future.
The displacement envelopes under the excitation of the Wen-chuan earthquake calculated by the FE model for both directionsare shown in Fig. 18. The maximum simulated displacements atthe top floor are 0.156 and 0.057 m in directions X and Y, respec-tively. It is seen that the calculated displacements are larger indirection X than direction Y. The deformation curve is smoothwithout inflexions, similar to a deformed cantilever, indicatingthat the structure’s deformations were remained in elastic stageunder the seismic action.
0 10 200
20
40
60
80
100
120
Dynamic MagnificationFactor
Flo
or
calculatedmeasured
0 5 100
20
40
60
80
100
120
Dynamic MagnificationFactor
Flo
or
calculatedmeasured
(a)Direction X (b) Direction Y
Fig. 17. Dynamic magnification factors
0 0.05 0.1 0.15 0.20
20
40
60
80
100
120
Displacement(m)
Floor
Direction XDirection Y
Fig. 18. Displacement envelope curves
JOURNA
Downloaded 15 Dec 2010 to 129.25.131.235. Redistrib
Concluding Remarks
Through real-time monitoring of the structural acceleration re-sponses of Taipei 101 Tower during three typhoons and underWenchuan earthquake excitation, this paper presented selected re-sults of the structural responses and dynamic behavior of the su-pertall building. Based on the detailed analysis of the measureddata and numerical study, conclusions are summarized as follows:1. The natural frequencies measured from Taipei 101 Tower
during Typhoon Krosa and the Wenchuan earthquake werelower than those determined based on the measurements dur-ing Typhoons Matsa and Talim. This could be attributed tothe differences of the vibration amplitudes of the tall buildingduring the typhoons and the earthquake, indicating that thenatural frequencies decreased as the vibration amplitude be-came larger.
2. The first sway mode shapes in the two orthogonal directions�directions X and Y� clearly demonstrate nonlinear variationwith the building height. This is contrary to the assumptionof a linear distribution for the first sway mode shape adoptedin some codes and standards as well as in force measure-ments in wind tunnel tests for tall buildings.
3. The random decrement technique and the FDD method wereused to estimate the damping ratios of the tall building. Rea-sonable agreement between the results by the two methodswas observed. The damping ratios of the first sway mode inboth directions were greater than those of the higher modes.The variations of the damping ratios with vibration ampli-tude were also noted. The relationship between the dampingratios and amplitude demonstrated nonlinear energy dissipa-tion characteristics. Several damping curves reveal that thedamping ratios increased with the increase of vibration am-plitude. The measurement results showed that the fundamen-tal modal damping ratios of 1.0–2.0% for lower vibrationamplitudes �peak acceleration response�10 mg� and 2–4%for higher vibration amplitudes �peak acceleration response�10 mg� are reasonable for the wind-resistant analysis ofthe supertall building for serviceability consideration.
4. A 3D FE model was established for the numerical analysis ofthe supertall building. The calculated natural frequencies ofthe first several modes were compared with those determinedfrom the field measurements. The differences between thecalculated and measured natural frequencies for the first fivemodes were about 8.9–15.7%, and the measured results werelarger than the calculated ones except the rotational mode.The MAC and NMD were used to measure the correlationsbetween the measured and calculated sway mode shape vec-tors. The analysis results showed that there was a good cor-relation for Modes 1 and 2 in both directions, while the lowermodes showed better correlations than the higher modes.
5. The dynamic responses of the supertall building under long-distance Wenchuan earthquake were investigated in detail. Itwas found that the majority of the high-frequency compo-nents of the excitation measured at the basement would havebeen filtered out by the earth during the long-distance travel.The amplitude spectral ratios or the transfer functions of theacceleration responses recorded at the 1st, 36th, 60th, 89th,and 101st floors to the base-mat acceleration showed signifi-cantly large amplifications at the identified structural modalfrequencies. The rocking motions of the building were insig-nificant and could be ignored. The calculated acceleration
responses matched those recorded by the accelerometers,L OF STRUCTURAL ENGINEERING © ASCE / JANUARY 2011 / 153
ution subject to ASCE license or copyright. Visithttp://www.ascelibrary.org
which illustrated that the dynamic analysis with the FEM cansatisfactorily predict the seismic responses of the supertallbuilding. The measured and calculated dynamic magnifica-tion factors demonstrated that the building was sensitive todynamic excitations by such a long-distance earthquake. Thecalculated deformation curves were found to be smooth with-out inflexions, indicating that the structure still retained inelastic stage under the seismic action.
Acknowledgments
This work described in this paper was supported by a grant fromthe Research Grants Council of Hong Kong Special Administra-tive Region, China �Project No: CityU 116906�. The writers aregrateful to the owners and the management officials of Taipei 101Tower for their supports and helps to the structural monitoringproject. The writers wish to acknowledge the joint efforts of thestaffs of the Central Weather Bureau of Taiwan who were in-volved in the establishment and development of the monitoringsystem. Thanks are due to Dr. Hong Fan for her contributions onthe establishment of the FE model of Taipei 101 Tower.
References
Allemang, R. J., and Brown, D. L. �1982�. “A correlation coefficient formodal vector analysis.” Proc., 1st Int. Modal Analysis Conf., UnionCollege Press, Orlando, 110–116.
Andersen, P., Brincker, R., Peeters, B., and Roeck, G. D. �1999�. “Com-parison of system identification methods using ambient bridge testdata.” Proc., 17th Int. Modal Analysis Conf., Vol. 3727, Society forExperimental Mechanics, Bethel, Conn., 1035–1041.
Bendat, J. S., and Piersol, A. G. �1993�. Engineering applications ofcorrelation and spectral analysis, 2nd Ed., Wiley, New York.
Brincker, R., Zhang, L., and Andersen, P. �2001�. “Modal identification ofoutput only systems using frequency domain decomposition.” SmartMater. Struct., 10, 441–445.
Brownjohn, J. M. W. �2003�. “Ambient vibration studies for system iden-tification of tall buildings.” Earthquake Eng. Struct. Dyn., 32, 71–95.
Brownjohn, J. M. W., and Pan, T.-C. �2001�. “Response of tall buildingsto weak long distance earthquakes.” Earthquake Eng. Struct. Dyn.,30, 709–729.
Brownjohn, J. M. W., Pan, T. C., and Deng, X. Y. �2000�. “Correlatingdynamic characteristics from field measurements and numericalanalysis of a high-rise building.” Earthquake Eng. Struct. Dyn., 29,523–543.
Buildings Department of the Government of the Hong Kong SAR.�2004�. Code of practice on wind effects in Hong Kong, Hong Kong.
Campbell, S., Kwok, K. C. S., Hitchcock, P. A., Tse, K. T., and Leung, H.Y. �2007�. “Field measurements of natural periods of vibration andstructural damping of wind-excited tall residential buildings.” WindStruct., 10�5�, 401–420.
Çelebi, M. �1993�. “Seismic response of eccentrically braced tall build-ing.” J. Struct. Eng., 119�4�, 1188–1205.
Çelebi, M., and Şafak, E. �1992�. “Seismic response of Pacific ParkPlaza. I: Data and preliminary analysis.” J. Struct. Eng., 118�6�,1547–1565.
China Earthquake Administration. �2008�. “Seismic parameters of Ms 8.0earthquake at Wenchuang County of Sichuan Province.” Chinaseismic information, �http://www.csi.ac.cn/sichuan/sichuan080512_cs1.htm� �May 18, 2008� �in Chinese�.
Ellis, B. R. �1980�. “An assessment of the accuracy of predicting thefundamental natural frequencies of buildings and the implicationsconcerning the dynamic analysis of structures.” Proc.- Inst. Civ. Eng.,
69�3�, 763–776.154 / JOURNAL OF STRUCTURAL ENGINEERING © ASCE / JANUARY 201
Downloaded 15 Dec 2010 to 129.25.131.235. Redistrib
Fan, H., Li, Q. S., Tuan, A. Y., and Xu, L. H. �2009�. “Seismic analysis ofthe world’s tallest building.” J. Constr. Steel Res., 65�5�, 1206–1215.
Glanville, M. J., Kwok, K. C. S., and Denoon, R. O. �1996�. “Full-scaledamping measurements of structures in Australia.” J. Wind. Eng. Ind.Aerodyn., 59, 349–364.
Ivanovic, S. S., Trifunac, M. D., and Todorovska, M. I. �2000�. “Ambientvibration tests of structures—A review.” ISET J. Earthquake Technol.,37, 165–197.
Jeary, A. P. �1986�. “Damping in tall buildings, a mechanism and a pre-dictor.” Earthquake Eng. Struct. Dyn., 14, 733–750.
Kijewski, T., and Kareem, A. �2001�. “Full-scale study of the behavior oftall buildings under winds.” Proc., SPIE Symp. on NDE for HealthMonitoring and Diagnostics, Bellingham, WA, 441–450.
Kim, B. H., Stubbs, N., and Park, T. �2005�. “A new method to extractmodal parameters using output-only responses.” J. Sound Vib., 282,215–230.
Li, Q. S., et al. �2006�. “Wind tunnel and full-scale study of wind effectson China’s tallest building.” Eng. Struct., 28, 1745–1758.
Li, Q. S., Fang, J. Q., Jeary, A. P., and Wong, C. K. �1998�. “Full scalemeasurement of wind effects on tall buildings.” J. Wind. Eng. Ind.Aerodyn., 74–76, 741–750.
Li, Q. S., and Wu, J. R. �2004�. “Correlation of dynamic characteristic ofa super tall building from full-scale measurements and numericalanalysis with various finite element models.” Earthquake Eng. Struct.Dyn., 33�14�, 1311–1336.
Li, Q. S., Xiao, Y. Q., and Wong, C. K. �2005�. “Full-scale monitoring oftyphoon effects on super tall buildings.” J. Fluids Struct., 20, 697–717.
Li, Q. S., Xiao, Y. Q., Wong, C. K., and Jeary, A. P. �2004�. “Full-scalemeasurements of typhoon effects on a super tall building.” Eng.Struct., 26, 233–244.
Littler, J. D., and Ellis, B. R. �1992�. “Full scale measurements to deter-mine the response of Hume Point to wind loading.” J. Wind. Eng. Ind.Aerodyn., 42, 1085–1096.
Magalhaes, F., Cunha, A., Caetano, E., and Brincker, R. �2010�. “Damp-ing estimation using free decays and ambient vibration tests.” Mech.Syst. Signal Process., 24�5�, 1274–1290.
Michel, C., Gueguen, P., and Bard, P.-Y. �2008�. “Dynamic parameters ofstructures extracted from ambient vibration measurements: An aid forthe seismic vulnerability assessment of existing buildings in moderateseismic hazard regions.” Soil Dyn. Earthquake Eng., 28, 593–604.
Ohkuma, T., Marukawa, H., Niihori, Y., and Kato, N. �1991�. “Full-scalemeasurement of wind pressures and response accelerations of a high-rise building.” J. Wind. Eng. Ind. Aerodyn., 38, 185–196.
Pan, T. C. �1995�. “When the doorbell rings—A case of building responseto a long distance earthquake.” Earthquake Eng. Struct. Dyn., 24,1343–1353.
Pan, T.-C., Brownjohn, J. M. W., and You, X. T. �2004�. “Correlatingmeasured and simulated dynamic responses of a tall building to long-distance earthquakes.” Earthquake Eng. Struct. Dyn., 33, 611–632.
Peeters, B., and Roeck, G. D. �2001�. “Stochastic system identificationfor operational modal analysis: A review.” J. Dyn. Syst., Meas., Con-trol, 123, 659–667.
Pirnia, J. D., Kijewski-Correa, T., Abdelrazaq, A., Chung, J. Y., and Ka-reem, A. �2007�. “Full-scale validation of wind-induced response oftall buildings: Investigation of amplitude-dependent properties.”Proc., 2007 Structures Congress, Long Beach, Calif., 1–10.
Research Institute of Building and Construction. �2003�. “Report on thestructural design scheme of Taipei 101.” Rep. Prepared for EvengreenConsulting Engineering, Inc., Taipei, Taiwan.
Şafak, E., and Çelebi, M. �1992�. “Recorded seismic response of PacificPark Plaza. II: System identification.” J. Struct. Eng., 118�6�, 1566–1589.
Standards Australia and Standards New Zealand. �2002�. “Australian/New Zealand Standard, Structural design actions. Part 2: Wind ac-tions.” AS/NZS 1170.2, Australia/New Zealand.
Tamura, Y., Suda, K., and Sasaki, A. �2000�. “Damping in buildings for
1
ution subject to ASCE license or copyright. Visithttp://www.ascelibrary.org

wind resistant design.” Proc., Int. Symp. on Wind and Structures forthe 21st Century, Techno Press, Yuseong-gu Daejeon, Korea, 115–130.
Tamura, Y., and Suganuma, S. �1996�. “Evaluation of amplitude-dependent damping and natural frequency of buildings during strongwinds.” J. Wind. Eng. Ind. Aerodyn., 59, 115–130.
Tamura, Y., Yoshida, A., and Zhang, L. �2005�. “Damping in buildings
JOURNA
Downloaded 15 Dec 2010 to 129.25.131.235. Redistrib
and estimation techniques.” Proc., 6th Asia-Pacific Conf. on WindEngineering, Techno Press, Yuseong-gu Daejeon, Korea, 193–214.
Tao, N. F., and Brownjohn, J. M. W. �1998�. “Estimation of ground mo-tion acceleration and building response to a long distance earth-quake.” J. Earthquake Eng., 2�3�, 477–485.
Waters, T. P. �1995�. “Finite element model updating using measuredfrequency response functions.” Ph.D. thesis, Univ. of Bristol, U.K.
L OF STRUCTURAL ENGINEERING © ASCE / JANUARY 2011 / 155
ution subject to ASCE license or copyright. Visithttp://www.ascelibrary.org