Embed Size (px)
Citation preview


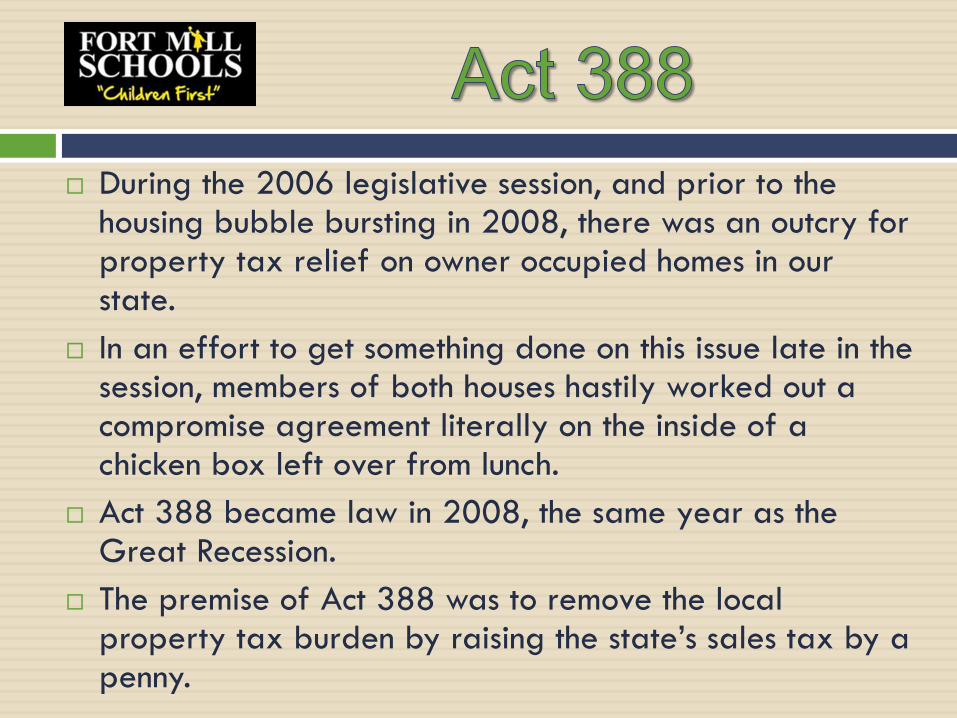
During the 2006 legislative session, and prior to the housing bubble bursting in 2008, there was an outcry for property tax relief on owner occupied homes in our state.
In an effort to get something done on this issue late in the session, members of both houses hastily worked out a compromise agreement literally on the inside of a chicken box left over from lunch.
Act 388 became law in 2008, the same year as the Great Recession.
The premise of Act 388 was to remove the local property tax burden by raising the state’s sales tax by a penny.

The promise was that the state would provide districts equal payments from the state Tier 3 reimbursement funds to replace the local revenue they were losing.
Unfortunately, the state was only able to keep their promise of 100% reimbursement for one year.
Another promise of Act 388 was that the reimbursement amounts would grow every year by CPI plus the percentage increase of the entire population of the state.
As the fastest growing school district in the state, the FMSD has no chance of its operational dollars keeping pace with the growth in new students.

Averaged Assessed Value of New Home $400,000
Assessed Value at 4% Prior to Act 388 $16,000
Current Millage Rate for Operations 173.4
Revenue Collected Prior to Act 388 $2,774
Current Revenue Collected on New Homes
for School Operations $0
Loss Revenue on Every New $400K Home
Due to Act 388 ($2,774)
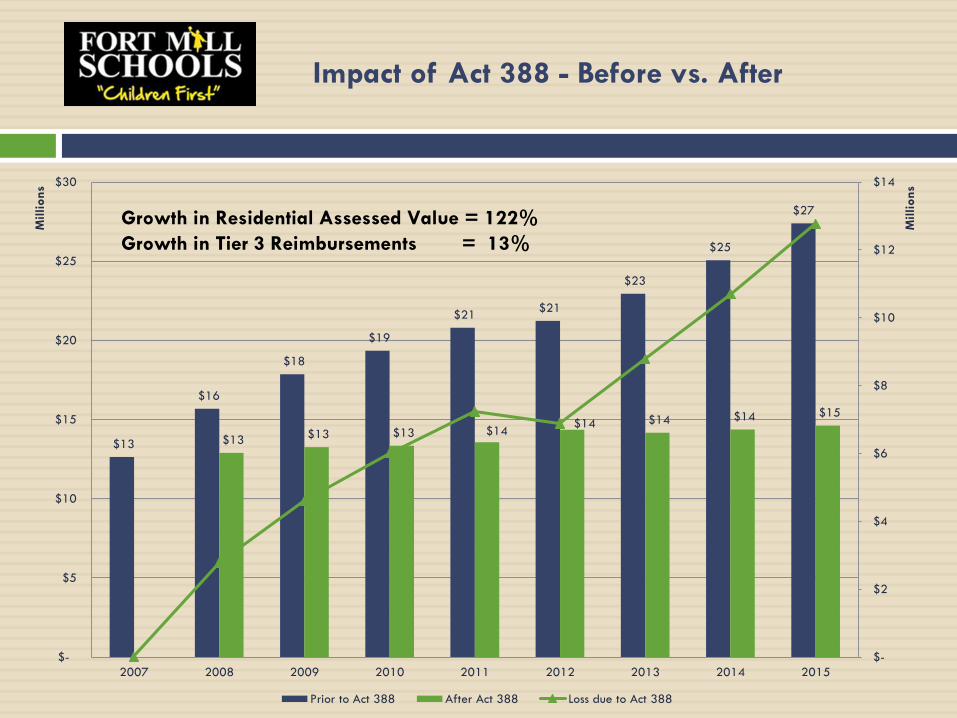
Impact of Act 388 - Before vs. After
$13
$16
$18
$19
$21 $21
$23
$25
$27
$13 $13 $13 $14 $14 $14 $14 $15
$-
$2
$4
$6
$8
$10
$12
$14
$-
$5
$10
$15
$20
$25
$30
2007 2008 2009 2010 2011 2012 2013 2014 2015
Millions
Millions
Prior to Act 388 After Act 388 Loss due to Act 388
Growth in Residential Assessed Value = 122%
Growth in Tier 3 Reimbursements = 13%

Cumulative Effect of Act 388 in $MM
$-
$10
$20
$30
$40
$50
$60
$70
2007 2008 2009 2010 2011 2012 2013 2014 2015
Millions
Variance Cummulative Variance
• After eight years the FMSD has now lost $60MM due to the
variance caused by not receiving any revenue for operations
from the 6000+ new homes constructed in the district since 2008.

Annual Student Growth by Headcount & Percentage
• The FMSD is the smallest geographically in all of SC; however,
it has grown faster per capita than any other district in the state
of South Carolina over the past decade.
0
2000
4000
6000
8000
10000
12000
14000
16000
0.0%
2.0%
4.0%
6.0%
8.0%
10.0%
12.0%
2002 2003 2004 2005 2006 2007 2008 2009 2010 2011 2012 2013 2014 2015 2016
Student Count % Growth

Student to Teacher Ratio For All Elementary Grades
• The Fort Mill School District has always worked hard to maintain student to teacher
ratios at a low level. The effects of an increasing number of students along with flat
operating revenue is beginning to have a negative effect on this strategic initiative.
20.4
20.8
21.4
21.021.1
21.2
21.5
21.8
22.1
22.5
19.0
19.5
20.0
20.5
21.0
21.5
22.0
22.5
23.0
2008 2009 2010 2011 2012 2013 2014 2015 2016 2017
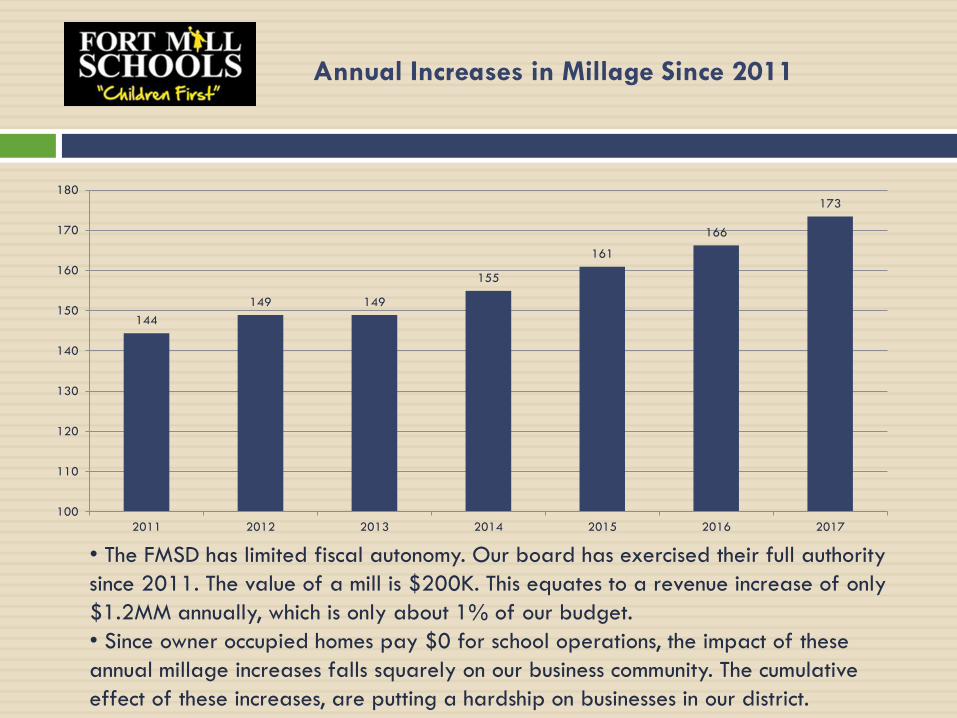
Annual Increases in Millage Since 2011
• The FMSD has limited fiscal autonomy. Our board has exercised their full authority
since 2011. The value of a mill is $200K. This equates to a revenue increase of only
$1.2MM annually, which is only about 1% of our budget.
• Since owner occupied homes pay $0 for school operations, the impact of these
annual millage increases falls squarely on our business community. The cumulative
effect of these increases, are putting a hardship on businesses in our district.
144
149 149
155
161
166
173
100
110
120
130
140
150
160
170
180
2011 2012 2013 2014 2015 2016 2017
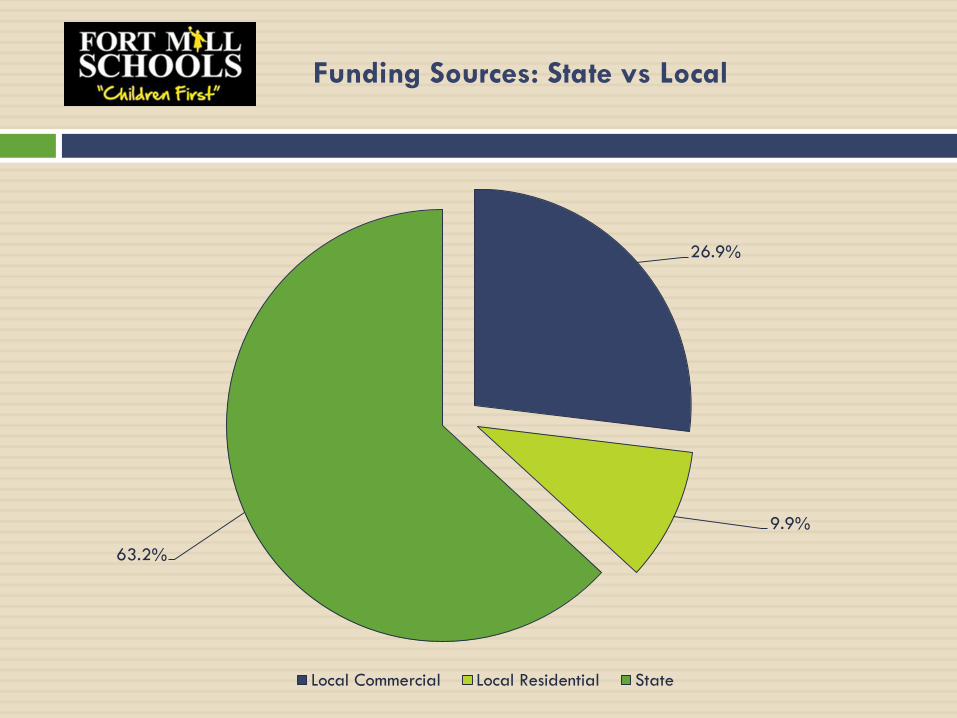
Funding Sources: State vs Local
26.9%
9.9%
63.2%
Local Commercial Local Residential State
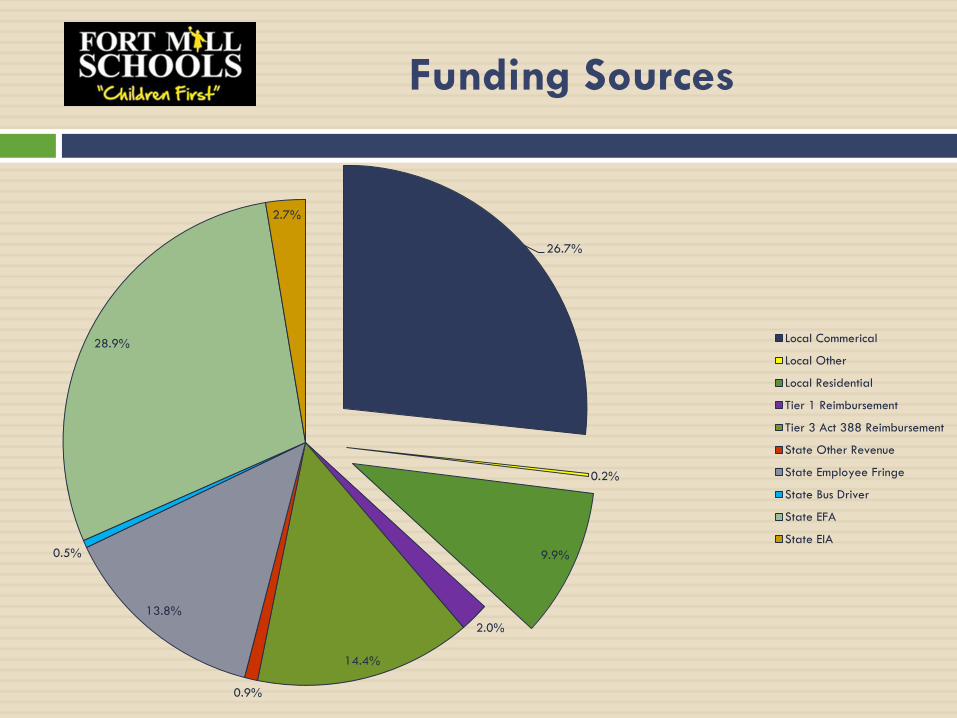
Funding Sources
26.7%
0.2%
9.9%
2.0%
14.4%
0.9%
13.8%
0.5%
28.9%
2.7%
Local Commerical
Local Other
Local Residential
Tier 1 Reimbursement
Tier 3 Act 388 Reimbursement
State Other Revenue
State Employee Fringe
State Bus Driver
State EFA
State EIA


Residential Development
Summary
Town Of Fort Mill
City Of Tega Cay
York County
Total: 12,115
(6,854)
(1,902)
(3,359)
Approved Residential
Units Inside
Fort Mill
School District

Annual New Homes Occupied in FMSD Since the
Implementation of the $2,500 Impact Fees
• Yellow bars represent the completion of more than 12,000 new homes that have
already been approved by the Town of Fort Mill, City of Tega Cay, and York County
over the next 5-6 years.
0
500
1000
1500
2000
2500
3000
1999 2000 2001 2002 2003 2004 2005 2006 2007 2008 2009 2010 2011 2012 2013 2014 2015 2016 2017 2018 2019 2020 2021 2022

Estimated Assessed Value of 12,000 New
Homes $4,800,000,000
Assessed Value at 4% Prior to Act 388 $192,000,000
Current Millage Rate for Operations 173.4
Revenue Collected Prior to Act 388 $33,292,000
Future Revenue Collected on New Homes for
School Operations $0
Loss Revenue on Every New $400K Home
Due to Act 388 ($33,292,000)
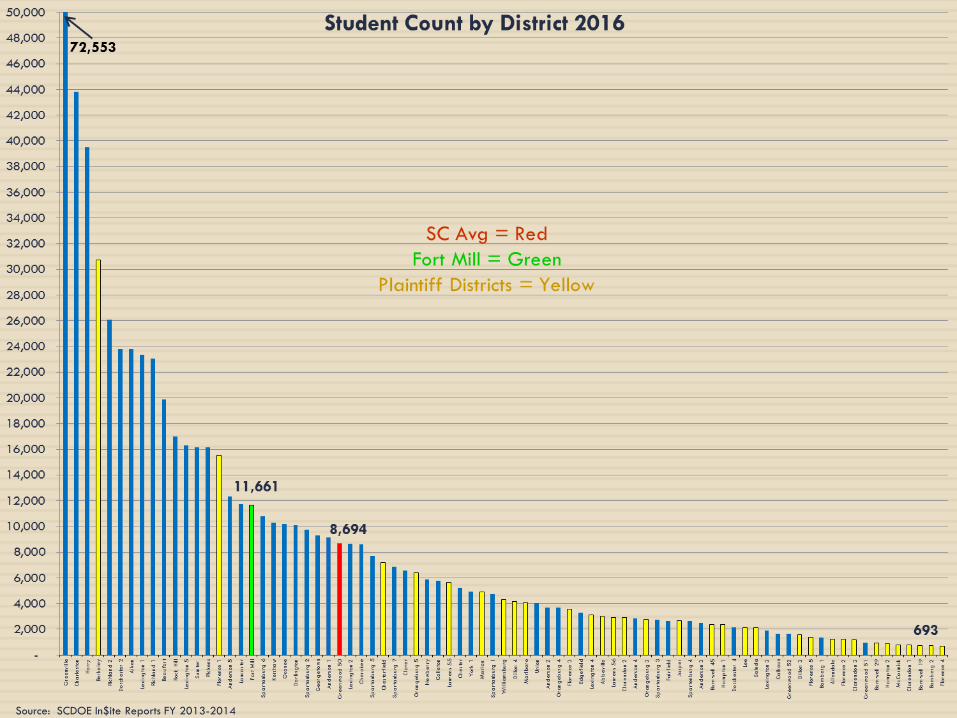
Source: SCDOE In$ite Reports FY 2013-2014

SC Avg = Red
Fort Mill = Green
Plaintiff Districts = Yellow
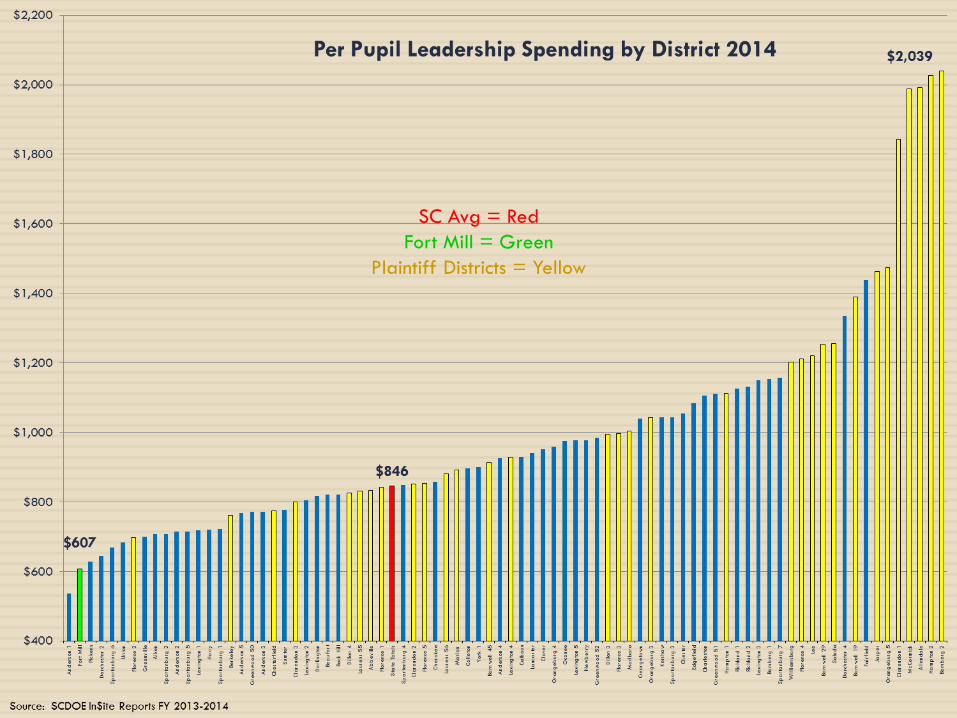
Source: SCDOE In$ite Reports FY 2013-2014

Source: SCDOE In$ite Reports FY 2013-2014

SC Avg = Red
Fort Mill = Green
Plaintiff Districts = Yellow
Source: SCDOE In$ite Reports FY 2013-2014
SC Avg = Red
Fort Mill = Green
Plaintiff Districts = Yellow

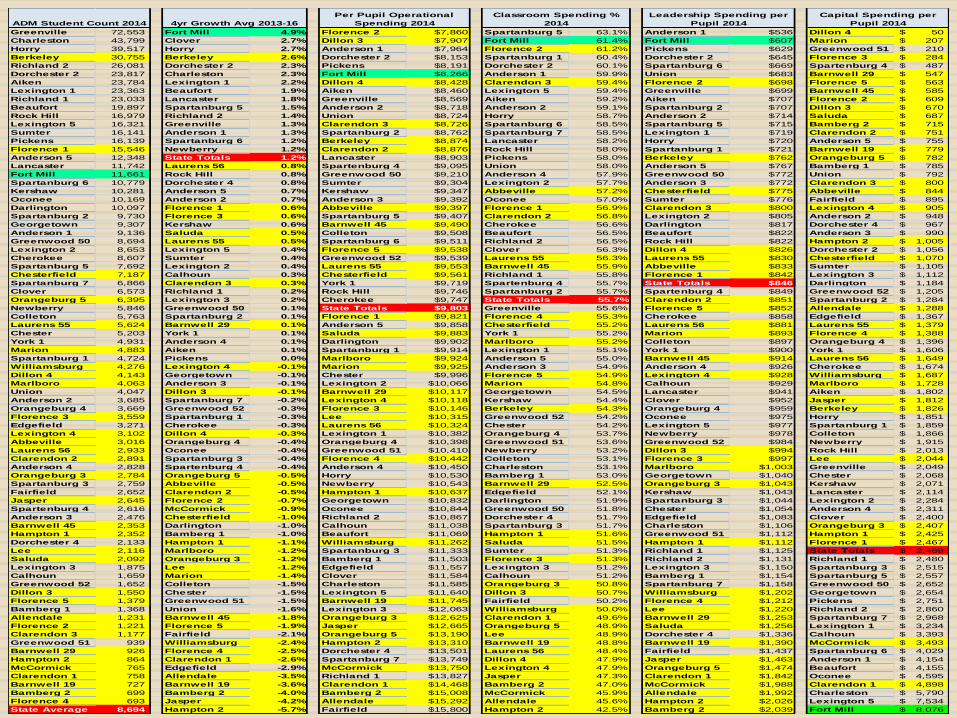
Greenville 72,553 Fort Mill 4.9% Florence 2 $7,860 Spartanburg 5 63.1% Anderson 1 $536 Dillon 4 50$
Charleston 43,799 Clover 2.7% Dillon 3 $7,907 Fort Mill 61.4% Fort Mill $607 Marion 207$
Horry 39,517 Horry 2.7% Anderson 1 $7,964 Florence 2 61.2% Pickens $629 Greenwood 51 210$
Berkeley 30,755 Berkeley 2.6% Dorchester 2 $8,153 Spartanburg 1 60.4% Dorchester 2 $645 Florence 3 284$
Richland 2 26,081 Dorchester 2 2.3% Pickens $8,191 Dorchester 2 60.1% Spartanburg 6 $669 Spartenburg 4 487$
Dorchester 2 23,817 Charleston 2.3% Fort Mill $8,266 Anderson 1 59.9% Union $683 Barnwell 29 547$
Aiken 23,784 Lexington 1 2.2% Dillon 4 $8,428 Clarendon 3 59.4% Florence 2 $698 Florence 5 563$
Lexington 1 23,363 Beaufort 1.9% Aiken $8,460 Lexington 5 59.4% Greenville $699 Barnwell 45 585$
Richland 1 23,033 Lancaster 1.8% Greenville $8,569 Aiken 59.2% Aiken $707 Florence 2 609$
Beaufort 19,897 Spartanburg 5 1.5% Anderson 2 $8,718 Anderson 2 59.1% Spartanburg 2 $707 Dillon 3 670$
Rock Hill 16,979 Richland 2 1.4% Union $8,724 Horry 58.7% Anderson 2 $714 Saluda 687$
Lexington 5 16,321 Greenville 1.3% Clarendon 3 $8,726 Spartanburg 6 58.5% Spartanburg 5 $715 Bamberg 2 715$
Sumter 16,141 Anderson 1 1.3% Spartanburg 2 $8,762 Spartanburg 7 58.5% Lexington 1 $719 Clarendon 2 751$
Pickens 16,139 Spartanburg 6 1.2% Berkeley $8,874 Lancaster 58.2% Horry $720 Anderson 5 755$
Florence 1 15,546 Newberry 1.2% Clarendon 2 $8,876 Rock Hill 58.0% Spartanburg 1 $721 Barnwell 19 779$
Anderson 5 12,348 State Totals 1.2% Lancaster $8,903 Pickens 58.0% Berkeley $762 Orangeburg 5 782$
Lancaster 11,742 Laurens 56 0.8% Spartenburg 4 $9,095 Union 58.0% Anderson 5 $767 Bamberg 1 785$
Fort Mill 11,661 Rock Hill 0.8% Greenwood 50 $9,210 Anderson 4 57.9% Greenwood 50 $772 Union 792$
Spartanburg 6 10,779 Dorchester 4 0.8% Sumter $9,304 Lexington 2 57.7% Anderson 3 $772 Clarendon 3 800$
Kershaw 10,281 Anderson 5 0.7% Kershaw $9,347 Abbeville 57.2% Chesterfield $775 Abbeville 844$
Oconee 10,169 Anderson 2 0.7% Anderson 3 $9,392 Oconee 57.0% Sumter $776 Fairfield 895$
Darlington 10,097 Florence 1 0.6% Abbeville $9,397 Florence 1 56.9% Clarendon 3 $800 Lexington 4 905$
Spartanburg 2 9,730 Florence 3 0.6% Spartanburg 5 $9,407 Clarendon 2 56.8% Lexington 2 $805 Anderson 2 948$
Georgetown 9,307 Kershaw 0.6% Barnwell 45 $9,490 Cherokee 56.6% Darlington $817 Dorchester 4 967$
Anderson 1 9,136 Saluda 0.5% Colleton $9,508 Beaufort 56.5% Beaufort $822 Anderson 3 990$
Greenwood 50 8,694 Laurens 55 0.5% Spartanburg 6 $9,511 Richland 2 56.5% Rock Hill $822 Hampton 2 1,005$
Lexington 2 8,653 Lexington 5 0.4% Florence 5 $9,538 Clover 56.3% Dillon 4 $826 Dorchester 2 1,056$
Cherokee 8,607 Sumter 0.4% Greenwood 52 $9,539 Laurens 55 56.3% Laurens 55 $830 Chesterfield 1,070$
Spartanburg 5 7,692 Lexington 2 0.4% Laurens 55 $9,553 Barnwell 45 55.9% Abbeville $833 Sumter 1,105$
Chesterfield 7,187 Calhoun 0.3% Chesterfield $9,561 Richland 1 55.8% Florence 1 $842 Lexington 3 1,112$
Spartanburg 7 6,866 Clarendon 3 0.3% York 1 $9,719 Spartenburg 4 55.7% State Totals $846 Darlington 1,184$
Clover 6,573 Richland 1 0.2% Rock Hill $9,746 Spartanburg 2 55.7% Spartenburg 4 $849 Greenwood 52 1,205$
Orangeburg 5 6,395 Lexington 3 0.2% Cherokee $9,747 State Totals 55.7% Clarendon 2 $851 Spartanburg 2 1,284$
Newberry 5,846 Greenwood 50 0.1% State Totals $9,803 Greenville 55.6% Florence 5 $852 Allendale 1,288$
Colleton 5,763 Spartanburg 2 0.1% Florence 1 $9,821 Florence 4 55.3% Cherokee $858 Edgefield 1,367$
Laurens 55 5,624 Barnwell 29 0.1% Anderson 5 $9,858 Chesterfield 55.2% Laurens 56 $881 Laurens 55 1,379$
Chester 5,203 York 1 0.1% Saluda $9,883 York 1 55.2% Marion $893 Florence 4 1,388$
York 1 4,931 Anderson 4 0.1% Darlington $9,902 Marlboro 55.2% Colleton $897 Orangeburg 4 1,396$
Marion 4,883 Aiken 0.1% Spartanburg 1 $9,914 Lexington 1 55.1% York 1 $900 York 1 1,606$
Spartanburg 1 4,724 Pickens 0.0% Marlboro $9,924 Anderson 5 55.0% Barnwell 45 $914 Laurens 56 1,649$
Williamsburg 4,276 Lexington 4 -0.1% Marion $9,925 Anderson 3 54.9% Anderson 4 $926 Cherokee 1,674$
Dillon 4 4,143 Georgetown -0.1% Chester $9,996 Florence 5 54.9% Lexington 4 $928 Williamsburg 1,687$
Marlboro 4,063 Anderson 3 -0.1% Lexington 2 $10,066 Marion 54.8% Calhoun $929 Marlboro 1,728$
Union 4,047 Dillon 3 -0.1% Barnwell 29 $10,117 Georgetown 54.5% Lancaster $941 Aiken 1,802$
Anderson 2 3,685 Spartanburg 7 -0.2% Lexington 4 $10,118 Kershaw 54.4% Clover $952 Jasper 1,812$
Orangeburg 4 3,669 Greenwood 52 -0.3% Florence 3 $10,146 Berkeley 54.3% Orangeburg 4 $959 Berkeley 1,826$
Florence 3 3,559 Spartanburg 1 -0.3% Lee $10,315 Greenwood 52 54.2% Oconee $975 Horry 1,851$
Edgefield 3,271 Cherokee -0.3% Laurens 56 $10,324 Chester 54.2% Lexington 5 $977 Spartanburg 1 1,859$
Lexington 4 3,102 Dillon 4 -0.3% Lexington 1 $10,382 Orangeburg 4 53.7% Newberry $978 Colleton 1,866$
Abbeville 3,016 Orangeburg 4 -0.4% Orangeburg 4 $10,398 Greenwood 51 53.6% Greenwood 52 $984 Newberry 1,915$
Laurens 56 2,933 Oconee -0.4% Greenwood 51 $10,410 Newberry 53.2% Dillon 3 $994 Rock Hill 2,013$
Clarendon 2 2,891 Spartanburg 3 -0.4% Florence 4 $10,442 Colleton 53.1% Florence 3 $997 Lee 2,044$
Anderson 4 2,828 Spartenburg 4 -0.4% Anderson 4 $10,450 Charleston 53.1% Marlboro $1,003 Greenville 2,049$
Orangeburg 3 2,784 Orangeburg 5 -0.5% Horry $10,530 Bamberg 1 53.0% Georgetown $1,040 Chester 2,068$
Spartanburg 3 2,759 Abbeville -0.5% Newberry $10,543 Barnwell 29 52.5% Orangeburg 3 $1,043 Kershaw 2,071$
Fairfield 2,652 Clarendon 2 -0.5% Hampton 1 $10,637 Edgefield 52.1% Kershaw $1,043 Lancaster 2,114$
Jasper 2,645 Florence 2 -0.7% Georgetown $10,832 Darlington 51.9% Spartanburg 3 $1,044 Lexington 2 2,284$
Spartenburg 4 2,616 McCormick -0.9% Oconee $10,844 Greenwood 50 51.8% Chester $1,054 Anderson 4 2,311$
Anderson 3 2,476 Chesterfield -1.0% Richland 2 $10,867 Dorchester 4 51.7% Edgefield $1,083 Clover 2,400$
Barnwell 45 2,353 Darlington -1.0% Calhoun $11,038 Spartanburg 3 51.7% Charleston $1,106 Orangeburg 3 2,407$
Hampton 1 2,352 Bamberg 1 -1.0% Beaufort $11,069 Hampton 1 51.6% Greenwood 51 $1,112 Hampton 1 2,425$
Dorchester 4 2,133 Hampton 1 -1.1% Williamsburg $11,262 Saluda 51.5% Hampton 1 $1,112 Florence 1 2,467$
Lee 2,116 Marlboro -1.2% Spartanburg 3 $11,333 Sumter 51.3% Richland 1 $1,125 State Totals 2,469$
Saluda 2,092 Orangeburg 3 -1.2% Bamberg 1 $11,503 Florence 3 51.3% Richland 2 $1,131 Richland 1 2,480$
Lexington 3 1,875 Lee -1.2% Edgefield $11,557 Lexington 3 51.2% Lexington 3 $1,150 Spartanburg 3 2,515$
Calhoun 1,659 Marion -1.4% Clover $11,584 Calhoun 51.2% Bamberg 1 $1,154 Spartanburg 5 2,557$
Greenwood 52 1,652 Colleton -1.5% Charleston $11,585 Orangeburg 3 50.8% Spartanburg 7 $1,158 Greenwood 50 2,652$
Dillon 3 1,550 Chester -1.5% Lexington 5 $11,640 Dillon 3 50.7% Williamsburg $1,202 Georgetown 2,654$
Florence 5 1,379 Greenwood 51 -1.5% Barnwell 19 $11,745 Fairfield 50.2% Florence 4 $1,212 Pickens 2,751$
Bamberg 1 1,368 Union -1.6% Lexington 3 $12,063 Williamsburg 50.0% Lee $1,220 Richland 2 2,860$
Allendale 1,231 Barnwell 45 -1.8% Orangeburg 3 $12,625 Clarendon 1 49.6% Barnwell 29 $1,253 Spartanburg 7 2,968$
Florence 2 1,221 Florence 5 -1.9% Jasper $12,665 Orangeburg 5 48.9% Saluda $1,256 Lexington 1 3,234$
Clarendon 3 1,177 Fairfield -2.1% Orangeburg 5 $13,190 Lee 48.9% Dorchester 4 $1,336 Calhoun 3,393$
Greenwood 51 939 Williamsburg -2.4% Hampton 2 $13,310 Barnwell 19 48.8% Barnwell 19 $1,390 McCormick 3,493$
Barnwell 29 926 Florence 4 -2.5% Dorchester 4 $13,501 Laurens 56 48.4% Fairfield $1,437 Spartanburg 6 4,029$
Hampton 2 864 Clarendon 1 -2.6% Spartanburg 7 $13,749 Dillon 4 47.9% Jasper $1,463 Anderson 1 4,154$
McCormick 765 Edgefield -2.9% McCormick $13,750 Lexington 4 47.9% Orangeburg 5 $1,474 Beaufort 4,155$
Clarendon 1 758 Allendale -3.5% Richland 1 $13,827 Jasper 47.3% Clarendon 1 $1,842 Oconee 4,595$
Barnwell 19 727 Barnwell 19 -3.6% Clarendon 1 $14,468 Bamberg 2 47.0% McCormick $1,988 Clarendon 1 4,898$
Bamberg 2 699 Bamberg 2 -4.0% Bamberg 2 $15,008 McCormick 45.9% Allendale $1,992 Charleston 5,790$
Florence 4 693 Jasper -4.2% Allendale $15,292 Allendale 45.6% Hampton 2 $2,026 Lexington 5 7,534$
State Average 8,694 Hampton 2 -5.7% Fairfield $15,800 Hampton 2 42.5% Bamberg 2 $2,039 Fort Mill 8,076$
Capital Spending per
Pupil 20144yr Growth Avg 2013-16
Per Pupil Operational
Spending 2014
Classroom Spending %
2014
Leadership Spending per
Pupil 2014ADM Student Count 2014


Impact of Weighted Pupil Units on FMSD
600,000
650,000
700,000
750,000
800,000
850,000
900,000
950,000
1,000,000
1,050,000
Historical ADMs and WPUs
ADM 135-DAY WPU 135-DAY
In 2013 the SC Legislature added four new categories for pupil weightings:
Poverty, ESL, Gifted & Talented, and Academic Assistance.
While this change had the effect of increasing revenue for high poverty
districts, it resulted in a loss of funding for the FMSD of more than $1.25MM
in the first year alone.
Source: Mike Shealy, Budget Director