Embed Size (px)
Citation preview
Durham Research Online
Deposited in DRO:
27 May 2008
Version of attached �le:
Published Version
Peer-review status of attached �le:
Peer-reviewed
Citation for published item:
Kotsialos, A. and Papageorgiou, M. and Diakaki, C. and Pavlis, Y. and Middelham, F. (2002) 'Tra�c �owmodeling of large-scale motorway networks using the macroscopic modeling tool METANET.', IEEEtransactions on intelligent transportation systems., 3 (4). pp. 282-292.
Further information on publisher's website:
http://dx.doi.org/10.1109/TITS.2002.806804
Publisher's copyright statement:
c©2002 IEEE. Personal use of this material is permitted. However, permission to reprint/republish this material foradvertising or promotional purposes or for creating new collective works for resale or redistribution to servers or lists,or to reuse any copyrighted component of this work in other works must be obtained from the IEEE.
Additional information:
Use policy
The full-text may be used and/or reproduced, and given to third parties in any format or medium, without prior permission or charge, forpersonal research or study, educational, or not-for-pro�t purposes provided that:
• a full bibliographic reference is made to the original source
• a link is made to the metadata record in DRO
• the full-text is not changed in any way
The full-text must not be sold in any format or medium without the formal permission of the copyright holders.
Please consult the full DRO policy for further details.
Durham University Library, Stockton Road, Durham DH1 3LY, United KingdomTel : +44 (0)191 334 3042 | Fax : +44 (0)191 334 2971
http://dro-test.dur.ac.uk
282 IEEE TRANSACTIONS ON INTELLIGENT TRANSPORTATION SYSTEMS, VOL. 3, NO. 4, DECEMBER 2002
Traffic Flow Modeling of Large-ScaleMotorway Networks Using the Macroscopic
Modeling Tool METANETApostolos Kotsialos, Markos Papageorgiou, Fellow, IEEE, Christina Diakaki, Yannis Pavlis, and Frans Middelham
Abstract—This paper employs previously developed modeling,validation, and stimulation tools to address, for the first time,the realistic macroscopic simulation of a real large-scale mo-torway network. More specifically, the macroscopic simulatorMETANET, involving a second-order traffic flow model as well asnetwork-relevant extensions, is utilized. A rigorous quantitativevalidation procedure is applied to individual network links,and subsequently a heuristic qualitative validation procedure isemployed at a network level. The large-scale motorway networkaround Amsterdam, The Netherlands, is considered in this inves-tigation. The main goal of the paper is to describe the applicationapproach and procedures and to demonstrate the accuracy andusefulness of macroscopic modeling tools for large-scale motorwaynetworks.
Index Terms—Modeling, motorway networks, simulation, trafficflow, validation.
I. INTRODUCTION
ONE OF THE major needs in the area of intelligent trans-portation systems (ITS) is the modeling of the traffic flow
process in large-scale motorway networks. The notoriously in-creasing number of vehicles that use the provided network ca-pacity has lead to severe problems in the form of recurrent andnonrecurrent congestion resulting in serious economic and envi-ronmental problems, as well as increased public frustration anddiscomfort.
Two complementary approaches for solving problems causedby motorway congestion phenomena are possible without di-verting demand to other modes of transportation. The first oneis to construct new motorways, i.e. address the problem by pro-viding additional capacity to the networks. Land availability is-sues, especially in and around large metropolitan areas, and en-vironmental considerations render this approach little attractive.
Manuscript received September 22, 2000; revised November 11, 2002. Thiswork has been supported in part by the European Telamatics Application Pro-gramme within the framework of the DACCORD project (TR 1017). The con-tent of this paper is under the sole responsibility of the authors and in no wayrepresents the views of the European Commission. The Associate Editor for thispaper was P. A. Ioannou.
A. Kotsialos, M. Papageorgiou, C. Diakaki are with the Dynamic Systems andSimulation Laboratory, Technical University of Crete, Chania 73100, Greece(e-mail: [email protected]; [email protected]; [email protected]).
Y. Pavlis is with the Department of Civil and Environmental Engineering,University of California at Irvine, Irvine, CA 92697-3600 USA (e-mail:[email protected]).
F. Middelham is with the Transport Research Centre of the Dutch Ministryof Transport, Public Works and Water Management, Boompjes 200, 3000 BARotterdam, The Netherlands (e-mail: [email protected]).
Digital Object Identifier 10.1109/TITS.2002.806804
The second approach is based on the fact that the capacity pro-vided by the existing infrastructure is practically underutilized,i.e. it is not fully exploited. Thus, before building new infra-structure, the full exploitation of the already existing infrastruc-ture should be ensured. Recent developments in control, com-munications, and computer technology has made this task fea-sible and financially viable. Indeed, in many metropolitan areasTraffic Control Centres (TCC) operate performing a variety oftasks such as traffic monitoring, prediction, and control. It iswithin this framework that reliable traffic models become im-portant for any of the following tasks:
•Simulation. A traffic flow model is needed when the trafficprocess has to be simulated for a number of different scenariosand conditions. For example, when the impact of adding anew link to a network, thus adding capacity, or performingroad works, thus reducing capacity, has to be studied, thensimulation of the traffic flow process, under different scenarios,is vital for sound and efficient decision making.
•Traffic prediction. The purpose of traffic prediction is to pro-vide reliable forecasts of the traffic conditions that will occur ina network over a predetermined future time horizon. Traffic pre-diction may be performed on-line so as to enable operators of aTCC to anticipate the impact of various events that take place inthe network, such as incidents or high demands at certain loca-tions. The successful performance of this task calls for a realistictraffic flow model able to anticipate the short-term traffic con-ditions that are likely to prevail.
•Traffic control. Traffic control operations in the context ofa TCC aim at ameliorating traffic conditions through the sys-tematic use of control measures applied to the traffic process,such as ramp metering, motorway-to-motorway (mtm) control,route recommendation (via Variable Message Signs (VMS) orappropriately equipped vehicles), variable speed limitation, etc.A traffic model is required either for the off-line study of theimpact a given control strategy may have on the process, or forthe design of the control strategies themselves.
Depending on the view adopted, modeling of the trafficprocess may be performed at the microscopic, the mesoscopic,or the macroscopic level. In this paper we will confine ourselveswithin the macroscopic approach toward traffic flow modeling.In this approach, traffic flow is treated as an one-dimensionalcompressible fluid with specific characteristics. The firstmacroscopic modeling theory for traffic flow on a highwaystretch was reported independently in [1] and [2], where thefundamental laws of kinematic wave theory were establishedand the background for future macroscopic approaches to
1524-9050/02$17.00 © 2002 IEEE

KOTSIALOS et al.: TRAFFIC FLOW MODELING OF LARGE-SCALE MOTORWAY NETWORKS 283
traffic flow modeling in motorways was laid. A potentiallymore accurate second-order traffic flow model was proposed in[3] which was extended in [4] and [5] to improve its reliabilityin merging areas, i.e. around on-ramps or at lane-drop loca-tions. A macroscopic modeling concept that allows traffic flowmodels to be embedded in a network context, with multipleorigins, multiple destinations, and multiple routes for eachorigin-destination couple was developed in [6]. A number ofmacroscopic simulators such as METANET [7], METACOR[8], NETCELL [9], STRADA [10] are based on that concept.
An essential issue related to motorway traffic modeling ismodel validation. Previous validation efforts were based ontraffic data from various motorway stretches ([11], [4], [5],[12]) and aimed at optimal estimation of the model parametersso as to maximize the modeling accuracy.
This paper employs previously developed modeling, valida-tion, and simulation tools to address, for the first time, the re-alistic macroscopic simulation of a real large-scale motorwaynetwork. More specifically:
• the macroscopic simulator METANET, involving asecond-order traffic flow model as well as network-rele-vant extensions, is utilized;
• a rigorous quantitative validation procedure is applied toindividual network links;
• a heuristic qualitative validation procedure is used at anetwork level;
• the large-scale motorway network around Amsterdam,The Netherlands, is considered in this investigation.
The main goal of the paper is to describe the application ap-proach and procedures and to demonstrate the accuracy and use-fulness of macroscopic modeling tools for large-scale motorwaynetworks.
The rest of this paper is organized as follows. Section II de-scribes in some detail the modeling approach employed. Sec-tion III describes the model application to the Amsterdam mo-torway network while Section IV presents the validation proce-dure followed along with the obtained results. Finally, Section Vdiscusses the main conclusions drawn from the reported effortas well as future work.
II. M ODELING APPROACH
A. Model Overview
The Amsterdam network was modeled using the modelingtool METANET, see [7]. METANET is a deterministic macro-scopic modeling tool for simulating traffic flow phenomena inmotorway networks of arbitrary topology and characteristics,including motorway stretches, bifurcations, on-ramps, andoff-ramps. This modeling approach allows for simulation ofall kinds of traffic conditions (free, dense, congested) and ofcapacity-reducing events (incidents) with prescribed character-istics (location, intensity, duration). Furthermore METANETallows for taking into account control actions such as rampmetering, route guidance, and mtm control.
METANET has two distinct modes of operation. When trafficassignment (i.e. the drivers’ route choice behavior) aspects arenot considered, then it operates in thenon destination-oriented
Fig. 1. Discretised motorway link.
mode. When traffic assignment is an issue, it operates in thedestination-oriented mode.
The motorway network is represented as a directed graphwhereby the links of the graph represent homogeneous mo-torway stretches. Each such motorway stretch has uniform char-acteristics, i.e., no on/off-ramps and no major changes in ge-ometry. The nodes of the graph are placed at locations where amajor change in road geometry occurs, as well as at junctions,on-ramps, and off-ramps.
B. Definition of Basic Traffic Variables
The macroscopic description of traffic flow implies the defi-nition of adequate variables expressing the average behavior oftraffic at certain times and locations. The time and space argu-ments are discretised. The time discretization is global, but thespace discretization is defined for each link separately. The dis-crete time step is denoted by. A motorway link is dividedinto segments of equal length (Fig. 1). For each segmentof each link at each time instant , ,where is the time horizon, the following macroscopic vari-ables are defined.
• Traffic density: (veh/km/lane) is the number ofvehicles in segmentof link at time divided by thelength of the segment and by the number of lanes .
• Mean speed: (km/h) is the mean speed of the ve-hicles included in segmentof link at time .
• Traffic volume or flow: (veh/h) is the number ofvehicles leaving segmentof link during the period[ ], divided by .
Furthermore, for the destination-oriented mode of operation,the following variables are introduced:
• Thepartial density is the density of vehicles insegment of link at time destined to destination
, where is the set of destinations reachable vialink .
• The composition rate , isthe portion of traffic volume which is destined todestination .
C. Link Model
Five types of links are used when a motorway network ismodeled. First, there are themotorway linkswhich are used forthe representation of homogeneous motorway stretches. Trafficconditions therein are described by the aforementioned basictraffic variables. Second, there are theorigin linkswhich receive
284 IEEE TRANSACTIONS ON INTELLIGENT TRANSPORTATION SYSTEMS, VOL. 3, NO. 4, DECEMBER 2002
traffic demand (volume) from outside the network and forwardit into the main network. An origin link is characterized by itsflow capacity and its queue. Third, there are the destination linkswhich receive traffic flow from inside the network and push itoutside. Traffic conditions indestination linksare influenced bythe corresponding downstream traffic conditions. Fourth, thereare store-and-forwardlinks which are characterized by theirqueue length, their flow capacity, and their constant travel time.Finally, there aredummy links, with zero length, which are usedin order to decompose complex network nodes.
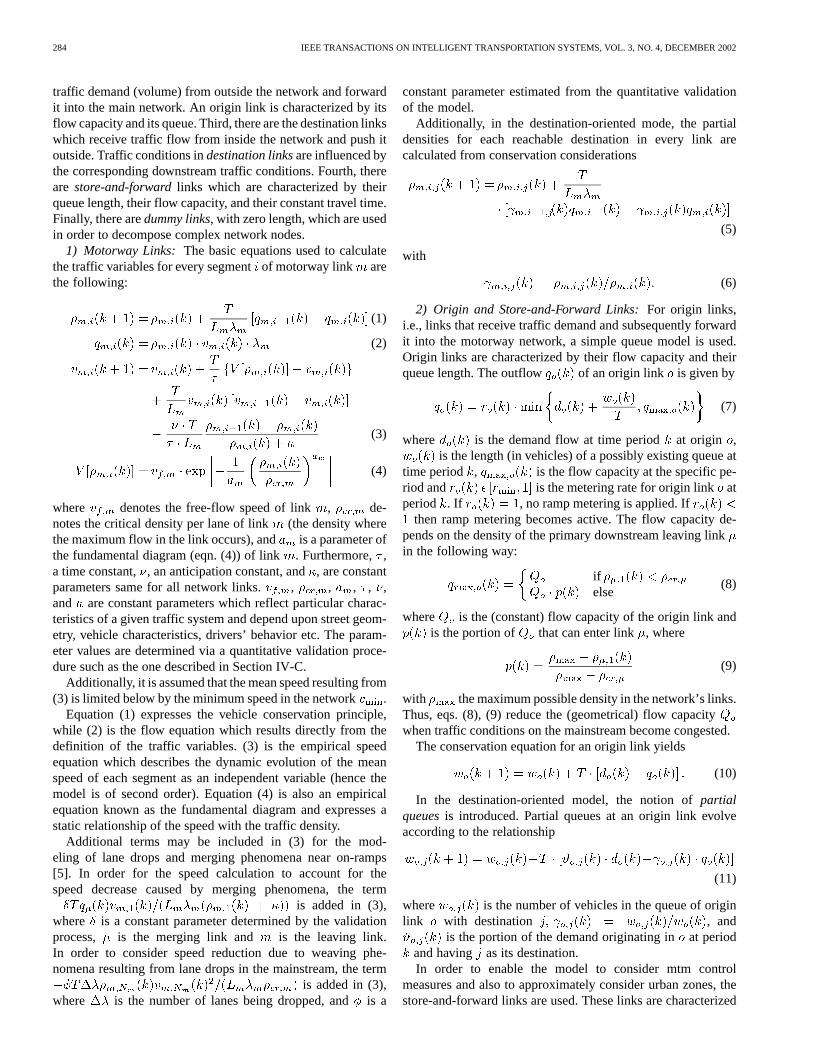
1) Motorway Links: The basic equations used to calculatethe traffic variables for every segmentof motorway link arethe following:
(1)
(2)
(3)
(4)
where denotes the free-flow speed of link, de-notes the critical density per lane of link (the density wherethe maximum flow in the link occurs), and is a parameter ofthe fundamental diagram (eqn. (4)) of link. Furthermore, ,a time constant, , an anticipation constant, and, are constantparameters same for all network links. , , , , ,and are constant parameters which reflect particular charac-teristics of a given traffic system and depend upon street geom-etry, vehicle characteristics, drivers’ behavior etc. The param-eter values are determined via a quantitative validation proce-dure such as the one described in Section IV-C.
Additionally, it is assumed that the mean speed resulting from(3) is limited below by the minimum speed in the network .
Equation (1) expresses the vehicle conservation principle,while (2) is the flow equation which results directly from thedefinition of the traffic variables. (3) is the empirical speedequation which describes the dynamic evolution of the meanspeed of each segment as an independent variable (hence themodel is of second order). Equation (4) is also an empiricalequation known as the fundamental diagram and expresses astatic relationship of the speed with the traffic density.
Additional terms may be included in (3) for the mod-eling of lane drops and merging phenomena near on-ramps[5]. In order for the speed calculation to account for thespeed decrease caused by merging phenomena, the term
is added in (3),where is a constant parameter determined by the validationprocess, is the merging link and is the leaving link.In order to consider speed reduction due to weaving phe-nomena resulting from lane drops in the mainstream, the term
is added in (3),where is the number of lanes being dropped, andis a
constant parameter estimated from the quantitative validationof the model.
Additionally, in the destination-oriented mode, the partialdensities for each reachable destination in every link arecalculated from conservation considerations
(5)
with
(6)
2) Origin and Store-and-Forward Links:For origin links,i.e., links that receive traffic demand and subsequently forwardit into the motorway network, a simple queue model is used.Origin links are characterized by their flow capacity and theirqueue length. The outflow of an origin link is given by
(7)
where is the demand flow at time period at origin ,is the length (in vehicles) of a possibly existing queue at
time period , is the flow capacity at the specific pe-riod and is the metering rate for origin link atperiod . If , no ramp metering is applied. If
then ramp metering becomes active. The flow capacity de-pends on the density of the primary downstream leaving linkin the following way:
ifelse
(8)
where is the (constant) flow capacity of the origin link andis the portion of that can enter link , where
(9)
with the maximum possible density in the network’s links.Thus, eqs. (8), (9) reduce the (geometrical) flow capacitywhen traffic conditions on the mainstream become congested.
The conservation equation for an origin link yields
(10)
In the destination-oriented model, the notion ofpartialqueuesis introduced. Partial queues at an origin link evolveaccording to the relationship
(11)
where is the number of vehicles in the queue of originlink with destination , and
is the portion of the demand originating inat periodand having as its destination.In order to enable the model to consider mtm control
measures and also to approximately consider urban zones, thestore-and-forward links are used. These links are characterized

KOTSIALOS et al.: TRAFFIC FLOW MODELING OF LARGE-SCALE MOTORWAY NETWORKS 285
by their flow capacity, their queue length, and their constanttravel time. For the determination of their outflow and theirqueue length, equations similar to (7)–(11) hold.
3) Destination and Dummy Links:Traffic conditions in des-tination links are influenced by the downstream traffic condi-tions which may be provided as boundary conditions for thewhole time horizon. If no measurements for boundary condi-tions are available, it is assumed that the downstream trafficconditions are uncongested. Dummy links are auxiliary linksof zero length. They do not affect traffic dynamics and they areused to decompose complex network topologies or to representvery short motorway connections.
D. Node Model
Contrary to the link model, the node model does not exhibitany dynamic behavior. Let be the total traffic volumeentering a motorway node at period . Then theturning rate
is the portion of traffic volume which leaves nodeat period through link , where is the set of links
leaving node . Let be the set of links entering node. Thefollowing equations hold:
(12)
(13)
where is the traffic volume that leaves nodevia out-link . Equations (12) and (13) provide needed in (1)for =1. In the destination-oriented mode, the notion of turningrates is generalized to the notion ofsplitting rates. Letbe the total traffic volume entering a motorway nodeat period
that is destined to destination. Then, the splitting rateis the portion of traffic volume which leaves nodeat period through link . In the case where route guid-ance takes place at nodewith respect to destination (withthe use of VMS or other means), is used to describe theresulting splitting. In the presence of VMS, an indicating split-ting may be defined; if the sign guides drivers toward
via (the main route), , else .The relation between and the resulting splitting rate ismodeled by the following equation
(14)
where is the compliance rate to the route recommendations( , and is the portion of vehicles that take themain route in absence of any route recommendations.
The following equations hold for any network node
(15)
(16)
(17)
Equations (15)–(17) provide and which areneeded in (5) for . When a node has more than one
leaving links, then the upstream influence of density has to betaken into account in the last segment of the incoming link (see(3)). This is provided via
(18)
where is the virtual density downstream of the en-tering link to be used in eqn. (3) for , and isthe density of the first segment of leaving link. The quadraticterm is used in (18) to account for the fact that one congestedleaving link may block the entering link even if there is free flowin the other leaving link.
When a node has more than one entering links, then thedownstream influence of speed has to be taken into account ac-cording to (3). The mean speed value is calculated from
(19)
where is the virtual speed upstream of the leaving linkmthat is needed in (3) for .
E. Model Summary
From the previous sections, a nonlinear dynamic model of theform
(20)
can be obtained for the entire motorway network, whereisthe state vector, is the control vector, and is the disturbancevector.
In the non destination-oriented mode, (20) is obtained by sub-stituting (2), (12), (13) into (1); (4), (18), (19) into (3); and (7),(8), (9) into (10). In this case, the state vector consists of thedensities and mean speeds of every segmentof everylink , and the queues of every origin and store-and-forwardlink . The control vector consists of the ramp metering ratesof every on-ramp and store-and-forward link metered. The dis-turbance vector consists of the demandsat every origin link
and the turning rates at every bifurcation node.In thedestination-oriented mode, eq. (20) is obtained by substituting(2), (15)–(17) into (5); (4), (18), (19) into (3); and (7)–(9) into(11). In this case, the state vector consists of the partial densities
of every segmentand reachable destinationfrom link, the mean speed of every segmentof every link , and
the partial queues of every origin and store-and-forwardlink . The control vector consists of the ramp metering ratesof every on-ramp and store-and-forward link, and of the split-ting rates for every bifurcation where route guidance withrespect to destinationtakes place. The disturbance vector con-sists of the demands at every origin link , the compositionrates of the demand (OD matrix), the splitting ratesat every bifurcation node where no route guidance is applied,and the drivers’ compliance rates.
The state space formulation described is very usuful since itallows for the use of well known methods from the automaticcontrol theory to the problem of motorway network traffic con-trol, see [13].

286 IEEE TRANSACTIONS ON INTELLIGENT TRANSPORTATION SYSTEMS, VOL. 3, NO. 4, DECEMBER 2002
Fig. 2. Amsterdam motorway network.
III. M ODEL APPLICATION TO THEAMSTERDAM NETWORK
A. Description of the Amsterdam Motorway Network
The objective of this section is to describe the Amsterdam testsite consisting of the Amsterdam Orbital Motorway (A10) andcertain parts of the regional motorway network. An overview ofthe Amsterdam test site is shown in Fig. 2.
The central feature of the site is the Amsterdam OrbitalMotorway (the A10). The A10 simultaneously serves local,regional, and inter-regional traffic and acts as a hub for trafficentering and exiting North Holland. To the North, the A8motorway feeds into it, carrying a large amount of commutingtraffic to Amsterdam. To the Southwest, the A4 carries most ofthe traffic between the North of the country and attractors in theSouth such as Schiphol Airport, The Hague, and Rotterdam.South of the A10, the A9 forms a bypass for traffic betweenthe North-east on the one hand and the Centre of the countryas well as the region between Amsterdam and The Hague(including Schiphol airport) on the other. A2 connects the A10to the A9 bypass and connects the A10 with the Centre of thecountry. Finally, to the South-east, the A1 connects to the A10,and serves traffic between the North and Centre of the country.
The A10 contains two tunnels, the Coen Tunnel at theNorth-west of A10 and the Zeeburg Tunnel at the North-east,which effectively divide the orbital motorway into two sections:the “North Ring” and the “Ring West/South/East”.
The network is subject to considerable recurrent congestion.Congestion is especially heavy on the north-western andsouthern parts of the A10, but less so on the north-eastern part.Due to the network structure and the current network load,route choice is a factor of influence on this network, whichpresents a potential for dynamic traffic management.
TABLE IMODELED MOTORWAYS
Fig. 3. Amsterdam network representation.
B. Model of the Amsterdam Motorway Network
Each motorway of the Amsterdam network was modeled inboth directions. Table I shows the limits of the motorways thatwere considered. The total length of the network is 143 km (bothdirections), and its main part is the A10 ring road which engulfsAmsterdam. The total number of links that was used to modelthe motorway network is 654 (all types of links). This numberincludes 249 motorway links, 231 store-and-forward links, and174 dummy links. The motorway links were divided into a totalof 291 segments. The length of each segment ranges from 400to 800 m. Taking into account the total motorway length con-sidered and the number of segments used, the average segmentlength is 491.4 m. Fig. 3 depicts the resulting modeled network,along with the kilometer numbers at the points where the mo-torways are connected.
At the North, the 5-km section of the A8 considered may beseen. The ring road A10 is the dominant (and most important)motorway. Connected with A10 to the South are (from left toright) the A4, the A2, and the A1 motorways. The A9 further tothe South connects these four motorways thereby forming twosecondary rings.
Adjacent to the motorways and in the center of the three rings,virtual origins and destinations are placed, each representing anurban zone. These virtual nodes are used in order to model theinfluence of the corresponding urban zones on motorway traffic,particularly with regard to route choices of drivers. Origins anddestinations in the modeled area may be connected via a purelymotorway or mixed path. In order to take into account the urban
KOTSIALOS et al.: TRAFFIC FLOW MODELING OF LARGE-SCALE MOTORWAY NETWORKS 287
connections in a simplified way, virtual links and nodes are suit-ably introduced. The links that are used are of store-and-forwardtype. Each such link is attached to a virtual node and has the taskof either receiving flow from the network and pushing it out ofit, into the urban area, or receiving flow from the urban area andthen pushing it into the network. From a specific stretch and agiven direction of the motorway, the on- and off-ramps are mod-eled as store-and-forward links which start/end from/at a virtualurban origin/destination. This is the reason for the large numberof store-and-forward links used.
Urban origins/destinations are placed in the network wherethere is a high concentration of on-ramps or off-ramps. An urbanorigin node concentrates all the demand originating from thecorresponding urban zone and distributes it to several adjacentmotorway on-ramps based on suitable dynamic traffic assign-ment considerations. Similarly, a destination node collects theoutflow of several adjacent motorway off-ramps that is des-tined to the corresponding urban zone. This approach has theadvantage that there is no need to model in detail the urban net-work, which would result in a significantly more complicatedsystem. Moreover the aggregation that is performed this wayat the on-/off-ramps results in the significant reduction of therequired origin-destination matrix dimension. In Fig. 3, the vir-tual urban nodes are placed within the loops, i.e. in the urbanareas. This feature of the model is not utilized in the presentapplication. It is part of future work that will be conducted forthe study of traffic assignment and route recommendation (viaVMS or equipped vehicles) control measures. Nevertheless, thenetwork’s model remains unaffected from this fact since it oper-ates in the non destination-oriented mode for the validation andthe internal urban routes are not considered.
Additionally, store-and-forward links are used to model theinteraction between two or more merging motorways. In thiscase store-and-forward links are placed as connection linksat motorway junctions. The queuing model of store-and-for-ward links provides a sufficient approximation for the trafficprocess at these points, and also facilitates the modeling ofmotorway-to-motorway control measures.
IV. M ODEL VALIDATION
The model validation procedure aims at enabling the wholemotorway network model to represent traffic conditions withsufficient accuracy. The methods used to this end are quantita-tive and qualitative in nature, and both procedures are presentedin this section.
A. Model Validation Overview
The macroscopic model presented in Section II includes anumber of parameters which have to be estimated in order toaccurately model the traffic flow of a particular network. Themodel validation for this particular case was performed in twosuccessive phases, the quantitative and the qualitative.
• Quantitative model validationaims essentially at estimatingmodel parameters through a well-defined straightforward proce-dure, and is carried out in two stages. In the first stage a groupof parameters that reflect particular characteristics of a givenmotorway stretch and depend upon highway geometry, vehicle
characteristics, drivers’ behavior, etc., is calibrated so as to fit arepresentative set of real data with the maximum possible accu-racy (parameter estimation). In the second stage, the developedmodel is applied with the estimated parameter values and the re-sults are compared with sets of traffic data different from thoseused in the parameter estimation stage (model verification).
• Qualitative model validationaims to represent traffic con-ditions not for isolated motorway stretches, as in the case ofthe quantitative validation, but for the entire motorway network.The goal is for the model to capture the network-wide dynamicsof traffic congestion, i.e. to be able to predict the location, du-ration, and propagation of congestion. While in the quantita-tive validation only isolated motorway stretches are considered,the qualitative validation aims at enabling the network modelto consider the interactions between the motorway stretches.The process of qualitatively validating the model consists ofmanually calibrating a number of parameters (i.e., turning rates,and store-and-forward links’ capacities and travel times) via re-peated computer simulations. After each simulation the resultsare compared against real data from locations around the net-work, particularly those where congestion appears, and a suit-able manual adjustment of a number of (or a single) parametersis performed based on the observation of whether or not con-gestion is predicted sufficiently accurately. Because neither aquantitative measure nor a rigorous optimization is used duringthis procedure, the results are qualitative in nature (hence theterm qualitative validation).
B. Available Data
For the model validation procedure, data from loop detec-tors for four consecutive days (June 3–6, 1996) were available.These data consisted of one-minute measurements of flow andspeed for the whole day. They were used in order to determinethe disturbancies to the traffic system, and to provide the neces-sary boundary data. As boundary data, the traffic flow, the meanspeed, and the traffic density were used in the quantitative val-idation, while only the traffic flow was provided to the model,in the qualitative validation.
C. Quantitative Model Validation
The quantitative validation aims at estimating model param-eters through a well-defined straightforward optimization pro-cedure. The detailed results of this effort are reported in [14].
1) Parameter Estimation Procedure:From the motorwaytraffic flow process model described in Section II, a nonlineardynamic model of the form
(21)
can also be obtained for individual motorway stretches, whereis the state vector, is the boundary-conditions vector, andis the parameter vector. This can be done by substituting (2),
(12), and (13) into (1); (4), (18), (19) into (3); (7), (8), and (9)into (10), for the non destination-oriented mode of operation.
The estimation of the unknown parameters for a motorwaytraffic system is a nontrivial task, since system equations arehighly nonlinear in both the parameters and the state variables.The most common approach for the identification of nonlinear
288 IEEE TRANSACTIONS ON INTELLIGENT TRANSPORTATION SYSTEMS, VOL. 3, NO. 4, DECEMBER 2002
systems is the minimization of the discrepancy between themodel calculations and the real process in the sense of aquadratic output error functional.
Let be the output vector of the nonlinear system (21), with
(22)
Then the parameter estimation problem may be formulated asthe following least-squares output error problem:
Given the time sequences of measured data (measuredboundary conditions), (measured process output),
, and the initial state , find the set of parametersminimizing the cost functional
(23)
subject to (21) with , and (22).The model parameters
(when a unique fundamental diagram is used for allsegments) are selected from a closed admissible region of theparameter space which may be defined on the basis of physicalconsiderations. is a positive definite, diagonal matrix. Whenmeasurements are taken from locations in the motorwaystretch, then .
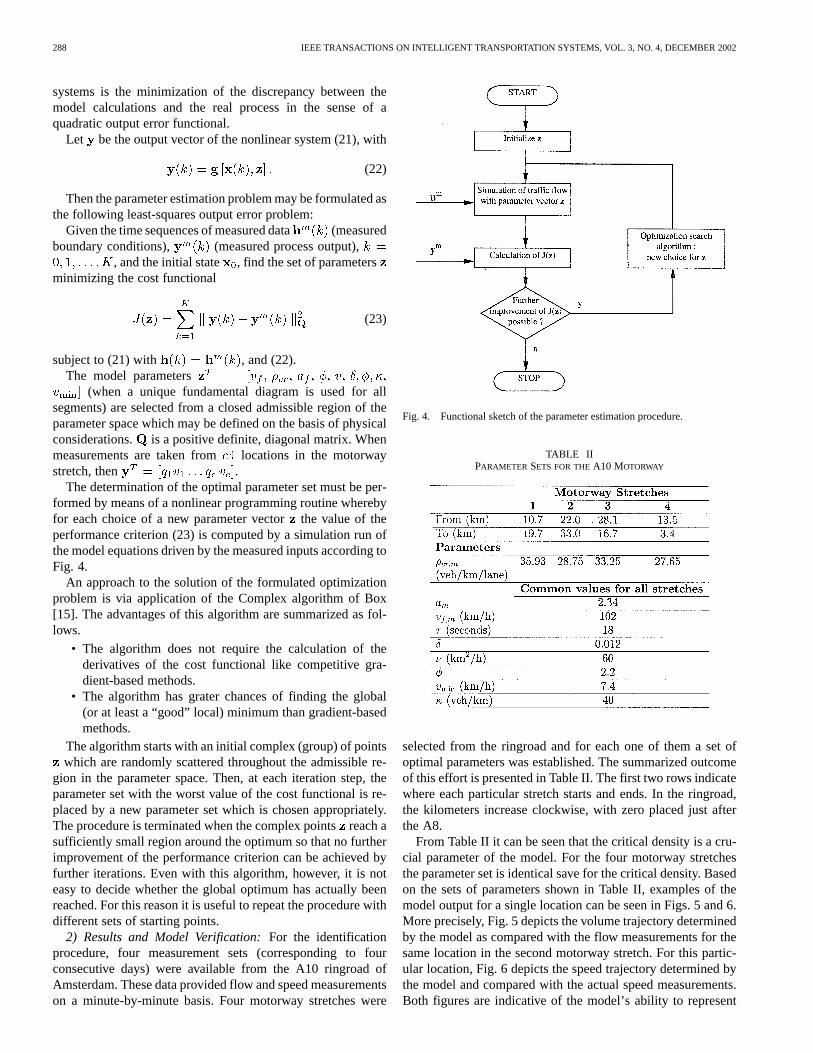
The determination of the optimal parameter set must be per-formed by means of a nonlinear programming routine wherebyfor each choice of a new parameter vectorthe value of theperformance criterion (23) is computed by a simulation run ofthe model equations driven by the measured inputs according toFig. 4.
An approach to the solution of the formulated optimizationproblem is via application of the Complex algorithm of Box[15]. The advantages of this algorithm are summarized as fol-lows.
• The algorithm does not require the calculation of thederivatives of the cost functional like competitive gra-dient-based methods.
• The algorithm has grater chances of finding the global(or at least a “good” local) minimum than gradient-basedmethods.
The algorithm starts with an initial complex (group) of pointswhich are randomly scattered throughout the admissible re-
gion in the parameter space. Then, at each iteration step, theparameter set with the worst value of the cost functional is re-placed by a new parameter set which is chosen appropriately.The procedure is terminated when the complex pointsreach asufficiently small region around the optimum so that no furtherimprovement of the performance criterion can be achieved byfurther iterations. Even with this algorithm, however, it is noteasy to decide whether the global optimum has actually beenreached. For this reason it is useful to repeat the procedure withdifferent sets of starting points.
2) Results and Model Verification:For the identificationprocedure, four measurement sets (corresponding to fourconsecutive days) were available from the A10 ringroad ofAmsterdam. These data provided flow and speed measurementson a minute-by-minute basis. Four motorway stretches were
Fig. 4. Functional sketch of the parameter estimation procedure.
TABLE IIPARAMETER SETS FOR THEA10 MOTORWAY
selected from the ringroad and for each one of them a set ofoptimal parameters was established. The summarized outcomeof this effort is presented in Table II. The first two rows indicatewhere each particular stretch starts and ends. In the ringroad,the kilometers increase clockwise, with zero placed just afterthe A8.
From Table II it can be seen that the critical density is a cru-cial parameter of the model. For the four motorway stretchesthe parameter set is identical save for the critical density. Basedon the sets of parameters shown in Table II, examples of themodel output for a single location can be seen in Figs. 5 and 6.More precisely, Fig. 5 depicts the volume trajectory determinedby the model as compared with the flow measurements for thesame location in the second motorway stretch. For this partic-ular location, Fig. 6 depicts the speed trajectory determined bythe model and compared with the actual speed measurements.Both figures are indicative of the model’s ability to represent

KOTSIALOS et al.: TRAFFIC FLOW MODELING OF LARGE-SCALE MOTORWAY NETWORKS 289
Fig. 5. Stretch 2, measured versus predicted flow, quantitative validation.
Fig. 6. Stretch 2, measured versus predictive speed, quantitative validation.
traffic conditions in each of the motorway stretches based onthe estimated parameters.
D. Qualitative Model Validation
The scope adopted in the qualitative model validation extendsfrom individual network parts (motorway stretches in quantita-tive validation) toward the entire network. The goal of this phaseis, by manually calibrating a number of parameters, to enable themodel of the whole network (Section III-B) to sufficiently repre-sent the network-wide dynamics of traffic congestion. The man-ually calibrated parameters include turning rates at bifurcationjunctions, and capacities and travel times of store-and-forwardlinks. The calibration was performed through repeated simula-tions via trial-and-error until the appropriate parameter valueswere obtained. The parameter values were deemed as appro-priate when the model was able to reproduce with sufficient ac-curacy the time and location of recurrent congestion, its durationand propagation. Particular attention was paid to the main junc-tions of motorways, e.g. A8 with A10, as quantitative validationdid not focus on motorway interactions at major motorway in-tersections. When a real congestion, that occurs at a certain lo-
Fig. 7. L26, measured versus predicted flow, qualitative validation.
cation of a motorway, spills back into another motorway, thenthe model should be able to reproduce this propagation.
In order to make the network-wide traffic flow model tocomply with this requirement, all the cases of recurrent conges-tion observed in the motorway network were recorded and foreach one of them the location and time of its creation, as well asthe its duration and propagation to other motorways was noted.Three main cases of recurrent congestion were identified.Some of them were strongly related due to their geographicproximity, while others were independent from each other.One of the major origins of congestion on the A10 ringroad isthe spillback of congestion created at off-ramps (either due toexistence of traffic lights at the end of the off-ramp or due torestricted outflow capacity).
The most severe congestion of all appears upstream of theCoen Tunnel at the 30th km of the A10 ringroad in the counter-clockwise direction of the A10 (the-direction as opposed to theclockwise -direction). Congestion at the Coen Tunnel begins atthe 30th km and propagates backward on the A10 to the 32ndkm and to the A8 up to 3.3 km. This area is congested from 6:20A.M. until 10:00A.M.
The second main congestion appears at the southern part ofthe A10. It begins at 17.6 km at 8:00A.M., in the -direction, andpropagates backward until 13.6 km of A10 until 10.25A.M. Itmust be noted that in this highway stretch spillback phenomenatake place causing the congestion that appears at 8:00A.M. at thespecific location. A bit later, severe congestion due to limited ca-pacity appears at the 2.4 km of A4 in the direction of flow thatleaves Amsterdam. This congestion propagates backward to theA10, it catches up with the previously mentioned congestion,and combined they create a severe congestion that begins fromthe A4 and propagates up to the A10, reaches the A2 and prop-agates into it until the 31.5 km.
Another congestion that appears in the southern part of A10,but this time in the -direction, begins at the 18th km at 8:00A.M. and propagates backward up until the 24.2 km of A10. Thiscongestion propagates to A4 in direction where the flow entersthe A10, and propagates in the A4 up to the 4th km.
After manually calibrating the model parameters, the modelwas able to predict the network traffic conditions (free, critical,
290 IEEE TRANSACTIONS ON INTELLIGENT TRANSPORTATION SYSTEMS, VOL. 3, NO. 4, DECEMBER 2002
Fig. 8. L26, measured versus predicted speed, qualitative validation.
Fig. 9. L11, measured versus predicted flow, qualitative validation.
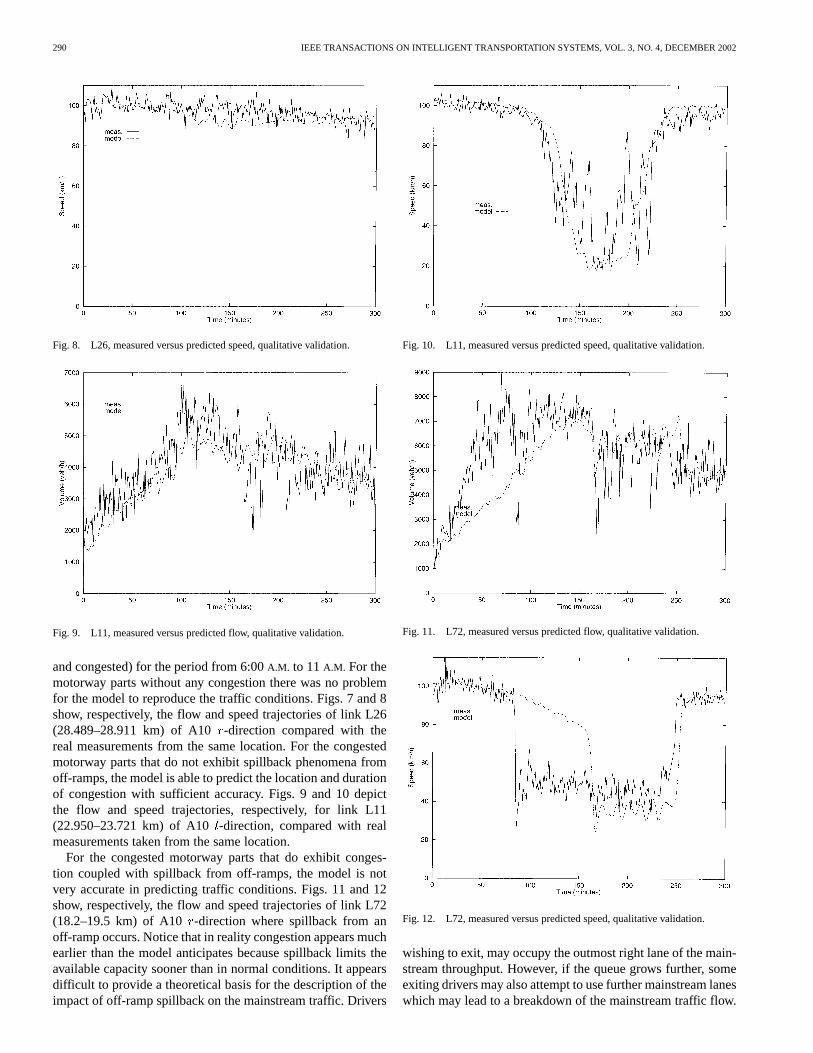
and congested) for the period from 6:00A.M. to 11A.M. For themotorway parts without any congestion there was no problemfor the model to reproduce the traffic conditions. Figs. 7 and 8show, respectively, the flow and speed trajectories of link L26(28.489–28.911 km) of A10 -direction compared with thereal measurements from the same location. For the congestedmotorway parts that do not exhibit spillback phenomena fromoff-ramps, the model is able to predict the location and durationof congestion with sufficient accuracy. Figs. 9 and 10 depictthe flow and speed trajectories, respectively, for link L11(22.950–23.721 km) of A10-direction, compared with realmeasurements taken from the same location.
For the congested motorway parts that do exhibit conges-tion coupled with spillback from off-ramps, the model is notvery accurate in predicting traffic conditions. Figs. 11 and 12show, respectively, the flow and speed trajectories of link L72(18.2–19.5 km) of A10 -direction where spillback from anoff-ramp occurs. Notice that in reality congestion appears muchearlier than the model anticipates because spillback limits theavailable capacity sooner than in normal conditions. It appearsdifficult to provide a theoretical basis for the description of theimpact of off-ramp spillback on the mainstream traffic. Drivers
Fig. 10. L11, measured versus predicted speed, qualitative validation.
Fig. 11. L72, measured versus predicted flow, qualitative validation.
Fig. 12. L72, measured versus predicted speed, qualitative validation.
wishing to exit, may occupy the outmost right lane of the main-stream throughput. However, if the queue grows further, someexiting drivers may also attempt to use further mainstream laneswhich may lead to a breakdown of the mainstream traffic flow.

KOTSIALOS et al.: TRAFFIC FLOW MODELING OF LARGE-SCALE MOTORWAY NETWORKS 291
Fig. 13. Simulated traffic conditions in the network, 7:30A.M.
Fig. 14. Simulated traffic conditions in the network, 9:00A.M.
These phenomena are probably of a strong probabilistic char-acter and there is hardly any possibility to describe them accu-rately in a deterministic framework.
Figs. 7–12 give an idea of the model’s performance only atthe local level. As was mentioned before, the qualitative val-idation aims to enable the network model to capture the net-work-wide dynamics of congestion. Figs. 13 and 14 present thepicture of the traffic conditions for the whole network at certaintime instants. Free, dense, and congested conditions are present,and each segment is filled with the appropriate pattern to indi-cate them. The links’ segment width is proportional to the trafficflow passing through them. Fig. 13 depicts the Amsterdam mo-torway network at 7:30A.M. in the morning. The model predictsthat congestion should appear only upstream the Coen Tunnel
and nowhere else in the network, which is in accordance withthe data observations. Fig. 14 shows the model’s prediction oftraffic conditions at 9:00A.M. From this figure it can been seenthat the model reproduces the previously described recurrentcongestions sufficiently, thus making it a suitable tool for evalu-ating the impact of various traffic control measures on the trafficflow process.
V. CONCLUSIONS ANDFUTURE WORK
This paper presented the modeling of the large-scale mo-torway network around Amsterdam, The Netherlands, and itsvalidation against real measurements. The macroscopic mod-eling tool METANET was used for this purpose. In order to val-idate the model, a two-phase validation process was followed.The first phase, called quantitative validation, employed a rig-orous method in order to determine the model’s parameters fora selected number of motorway stretches from the network.For each motorway stretch, an optimal parameter set was de-termined. Based on the results obtained by the quantitative val-idation, the second phase, called qualitative validation, aimedat enabling the motorway network model to capture the net-work-wide dynamics of congestion. The results obtained fromthis approach demonstrate that METANET is able to reproducetraffic congestion built in reality with considerable accuracy,thus making it suitable for evaluating various control strate-gies and performing further modeling and simulation tasks. Theoff-line evaluation of motorway control measures such as rampmetering, motorway-to-motorway control, and route guidancewill be the subject of further work for this network.
REFERENCES
[1] M. Lighthill and G. Whitman, “On kinematic waves II: a traffic flowtheory on long crowded roads,” inProc. Roy. Soc. London Series A, vol.229, 1955, pp. 317–345.
[2] P. Richards, “Shock waves on the highway,”Oper. Res., vol. 4, pp.42–51, 1956.
[3] H. Payne, “Models of freeway traffic and control,” inSimulation CouncilProc., vol. 1, 1971, pp. 51–61.
[4] M. Cremer and A. May, “An extended traffic flow model for inner urbanfreeways,” inPreprints 5th IFAC/IFIP/IFORS Intern. Conf. on Controlin Transportation Systems, Vienna, Austria, 1986, pp. 383–388.
[5] M. Papageorgiou, J. M. Blossville, and H. Hadj-Salem, “Modeling andreal-time control of traffic flow on the southern part of Boulevard Pé-riphérique in Paris. Part I: Modeling,”Transportation Res. A, vol. 24,pp. 345–359, 1990.
[6] M. Papageorgiou, “Dynamic modeling, assignment, and route guidancein traffic networks,”Transportation Res. B, vol. 24, pp. 471–495, 1990.
[7] A. Messmer and M. Papageorgiou, “METANET: A macroscopic simu-lation program for motorway networks,”Traffic Eng. Contr., vol. 31, pp.466–470, 549, 1990.
[8] C. Diakaki and M. Papageorgiou, Integrated modelling and control ofcorridor traffic networks using the METACOR modelling tool, , Dy-namic Systems and Simulation Lab., Technical Univ. of Crete, InternalRep. 1996–8, Chania, Greece, 1996.
[9] R. Cayford, W. H. Lin, and C. F. Daganzo, The NETCELL simulationpackage: technical description, , Univ. of California, California PATHRes. Rep. UCB-ITS-PRR-97-23, Berkeley, CA, 1997.
[10] C. Buisson, J. P. Lebaque, and J. B. Lesort, “STRADA, a discretizedmacroscopic model of vehicular flow in complex networks based on theGodunov scheme,” inProc. CESA’96 IEEE Conf., France, 1996.
[11] M. Cremer and M. Papageorgiou, “Parameter identification for a trafficflow model,” Automatica, vol. 17, pp. 837–843, 1981.
[12] K. Sanwal, K. Petty, J. Walrand, and Y. Fawaz, “An extended macro-scopic model for traffic flow,”Transportation Res. B, vol. 30, pp. 1–9,1996.

292 IEEE TRANSACTIONS ON INTELLIGENT TRANSPORTATION SYSTEMS, VOL. 3, NO. 4, DECEMBER 2002
[13] A. Kotsialos and M. Papageorgiou, “The importance of traffic flow mod-eling for motorway traffic control,”J. Networks Spatial Econ., vol. 1, pp.179–203, 2001.
[14] A. Kotsialos, M. Papageorgiou, H. Haj-Salem, S. Manfredi, J. vanSchuppen, J. Taylor, and M. Westerman, Coordinated control strategies,Eur. Commission, Deliverable D06.1 of DACCORD project (TR1017),Brussels, Belgium, 1997.
[15] M. J. Box, “A new method of constrained optimization and a comparisonwith other methods,”Computer J., vol. 8, pp. 42–52, 1965.
Apostolos Kotsialoswas born in Larissa, Greece, in 1972. He received theDipl.-Eng. degree in production and management engineering and M.S. degreein operations research from the Technical University of Crete, Greece in 1995and 1998, respectively.
Since 1995 he has been with the Dynamic Systems and Simulation Laboratory(DSSL) of the Technical University of Crete as a Research Associate where hehas been involved in numerous research projects. His main research interestsinclude traffic control of large scale freeway networks, numerical optimizationand its applications. He is currently working toward the Ph.D. degree at DSSLworking on integrated freeway control.
Markos Papageorgiou (M’82–SM’90–F’99) wasborn in Thessaloniki, Greece, in 1953. He re-ceived the Diplom-Ingenieur and Doktor-Ingenieur(honors) degrees in Electrical Engineering from theTechnical University of Munich, Germany, in 1976and 1981, respectively.
From 1976 to 1982, he was a Research andTeaching Assistant at the Control EngineeringChair, Technical University of Munich. He wasa Free Associate with Dorsch Consult, Munich,Germany, (1982–1988), and with Institute National
de Recherche sur les Transports et leur Sécurité (INRETS), Arcueil, France(1986–1988). From 1988 to 1994 he was a Professor of Automation at theTechnical University of Munich. Since 1994 he has been a Professor at theTechnical University of Crete, Chania, Greece. He was a Visiting Professor atthe Politecnico di Milano, Italy, in 1982, at the Ecole Nationale des Ponts etChaussées, Paris, France from 1985 to 1987, and at MIT, Cambridge, MA in1997 and 2000; and a Visiting Scholar at the University of Minnesota in 1991and 1993, University of Southern California in 1993, and the University ofCalifornia, Berkeley, in 1993, 1997, and 2000. He is the author of the booksApplications of Automatic Control Concepts to Traffic Flow Modeling andControl (New York: Springer, 1983) andOptimierung (Oldenbourg, 1991;1996), the editor of theConcise Encyclopedia of Traffic and TransportationSystems(New York: Pergamon, 1991), and the author or co-author of some200 technical papers. His research interests include automatic control andoptimization theory and applications to traffic and transportation systems,water systems, and further areas.
Dr. Papageorgiou is an Associate Editor ofTransportation Research-Part Cand Chairman of the IFAC Technical Committee on Transportation Systems.He is a member of the Technical Chamber of Greece (TEE). He received the1983 Eugen-Hartmann award from the Union of German Engineers (VDI), anda Fulbright Lecturing/Research Award (1997).
Christina Diakaki was born in Chania, Greece, inSeptember 1968. In 1991, she received the Dipl.-Eng.in production and management engineering fromthe Technical University of Crete, Greece, in 1993,the M.Sc. degree in operations management fromthe School of Management, Institute of Scienceand Technology (U.M.I.S.T.), Victoria Universityof Manchester, U.K., in 2000, and the Ph.D. degreein decision systems and operations research fromthe Department of Production Engineering andManagement, Technical University of Crete, Greece.
Since 1994, she has been free associate and a research associate of the Dy-namic Systems and Simulation Laboratory of the Technical University of Crete,Greece. Her research interests include operations research, optimization, andautomatic control theories, and applications to traffic and transportation sys-tems. She has participated in numerous European and National projects. More-over, she acts as reviewer for the scientific journalsTransportation Research C,Zentralblatt für Mathematik, Journal of Systems and Control Engineering, andEuropean Journal of Operational Research, and for various scientific confer-ences. She is the author and co-author of several research reports and papers inscientific and technical journals and scientific conferences, and she has givenmany scientific talks.
Yannis Pavlis received a B.S. and M.S. in produc-tion engineering and management from the TechnicalUniversity of Crete in 1995, and 1998, respectively.He is working toward the Ph.D. degree at the Depart-ment of Civil and Environmental Engineering, Uni-versity of California at Irvine.
His current research interests lie in the applicationof optimal control theory, behavioral discretechoice analysis, and mathematical logic to thedevelopment of Intelligent Transportation Systemsfor freeway/surface street networks.
Mr. Pavlis received a Ph.D. Dissertation Award from the University of Cali-fornia Transportation Center (UCTC).
Frans Middelham studied at the Delft University ofTechnology, from 1968 until 1974, and concentratedon electronic traffic systems.
He was a traffic-engineer for the city of Am-sterdam, The Netherlands, being responsible fortraffic-control programs. In the city of Utrechthis responsibility was to design the traffic-controlschemes for the Light Rail Tram System. Since 1982he is employed at the Transport Research Centre ofthe Ministry of Transport, Public Works and WaterManagement in The Netherlands. Since then he is
involved in the further developments of simulation tools like FLEXSYT andwith pilot studies with dynamic traffic management tools like ramp metering,variable message signs and decision support systems for traffic operators incontrol rooms.