Embed Size (px)
Citation preview
Durham E-Theses
Small angle neutron scattering from superconductors
Allen, Peter James
How to cite:
Allen, Peter James (1991) Small angle neutron scattering from superconductors, Durham theses, DurhamUniversity. Available at Durham E-Theses Online: http://etheses.dur.ac.uk/5994/
Use policy
The full-text may be used and/or reproduced, and given to third parties in any format or medium, without prior permission orcharge, for personal research or study, educational, or not-for-pro�t purposes provided that:
• a full bibliographic reference is made to the original source
• a link is made to the metadata record in Durham E-Theses
• the full-text is not changed in any way
The full-text must not be sold in any format or medium without the formal permission of the copyright holders.
Please consult the full Durham E-Theses policy for further details.
Academic Support O�ce, Durham University, University O�ce, Old Elvet, Durham DH1 3HPe-mail: [email protected] Tel: +44 0191 334 6107
http://etheses.dur.ac.uk
The copyright of this thesis rests with the author.
No quotation from it should be pubhshed without
his prior written consent and information derived
from it should be acknowledged.
Small Angle Neutron Scattering f rom Superconductors
by
Peter James
A Thesis submitted in partial fulfilment of the requirements for the degree of
Doctor of Philosophy
Department of Physics
The University of Durham 1991
/-4
1982

Dedicated to my parents
Abstract
Small angle neutron scattering is a well known technique for studying the
properties of solids at small but finite energies and momenta. In this work it has
been applied to the study of the low energy properties of superconductors. The low
transition temperature superconductors niobium and lead and the high transition
temperature superconductor YiBa2Cu307 have been investigated. The results
indicate a temperature dependent excess scattering of around 150 mbam/sr/atom
from YiBa2Cu307 at wavevectors q of around 0.03 and an energy of less than
30 fieV. No such effect was observable, even at much lower wavevectors (q around
0.004 A~^) in the low transition temperature superconductor niobium. However,
a drop in transmission of a niobium sample at Tc indicates an increase in cross
section of 71 ± 15 mbarn/atom. No simple explanation for these effects has been
found.
u
Acknowiedgemeets
This work was funded by a grant f rom the Science and Engineering Research
Council.
I am grateful to Professors A.W.Wolfendale and A.D.Mar t in for allowing me
use of the facilities of the Physics Department of Durham University.
M y thanks to Dr D.Corner and Professor B.K.Tanner for their leadership of
the Solid State group and their general enthusiasm for condensed matter physics,
at least some of which I hope has rubbed off on me.
Also to my supervisor, the irrepressible Dr N.R.Bernhoeft, for his helpful en
couragement of this project and for his invaluable help.
M y thanks go to the various other members of the Solid State Group who have
put up w i t h me and helped greatly both by their help and their advice. Specific
mention must go to M.Delap, S.Thompson, S.Cockerton, and P.Warren.
Also to M r P.Foley and M r J.Scott for their provision of technical support. The
secretarial staff of the department also deserve praise for their efficient handling of
so many administrative tasks.
I n the Physics Department workshops, M r D.JobUng, M r P.Armstrong, M r
G.Teasdale and M r M.Greener in the student workshop have been more than
wil l ing to help w i t h design and construction of various components. Needless
to say their work has been, as ever, of the highest standard. I am also grateful
to M r T.W.Hogg of the main workshop for expediting a job at short notice. M r
T.Jackson, M r C.Mullaney, M r D.Stockdale, Mr T.Adamson and Mr C.Moore in
the Electronics workshop have been wellsprings of useful advice and components.
i i i
I n the drawing office, Mrs P.Russell has been a great help in giving advice
concerning.graphics and in producing, drawings for posters.
The time and effort spent by those in other universities, interested in these
experiments, i n discussions and in help finding useful data in the literature are
gratefully acknowledged; in particular, Dr D.McK.Paul and Dr D.J.Godfrey.
I am very grateful to Dr A.Boothroyd and M r T.Brown for the use of their
crystals of niobium and lead respectively.
None of these experiments would have been possible without the help of the
staff of the Ins t i t i i t Laue-Langevin at Grenoble; Dr S.Hayden, Dr F.Rieutord, Dr
L.Needham, M r R.Baker, M r S.Jenkins, and Mr D.Puschner were all involved at
various stages and i t is a pleasure to record here their wilUng cooperation and
expertise. Thanks are also due to the University Liaison secretariat of R A L for
their wilUng help.
IV
Declaration
I declare that the work contained in this thesis has not been submitted for a
degree at this University or any other. A l l the work presented herein was conducted
by the author unless stated otherwise.
Copyright © 1991 by Peter James Allen
The copyright of this thesis rests w i t h the author. No quotation from i t should be
published without the author's prior wri t ten consent. Information derived from
this thesis should be acknowledged.
Publications
"Anomalous Neutron Scattering near the Superconducting Phase Transition"
N.R.Bernhoeft, P.J.AUen, D.McK.Paul , S.M.Hayden, P.A.Timmins and
G.G.Lonzarich, Nature 350 pp690-692
VI
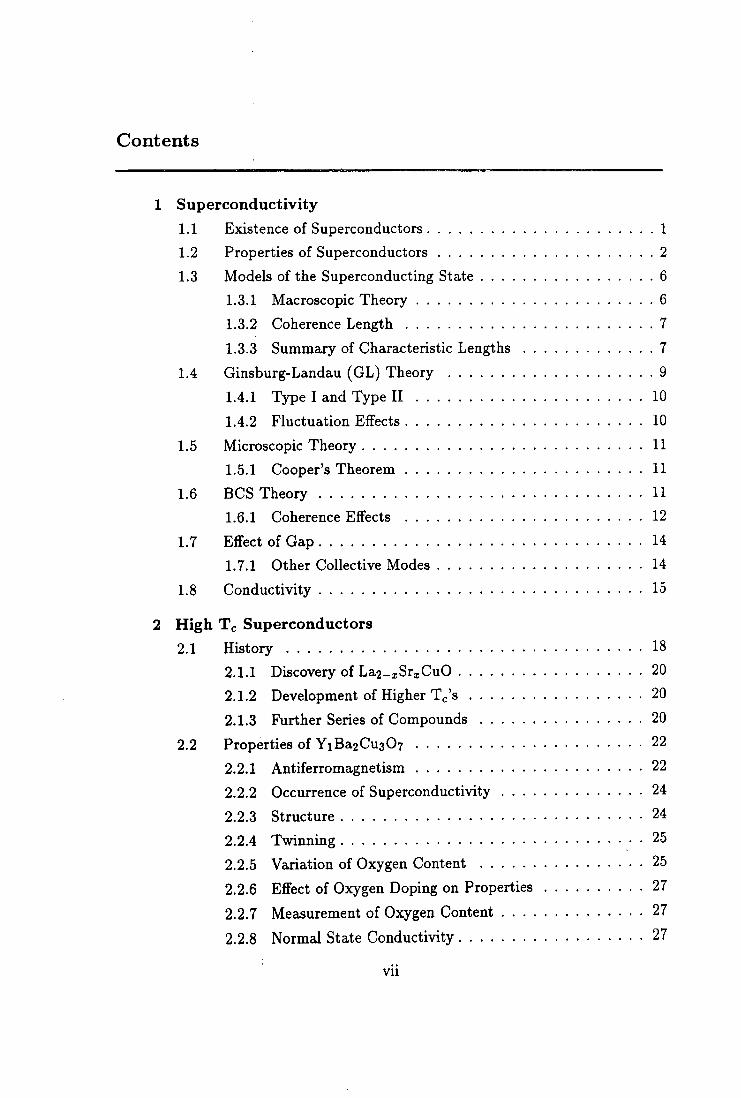
Contents
Superconduct iv i ty
1.1 Existence of Superconductors 1 1.2 Properties of Superconductors 2 1.3 Models of the Superconducting State 6
1.3.1 Macroscopic Theory 6 1.3.2 Coherence Length 7 1.3.3 Summary of Characteristic Lengths 7
1.4 Ginsburg-Landau (GL) Theory 9
1.4.1 Type I and Type I I 10
1.4.2 Fluctuation Effects 10
1.5 Microscopic Theory 11 1.5.1 Cooper's Theorem 11
1.6 BCS Theory 11 1.6.1 Coherence Effects 12
1.7 Effect of Gap 14 1.7.1 Other Collective Modes 14
1.8 Conductivity 15
H i g h Tc Superconductors
2.1 History 18 2.1.1 Discovery of La2_^SrxCuO 20 2.1.2 Development of Higher Tc's 20 2.1.3 Further Series of Compounds 20
2.2 Properties of YiBa2Cu307 22 2.2.1 Antiferromagnetism 22 2.2.2 Occurrence of Superconductivity 24 2.2.3 Structure 24 2.2.4 Twinning . 25 2.2.5 Variation of Oxygen Content 25 2.2.6 Effect of Oxygen Doping on Properties 27
2.2.7 Measurement of Oxygen Content 27
2.2.8 Normal State Conductivity 27
vii
2.3 Superconducting Properties 29
2.3.1 Nuclear Magnetic-Resonance 31
2.3.2 Muon Spin Resonance (/iSR) 32
2.3.3 IR Reflectivity 33
2.4 Sample Preparation 33
2.4.1 Powder Technique 33
2.4.2 Technique Used 34
2.4.3 Disadvantages 35
2.4.4 Sample Characterisation and Results 35
Neutron Scatter ing from Superconductors
3.1 Previous Work 39
3.1.1 Competing Ferromagnetic Order 40
3.1.2 Other Magnetic Effects and Superconductivity 40
3.1.3 Flux Line Lattice Studies 41
3.1.4 Reflectometry 41
3.1.5 Phonons 42
3.2 Directly Probing the Superconducting State wi th Neutrons . . 43
3.2.1 Analogy 43
3.2.2 Suitable Regions of (q,a;) Space 43
3.3 Theoretical Calculations of the Neutron Cross-Section 44
3.3.1 Sum Rules 46
S A N S Studies of YiBa2Cu307_fi - Background
4.1 The Small Angle Neutron Scattering Technique 48
4.1.1 General Introduction 48
4.2 Discussion of other published work on YiBa2Cu307_^ 49
4.2.1 Search for Supression of Paramagnetic Scattering . . . . 49
4.2.2 Search for Supression of Spin Susceptibility 51
4.2.3 Polarized Neutron Experiment 51
4.2.4 Search for Possible Large Scale Structure . 53
4.2.5 Conclusion f rom Previous Experiments 53
4.3 Experimental Design 54
4.3.1 Introduction 54
4.3.2 Background Scattering 54
v i i i
4.3.2.1 Bragg Scattering 54
4.3.2.2 Phonons 55
4.3.2.3 Mult iple Bragg Scattering 57
4.3.2.4 Structural Changes 57
4.3.2.5 Other Sources of Scatter 57
4.3.3 Summary 58
4.4 Calibrations 58
4.5 Temperature Control 60
4.6 Sample and Holder Design 60
5 S A N S Studies off YiBa2Ci i i307_5 - E x p e r i m e n t s
5.1 Experiment 1 - D l l 64
5.1.1 Motivat ion 64
5.1.2 Description of D l l 64
5.1.3 Cryostat 67
5.1.4 Experimental Details 68
5.2 Results - D l l 68
5.2.1 Comment 68
5.3 Experiment 2 - IN3 74
5.3.1 Motivat ion 74
5.3.2 Description of IN3 74
5.3.3 Cryostat 74
5.3.4 Principle of Operation of a Triple Axis Spectrometer . . 74
5.3.5 Comparison w i t h D l l 76
5.3.6 Experimental Details 77
5.4 R e s u l t s - I N 3 79
5.5 Experiment 3 - IN5 80
5.5.1 Description of IN5 80
5.5.2 Cryostat 84
5.5.3 Experimental Details 84
5.5.4 Data Reduction • • 84
5.6 Resul ts - IN5 85
5.6.1 Total Inelastic Scattering 90
5.6.2 Comment 90
5.7 Summary of Experimental Results 96
ix
6 S A N S Studies off N i o b i u m a n d Lead 97
6.1 Introduction 97
6.2 Details of Samples 98
6.3 Experiment 1 - Total Scattering Measurement 98
6.4 Results 103
6.4.1 Comment 103
6.5 Experiment 2 - Direct Scattering Measurement 107
6.5.1 Experimental Details 107
6.5.2 Calibration 107
6.6 Results 108
6.6.1 Background 108
6.7 Comment on Both Results 108
6.7.1 Phonon Scattering Interpretation 113
7 Comclusioms a n d Suggest ions f o r Purt l ie i i ' W o r k 116
7.1 Results 116
7.1.1 High Tc Superconductors 116
7.1.2 Interpretation 116
7.1.3 Conventional Superconductors 117
7.2 Suggestions for Further Work 118
7.3 Final Remarks 119
i o g r a p h y 120
A Neuitrom Cross-Sec t ion D e r i v a t i o m 130
B I N S E x p e r i m e m t a l D a t a 135
Chapter I
SupercondTiictlvity
l o l Existence of Siuipercoiaductors
In 1911 a Dutch Physicist, Onnes, observed an abrupt disappearance of the
electrical resistance of a sample of mercury when he cooled i t using Uquid heUum.
This effect occured at a temperature of 4.15 K , its transition temperature (Tc).
This phenomenon he named superconductivity (Onnes). The explanation of su
perconductivity was eagerly sought by theoreticians, as well as experimentalists
who were prompted to investigate the physical properties of superconductors in
great detail. Historical studies of this science can be found in many articles (e.g.
Pippard).
To the present day, physicists have engaged in a hunt for further similar materi
als. In addition to investigating their properties, they have also sought the correct
ways to parameterize these effects in order to understand this interesting new state.
Since 1911 some several thousand superconducting materials, (including alloys),
w i t h more and more interesting properties have been discovered. Indeed, "super
conductors now come in more flavors than Baskin-Robbins ice cream" (Cooper).
Superconductors are now routinely used in technological appUcations, especially
for the production of intense magnetic fields (Kunzler). Good sources of data
on materials are Savitskii et al, Matthias et al (and references therein), and the
appendices of Phillips (Savitskii, Matthias, Phillips).
This field of study is now so large as to preclude review except of individual
areas of activity. Many books and articles have also been writ ten about supercon
ductivity, at various levels, e.g. the excellent text of Tinkham, and the relevant
section in the introductory Solid State Physics text of Ki t t e l .
1
l o 2 Properties of Superconductors
A l l superconductors share a number of properties. These common features are
1. A l l superconductors yet discovered are found to be metallic in character.
2. Ferromagnetism and superconductivity are seen to be mutually exclusive, at a
first glance. Of the transition elements, few do not exhibit either superconduc
t i v i t y or magnetic order at the lowest temperatures yet reached. The notable
exceptions are the noble metals, which show no such phase transitions at the
lowest temperatures yet reached.
3. Superconductors undergo a transition f rom the normal metallic state to a state
of zero electrical resistance, the superconducting state, at a temperature Tc-
This is a constant of the material, for pure specimens. The transition temper
atures of so far discovered vary over several orders of magnitude. See table 1.1
for some examples.
4. The critical temperatures are very low compared to the typical energy of elec
tronic processes in solids e.g. the Fermi energy.
5. The critical temperature measured in a sample is usually extremely sensitive
to the levels of paramagnetic impurities. I t is fortuitous that Onnes was using
mercury because i t is easy to purify.
6. Superconductors possess interesting magnetic properties below Tc. Principally,
at low fields, they are perfect diamagnets, both excluding applied field and
expelling field f rom the bulk of the material when cooled through Tc. Thus
in the bulk of a superconductor, we have both E = 0 and B = 0. This latter
effect is one of the few not discovered by Onnes in his pioneering experiments,
being discovered later by Ochsenfeld and Meissner, and is generally known as
the Meissner effect (Meissner). Note that the field is not discontinuous at the
surface, but falls away exponentially wi th a characteristic length, known as the
London penetration depth. This penetration depth is temperature dependent.
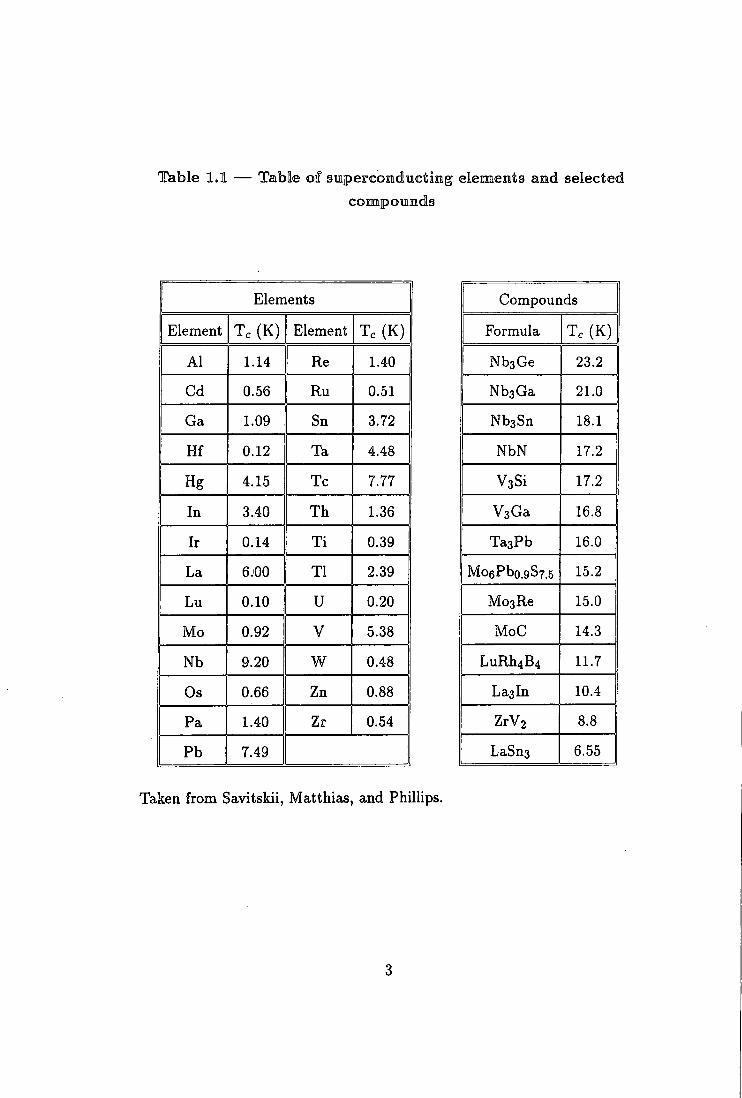
Tab le 1.1 — Tab le o f s u p e r c o n d u c t i n g elements a n d selected
c o m p o u n d s
Elements
Element Tc ( K ) Element T c ( K )
A l 1.14 Re 1.40
Cd 0.56 Ru 0.51
Ga 1.09 Sn 3.72
Hf 0.12 Ta 4.48
Hg 4.15 Tc 7.77
I n 3.40 T h 1.36
I r 0.14 T i 0.39
La 6.00 T l 2.39
Lu 0.10 U 0.20
Mo 0.92 V 5.38
Nb 9.20 w 0.48
Os 0.66 Zn 0.88
Pa 1.40 Zr 0.54
Pb 7.49
Compounds
Formula Tc (K)
Nb3Ge 23.2
NbsGa 21.0
NbsSn 18.1
NbN 17.2
VaSi 17.2
VsGa 16.8
TasPb 16.0
Mo6Pbo.9S7.5 15.2
Mo3Re 15.0
MoC 14.3
LuRh4B4 11.7
Lasin 10.4
ZrV2 8.8
LaSn3 6.55
Taken f rom Savitskii, Matthias, and PhilUps.
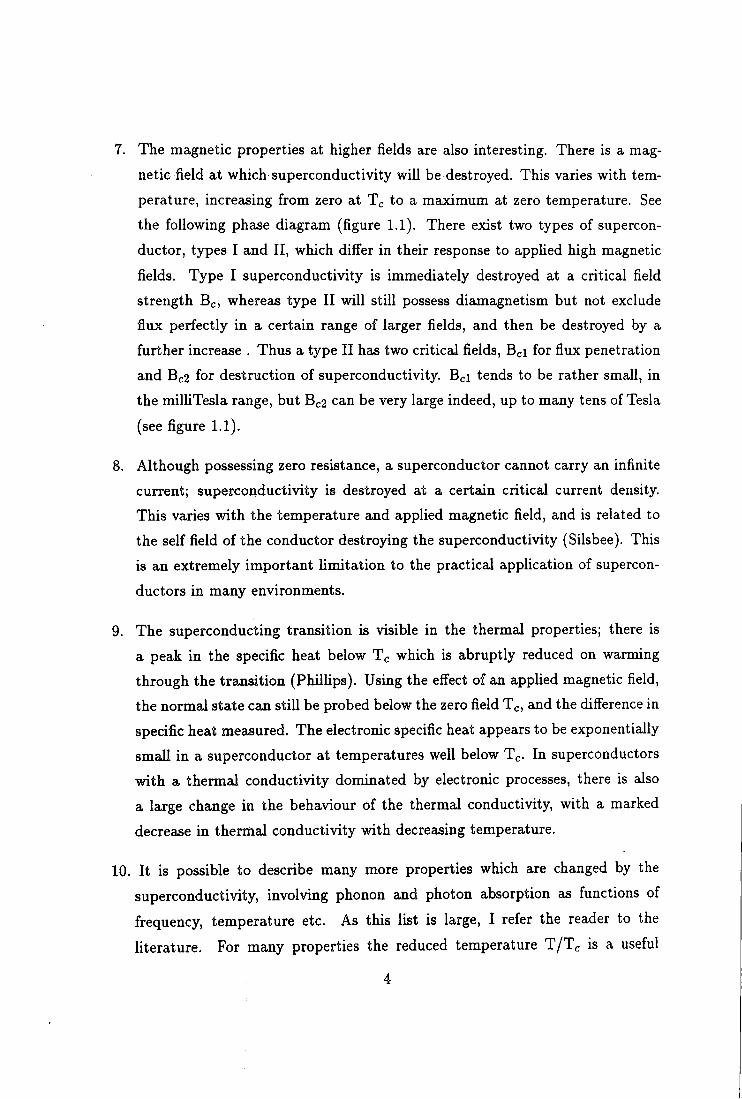
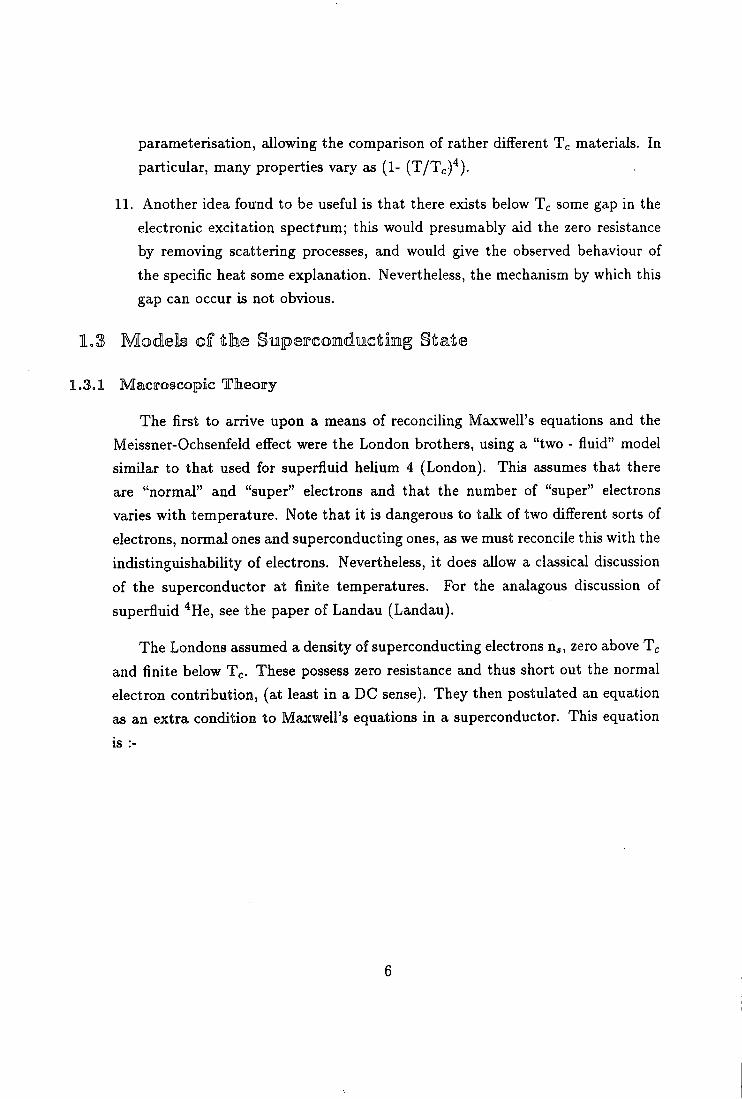
7. The magnetic properties at higher fields are also interesting. There is a mag
netic field at which superconductivity w i l l be destroyed. This varies wi th tem
perature, increasing f rom zero at T^ to a maximum at zero temperature. See
the following phase diagram (figure 1.1). There exist two types of supercon
ductor, types I and I I , which differ in their response to appHed high magnetic
fields. Type I superconductivity is immediately destroyed at a critical field
strength Be, whereas type I I w i l l s t i l l possess diamagnetism but not exclude
flux perfectly i n a certain range of larger fields, and then be destroyed by a
further increase . Thus a type I I has two critical fields, B d for flux penetration
and Bc2 for destruction of superconductivity. B d tends to be rather small, in
the milliTesla range, but Bc2 can be very large indeed, up to many tens of Tesla
(see figure 1.1).
8. Although possessing zero resistance, a superconductor cannot carry an infinite
current; superconductivity is destroyed at a certain critical current density.
This varies w i t h the temperature and applied magnetic field, and is related to
the self field of the conductor destroying the superconductivity (Silsbee). This
is an extremely important l imi ta t ion to the practical application of supercon
ductors in many environments.
9. The superconducting transition is visible in the thermal properties; there is
a peak in the specific heat below Tc which is abruptly reduced on warming
through the transition (Phillips). Using the effect of an applied magnetic field,
the normal state can st i l l be probed below the zero field Tc, and the difference in
specific heat measured. The electronic specific heat appears to be exponentially
small in a superconductor at temperatures well below Tc- In superconductors
w i t h a thermal conductivity dominated by electronic processes, there is also
a large change in the behaviour of the thermal conductivity, wi th a marked
decrease in thermal conductivity wi th decreasing temperature.
10. I t is possible to describe many more properties which are changed by the
superconductivity, involving phonon and photon absorption as functions of
frequency, temperature etc. As this list is large, I refer the reader to the
literature. For many properties the reduced temperature T / T c is a useful
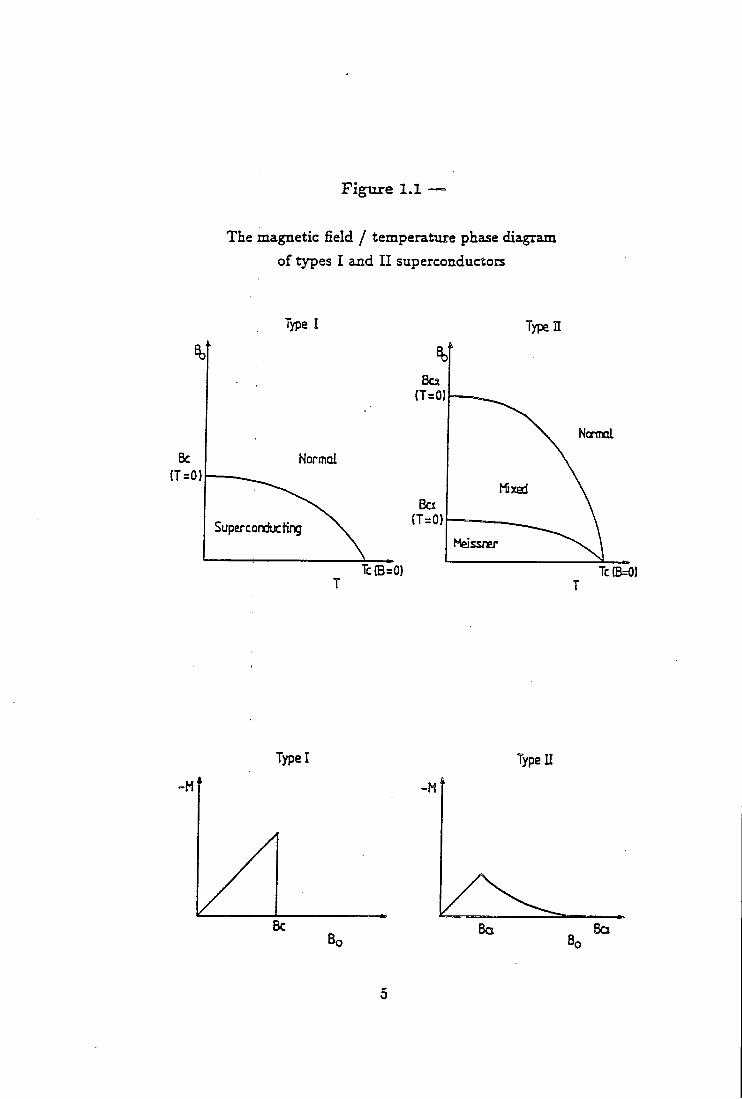
F i g u r e 1.1 —
The magnetic field / temperature phase diagram
of types I and I I superconductors
Type I TypeH
Norrol
Normal
Superconducting
Tc(B=0) Tc(B=0)
-Ml
Type I
Be
Typell
-M
parameterisation, allowing the comparison of rather different Tc materials. In
particular, many properties vary as (1- (T/Tc)^) .
11. Another idea found to be useful is that there exists below Tc some gap in the
electronic excitation spectrum; this would presumably aid the zero resistance
by removing scattering processes, and would give the observed behaviour of
the specific heat some explanation. Nevertheless, the mechanism by which this
gap can occur is not obvious.
1.3 Models of the Supercoediuictmg State
I .So l Macroscopic Tlieojry
The first to arrive upon a means of reconciling Maxwell's equations and the
Meissner-Ochsenfeld effect were the London brothers, using a "two - fluid" model
similar to that used for superfluid heUum 4 (London). This assumes that there
are "normal" and "super" electrons and that the number of "super" electrons
varies with temperature. Note that it is dangerous to talk of two different sorts of
electrons, normal ones and superconducting ones, as we must reconcile this with the
indistinguishability of electrons. Nevertheless, it does allow a classical discussion
of the superconductor at finite temperatures. For the analagous discussion of
superfluid ^He, see the paper of Landau (Landau).
The Londons assumed a density of superconducting electrons n , zero above Tc
and finite below Tc. These possess zero resistance and thus short out the normal
electron contribution, (at least in a D C sense). They then postulated an equation
as an extra condition to Maxwell's equations in a superconductor. This equation
is :-
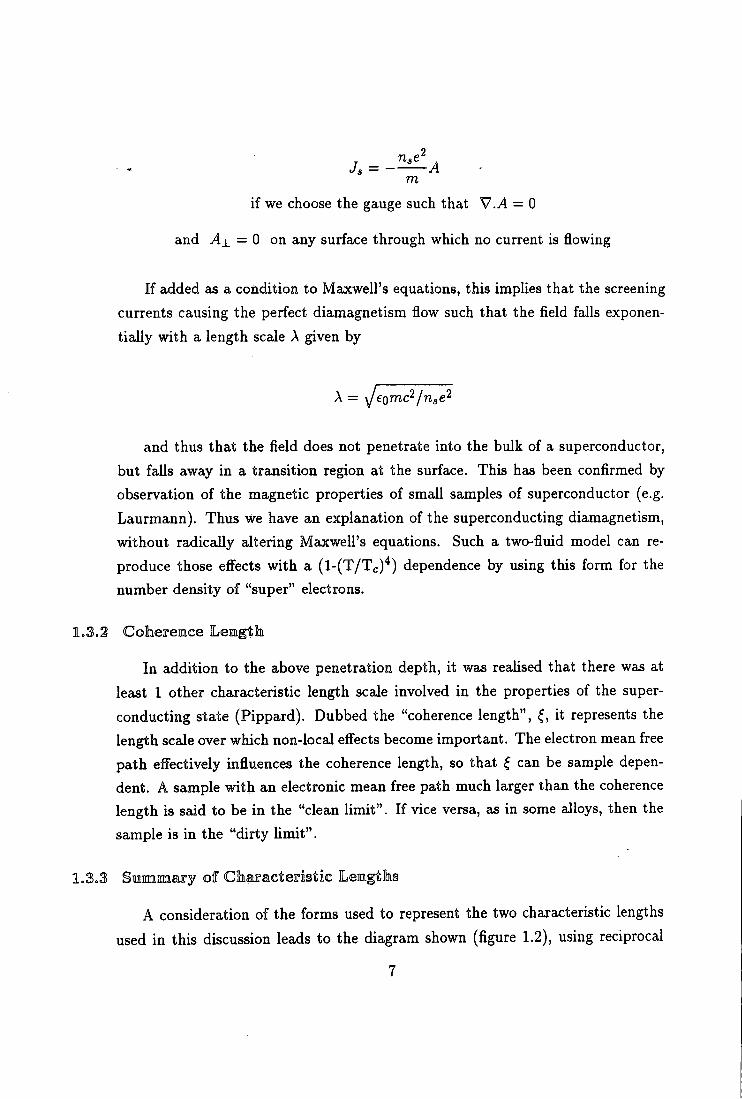
m
if we choose the gauge such that V . A = 0
and Ai_ = 0 on any surface through which no current is flowing
If added as a condition to Maxwell's equations, this implies that the screening
currents causing the perfect diamagnetism flow such that the field falls exponen
tially with a length scale A given by
and thus that the field does not penetrate into the bulk of a superconductor,
but falls away in a transition region at the surface. This has been confirmed by
observation of the magnetic properties of small samples of superconductor (e.g.
Launnann). Thus we have an explanation of the superconducting diamagnetism,
without radically altering Maxwell's equations. Such a two-fluid model can re
produce those effects with a (1-(T/Tc)'*) dependence by using this form for the
number density of "super" electrons.
1.3.2 Cohereiffice L e e g t h
In addition to the above penetration depth, it Weis realised that there was at
least 1 other characteristic length scale involved in the properties of the super
conducting state (Pippard). Dubbed the "coherence length", ^, it represents the
length scale over which non-local effects become important. The electron mean free
path effectively influences the coherence length, so that ^ can be sample depen
dent. A sample with an electronic mean free path much larger than the coherence
length is said to be in the "clean limit". If vice versa, as in some alloys, then the
sample is in the "dirty Umit".
1.3.3 Smmmsury of diaffacterisihic Lengths
A consideration of the forms used to represent the two characteristic lengths
used in this discussion leads to the diagram shown (figure 1.2), using reciprocal
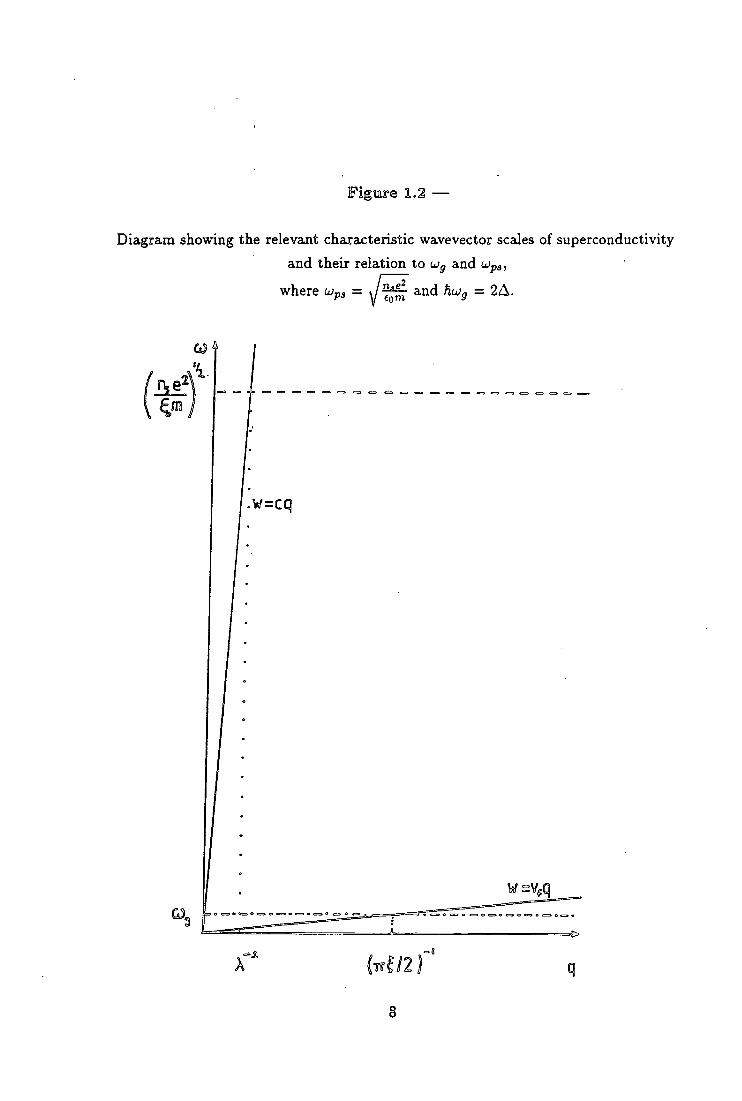
F i g u r e 1.2 —
Diagram showing the relevant characteristic wavevector scales of superconductivity
and their relation to ujg and Upa, I 7
where ^ and hujg = 2A.
.w=cq
8
space as the best means of illustration. Here it is the "plasma frequency", (if
written ^ 7 ^ ) , associated with the superconducting electrons that determines the
screening length A. This implies that low electron density materials will always
have rather large A's due to their low plasma frequency. This diagram also makes
it clear that a material with a large gap in the electronic density of states, will
inevitably posess a short coherence length, given that a Fermi velocity is rather
similar from one soUd to another. A large gap will be necessary for any system to
have a high Tc - thus a high Tc superconductor will always have a low coherence
length.
These characteristic wavevector q's are rather small, as a fraction of the avail
able range of q. This is a consequence of the generally long range character of
superconductivity.
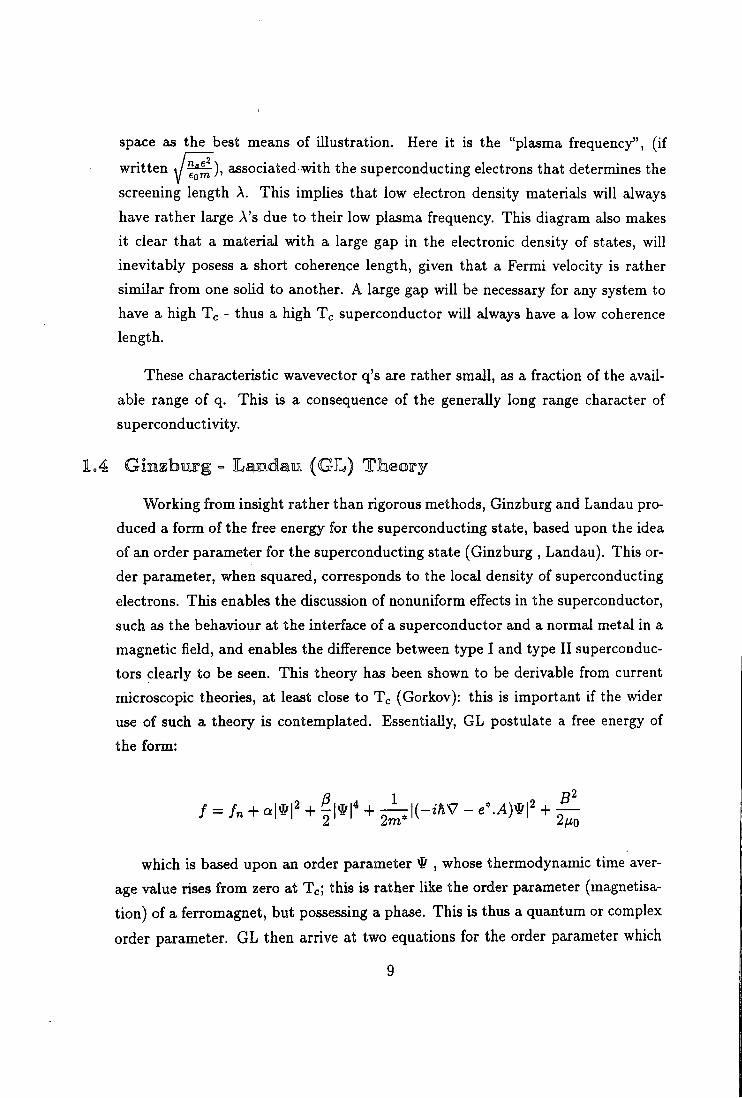
lA Ginzbiirg = Landam (GL) Theory-Working from insight rather than rigorous methods, Ginzburg and Landau pro
duced a form of the free energy for the superconducting state, based upon the idea
of an order parameter for the superconducting state (Ginzburg , Landau). This or
der parameter, when squared, corresponds to the local density of superconducting
electrons. This enables the discussion of nonuniform effects in the superconductor,
such as the behaviour at the interfzice of a superconductor and a normal metal in a
magnetic field, and enables the difference between type I and type II superconduc
tors clearly to be seen. This theory has been shown to be derivable from current
microscopic theories, at least close to Tc (Gorkov): this is important if the wider
use of such a theory is contemplated. Essentially, G L postulate a free energy of
the form:
f = fn + a\^\' + ^\^\' + ^ | ( - ^ W - e\A)^\' + ^
which is based upon an order parameter ^ , whose thermodynamic time aver
age value rises from zero at T d this is rather like the order parameter (magnetisa
tion) of a ferromagnet, but possessing a phase. This is thus a quantum or complex
order parameter. G L then arrive at two equations for the order parameter which
govern its evolution in time and space. In this picture, the coherence length is
the length scale required to vary the superconducting order parameter without an
"undue" energy cost.
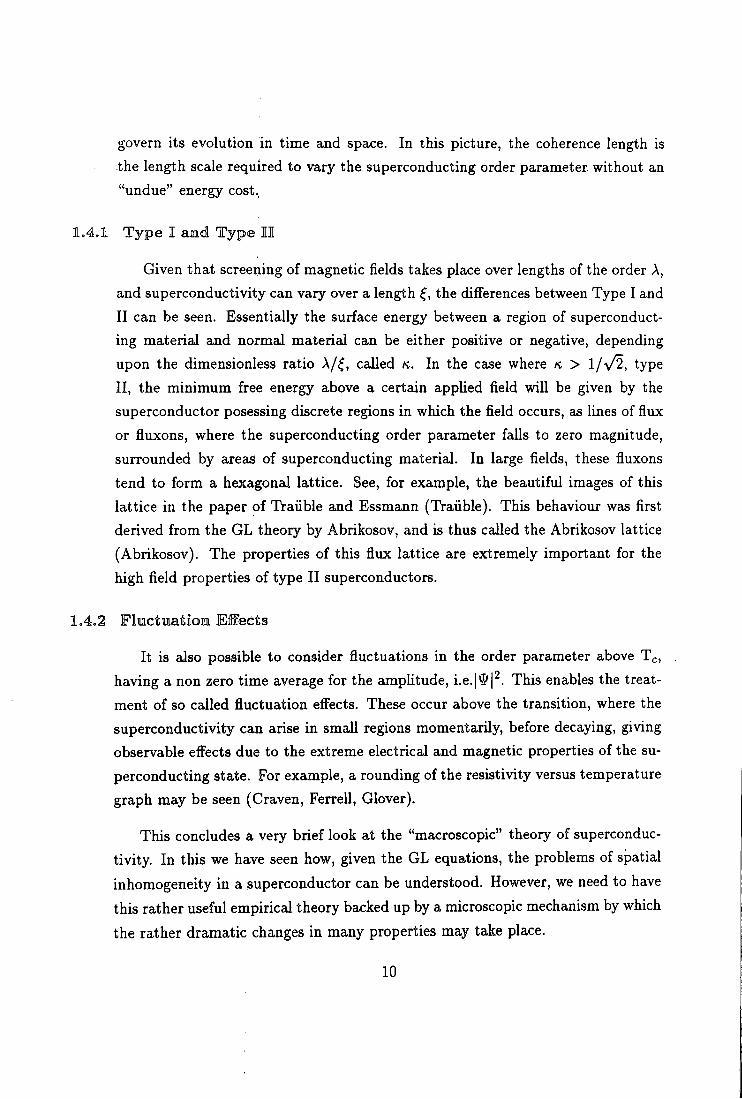
1.4.1 T y p e I and T y p e 11
Given that screening of magnetic fields takes place over lengths of the order A,
and superconductivity can vary over a length | , the differences between Type I and
II can be seen. Essentially the surface energy between a region of superconduct
ing material and normal material can be either positive or negative, depending
upon the dimensionless ratio A/^, called k. In the case where « > 1/V2, type
I I , the minimum free energy above a certain applied field will be given by the
superconductor posessing discrete regions in which the field occurs, as lines of flux
or fluxons, where the superconducting order parameter falls to zero magnitude,
surrounded by areas of superconducting material. In large fields, these fluxons
tend to form a hexagonal lattice. See, for example, the beautiful images of this
lattice in the paper of Traiible and Essmann (Traiible). This behaviour was first
derived from the G L theory by Abrikosov, and is thus called the Abrikosov lattice
(Abrikosov). The properties of this flux lattice are extremely important for the
high field properties of type I I superconductors.
1.4.2 F l e c t u a t i o n EifFects
It is also possible to consider fluctuations in the order parameter above Tc,
having a non zero time average for the amplitude, i.e.j^p. This enables the treat
ment of so called fluctuation effects. These occur above the transition, where the
superconductivity can arise in small regions momentarily, before decaying, giving
observable effects due to the extreme electrical and magnetic properties of the su
perconducting state. For example, a rounding of the resistivity versus temperature
graph may be seen (Craven, Ferrell, Glover).
This concludes a very brief look at the "macroscopic" theory of superconduc
tivity. In this we have seen how, given the G L equations, the problems of spatial
inhomogeneity in a superconductor can be understood. However, we need to have
this rather useful empirical theory backed up by a microscopic mechanism by which
the rather dramatic changes in many properties may take place.
10
105 Microscopic Theory
1.5,1 Cooper's T h e o r e m
In 1956 L.Cooper showed that in an electron gas in a "jellium"solid, (where
the positive ions are ignored except in order to produce overall charge balance),
an arbitrarily small attractive force between the electrons would cause a distinct
lower energy ground state (Cooper). This state consists of electrons paired to form
"Cooper pairs" of no net spin and zero total momentum. Thus the concept arises
of a pairing interaction, giving rise to these pairs, which might be expected to
possess some of the properties of bosons.
Now the pairing on its own would be insuflacient if these pairs could be bro
ken up easily; indeed the normal metal could easily be described as such pairs.
However, the combination of the attractive potential, giving this paired state a
distinct lower energy than the lowest "two - electron" state, and the PauU princi
ple, denying access to all the filled states of the system for any scattered or broken
up pair, means that this pairing will give the state the radically different electrical,
magnetic and thermal properties that we know to be a feature of superconductivity.
The crucial features of this approach are the necessity of considering the entire
electron gas as being important through the Pauli principle, and the importance
of the interactions between electrons at or near the Fermi surface. This idea was
developed further by Bardeen Cooper and Schrieffer (BCS) to form the basis of
the first plausible explanation of superconductivity.
106 BCS Theory
A mechanism to provide the necessary attractive interaction was proposed by
B C S in 1957. This was then rapidly developed, particularly in its notation (BogoU-
ubov, Anderson), which helped to clarify many of the ideas involved. Subsequently
it has withstood a great deal of experimental investigation. Essentially, the theory
states that electrons within a small energy of the Fermi level, which are the only
important electrons at low temperatures, are attracted by each other due to their
mutual interaction with the crystal lattice. This is at first sight surprising; the
Coulomb repulsion forces for electrons are quite severe. The reason for this has in
11
the fact that this Coulomb force is screened by the other electrons and the lattice:
this can in certain circumstances lead to an overscreening, due to the fact that
the ion cores remain polarised in the wake of a conduction electron due to their
large mass. The problem solved by B C S was essentially for a particular "reduced"
Hamiltonian including these electron - phonon interactions as being the essential
physics behind superconductivity.
Thus there can be a net attractive force between two electrons, via the ex
change of energy and momentum by a phonon. This interaction is now accepted
as being a plausible explanation for most of the elemental superconductors, mainly
because using it, B C S were able to correctly predict various properties, such as the
variation of Tc with isotopic mass, known as the isotope effect (see, for example the
tabulation in Rickayzen). However, other interactions could give similar pairing
effects, and many of the B C S predictions are now thought to be independent of
the detailed pairing mechanism.
1.6.1 Coherence Effects'
More importantly, the B C S theory correctly predicts the fact that various
properties behave in similar ways. These are due to what are known as "coherence
effects" . These arise because the electron states are no longer independent, being
paired. In essence, any sum over electron states must consider whether the terms
for a pair of electrons of opposite momentum k and spin a will add (case 2), or
cancel (case 1), in the final expression. Properties for which the relevant interaction
processes have a certain symmetry with respect to the paired electrons have one
coherence factor, and vice versa. This can be made particularly clear by considering
the ratios of various quantities in the superconducting and (magnetic field induced)
normal states, for two typical processes with cases 1 and 2 coherence factors.
Only case 1 coherence factors show the near two-fluid type response, the other
showing a pronounced peak below Tc, e.g.the "Hebel-Slichter" peak in the NMR
linewidth (Hebel). This case 2 coherence factor would diverge at w = 0 in the
B C S theory, which is obviously unphysical. These effects, once observed, give very
strong support to the picture of pairing between electrons as the mechanism of
superconductivity (see figure 1.3).
12
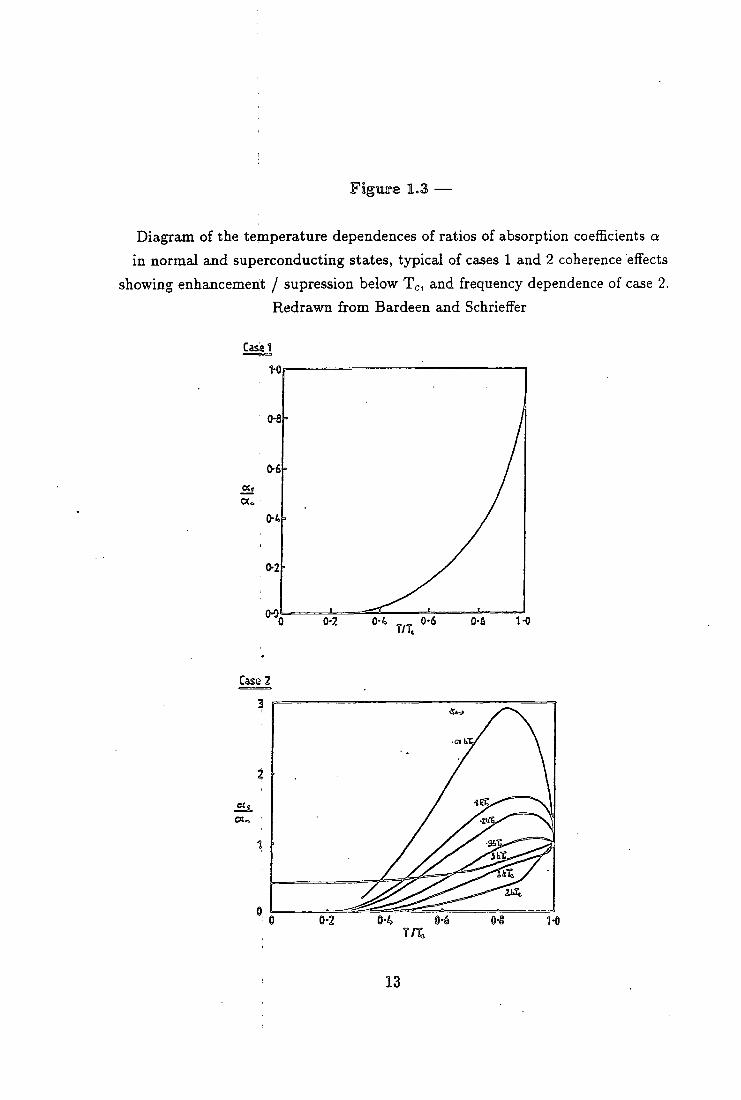
Figwe 1.3 —
Diagram of the temperature dependences of ratios of absorption coefficients a
in normal and superconducting states, typical of cases 1 and 2 coherence effects
showing enhancement / supression below Tc, and frequency dependence of case 2.
Redrawn from Bardeen and Schrieffer
Casel
Case 2
1-2 0-4
13
1.7 EiSFect of Gap The gap in the electronic excitation spectrum is undoubtedly important to a
simple discussion of superconductors. It is, nevertheless, not necessary for the oc
curence of superconductivity per se , as has been shown (e.g., Phillips) in the study
of superconductors with paramagnetic impurities. The pair breaking effects of the
impurities can lead to a system with no electronic gap, but which still possesses
the necessary phase coherence for the electrons to be superconducting. This is
surprising at first glance, to say the least. However, we know that superconductiv
ity is surprisingly robust, maintaining phase coherence over long distances in real
samples. It is at least likely that it can survive small quantities of impurities.
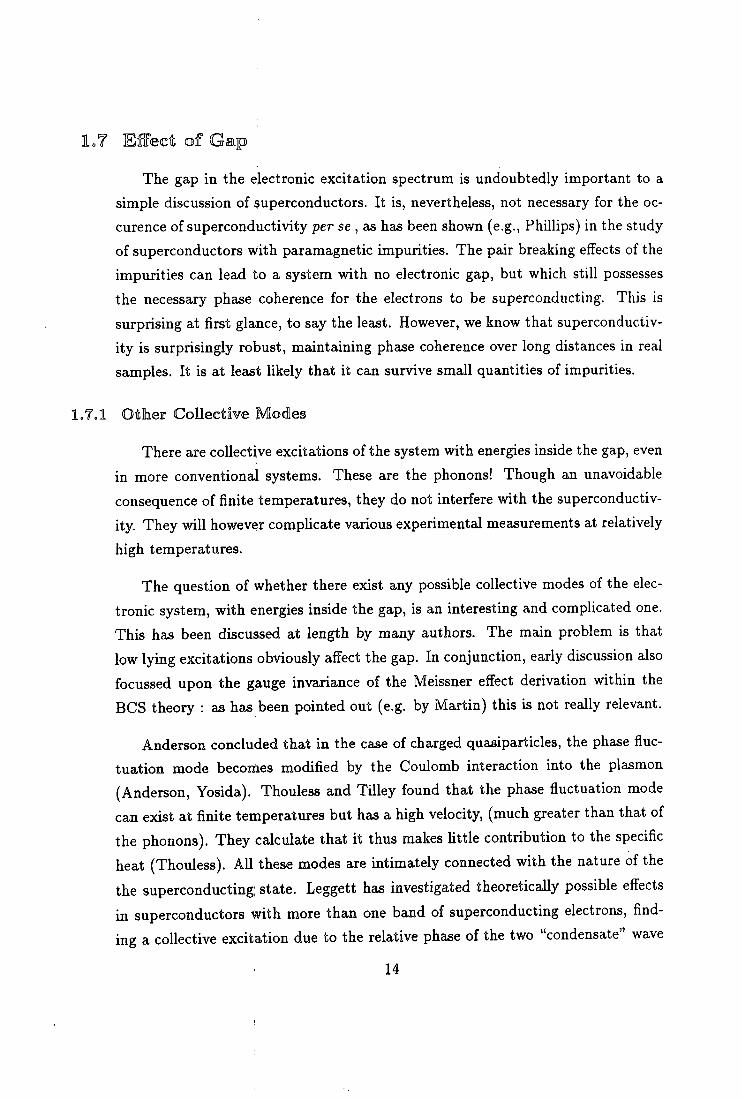
l . T . l Other Collective Modes
There are collective excitations of the system with energies inside the gap, even
in more conventional systems. These are the phonons! Though an unavoidable
consequence of finite temperatures, they do not interfere with the superconductiv
ity. They will however complicate various experimental measurements at relatively
high temperatures.
The question of whether there exist any possible collective modes of the elec
tronic system, with energies inside the gap, is an interesting and complicated one.
This has been discussed at length by many authors. The main problem is that
low lying excitations obviously affect the gap. In conjunction, early discussion also
focussed upon the gauge invariance of the Meissner effect derivation within the
B C S theory : as has been pointed out (e.g. by Martin) this is not really relevant.
Anderson concluded that in the case of charged quasiparticles, the phase fluc
tuation mode becomes modified by the Coulomb interaction into the plasmon
(Anderson, Yosida). Thouless and Tilley found that the phase fluctuation mode
can exist at finite temperatures but has a high velocity, (much greater than that of
the phonons). They calculate that it thus makes little contribution to the specific
heat (Thouless). All these modes are intimately connected with the nature of the
the superconducting state. Leggett has investigated theoretically possible effects
in superconductors with more than one band of superconducting electrons, find
ing a collective excitation due to the relative phase of the two "condensate" wave
14
functions, which will of course only exist in a two-band system (Leggett).
This field of study is made no easier by the fact that it may only have important
consequences at finite temperatures where the theoretical work becomes rather
difficult. The fact that gapless superconductivity does exist must indicate that
there is no absolute requirement for no states to be available in the gap.
l o 8 Conductivity
The opening of the gap and development of phase coherence has a profound
effect on the conductivity, as shown by the startling D C properties. The question
then arises, what happens to the full (q,w) form of these functions? This might
be though of as the ultimate task in a macroscopic picture of the superconducting
state, as the nature of the conductivity ultimately determines the low field electro
magnetic behaviour of the ideal superconductor. The mixed state is not considered
in this picture. The early effort in this topic was concentrated upon the q = 0 case,
in the B C S superconductor (Mattis).
Tinkham and Ferrell, and Nakajima, addressed the problem directly, and their
papers (Tinkham, Nakajima) show the manner of the problem at zero temperature,
deriving the free parameter in Pippard's form for the coherence length from the
B C S theory in an elegant manner. They ask the question posed above, and obtain
the zero temperature behaviour of a' and a", the real and imaginary parts of the
conductivity. </ is affected by the gap and all the weight from the conductivity at
finite frequencies which must be removed by the gap, (due to the lack of scattering
processes), is taken into a delta function at a; = 0 (see figure 1.4). This gives a
corresponding Ifu) component to the imaginary part, a2, via the Kramers-Kronig
relations (see Kittel for a brief discussion).
At higher q, (q^ > 1), essentially the point is that although the gap persists, the
delta function pole at w = 0 in (T'(q,a;) is of reduced strength at these wavevectors.
This is due to the availability of normal excitations giving weight to the lossy part
of the conductivity (i.e. a') at high frequencies.
Thus there is a direct physical way in which the coherence length affects the
macroscopic quantities such as conductivity at small but finite q. Of course, if
15
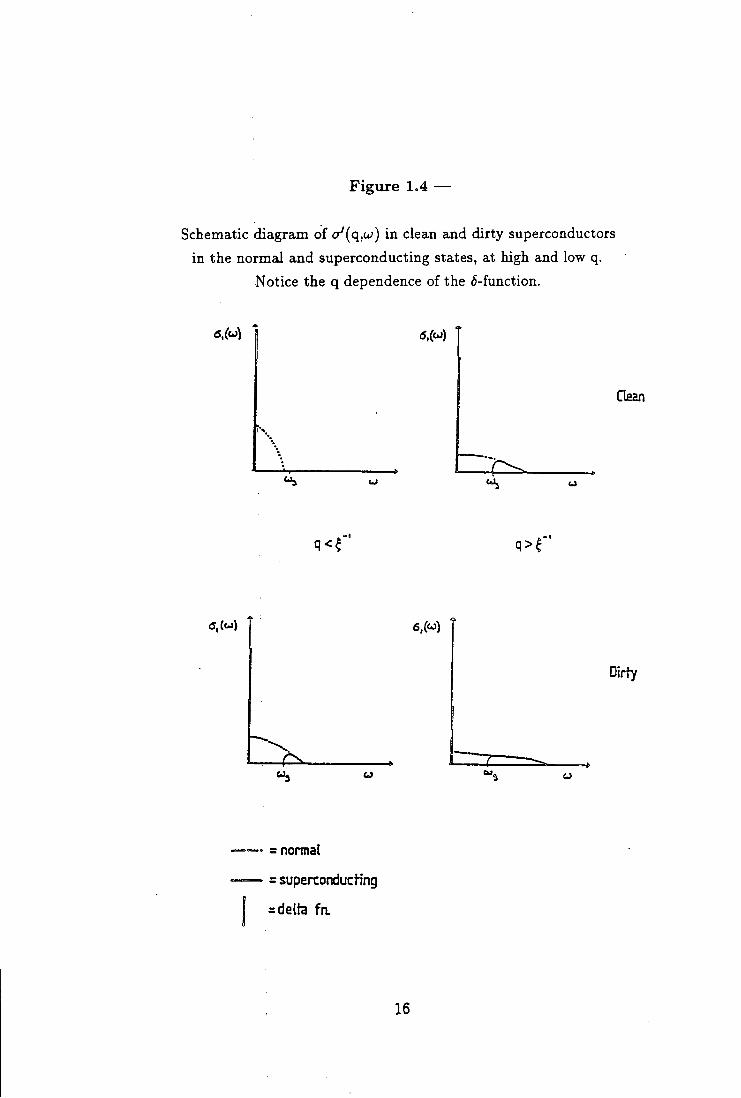
F i g u r e 1.4 —
Schematic diagram of </(q,a;) in clean and dirty superconductors
in the normal and superconducting states, at high and low q.
Notice the q dependence of the 5-function.
«5.M
5 ^
Clean
<5,M 6.M
Dirty
: normal
: superconduch'ng
: delta f a
16
we are in the dirty limit, then there is a non-zero term in the conductivity at
frequencies greater than the gap due to the large width in frequency of a'{q,u}),
due to the short mean free path, even at q = 0 . In this case, not all the available
conductivity weight will be in the delta function even at zero temperature and low
q. The use of sum rules on integrals of cr'(q,a;) is of obvious importance in this
subject, as it is this property that makes it very easy to see why the delta function
will arise if there is a gap.
Now, if it is the temperature dependent energy gap that determines the relevant
scale for these processes, then the coherence length in this argument wiU also be
temperature dependent. An experiment that could measure at these scales of q
would in principle be able to measure the coherence length directly in zero apphed
magnetic field, by looking for the length scale at which the strength of the delta
function started to diminish. Finite temperatures will complicate the analysis due
to the "normal" electron contribution to the conductivity.
17
Chapter II
High Tc Superconductors
P.B.Allen. "(Do you think that) . . . the interplay between superconductivity
and metal-insulator transitions in perovskite compounds deserves further study ?"
B.Matthias. "Yes."
Conference discussion in Ternary Superconductors, (Ed. Shenoy), 1980
2.1 History
Since the discovery of superconductivity, there have always been systems where
the Tc was higher than others, e.g, niobium which has the highest Tc for an element,
9.2 K . These systems were generally regarded as just the highest members of the
series of lower Tc materials. However, when more and more compounds were tested
for superconductivity, (in particular by Matthias and coworkers, (Matthias)), many
intermetallic compounds were found to have higher Tc's than any element, with
Tc's eventually reaching of the order of 20 K in compounds similar to VaGa and
NbaGe. A selection is given in Table 1.1 in chapter I. As there was much interest
in these particular materials for technological applications, they were generically
called High Tc materials.
Other compounds with higher than elemental Tc's were also known as High
Tc, in particular the Bai-jjPbaBiOa perovskite (Sleight). This was all the more
strange because it would need an anomalously large electron-phonon coupUng, if
a B C S model were to be used, or a non - B C S mechanism. Many efforts had
been made to understand the nature of superconductivity in this compound, none
entirely successful. This is what led to the rather prophetic quote heading this
chapter.
18
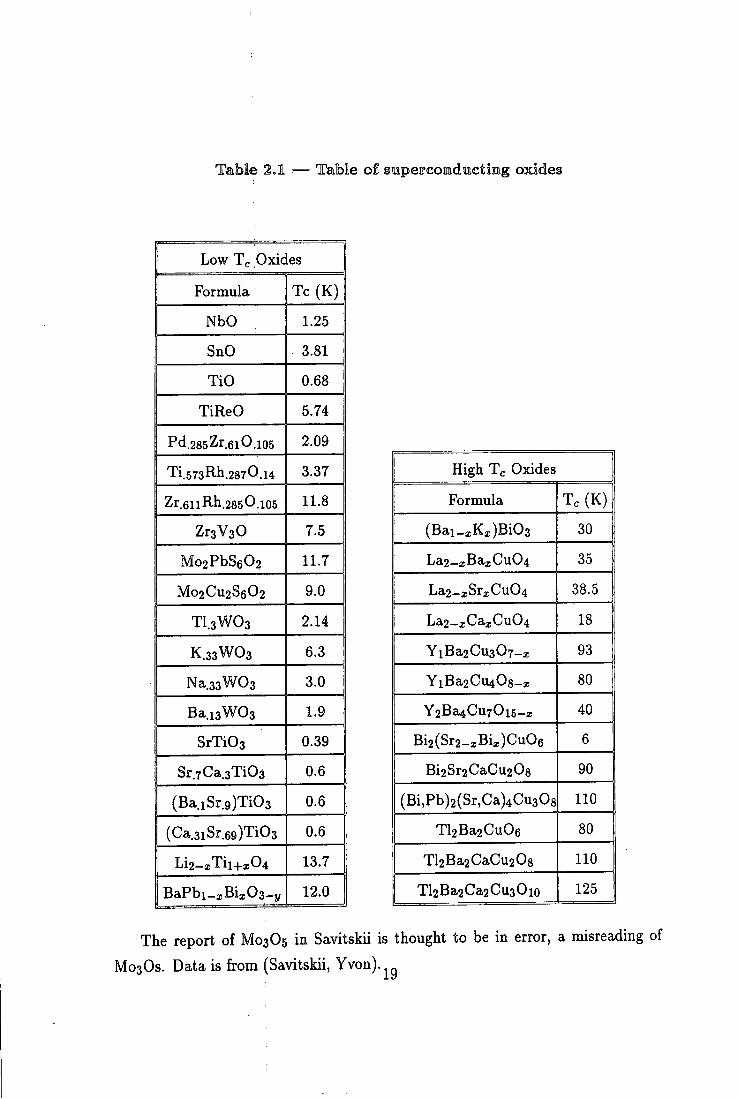
Table 2.1 •— Table of snipercomdiiictimg oxides
Low Tc Oxides
Formula T c (K)
NbO 1.25
SnO 3.81
T i O 0.68
TiReO 5.74
Pd.285Zr6iO.105 2.09
Ti.573Rh.287O.14 3.37
Zr.6llRh.2850.105 11.8
ZrsVsO 7.5
Mo2PbS602 11.7
M02CU2S6O2 9.0
TI.3WO3 2.14
K.33WO3 6.3
NasaWOs 3.0
Ba.i3W03 1.9
SrTiOs 0.39
Sr.7Ca.3Ti03 0.6
( B a i S r 9 ) T i 0 3 0.6
(Ca3iSr69)Ti03 0.6
Li2-xTii+x04 13.7
BaPbi_xBix03-y 12.0
High Tc Oxides
Formula Tc (K)
(Bai_xKx)Bi03 30
La2-xBaa;Cu04 35
La2-xSrxCu04 38.5
La2_xCaxCu04 18
YiBa2Cu307-x 93
YiBa2Cu408-x 80
Y2Ba4Cu70i5_x 40
Bi2(Sr2-xBix)Cu06 6
Bi2Sr2CaCu208 90
(Bi,Pb)2(Sr,Ca)4Cu308 110
Tl2Ba2Cu06 80
Tl2Ba2CaCu208 110
Tl2Ba2Ca2Cu30io 125
The report of M03O5 in Savitskii is thought to be in error, a misreading of
M03OS. Data is from (Savitskii, Yvon).^^
2.1.1 Discovery of La2_iSra;CuO
The greatest development in this field to date was the discovery of Bednorz and
Miiller of superconductivity in the LaSrCuO system, in a compound now known to
be La2-iSra;Cu04 (Bednorz +Miiller). A history of this discovery is contained in
(Bednorz -|-Miiller). This compound has a Tc of 38K at the optimum Sr content.
This discovery has moved the standard for High Tc; as a result the term now
generally refers to this famUy of compounds and its successors and relatives. As
the LaSrCuO system shares many features with subsequent High Tc materials, I
shall not go into its properties, but go straight on to the system studied in this
thesis.
2.1.2 Development of Higher Tc's
A very high pressure dependence of Tc of LaSrCuO, showing a dTc/dP of > 1
K /kbar, compared with other superconductors at around .01 K /kbar (Brandt),
was discovered by Chu et cil (Chu). Wu et al tried to increase Tc in these systems
by the use of chemical pressure, i.e. using smaller cations to decrease the bond
lengths (Wu). This led to the accidental discovery of another family of High Tc
compounds, now known to be based on the chemical formula YiBa2Cu307, (e.g.
Hinks) whose Tc is 93K. The properties of YiBa2Cu307 are summarised below.
2.1.3 Further Series of Compounds
Following the work of Chu and Wu at al., many other High Tc superconduct
ing oxide compounds have been discovered. The most important are based on
the compounds Bi2Sr2CaCu208 and Tl2Ba2CaCu208 (Maeda, Sheng) and their
related compounds. Although showing some marked differences to YiBa2Cu307 ,
sample preparation difficulties are seriously hampering experiments on bulk mate
rial, and I will not discuss them further here.
A table of High Tc oxides is shown (table 2.1), compared with the low Tc oxide
superconductors.
20
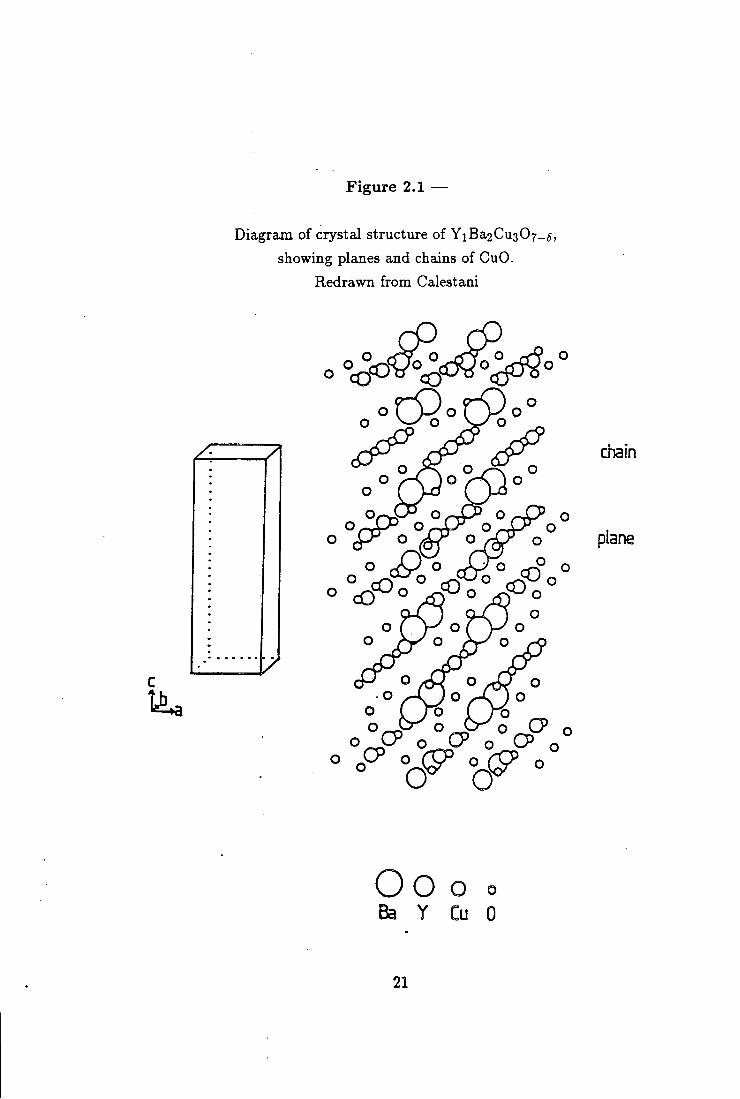
Figure 2.1 —
Diagram of crystal structure of YiBa2Cu307_5, showing planes and chains of CuO.
Redrawn from Calestani
o o (xp o
chain
plane
Oo O o
Ba Y Cu 0
21
2.2 Properties of YiBa2Cu307
YiBa2Cu307 is the most studied High Tc system, mainly because it was the
first to break through the important commercial barrier of Tc = 77 K, the boiling
point of liquid nitrogen at atmospheric pressure. I t is the most studied member of
a whole family of rel?,ted compounds with members of the rare earths taking the
place of yttrium in the structure. A l l but Ce, Pr and Nd give superconductivity
at very similar Tc's (e.g. Maple). There are other compounds in this quaternary
system which are superconducting, e.g. YiBa2Cu40y and Y2Ba4Cu702, and their
rare earth analogues, but they are more difficult to produce reliably (e.g. Cava,
Miyatake). Their Tc's are not very different, but they do vary i n their proper
ties from YiBa2Cu307, (e.g. Morris). They are however much less studied than
YiBa2Cu307 as yet.
Just about every technique of solid state physics has been brought to bear on
both doped and undoped YiBa2Cu307. There exists a massive amount of data in
the published literature. See, for example the review article of Tinkham and Lobb
(Tinkham), the MRS proceedings on High Tc Superconductivity (Ed. Brodsky),
the Los Alamos symposium proceedings (Ed. Bedell) and the book "Physical
properties of High Tc Superconductors" (Ed. Ginsberg). I t is an unfortunate
fact that the rather awkward sample production, and the extreme popularity of
the study of this material conspire against easy analysis. However, this special
attention also means that there is a wealth of data wi th which to compare and
test new experimental results. Different techniques appear to give different values
for the same quantities; different sample production just confuses the issue. The
fact that these materiials can easily be inhomogenous and are certainly anisotropic
means that various techniques do genuinely measure different quantities which
would presumably agree i f the inhomogeneity were removed. Priority in discovery
of results is also a very diff icul t area; references gived here are purely for their
ut i l i ty , and do not imply priority.
2.2.1 Antiferromagnetism
The "parent" compound of this family is YiBa2Cu306, an insulating com
pound showing antiferromagnetic order of the copper sites, w i th a Neel tempera
ture of around 420K. Its structure is essentially a tetragonal unit cell very similar
22
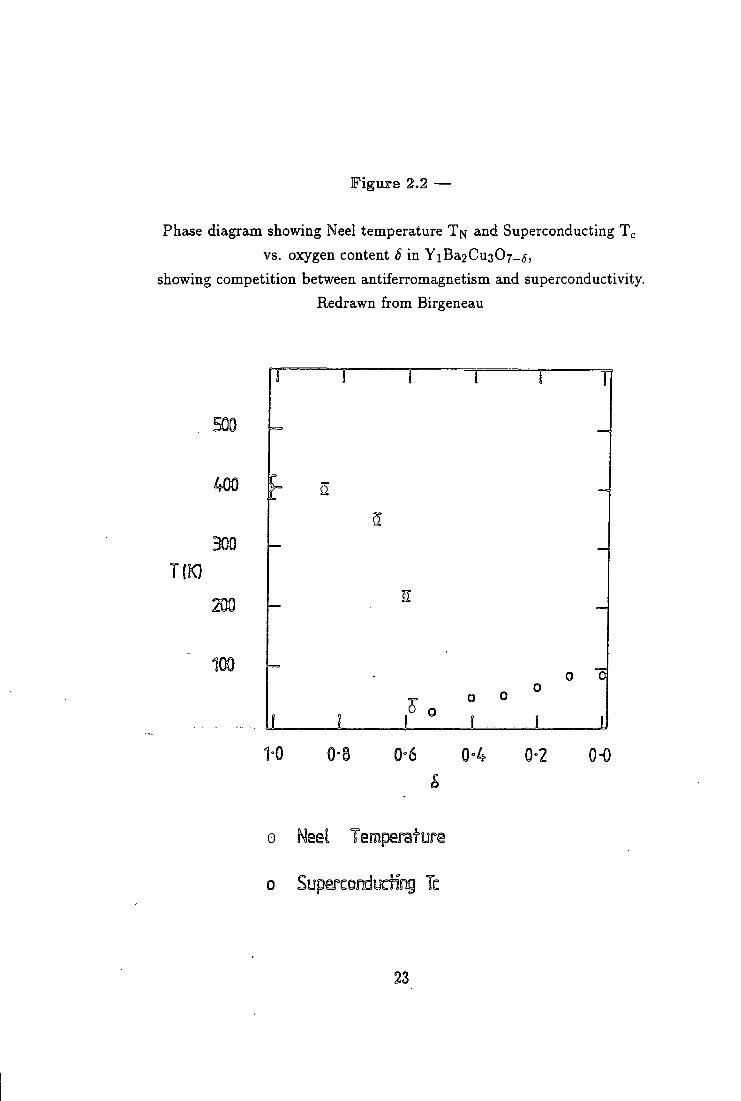
Figiire 2.2 —
Phase diagram showing Neel temperature T n and Superconducting Tc vs. oxygen content 8 in YiBa2Cu307_j,
showing competition between antiferromagnetism and superconductivity. Redrawn from Birgeneau
T(K)
1-0 0- •6 0-4 0-2 OO
0 Supercofdicfif^ Tc
23
to that of YiBa2Cu307, which is shown in figure 2.1. It contains planes of copper
and oxygen atoms separated by the yttrium and barium atoms. GuO itself might
be considered the parent of this compound, but possessing three dimensional Cu-
O order rather than'the planar two dimensional order of Cu-0 in YiBa2Cu306.
CuO posesses antiferromagnetic order below around 240 K , and is not metalUc or
superconducting. CuO also possesses unusually stiff antiferromagnetic excitations,
in common with various of the "parent" compounds of several high Tc systems
(Ain).
2.2.2 Occurence of Superconductivity
Superconductivity can be introduced by doping YiBa2Cu306 wi th extra oxy
gen. This gradually destroys the antiferromagnetism, shown by a decrease in the
Neel temperature, and eventually makes the material metaUic, w i th Tc increasing
w i t h oxygen content. Tc is optimised for a particular concentration, YiBa2Cu307
(See figure 2.2, Birgeneau). The crossover region between the insulating antiferro
magnetism and metallic superconductivity is complex, and studies are hindered by
metallurgical decomposition effects, leading to the possibihty of domains of both
phases separately in the same microstructure.
I
2.2.3 Structure
The properties of the crystcd structure of this family and its modifications are
extremely important in order to explain the physical properties of this material.
(For a more full review, see Yvon, Schuller).
The superconducting phase is an orthorhombic distortion of a tripled per-
ovskite structure. I n this structure a ~ 6 ~ c/3, as shown in figure 2.1 (Calestani).
The orthorhombic distortion is not visible in this diagram. This distorted phase
is stable, as regards the cations, only below a transition temperature some way
below the melting point . Above this orthorhombic / tetragonal ( 0 - T ) transition
temperature, the tetragonal undistorted structure w i t h a = b is the stable struc
ture. This ( 0 - T ) transition temperature and the melting point vary considerably
w i t h the partial pressure of oxygen over the solid, and w i th the yttrium site cation
(see figure 2.3, Spechtj Kubo) . This compound melts incongruently: the solid par-
24
t ia l ly melts to l iquid and solid of different chemical composition. This is a major
obstacle .to the growth of crystals in a controlled manner. i
2.2.4 Twinning
The orthorhombic distortion arising spontaneously at the ( 0 - T ) transition
leads to crystallographic twinning, on a very small scale. Briefly, twinning is
caused by the loss of a = 6 symmetry; some regions choose to relax such that a
is in one direction and some in the other. The energy cost at the walls of these
domains is low, because the change in lattice parameter is small. These twins are
a great nuisance. They could easily act as miniature "weak links", which break up
the long range phase coherence of the superconductor. For our experiments, they
also provide structures at the sort of real spa^e scale that wi l l contribute to the
background in a small angle neutron scattering experiment. This is undesirable,
especially w i t h very small signals to distinguish.
Several groups have managed to reduce the numbers of twins in single crys
tals by applying compressional stress to single crystal plates and annealing them
(Welp). This is however as yet a difficult way of making samples, as i t risks
fracture of the extremely th in crystals. Annealing samples just below the 0 - T
transition temperature may also be a possible way to produce such crystals. No
such techniques have,yet been developed for polycrystalline materials.
2.2.5 Variation of Oxygen Content
This distorted phase can absorb oxygen reversibly over an extended tempera
ture range, taking up oxygen at relatively low temperatures (of order 400 °C), and
losing i t at higher temperatures (Gallagher). Samples are remarkably sensitive to
the atmosphere i n which they are placed, particularly its O2 partial pressure, as
mentioned prevously (Karpinski,Specht). In addition, they continuously absorb
or emit O2 to reach thermodynamic equilibrium w i t h their surroundings, but the
diffusion rates of O2 in these materials are low (Tu). Thus metastable O2 contents
are easily reached, whether this is desirable or not. This is probably the single
greatest problem of sample preparation of YiBa2Cu307 based high Tc systems.
25
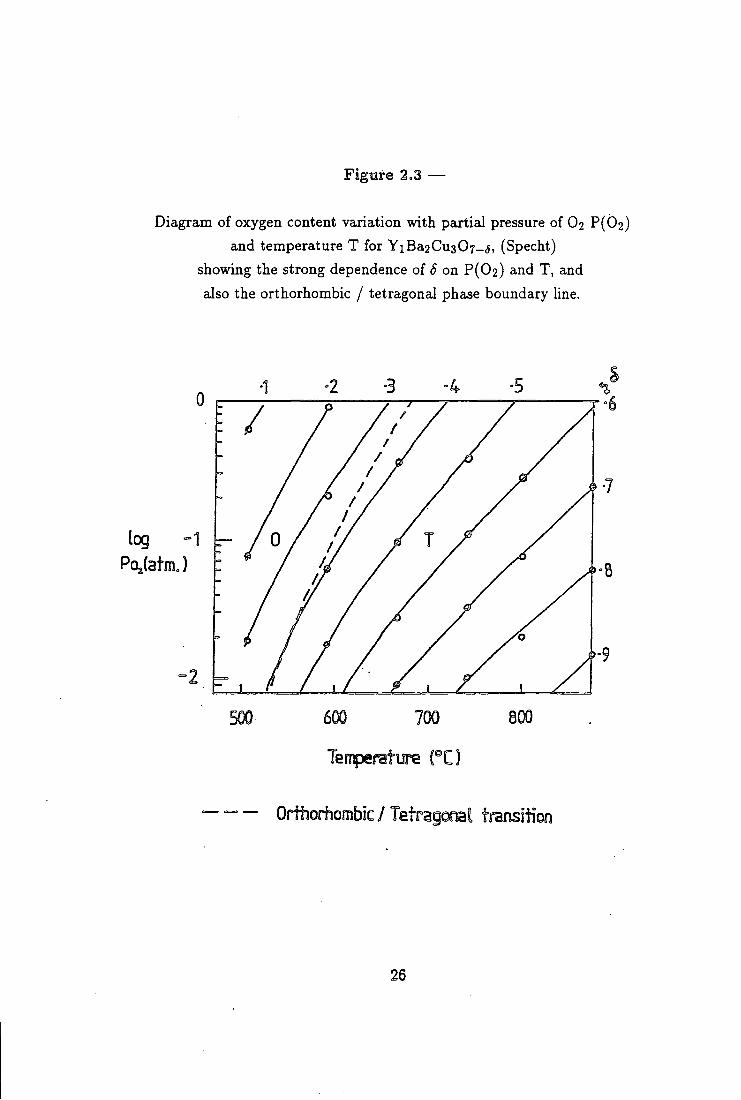
F i g u r e 2.3 —
Diagram of oxygen content variation with partial pressure of O2 P(02) and temperature T for YiBa2Cu307_5, (Specht)
showing the strong dependence of 6 on P(02) and T, and also the orthorhombic / tetragonal phase boundary line.
log -1
em
Temperature PC]
— Orthorhombic/Tetragonal transition
26
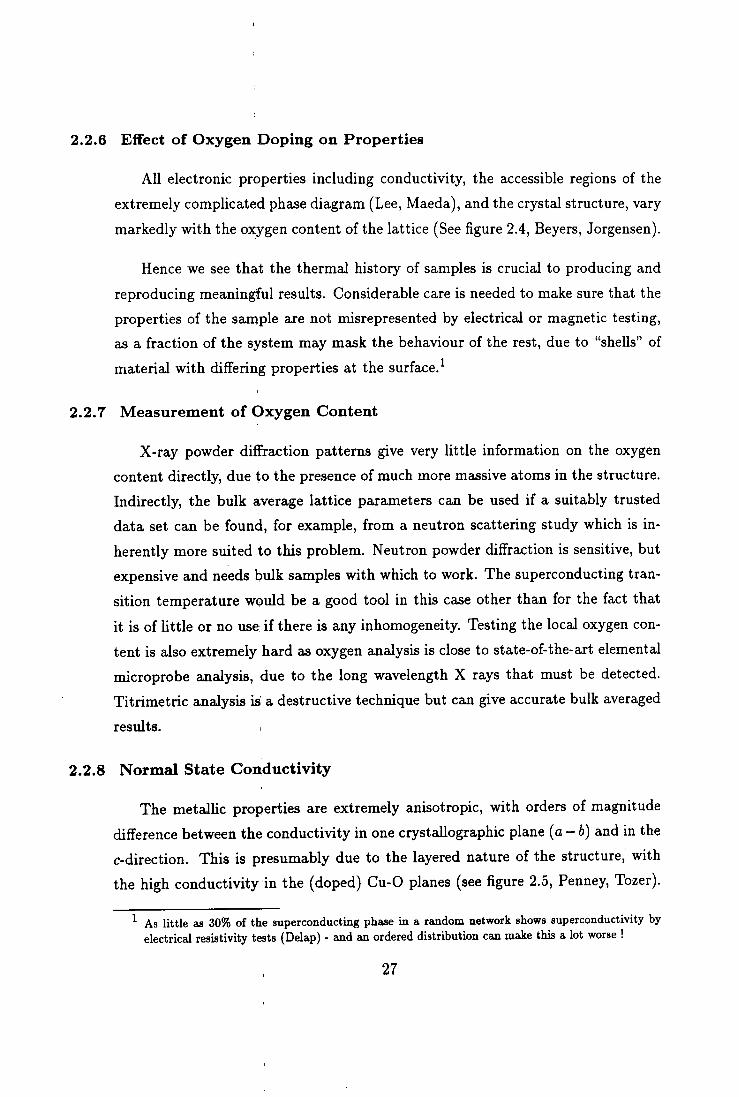
2.2.6 Effect of Oxygen Doping on Properties
AH electronic properties including conductivity, the accessible regions of the
extremely complicated phase diagram (Lee, Maeda), and the crystal structure, vary
markedly w i t h the oxygen content of the lattice (See figure 2.4, Beyers, Jorgensen).
Hence we see that the thermal history of samples is crucial to producing and
reproducing meaningful results. Considerable care is needed to make sure that the
properties of the sample are not misrepresented by electrical or magnetic testing,
as a fraction of the system may mask the behaviour of the rest, due to "shells" of
material w i th differing properties at the surface.^
2.2.7 Measurement of Oxygen Content
X-ray powder diffract ion patterns give very l i t t le information on the oxygen
content directly, due to the presence of much more massive atoms in the structure.
Indirectly, the bulk average lattice parameters can be used i f a suitably trusted
data set can be found, for example, f rom a neutron scattering study which is in
herently more suited to this problem. Neutron powder diffraction is sensitive, but
expensive and needs bulk samples wi th which to work. The superconducting tran
sition temperature would be a good tool in this case other than for the fact that
i t is of l i t t l e or no use i f there is any inhomogeneity. Testing the local oxygen con
tent is also extremely hard as oxygen analysis is close to state-of-the-art elemental
microprobe analysis, due to the long wavelength X rays that must be detected.
Ti t r imet r ic analysis is a destructive technique but can give accurate bulk averaged
results.
2.2.8 Normal State Conductivity
The metallic properties are extremely anisotropic, wi th orders of magnitude
difference between the conductivity in one crystallographic plane (a — b) and in the
c-direction. This is presumably due to the layered nature of the structure, wi th
the high conductivity in the (doped) Cu-0 planes (see figure 2.5, Penney, Tozer).
^ As little as 30% of the superconducting phase in a random network shows superconductivity by electrical resistivity tests (Delap) - and an ordered distribution can make this a lot worse !
27
F i g u r e 2.4 —
Diagram showing the variation in lattice parameters and Tc w i t h 6 i n YiBa2Cu307_5, showing the orthorhombic distortion.
Redrawn f rom Jorgensen
10,0 r — r
Tr{K)
0-0 0-2 0-4 0-6 0-8 1 0 5
A
3-90
3-88
3-86
3-84
3-82
3-80 L
0-0 0-2 0-4 0-6 6 28
0-8 1-
(Though the dopant sites are not themselves in the planes, being on the "chains"
in the lattice).
The normal state anisotropy implies that the superconductivity is also likely
to be strongly anisotropic. This is a major complication for many measurements.
The resistivity above Tc is also closely linear w i th temperature to high tempera
tures. This in itself as also a fascinating property for a high Tc superconductor,
as i t implies that i f electron - phonon effects are strong in this system, (as would
be required for BCS mechanism superconductor), then the conductivity shows no
effects due to the characteristic energy scale of phonons, e.g. the Debye tempera
ture. The true behaviour of this quantity at low temperatures is of course masked
by the superconductivity; however, measurements on other related systems such
as Bi2+iSr2-iCuOy (Tc ^ 6K) indicate linearity over a very large range (Mart in) .
I t is perhaps worth noting that this is only strange because the Tc's are high and
we expect strong electron-phonon interactions. I t is arguable that the problem of
the normal state of this material is worthy of considerable effort to understand;
without this, obtaining insight into the more exotic superconducting state is Hkely
to be diff icul t .
I
2.3 Superconducting Properties
Now that I have discussed YiBa2Cu307_5 and its crystal structure and the
existence of superconductivity in this compound, I shall briefly outUne the known
facts about the superconducting properties of the highest Tc phase, YiBa2Cu307.
The superconductivity is extremely type I I , w i th a large penetration depth
and short coherence length. This is not very surprising, and can be seen to follow
f r o m the discussion of characteristic lengths in chapter I . Any high Tc system must
have a large gap; Fermi velocities do not change very greatly f rom one metal to
another. Thus a short coherence length is inevitable. The low electron density of
this compound giveis a large penetration depth directly.
As very many techniques have been used by myriad groups, not all of them
can be summarised here. Instead a selection of the approximate values of certain
properties is included. For a more complete review, see the references cited above.
29
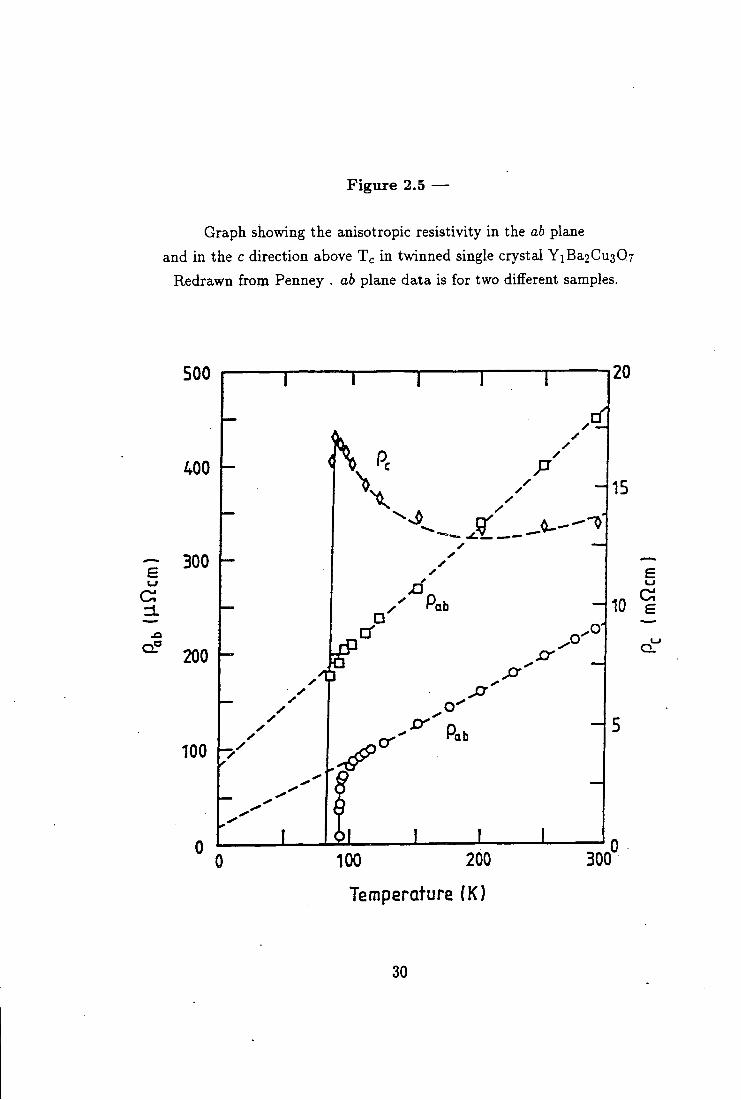
Figure 2.5 —
Graph showing the anisotropic resistivity in the ab plane and in the c direction above Tc in twinned single crystal YiBa2Cu3Q7
Redrawn f rom Penney . ab plane data is for two different samples.
E Ci
100 200
Temperature (K)
300
30
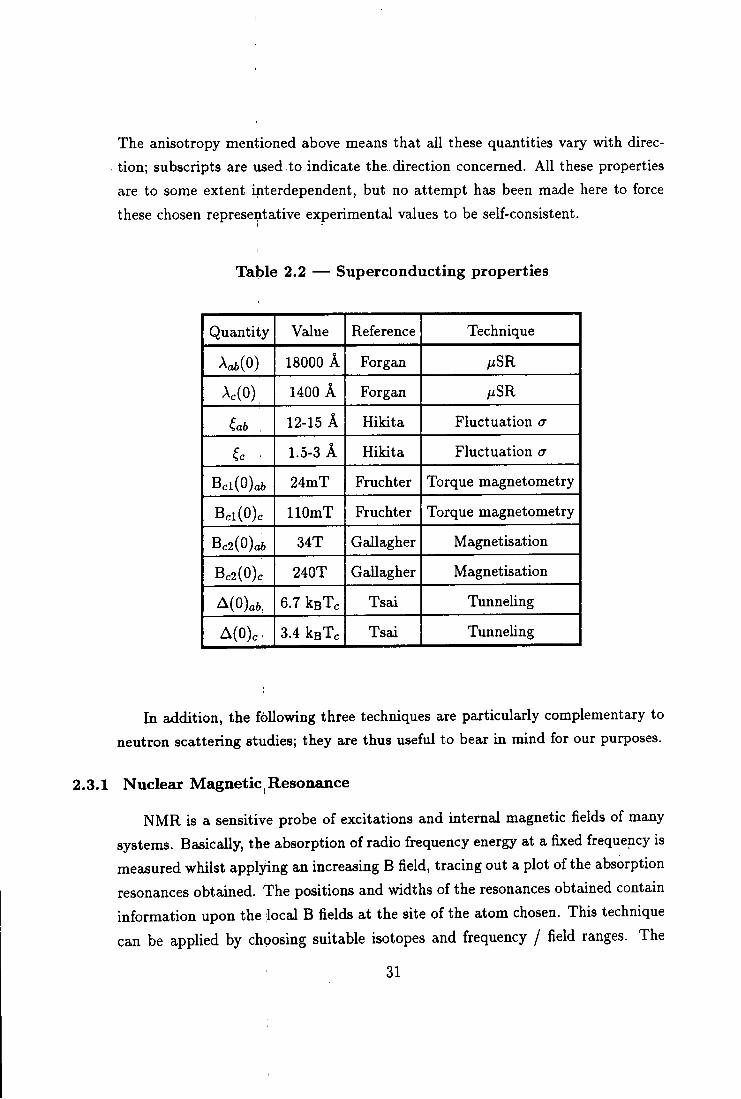
The anisotropy mentioned above means that all these quantities vary wi th direc
tion; subscripts are used to indicate the direction concerned. A l l these properties
are to some extent interdependent, but no attempt has been made here to force
these chosen representative experimental values to be self-consistent.
I
Table 2.2 — Superconducting properties
Quantity Value Reference Technique
Ac^(O) 18000 A Forgan AiSR
Ac(0) 1400 A Forgan fiSR
12-15 A Hiki ta Fluctuation cr
1.5-3 A Hiki ta Fluctuation a
Bcl(0)a6 24mT Fruchter Torque magnetometry
Bcl(0)c l l O m T Fruchter Torque magnetometry
Bc2(0)ai 34T Gallagher Magnetisation
Bc2(0)c 240T Gallagher Magnetisation
A(0)a6, 6.7 keTc Tsai Tunneling
A(0)c . 3.4 ksTc Tsai Tunneling
I n addition, the following three techniques are particularly complementary to
neutron scattering studies; they are thus useful to bear in mind for our purposes.
2.3.1 Nuclear Magnetic Resonance
N M R is a sensitive probe of excitations and internal magnetic fields of many
systems. Basically, the absorption of radio frequency energy at a fixed frequency is
measured whilst applying an increasing B field, tracing out a plot of the absorption
resonances obtained. The positions and widths of the resonances obtained contain
information upon the local B fields at the site of the atom chosen. This technique
can be applied by choosing suitable isotopes and frequency / field ranges. The
31
Unewidths characterise the excitations available to the system. As they measure
the relaxation at a point in real space, an integral over all q-at the resonance
frequency is obtained. These frequencies are quite low, of order MHz. However,
in the superconducting state i t does suffer f rom needing an applied magnetic field
in order to measure ithe resonances, which is repelled by the Meissner-London
diamagnetism of the sample. A t high frequencies skin depth effects in all metals
mean that N M R samples should be th in . The subject of N M R in superconductors
has been reviewed by MacLaughlin (MacLaughlin).
Interpretation of the results obtained on YiBa2Cu307 is difficult as the BCS
prediction for N M R relaxation rate possesses a "Hebel-Slichter" peak in the relax
ation rate due to the coherence factor for this process but YiBa2Cu307 ^ 0 N M R
appears not to show such a peak. The reason for this is not clear (e.g. Barrett).
2.3.2 Muon Spin Resonance (/iSR)
Muon spin resonance provides a means of measurement of the B fields at the
sites occupied by muons when they are implanted wi th in the sample. Thus this
technique has been used to determine the penetration depth , by performing the
experiments in the mixed state and looking at the B field distribution, which is an
average over the flux line lattice (e.g. the Forgan paper referenced above).
This technique has also been used to examine the question of whether a DC
B field can exist i n the bulk of a superconductor, as required by various new
theories such as those postulating particles wi th fractional statistics (Anyons) as
a means of obtaining the rather odd properties of these materials. Kiefl and co
workers find evidence for some random magnetic field of magnitude 0.2 m T at the
muon stopping site i n YiBa2Cu307, but estimate that the nuclear dipole moment
of the copper nuclei can cause such effects and estimate 0.08 m T as the upper
l imi t for anomalous magnetic fields wi th in the sample (Kiefl) . The sensitivity
claimed in the latter experiment is very high; these techniques are in fact somewhat
complementary to neutron techniques which measure B field gradients in space and
time, as they measure the magnitude of the B fields at the muon stopping sites.
Thus /iSR is a local probe technique rather like N M R but there is no requirement
for an applied magnetic field. This is obviously a great advantage when working
32
w i t h superconductors ! Fields of approximately .01 m T can be measured by this
technique. . ....
2.3.3 I R Reflectivity
The electronic properties of metals can be probed by their reflectivity of elec
tromagnetic radiation. This is directly related to the conductivity; both have real
and imaginary parts related by Kramers-Kronig relations. Measurements over wide
ranges of frequency, together w i t h suitable approximations for the behaviour away
f rom this region, are needed to allow continuation to the whole of frequency space
needed for the Kramers-Kronig inversion. The conductivity of superconductors is
strongly modified below Tc, at frequencies below the gap, i.e. when there is insuf
ficient energy to break up a Cooper pair. This is a good way to examine the low
energy electromagnetic properties. The fact that high Tc materials are strongly
two dimensional may also complicate matters due to residual states outside the
Cu-0 planes, giving apparent states in the gap. Typical results do indicate the
opening of a gap, but of only some 80% of the weight in the gap being removed
(e.g. Batlogg, Timusk and Tanner).
2.4 Sample Preparation
2.4.1 Powder Technique
Because of the rather diff icul t properties of this material, the best supercon
ducting properties i n bulk samples, large enough for our purposes, (i.e. mm in all
dimensions), have been produced by a powder processing soHd state reaction tech
nique. This technique is very useful for making new compounds, mainly because
i t relies only on solid state processes and can be carried out at below the melting
temperature to avoid undesired decompositions or incongruent melting. I t is also
extremely simple. I n other fields, however, the disadvantage of the large surface
area of powders permit t ing absorptions of unwanted chemicals into the exposed
surface, especially atmospheric gases, outweighs these advantages.
The raw materials can be chosen f rom a range of suitable compounds available
commercially, but i f the oxides and carbonates are used, they are all insulators
w i t h relatively high melting points, and are prone to react w i th practical crucible
33
materials (Wolf, Scheel). The oxides and carbonates are however commercially
• available at extremely high purities, up to 6N ( I p p m cation impurities).
2.4.2 Technique used
Our method consists of mixing suitable oxide or carbonate reagents, i.e. Spec-
pure Y2O3, CuO, BaCOa, 10 ppm total metal impuri ty (Johnson Matthey), in the
correct cation ratios., These are then placed in a crucible of AI2O3 (Degussa, AL23)
and heated in a resistive oven, to approximately 990 - 1000 °C, the uncertainty
being due to thermometry; this is close to the incongruent melting point, so there
is a need for care to avoid overheating. As an aside, this is due to the need for high
temperatures to decompose the barium salt, but avoiding very high temperatures
because this causes one of the incongruent melt products to wick out of the slightly
porous alumina crucible, causing a stoichiometry variation. Too high a temper
ature also causes an extremely strong sintering of the grains, probably due to a
wetting of the grain boundaries by the lower melting BaCuO/CuO eutectic, which
is undesirable at this stage. This heat treatment causes them to decompose first
into an intimate mixture of oxides, and then allows a solid state reaction to take
place turning the mixture into a compound, or mixture of compounds. This init ial
mixing / reacting process may be repeated wi th grinding periodically in order to
ensure good mixing, as this is essenticd for good stoichiometry material to be able
to form.
The powder is then weighed out and pressed into pellets of the form required
for the experiment, i n a die at approx lOkbar. The die used is a modified Specac
3mm I R pellet die (Specac), having a shortened push rod to allow the quantity of
material to be pressed to be increased. A second push rod is very useful to force
the main push rod back through the die once the pellet is pressed, as the small
amount of material trapped between the push rod and the die body can cause i t
to j a m in the die.
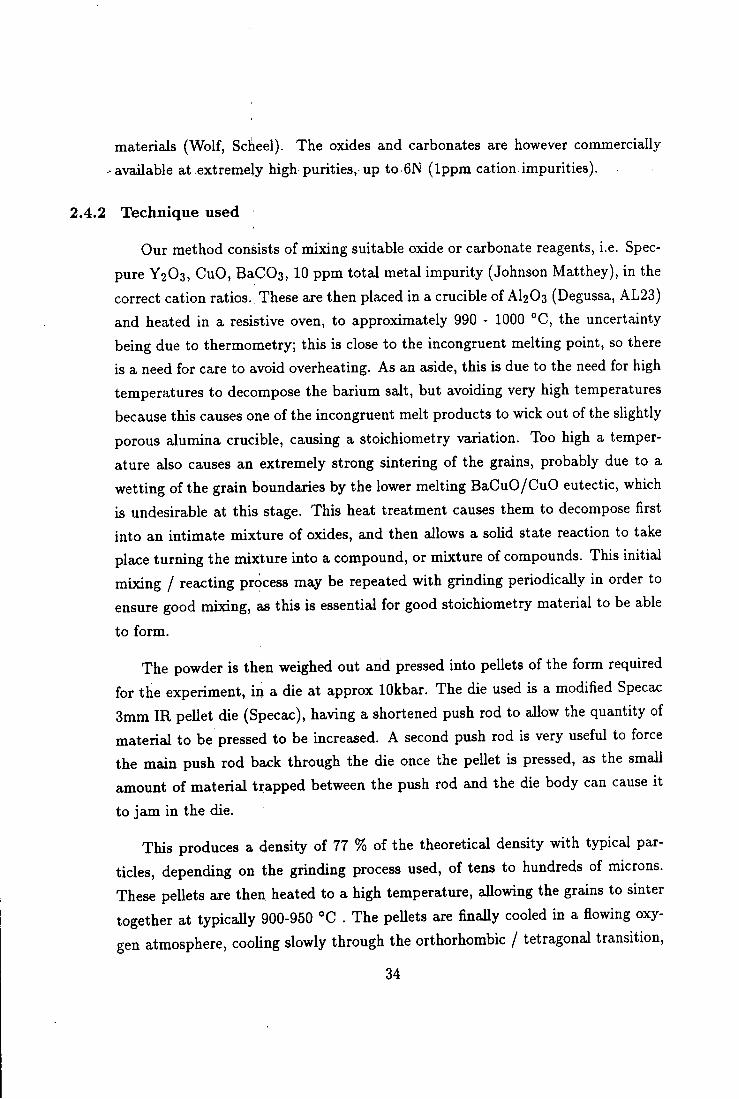
This produces a density of 77 % of the theoretical density wi th typical par
ticles, depending on the grinding process used, of tens to hundreds of microns.
These pellets are then heated to a high temperature, allowing the grains to sinter
together at typically 900-950 °C . The pellets are finally cooled in a flowing oxy
gen atmosphere, cooling slowly through the orthorhombic / tetragonal transition,
34
to minimise strain, and leaving at around 400 °C for a long time - typically one
week, to -maximise oxygen uptake. This leads to material wi th good electrical and
magnetic properties.
2.4.3 Disadvantages
Major problems which arise are mainly due to the multitude of phases available
to this quaternary system; common problems include inadequate ini t ial reaction
producing unreacted barium carbonate, and various other compounds such as the
green phase Y2BaiCuiOx, and others. These can lead to a paramagnetism due
to undesirable Cu "*" ions. This is obviously a complication for any bulk magnetic
measurements at low temperatures. Further, i f the oxygen content is not exactly
correct, the Tc w i l l be lower (as shown above). The solids thus produced are
also extremely sensitive to their local environment and decay in wet air by losing
barium f rom the compound, forming other salts. Samples for experiments, when
in this sintered powder form, are best re-oxygenated prior to any experiment. Any
crystals grown by other means, however, do not suffer as badly in this way, due
again to the extremely slow diffusion of the oxygen f rom the bulk.
2.4.4 Sample Characterisation and Results
The major primary characterisation tool for this work was the resistive transi
t ion of the samples; a low absolute magnitude of resistivity is not strictly necessary
for our experiments as these are probing the superconductivity at length scales of
the order of 100 A, i.e. well wi th in the grains. Thus grain boundaries, which are
the main hmit ing factor i n the resistivity measurement, are not the dominant re
gions i n the experiments described in chapters I V and V . More important for our
purposes is the tota l homogeneity; however, this is very diff icult to measure. Too
high a density can reduce the homogeneity of oxygen site occupancy throughout
the sample, leading to resistance behaviour dominated by well oxygenated surface
sheaths. This is because the oxygen diffusion is slow and we thus need a good pore
structure to enable the oxygen to penetrate deep into the sample. A high Tc is
obviously desirable to show that we have good material of the correct phase and
stoichiometry.
35
F i g u r e 2.6 —
Graph showing the processing temperature vs. time for preparation of the YiBa2Cu307 used in this work.
600
T(C)
400
200
Oa.lbar anneal
300
Timelhourd
36
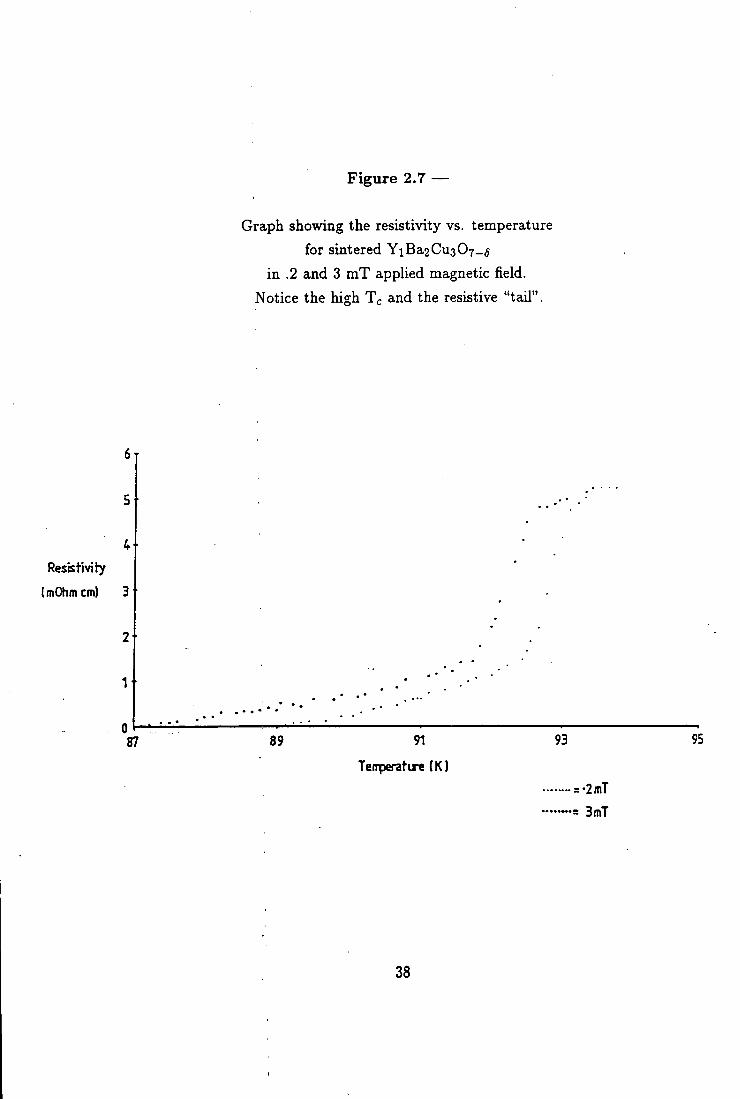
The use of a "long th in bar" sample geometry in these resistivity measurements
was precluded by the size of.the samples and the technique used for making con
tacts to the sample wi th conducting silver D A G paint (Acheson 915 DAG, (Agar
Scientific), thinned wi th heptan-2-one), which leads inevitably to contacts of the
order of 0.2-0.3 m m in size. Accordingly the "corner - corner" technique of Mont
gomery (Montgomery) was used to obtain the resistivity graphs shown, on a filed
sample of dimensions 1.92 x 1.82 x 1.45 mm (all ± .02mm). Fields of 0.2 ( ±
0.1) m T and 3.0 ( ± 0.1) m T were appUed using an iron-cored electromagnet and
measured using a Bell 640 Gaussmeter and Hall probe. The thermometer was a
copper/const ant an thermocouple referenced to 77 K . The absolute magnitude of
these resistivity measurements is probably only good at the 15% level, due prin
cipally to the finite contact size interfering wi th the calculation of the correction
factors needed in this geometry. As the contacts used were along the edges of the
"cube", no thickness corrections were used.
The absolute magnitude of the resistivity of these samples is rather high com
pared to that of the the best samples reported in the Uterature, which have a
resistivity at lOOK below 1 m f i c m . This is probably due to the fact that my
samples were calcined at rather high temperatures (990° C) but only sintered at
900°C. Thus we probably have some second phase segregation or disorder at the
grain boundaries, which raises the resistance and may be responsible for the tai l
to the R vs. T plot due to weak link eflFects.
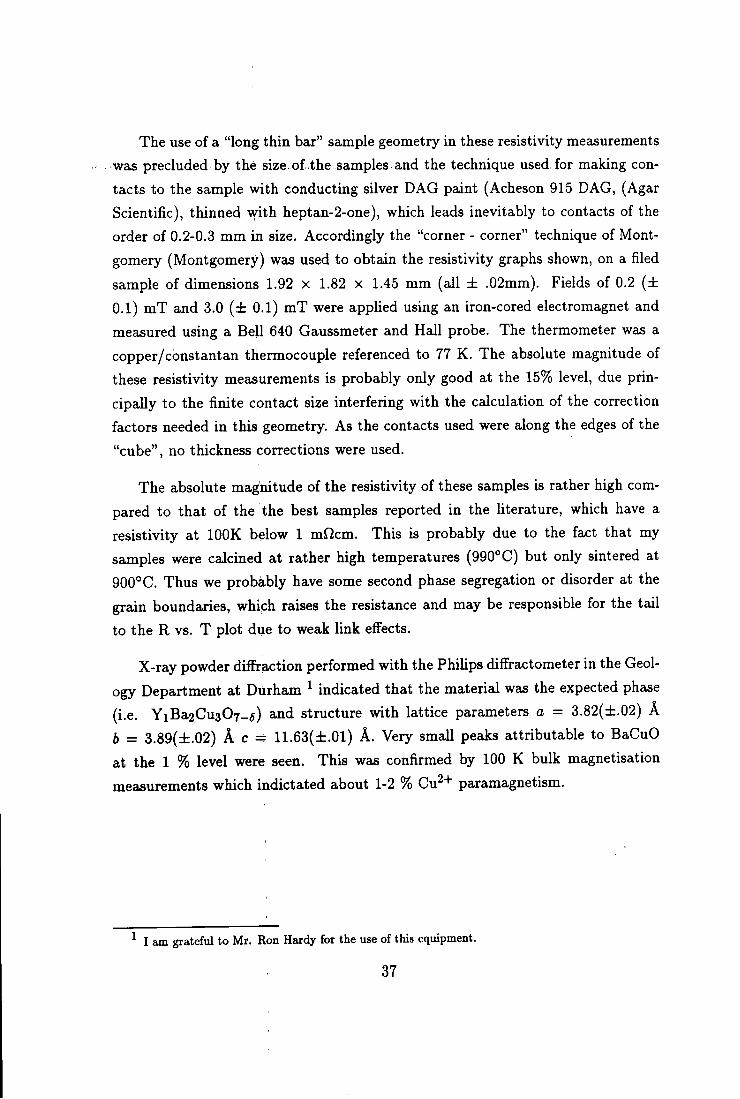
X-ray powder diffra,ction performed wi th the PhiUps diffractometer in the Geol
ogy Department at Durham ^ indicated that the material was the expected phase
(i.e. YiBa2Cu307_5) and structure wi th lattice parameters a = 3.82(±.02) A
b = 3 .89(±.02) A c = 11.63(±.01) A. Very small peaks attributable to BaCuO
at the 1 % level were seen. This was confirmed by 100 K bulk magnetisation
measurements which indictated about 1-2 % Cu^+ paramagnetism.
^ I am grateful to Mr. Ron Hardy for the use of this equipment.
37
6-
Resistivity
ImOhmcm) 3
2
1
Figure 2.7 —
Graph showing the resistivity vs. temperature for sintered YiBa2Cu307_5
in .2 and 3 mT applied magnetic field. Notice the high Tc and the resistive "tail".
87 89 91
Tenperatire (K)
93
= -2mT
—~'= 3mT
95
38
Chapter III
Neutron Scattering from Superconductors
Many of the subtleties we shall discuss are unlikely to concern the experimentalist. However, this paper contains some problems which may interest him.
Paul C. Martin, Phys. Rev. 161, ppl43-155 (1967)
3.1 Previous Work Neutron techniques have not an obvious application to the study of supercon
ductivity per se. This is in direct contrast to the field of the study of magnetism where the neutron can couple directly to the order parameter involved, that is to say microscopic magnetic (B) fields. I here ignore all structured studies of superconductors where neutron scattering obtains similar, but complementary, information to X-ray diffraction.
Those experiments which have been done are essentially involved with the changes of scattering due to the interaction of that scattering mechanism with superconductivity. In this way the effects on static magnetic order, (in terms of competition), the effect on antiferromagnetic excitations and the effects of the superconductivity upon the phonons have been examined. In addition, the spatial arrangement of the flux lines of the Abrikosov lattice has been examined by magnetic diffrziction, and reflectometry has been used to measure the penetration of magnetic field into the surface of the superconductor.
These papers are concerned with majiy aspects of neutron scattering, that is to say magnetic diffraction from ordered atomic moments, magnetic inelastic scattering, nuclear inelastic scattering, and magnetic diffraction from modulated B fields. All of these could potentially complicate the results of our experinients, so I will discuss them briefly here.
39
3.1.1 Competing Ferromagnetic Order
The first, which is of interest only in very specific systems, involves magnetic elastic scattering from magnetic order in a phase in competition for existence with the superconducting phase (e.g. Burlet). This superconducting phase can exist in a temperature interval between the magnetically ordered phases. This is interesting in its own right as being a case where superconductivity is not the ground state of a system in which it occurs. Put another way, this is one of the few cases where superconductivity can be approached from below in temperature ! Neutron scattering has been used to examine the magnetic ordering via the intensity and position of the diffraction peaks.
This does not occur in High Tc systems; a search for magnetic fluctuations in
YiBa2Cu307 performed using D7 at the ILL has given a stringent lower bound
upon any possible magnetic excitations over a wide range of (q,a;) space (Scharpf,
Briickel).
3.1.2 Other Magnetic Effects and Superconductivity
With the discovery of superconductivity in so called heavy fermion systems, e.g. UPt3 (e.g. Franse), the relationship between the unusual magnetic properties of these systems and superconductivity is currently a subject of much interest. This is partly because these systems may be examples of non s-wave superconductivity, where the Cooper pairs have a net orbital angular momentum. In such systems, neutron scattering may give vital information - see for example (Joynt). However, low energy inelastic scattering experiments from these systems are difficult, due partly to the low temperatures at which superconductivity occurs in these systems, below I K . This can lead to considerable experimental difficulties. Few modes are thermally excited at these temperatures, and cold neutrons have a very low incident energy, so we can only reach a limited part of phase space.
In High Tc systems, antiferromagnetic order on the Cu sites is in competition with superconductivity: we know this because it occurs in the non-superconducting tetragonal oxygen deficient YiBa2Cu30<6.4, as I have mentioned in chapter II. Studies of possible coexistence of copper site antiferromagnetism and superconductivity are complicated by phase segregation effects, as mentioned previously.
40
The studies of antiferromagnetic excitations by experiments in single crystals near - this region of composition may yet resolve this point.. (See the .reviews of Birge-
neau and Tranquada). Although some of the rare earth REiBa2Cu307 compounds do show antiferromagnetic order on the rare earth site at very low temperatures, (~ 2K), this does not affect their superconductivity. Yttrium, as in many other cases, behaves as a non-magnetic rare earth in these systems.
3.1.3 Flux Line Lattice Studies
In this case, the modulated magnetic field of the Abrikosov flux lattice is examined by neutron diffraction. Information from the various Bragg reflections and their intensities can be combined to give the field distribution across one flux line and the spatial arrangement of these lines. In some sense this measurement is complementary to DC magnetisation measurements; what is measured is the field contrast, as there is ho scattering from a spatially uniform field. This is a very useful technique, and has been appUed to several materials, including YiBa2Cu307 (Schelten, Christen, Forgan).
High Tc systems are particularly difficult ones for this sort of measurement, mainly due to the extremely low wavevector q of the reflections at experimentally reasonable B fields, and the need for a single crystal. The experimental geometry is also somewhat awkward, due to the need for sizeable B fields parallel to the neutron beam, whilst of necessity maintaining a small volume of apparatus in the beam. This low contrast and the high fields required mean that it is rather unlikely that our experiment can observe any scattering from a flux line lattice, especially as we are only in the earth's magnetic field.
3.1.4 Reflectometry
At the superconductor surface, in an applied small magnetic field (below Bci), the field distribution is given simply by the geometry and the penetration depth. Neutron reflectometry is a powerful tool for the study of surface magnetic field distributions and has been used to measure this penetration depth (Mansour). Values obtained for High Tc materials vary and are rather different depending upon the sample, but can give results that are at least consistent with other means of measuring the penetration depth. Note that the anisotropic nature of the solid
41
may have to be taken into account in a polycrystalline sample. This effect is of little, consequence for our purposes.as we have a bulk sample in a weak magnetic field (the earth's). In addition, it would be expected to be strongly affected by any change in the applied magnetic field.
3.1.5 Phonons
The phonons at low energy in superconductors are affected by the strongly modified low energy properties of the electron gas. Longitudinal phonons, with their associated (screened) charge fluctuations might be expected to be affected by the dramatic change in response of the superconductivity (Allen). However, it appears that transverse phonons are affected in similar ways (Shirane). This is perhaps not so surprising in that phonon frequencies are only weakly dependent on such low energy properties of the electron sea. The damping, however, can be dramatically reduced. The energy resolution required to measure these low dampings is a difficult constraint for current experiments. The most odd feature of these experiments is that whilst low energy phonons soften and lose damping, at phonon energies just above the gap the damping can increase ! This shows that the phonon-electron system is not a simple one to analyse. Nevertheless, the measurements are at least broadly in agreement with the theory. Not many experiments have been done on this effect, it seems, as even in elemental superconductors these are not easy experiments, as very high resolution is required. For more information see (Youngblood, Axe). There is no published data on the effects on specific phonons of varying temperature in YiBa2Cu307 at finite wavevector q.
Incoherent one phonon neutron scattering can also be used to measure the totzil density of states of the phonons weighted by various factors relating to the neutron cross-section. Its temperature dependence can also be measured. This can show up the broad trends in the phonons, giving an idea of where the softening occurs in terms of the phonon energies (e.g. Reichardt).
42
3.2 Directly Probing the Superconducting State with Neutrons
3.2.1 Analogy
It may be worthwhile here to show that there is a weak analogy between High Tc superconductors and weak itinerant ferromagnets, which are metalUc systems which develop ferromagnetic order at temperatures of order 30 K. Notice that the critical temperatures, and hence energy scales of the phenomena are of the same order. Here in both cases, there are strong magnetic correlations; one produces perfect diamagnetism whereas the other has a non-vanishing magnetisation in zero appUed field. In weak ferromagnets, these correlations can be observed both above and below the Curie temperature T c by small angle neutron scattering experiments.
Drawing upon this example, it may be useful to ask whether there are any low energy excitations of the superconductor which could be measured with neutrons in a similar way. The neutron has a great advantage over other probes in this
. regard as it has its own magnetic moment, and can thus probe the response to an applied field even in the bulk of a superconductor. Naturally, the neutron moment will be screened by currents flowing in the superconductor around it, but these screening currents after all correspond to the magnetic response of the system to the perturbation, that is to say the neutron!
It may be wise to treat this analogy with a degree of suspicion. One rea
son for this is that although we have examples of incipient ferromagnetism, (e.g.
NiaGa), where strong ferromagnetic correlations exist but ferromagnetism does not
actually occur, no such system has ever been found that demonstrates incipient
superconductivity.
3.2.2 Suitable Regions of (q,a;) Space
Now if this is a sensible idea, we have to estimate at what scales of (q,ci;) we
are likely to see any effects at all. In chapter I, it was pointed out that all the
relevant q-scales for superconductivity are rather small. This is especially true by
comparison with the weak ferromagnets, where there can be appreciable effects out
to a sizeable fraction of the zone boundary. The response of the superconducting
43
state is only of full strength, (even at zero temperature), at q < This expresses the fact that.the coherence length represents that distance scale over which we can vary the order parameter. We know also, that in tending towards truly macroscopic length scales (i.e. small wavevectors), the magnetic response will be dominated by screening effects. This may be expressed in wavevector terms by saying that, to a first approximation, only effects at q > will be unaffected.
Thus the q-range that seems to be likely to be interesting is < q < An extreme type II superconductor with a short coherence length seems to be the ideal object for study in this case. Unfortunately, no element seems to be an obvious low Tc test case to investigate - the most type II element (niobium) is not extremely type II. Thankfully, High Tc systems provide just such a case. These q-ranges, in High Tc systems, are right at the lower limit for feasible neutron scattering experiments, using the small angle scattering technique. It is important to note that these q scales are temperature dependent and that there is no way that we could reach ^"^ at Tc as it approaches bulk (i.e. very small) wavevectors.
3.3 Theoretical Calculations of the Neutron Cross-Section
This question is closely related to the problem of the scattering of neutrons from the normal electron gas in a metal treated by Sasaki and Obata (Sasaki). At extremely low q, they showed that the screening effects of the motion of the electrons are important, even in the normal metal. This can be thought of as the effect of eddy currents, which respond to damp any changing magnetic field. This low q screening has never been experimentally observed, as in the normal metal the experimental q's required are truly daunting (of order 4 x 10~^ A~^)-
The only published direct attempts to deal with this whole problem in a superconductor and specifically in a High Tc system are the various of papers of Rajagopal, Mahanti and Jin (Rajagopal,Jin). f Both these papers, and that mentioned above, address the problem by formulating the neutron scattering cross-section in terms of the current-current correlation function of the system.
It is possible that the low q screening may well be much stronger in the superconductor if we take account of the Meissner-London diamagnetic response at
f The paper of Joynt mentioned above treats only the spin part of the susceptibiUty
44
wavevector scales of order q < A~^, giving a greatly increased screening effect - in addition, as the superconductor currents are persistent, they.screen even DC fields (unlike eddy currents).
Rajagopal et al focus attention upon the orbital part of the susceptibility at low q as the best place to see effects from the superconducting transition. They predict a decrease in orbital scattering in the superconductor compared with a non-superconductor at T = 0. However, they give the relevant expression for the cross-section leaving out various constant factors; this leaves the question of intensity open ! They also expressly ignore the effects of the screening at low q.
Appendix A contains a derivation of the quantity we are measuring here in as short a form as possible. The main result is (in c.g.s):-
d?^ 7 W ,,2.
where ( \B(q,u)\^) = 6{ATrfhun{aj)
where = M2[(l-/xa;Vc2g2+47r/xa;a;;^(g,c^)/c2g2)2 + (4^/,^^^^^(5,^)/,2^2)2j-l
where 7 is the neutron gyromagnetic ratio, n the number of atoms per unit volume, and k' and A the final and initial neutron wavevectors respectively, /x is n{q) in all the above equations.
This result demonstrates the sensitivity of neutrons to the effects of the conductivity fluctuations in a solid, and contains the relevant small q screening as discussed above, but with a slightly different result which expressly includes the Meissner-London diamagnetism in fj,.
45
Ignored in this formulation are the nuclear scattering terms, and spin suscep
tibility scattering (spin waves, paramagnons etc.). Other measurements such as
those of the bulk paramagnetic susceptibility of YiBa2Cu307 (e.g. Junod) do not
indicate strong enhancement of susceptibihty in bulk material, so this can safely
be ignored in this system at low q.
The discussion of chapter I leads us to expect that the regular part of the
conductivity will in fact lose weight at low energies as the gap develops and the
weight in the delta function increases: this expression is therefore in at least broad
agreement with that of Rajagopal mentioned above. Thus the theory predicts
firstly a loss of scattering below Tc, caused by the opening of the gap, and perhaps
a slight enhancement of scattering above Tc due to fluctuation effects.
We must not though forget the "normal" electron contribution at around Tc.
This is especially true given that the coherence efects mentioned in chapter I may
also be important here, as the NMR relaxation rate shows; such coherence effects
can enhance such relaxation / scattering processes, but only by numerical factors
of order 2 in real systems. In any case, such enhancements have not yet been
observed in High Tc systems such as YiBa2Cu307 and may not actually occur in
these sorts of system. I
3.3.1 Sum Rules
Sum rules on the quantities used to derive the cross-section (i.e. cr'reg) must give
an upper limit to the cross-section that can be measured. These are also illustrated
in appendix A. The total cross-section if integrated over all the conductivity, for
reasonable choices of parameters for YiBa2Cu307 , gives a total cross-section even
at low q (q = 0.04 A~i^) of order 10 mbarn/sr/atom (Bernhoeft).
Now we can only use this result as the maximum cross-section possible just
for orbital scattering, if all the scattering lies within the window for neutron scat
tering allowed by momentum and energy conservation. This means that all the
conductivity has to be at low energies. This implies in turn we will need to be
in the clean Umit, with a long mean free path, and a low Fermi velocity even to
see this much scattering at low q. Nevertheless, it gives a feel for the orders of
magnitude involved. These effects are, in this formalism, rather weak and do not
46
seem to be enhanced: this is in direct contrast to the paramagnetic term near the ferromagnetic transition.
Experiments to try to measure these effects are discussed in the next 2 chapters.
47
Chapter IV
SANS Studies of YiBa2Cu307-« - Background
"I saw the flying atom-streams, and torrents of her myriad universe. "
Lord Tennyson, Lucretius
4.1 The Small Angle Neutron Scattering Technique (SANS)
4.1.1 General Introduction
SANS is, as its name suggests, the investigation of the small angle scattering of neutrons. Small angle scattering is interesting because it probes the long wavelength (low wavevector q) properties of the sample, at typical q's of 0.004 to 0.2 A~^. The technique is sensitive to any property of a sample that gives rise to elastic or low energy inelastic scattering phenomena at these scales of distance or momentum. It is thus used across large ranges of modern science. Examples of the elastic scattering investigated include diffuse scattering due to macroscopic changes in scattering length in polymers and diffraction studies of large scale crystal structures. It is also of great interest for probing the collective excitations of many solids, especially close to phase transitions. See (Windsor, Bernhoeft). Low angle scattering is inherently a good place to look for magnetic scattering due to the lack of phonon creation scattering, as v^ < Vp^ (e.g. Lovesey).
The separation of the dynamical from static effects is usually done by varjdng the temperature and observing changes in the scattering of neutrons. To first order only the difference in populations of the various collective modes, (phonons, magnons, paramagnons), of the sample will then contribute. This subtraction technique can get rid of the small angle scattering from the inhomogeneity of the sample, diffuse scattering, which is not of interest in these experiments.
Energy analysis of the outgoing beam may also be employed. Obviously, energy
analysis gives a more complete picture of the nature of the scattering, which may
48
permit a more detailed model to be constructed. However, there is a corresponding cost in the time required for the experiment, due to the need to monochromate and analyse the beam. The advantage of such inelastic experiments is their ability to choose to work at finite energy transfer to minimise potential sources of error due to other scattering mechanisms.
4.2 Discussion of Other Published Work on Y i B a 2 C u 3 0 7
To date, there have been various studies of high Tc materials by SANS, all of which have given published results which are not quantified in terms of the absolute cross-sections. They are briefly discussed below. All are by total scattering techniques, with no energy analysis.
4.2.1 Search for Suppression of Paramagnetic Scattering
In this paper (Lynn) magnetic fluctuations in the rare-earth substituted High Tc system EriBa2Cu307 are considered. The experiment seeks to show the effects on the paramagnetic scattering, (from the Er ions), due to the screening effects of the superconducting state. In order to do this they use high temperature data as the standard to remove the "metallurgical" defect scattering and seek a decrease in the overall scattering. Their results do show that at temperatures below Tc there is less scattering at q's below around 0.045 See figure 4.1. They use this to obtain a London penetration depth of around 20 A even close to Tc, which is not consistent with other measurements by possibly two orders of magnitude: see chapter II.
Other questions remain too; no absolute magnitude is given for the observed scattering, so comparison with our data is impossible. The error bars used are also of uncertain origin and size, with apparently very small size at some points. Using a system with a rare-earth in it leads to the possibility of scattering from "crystal field" levels at finite energies. These can be thermally populated and give temperature dependent changes. No account is taken of the possible incoherent phonon scattering or multiple scattering effects changing the subtracted "metallurgical" background level at high temperatures, leading to an error by overestimating the subtracted background. On the other hand, it would be possible to look at this data and to say that there was excess scatter at low q close to Tc, using the
49
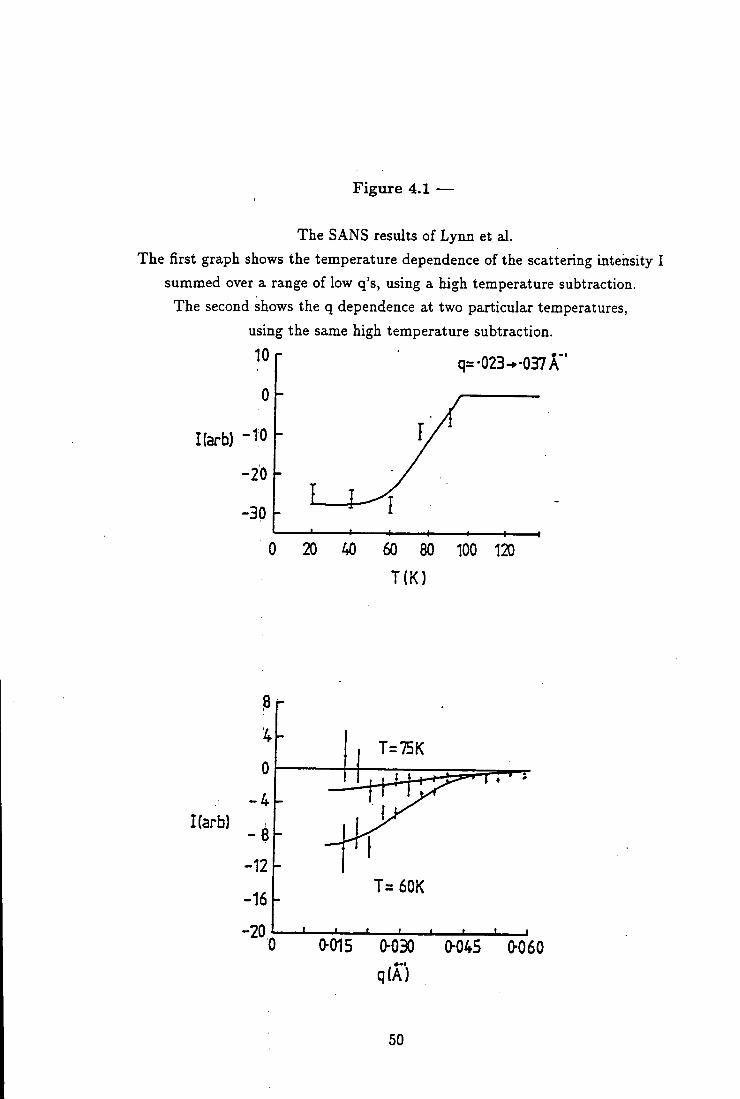
Figure 4.1 —
The SANS results of Lynn et al. The first graph shows the temperature dependence of the scattering intensity I
summed over a range of low q's, using a high temperature subtraction. The second shows the q dependence at two particular temperatures,
using the same high temperature subtraction.
q=-023--037r
Karb) "10
-20
-30 1-
20 AO 60 80 100 120
T(K)
Karb)
T=75K
T=60K
0-015 0-030 0-045 0-060
q(A)
50
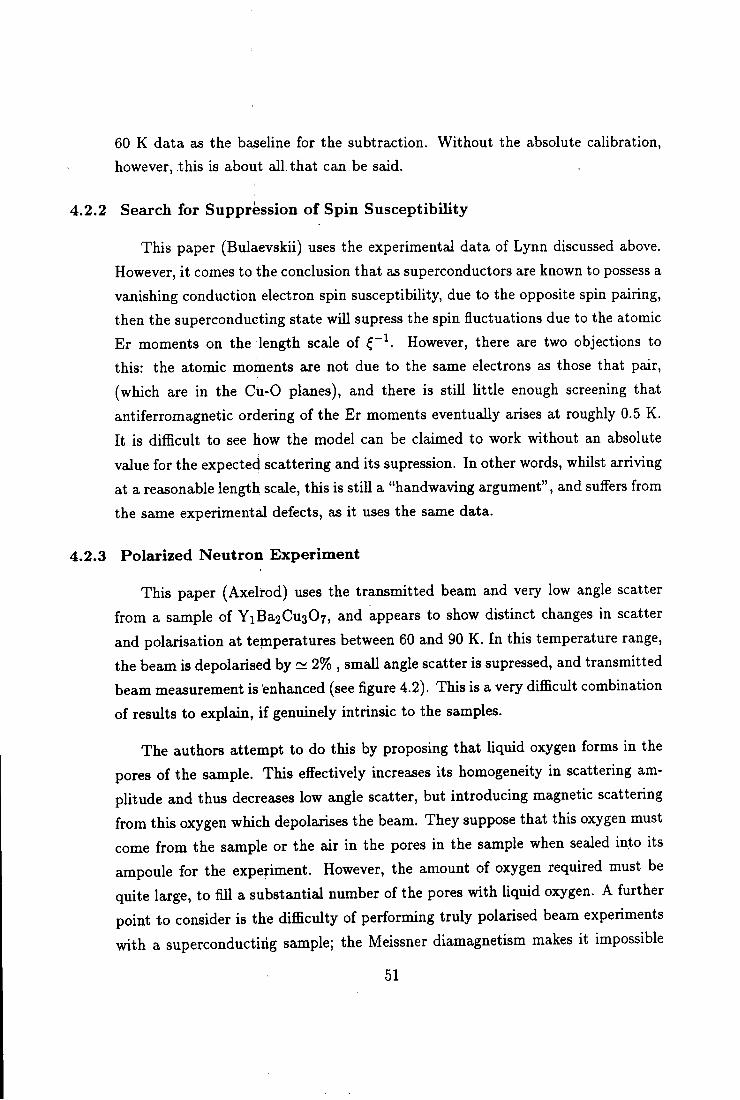
60 K data as the baseline for the subtraction. Without the absolute calibration, however, this is about all that can be said.
4.2.2 Search for Suppression of Spin Susceptibility
This paper (Bulaevskii) uses the experimental data of Lynn discussed above. However, it comes to the conclusion that as superconductors are known to possess a vanishing conduction electron spin susceptibiUty, due to the opposite spin pairing, then the superconducting state will supress the spin fluctuations due to the atomic Er moments on the length scale of However, there are two objections to this: the atomic moments are not due to the same electrons as those that pair, (which are in the Cu-0 planes), and there is stiU little enough screening that antiferromagnetic ordering of the Er moments eventually arises at roughly 0.5 K. It is difficult to see how the model can be claimed to work without an absolute value for the expected scattering and its supression. In other words, whilst arriving at a reasonable length scale, this is still a "handwaving argument", and suffers from the same experimental defects, as it uses the same data.
4.2.3 Polarized Neutron Experiment
This paper (Axelrod) uses the transmitted beam and very low angle scatter from a sample of YiBa2Cu307, and appears to show distinct changes in scatter and polarisation at temperatures between 60 and 90 K. In this temperature range, the beam is depolarised by ~ 2% , small angle scatter is supressed, and transmitted beam measurement is enhanced (see figure 4.2). This is a very difficult combination of results to explain, if genuinely intrinsic to the samples.
The authors attempt to do this by proposing that Uquid oxygen forms in the pores of the sample. This effectively increases its homogeneity in scattering amplitude and thus decreases low angle scatter, but introducing magnetic scattering from this oxygen which depolarises the beam. They suppose that this oxygen must come from the sample or the air in the pores in the sample when sealed into its ampoule for the experiment. However, the amount of oxygen required must be quite large, to fill a substantial number of the pores with Uquid oxygen. A further point to consider is the difficulty of performing truly polarised beam experiments with a superconducting sample; the Meissner diamagnetism makes it impossible
51
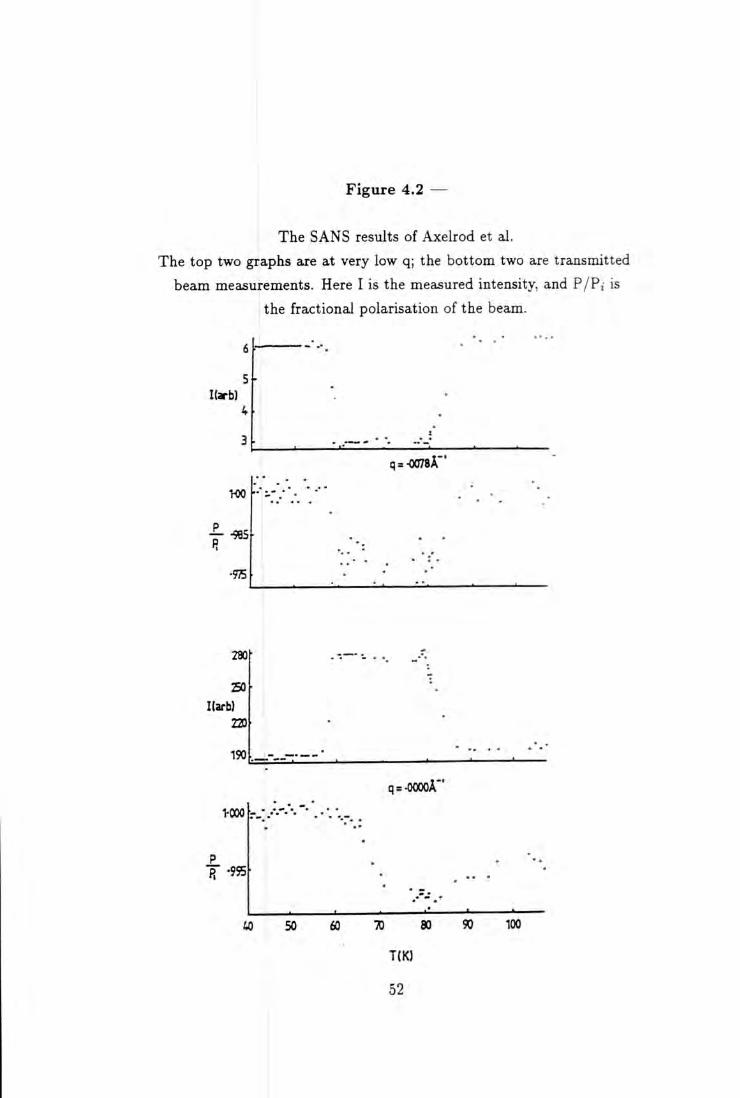
Figure 4.2 —
The SANS results of Axelrod et al. The top two graphs are at very low q; the bottom two are transmitted
beam measurements. Here I is the measured intensity, and P/Pj is the fractional polarisation of the beam.
Ka-b)
MO
•95
280
2S0
Harbl m
190
1-000 r--.'
P J -955
q = -0078A"'
q = .0000A'
M 50 60 X 80
T(K)
52
90 100
to have the necessary small magnetic "guide" field to maintain polarization inside the sample. This problem may not be too severe if the sample is thin.
This possible oxygen condensation mechanism is avoided expHcitly in our experiments by using an evacuated sample space containing the minimum amount of helium gas for the required temperature stability.
4.2.4 Search for Possible Large Scale Structure
This paper (Kahn), is concerned with scattering at small angles at room temperature, of small single crystals of YiBa2Cu306 and YiBa2Cu307. The small angle diffraction is analysed in terms of the dimensions of the misaligned platelets making up the sample; 100 A is the size deduced in the c direction. Also, a peak at extremely low q is ascribed to a possible ordered structure of period 560 ± 50 A in the superconducting sample (YiBa2Cu307). This might be a long-range oxygen ordering in the lattice forming a superstructure.
4.2.5 Conclusion from Previous Experiments
There appears to be no consensus at all upon the low temperature small-angle scattering results or even the interpretation of that data which has been published. At high temperatures there is a possibility of an ordered phase with an extremely large period. This would be at an unobservably small q in our experiments, so I will not mention it further.
53
4.3 Experimental Design
4.3.1 Introduct ion
The typical SANS experiment consists of:-
1. a source of sufficiently monochromatic neutrons,
2. collimators to define the beam,
3. a sample, in some environment (e.g. cryostat),
4. a long sample to detector flight path to allow the detection of small angles of
scatter with reasonable sizes of detector,
5. a beamstop in order to remove unscattered neutrons,
6. a large detector in order to make efficient use of the whole solid angle of scatter
available.
Small angle scattering can be particularly efficient in this last area as all the
relevant scattered intensity can be contained on one multielement detector. At the
I L L in Grenoble, the three instruments that we have used are called D l l , IN5, and
INS, which are briefly described in the sections referring to the individual exper
iments below. Further details of these instruments are contained in the "Yellow
book" produced by the I L L .
4.3.2 Background Scatter ing
Now, a brief discussion of the possible background scattering, which needs to be
eliminated from the signal as measured on the instruments in order to reasonably
interpret the data.
4.3.2.1 B r a g g Scatter ing
In all such experiments it is at least desirable that the total number of back
ground scattering processes available should be minimised. Thus, if possible, the
so-called Bragg cutoff wavelength should be exceeded. This corresponds to a wave
length of incoming neutrons such that the smallest scattering reciprocal lattice vec-
54
tor would need to scatter the neutron at a physically impossible angle. Exceeding
this value would eliminate all Bragg scattering events in the sample, and perhaps
also in the cryostat walls and windows, depending on the relevant materials and
wavelengths. With a finite spread of wavelengths coming from the monochroma-
tor, one must exceed this wavelength by a safety margin to allow for this spread
in incoming wavelength.
With all High Tc ceramic systems, the unit cells are large i.e. c axes are of
order 12 A, so it is impracticable to reach the Bragg cutoff wavelength of 2c with
a reasonable flux froin a cold neutron source at this time. Nevertheless, this might
be considered as a way to make the experiment "cleaner". Thus Bragg scattering
from the sample will be observable in the collected signal, especially at the rather
high angles available on IN5. See figure 4.3. Single Bragg events are however
unimportant as they appear at a well defined angle for a monochromatic incident
beam, ajid are thus easy to reject during the analysis.
4.3.2.2 Phonons
Coherent or incoherent single phonon annihilation or creation is also a possi
bility; however, the phonons disperse rather rapidly. Thus at the relevant q scale
they have rather large energies, and hence small (thermal) populations for neutron
energy gain. They are unavailable for neutron energy loss events, due to the low
incident neutron energy.
Phonons are also much more visible at higher q, as can be seen from the fol
lowing expression for the cross-section for scattering from a phonon (e.g. Squires):-
_fa_ (27r)3 _1. JLe-^d^i'^'^in e,
X {ns)6{L,j - uJs)S{q - k - r )
where d is the nuclear species, s the phonon branch index, VQ the unit cell volume,
Md the nuclear mass, bd the coherent scattering length, d the equilibrium position
of atom d, q is the wavevector transfer, kf the final neutron wavevector, ki the
initial neutron wavevector, k is the phonon wavevector, r is a reciprocal lattice
55
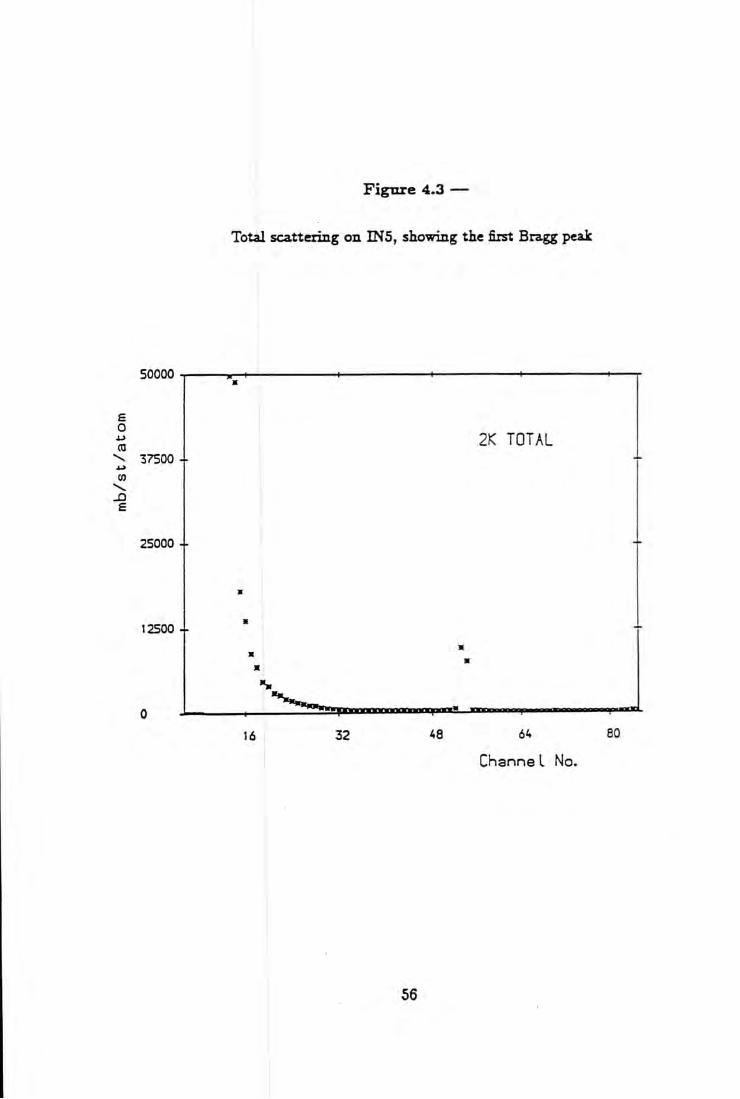
F i g u r e 4.3 —
Total scattering on INS, showing the first Bragg peak
50000
E O i-> m
\ 37500
25000 4-
12500 +
2K TOTAL
16 32 48 64
Channe I No.
eo
56
vector, ui is the energy transfer, Us is the phonon energy, (n^) the Bose factor, and
e~^'^ the Debye-Waller factor.
As can be seen, the phonon cross-section increases as q , and its importance
at low q can thus be estimated from the high angle results on IN5.
4.3.2.3 Mult ip le Bragg Scattering
A more pernicious problem is multiple scattering in the sample by a combi
nation of Bragg reflections and phonons. This combination can allow small net
changes in energy and wavevector, giving a signal apparently in the desired range
of {q,(jLi). In addition, it can have a temperature dependence due to the change in
population factors of the relevant phonons. Multiple phonon + Bragg scattering
should however be at least broad in its energy range due to the extreme averaging
over angles and energies involved.
4.3.2.4 S t r u c t u r a l Changes
Thankfully, there are no major structural changes in YiBa2Cu307, at or
around Tc (David); such changes would introduce extra Bragg reflections and
invalidate the subtraction technique.
4.3.2.5 Other Sources of Scatter
Other sources of noise at low angles include the extreme wings of the direct
beam hitting the detector rather than the beamstop, cryostat scattering, inco
herent scattering from the sample and cryostat, electronic noise in the detector
system (these last two being present at all angles), and the diffuse scatter from the
variations in the bulk structure of the sample due to inclusions, defects, etc.
These show no temperature dependence except possibly due to the change
in transmission of the sample and can be subtracted away using the lowest tem
perature run as a calibration. Any thermally populated collective modes will be
virtually empty if their energy scales are much higher than that of the lowest
temperature available. This use of a low temperature subtraction is, however, not
without problems; the error due to statistics alone is from the total counts, not just
57

those counts remaining after subtraction. The effect of a variation in the sample
transmission on this subtraction must also ba considered.
4.3.3 S u m m a r y
The experimental solutions to these problems are :-
1. The experiments are best performed at low temperatures, in order to have as
few phonons excited as possible.
2. Suitable designs of sample and shielding mask are used, to give the minimum
free path for neutrons scattered at high angles, in order to minimise the amount
of multiple scatter back into the low angle detectors.
3. The incident wavelength used is kept as long as possible in order to keep to a
minimum the number of available Bragg reflections.
4. A further safeguard is to keep the total scattering to a small fraction of the
incident beam, typically less than 5%.
4.4 Calibrations
As an absolute calibration, we can use the incoherent scatter from suitable sam
ples such as vanadium and plexiglas (PMMA). Plexiglas is also used to calibrate
the relative detector efficiency and solid angle viewed by each group of detectors.
These two standards are used because vanadium has a well known absolute cross-
section, dominated by its large incoherent (angle-independent) scattering (4.97
barns/atom). However, vanadium also gives a peak in scattering at low angles, of
uncertain origin. Plexiglas, being amorphous, has no structure at these wavevec-
tors and can thus be used for the relative solid angle and efficiency calculation for
all detector angles. Once calibrated against vanadium it can also be used as a sec
ondary standard, useful because it has a much larger cross-section. This is helpful
in extremely low q work, allowing rapid calibration runs and thus maximising the
available time for the weakly scattering experiment. Care must be taken however,
as plexiglas can absorb water, which is also a strong incoherent scatterer, thus
leading to an error in the scattering as it will change over a long time period.
58
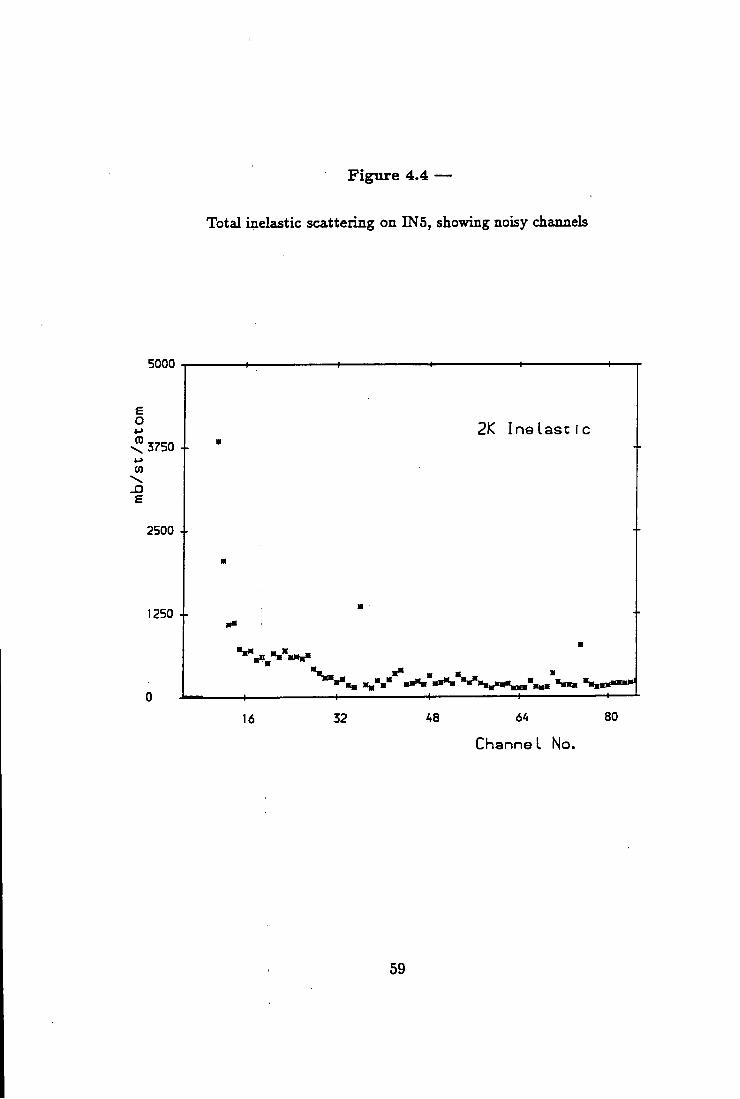
F i g u r e 4.4
Total inelastic scattering on INS, showing noisy channels
5000
£ O 0)
2K I n e L a s t i c 3750 1
\
£
2500 +
1250 +
16 32 48 6A 80
Channe L No.
59
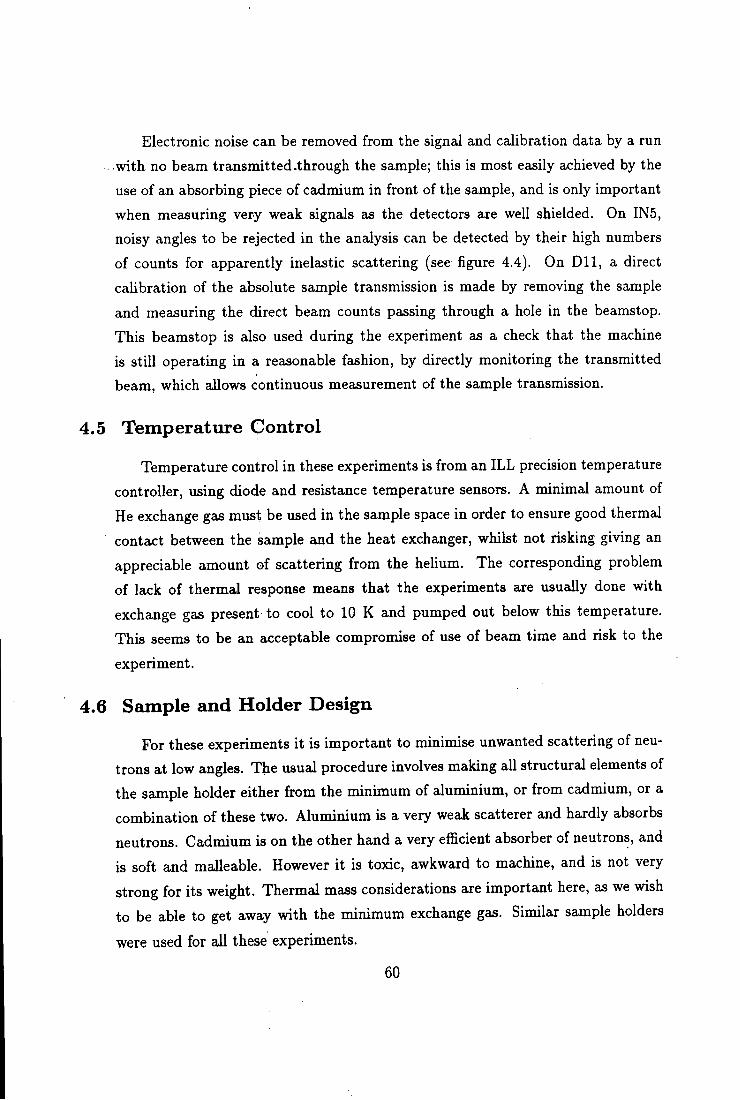
Electronic noise can be removed from the signal and calibration data by a run
with no beam transmitted .through the sample; this is most easily achieved by the
use of an absorbing piece of cadmium in front of the sample, and is only important
when measuring very weak signals as the detectors are well shielded. On IN5,
noisy angles to be rejected in the analysis can be detected by their high numbers
of counts for apparently inelastic scattering (see figure 4.4). On D l l , a direct
calibration of the absolute sample transmission is made by removing the sample
and measuring the direct beam counts passing through a hole in the beamstop.
This beamstop is also used during the experiment as a check that the machine
is still operating in a reasonable fashion, by directly monitoring the transmitted
beam, which allows continuous measurement of the sample transmission.
4.5 Temperature Control
Temperature control in these experiments is from an I L L precision temperature
controller, using diode and resistance temperature sensors. A minimal amount of
He exchange gas must be used in the sample space in order to ensure good thermal
contact between the sample and the heat exchanger, whilst not risking giving an
appreciable amount of scattering from the heUum. The corresponding problem
of lack of thermal response means that the experiments are usually done with
exchange gas present to cool to 10 K and pumped out below this temperature.
This seems to be an acceptable compromise of use of beam time and risk to the
experiment.
4.6 Sample and Holder Design
For these experiments it is important to minimise unwanted scattering of neu
trons at low angles. The usual procedure involves making all structural elements of
the sample holder either from the minimum of aluminium, or from cadmium, or a
combination of these two. Aluminium is a very weak scatterer and hardly absorbs
neutrons. Cadmium is on the other hand a very efficient absorber of neutrons, and
is soft and malleable. However it is toxic, awkward to machine, and is not very
strong for its weight. Thermal mass considerations are important here, as we wish
to be able to get away with the minimum exchange gas. Similar sample holders
were used for all these experiments.
60
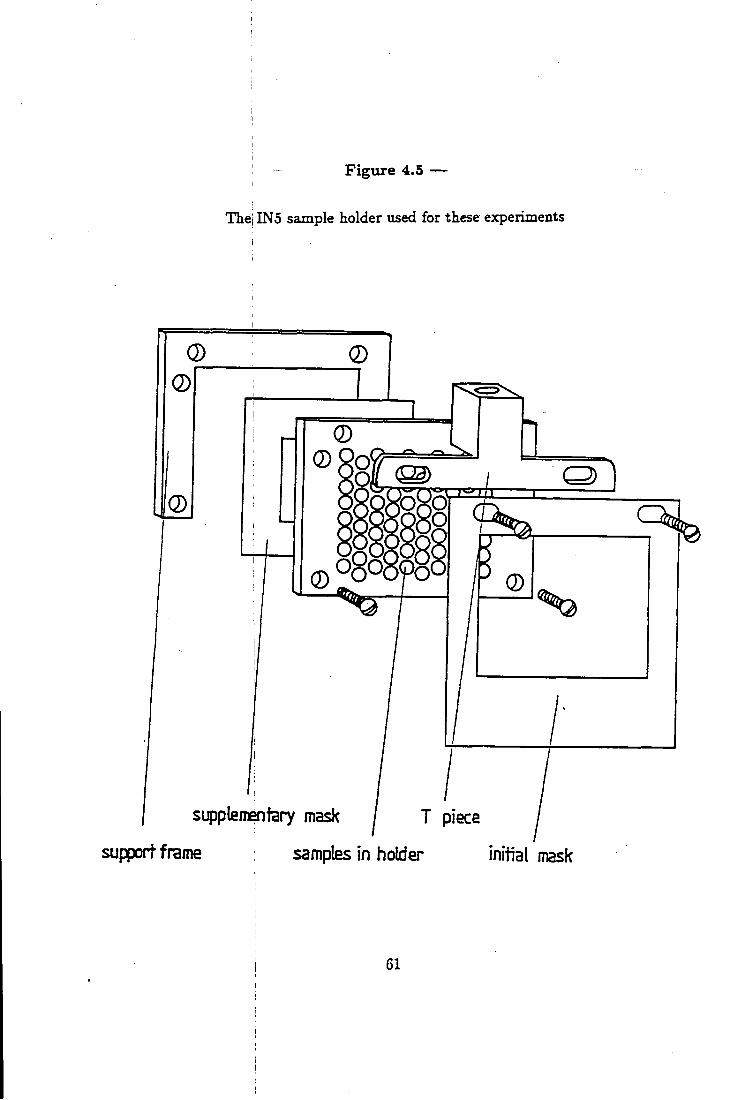
F i g u r e 4.5 —
Thei INS sample holder used for these experiments
DXO
supplemeniary mask j T piece
support frame samples in holder initial mask
61
The sample discs, as described in chapter II , are held in a cadmium sheet of
equal thickness, in holes just big enough to allow them, to slip in. These holes are
pre-drilled using a drill of nominally the pellet size, then enlarged by the use of a
tapering brass punch to allow the pellets to fit. It is fortunate that cadmium is so
malleable as to allow this rapid adjustment, as the pellets are not really exactly
sized, due to the nature of the production technique. Space around the sides of
the pellets is only really important in that it is a waste of neutrons, as the sample
transmission is designed to be greater than 95%. However, the samples are only
held in by the pressure from the cadmium walls and thin aluminium foil at the
front and back of the holder. If held too loosely they might fall out, especially when
being loaded into the cryostat with inevitable shaking of the sample stick. This
would mean that there was less sample in the beam; again a waste of neutrons,
and a small error in the experimental calibration would result.
The samples themselves were 3mm diameter pellets, 2mm in thickness, ar
ranged in a hexagonal array with around 1mm of cadmium wall between each
neighbouring pair, (as shown in figure 4.5). This arrangement is to minimise the
path length available for a second scattering event, to neutrons scattered at high
angles. These events are the most troubling for the multiple scatter into low an
gles, principally due to the large volumes of phase space available at high q. In a
slab geometry, near 90" scatter can be a real problem, principally due to the long
path length available in which a second scattering event can occur.
There is no real advantage in going to much smaller pellet diameters, as the
available path at high angles other than those around 90° will not be much dimin
ished, and there is a considerable amount of trouble in dealing with the production
of large quantities of small pellets. A further consideration is the supply of suitable
dies; 3mm is as small as our supplier can do, and even here there can be problems
due to the abrasive nature of the powder being pressed. Pellets longer than their
diameter will be extremely likely to fracture when removed from the die; if such
shapes are desired, a section cut from a rod formed by other means is probably
the best solution.
This slab of cadmium containing the YiBa2Cu307 is then held on the sample
stick of the cryostat either simply by a bolt through a hole in the top of the
62
cadmium, or in a dedicated adjustable aluminium frame. The latter can permit a
limited amount of movement of the sample, if required. The sample holder shown
above was designed for the 70mm diameter sample space on INS, to enable position
adjustments of the sample to be made without moving the cryostat or lengthening
the sample stick. Extra pieces of cadmium to suitably mask the vanadium and
plexiglas calibration samples are made for each sample holder, as these are not
always the same size as the array of holes for the samples.
63
Chapter V
SANS Studies of YiBa2Cu307_5 - Experiments
5.1 Experiment 1 - D l l
5.1.1 Motivat ion
The primary motivation for this experiment was to see if any of the effects
discussed up to this point in this thesis were visible in real systems. D l l is the
instrument of choice for such screening measurements to see what effects can be
seen at low q, due to its high flux at long wavelengths and excellent coUimation.
5.1.2 Descr ipt ion of D l l
D l l is a standard design of small angle scattering instrument. It uses a single
circular multidetector, of nominally 64 x 64 cells, to detect the scattered neutrons.
D l l ' s great strength is the large flux of cold neutrons available, permitting delicate
and diflScult experiments. The incoming neutron wavelength is chosen using a
helical slit velocity selector, at a fixed resolution (10 % for our experiments). The
fact that there are no other moving parts in the experiment is a great advantage,
as this means that there is no worry about the reproducibiUty of each run. A
schematic diagram of D l l is shown in figure 5.1. The detector can be moved in its
vacuum pipe up to 40 metres from the sample position, to allow a variable coverage
of q space and adjustable q resolution. The incoming collimation can also both be
varied, with the end of the neutron guide tube positioned 2.5m, 5m, 10m, 20m, or
40m from the sample space, though it is usually matched to the detector distance
used. Note that this is not necessarily the best way to use the instrument.
Rings of multidetector elements are summed together for data analysis pur
poses. Each of these rings receives neutrons scattered by a constant angle, which
can be scattered elasticaily or inelastically. Thus, as there is no energy reso
lution, each angle of D l l integrates over parabolic "constant scattering angle"
curves through (q,a;) space. Figure 5.2 shows such paths for the configuration
64
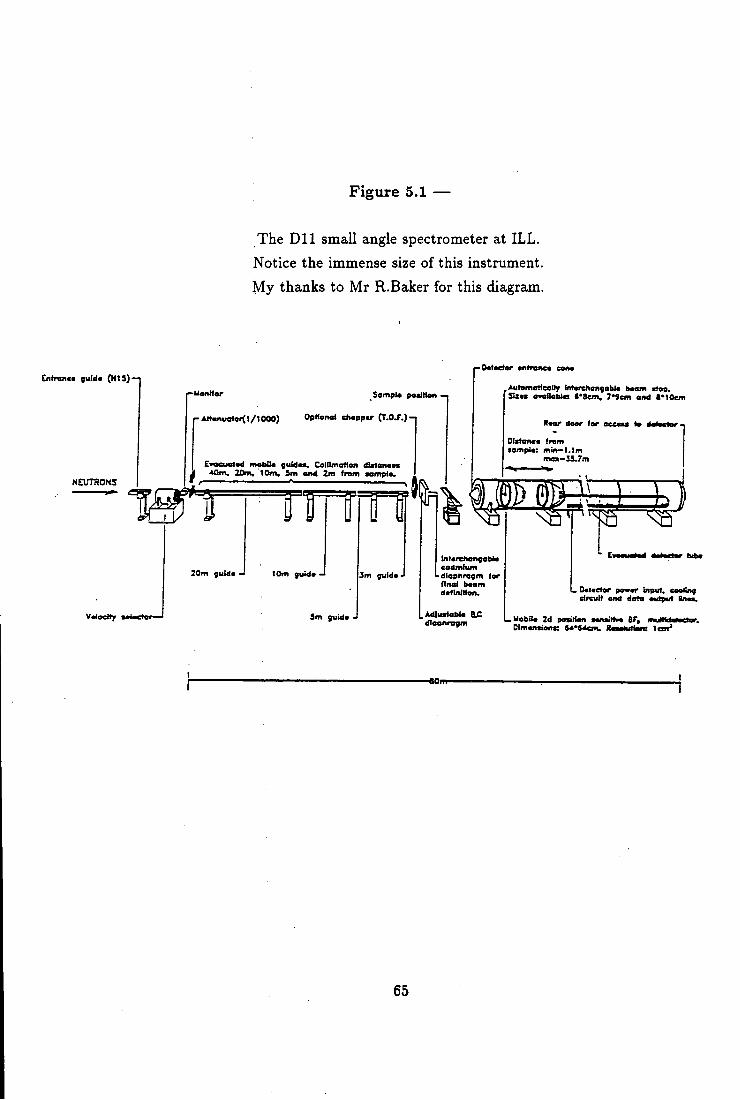
Figure 5.1 —
The D l l small angle spectrometer at I L L . Notice the immense size of this instrument. My thanks to Mr R.Baker for this diagram.
Cntranc* guid* (H13}-<
NEUTRONS
rUanitar Sampl* podHan
Al««.uotor<) /1000) OpHofKri ehappir ( T . O J . ) - .
Eneuetad ntoMa guldcm. Cainmatlan dbtoncM *am. 20m, 10m. 5m and 2m f rem ssmpla.
20m gtild* J 10m (u id* -J
Sm guid*
3m 9uld*
f-0«l«eier •ntrane* C O M
AulsmsDeally tn tmhangeb l« brcm t top. S i zn owf lobUj »«8em, 7«»em end f t O e m
R n r door far secos tm t^metzr
Dlstoncs from tampla: m i n - l . l m
m<n>-13.7m
cadmium diaphragm far final baam dafinlMan.
AdIuxtabU ELC dlaphraym
Datactar pawar Input, eaaCng d m l t and data autput Bnaa.
L u a b i l a 2d paxiHan taraJtiw BF, imdHd^aUui. Olmanxiani: Ut*em. flualiit^ I s n '
65
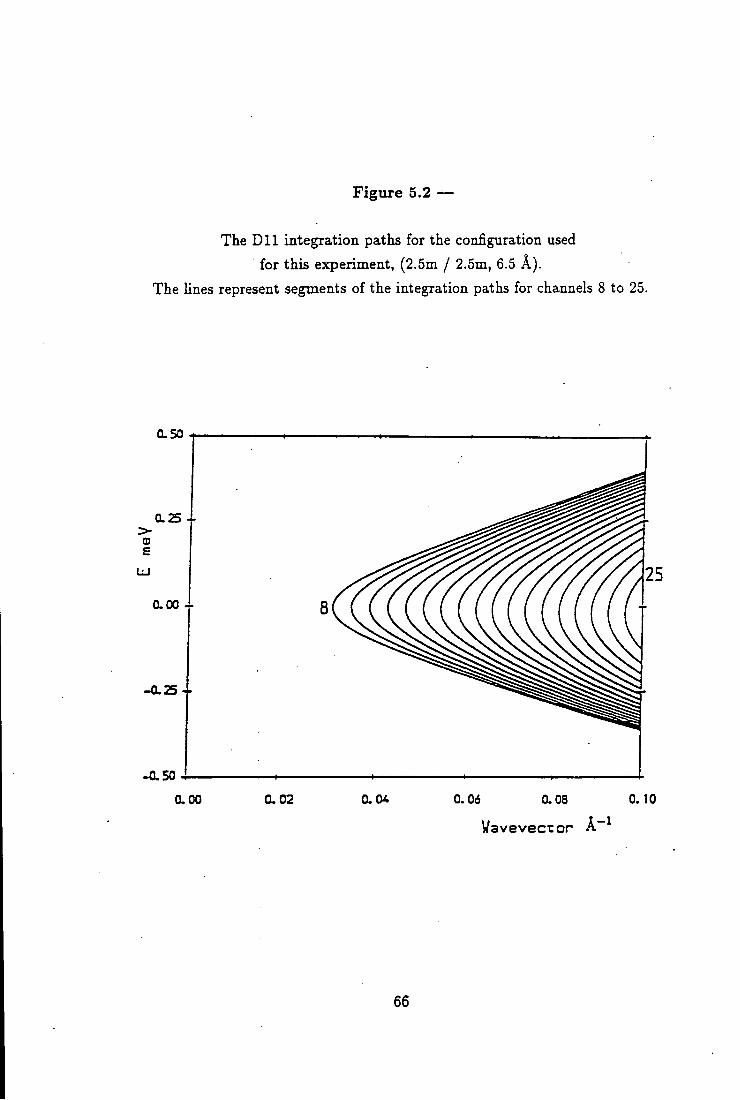
F i g u r e 5.2 —
The D l l integration paths for the configuration used for this experiment, (2.5m / 2.5m, 6.5 A).
The lines represent segments of the integration paths for channels 8 to 25.
0.50
0 . S 4-(D £
0.00 4-
-a2S +
^ 5 0
0.00 0.02 0.04 0.06 0.08 0.10
Wavevec tor
66
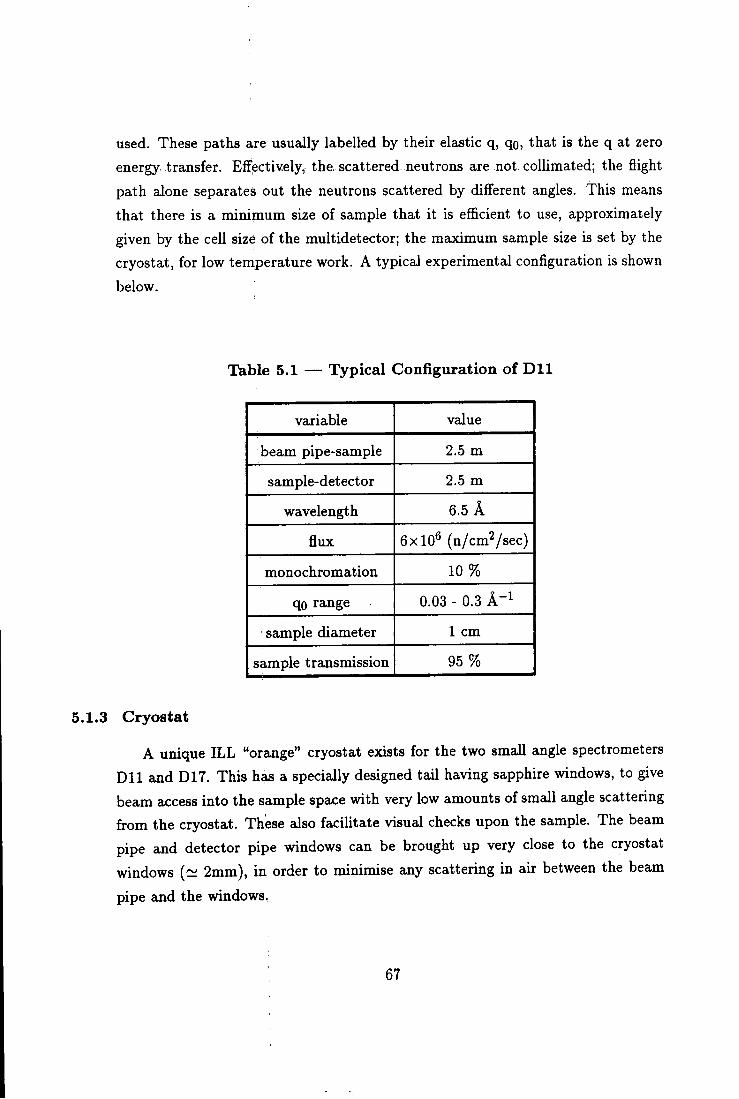
used. These paths are usually labelled by their elastic q, qo, that is the q at zero
energy transfer. Effectively, the scattered neutrons are not coUimated; the flight
path alone separates out the neutrons scattered by different angles. This means
that there is a minimum size of sample that it is efficient to use, approximately
given by the cell size of the multidetector; the maximum sample size is set by the
cryostat, for low temperature work. A typical experimental configuration is shown
below.
Table 5.1 — T y p i c a l Configuration of D l l
variable value
beam pipe-sample 2.5 m
sample-detector 2.5 m
wavelength 6.5 A flux 6x10^ (n/cmVsec)
monochromation 10%
qo range 0.03 - 0.3
sample diameter 1 cm
sample transmission 95 %
5.1.3 C r y o s t a t
A unique I L L "orange" cryostat exists for the two small angle spectrometers
D l l and D17. This has a specially designed tail having sapphire windows, to give
beam access into the sample space with very low amounts of small angle scattering
from the cryostat. These also facilitate visual checks upon the sample. The beam
pipe and detector pipe windows can be brought up very close to the cryostat
windows (~ 2mm), in order to minimise any scattering in air between the beam
pipe and the windows.
67
5.1.4 E x p e r i m e n t a l Detai l s
D l l was used with 2.5m / 2.5m coUimation and the special D l l cryostat as
described above. Seven 3mm diameter pellets of YiBa2Cu307 in an array of holes
giving an effective sample diameter of 1cm were used, in a cadmium slab sample
holder very similar to that described in chapter IV. An incident wavelength of 6.5
A was chosen as a balance between the highest flux available, and the need to
limit the number of available Bragg scattering processes to cut down the sample
background. Calibration was performed against vanadium and plexiglas standard
scatterers. The results are shown at various elastic wavevectors qo as a function
of temperature. As usual, the 2 K values have been subtracted to remove the low
angle "metallurgical" scattering.
5.2 Results
5.2.1 C o m m e n t
The data show two main features. Both are substantially stronger at the lowest
q's. The first and most obvious feature is excess scattering at and in the imme
diate vicinity of Tc , of around 150 mb/sr/atom at q = 0.03 A~^. This appears
to be arising just above Tc. This strongly suggests that it is connected with the
superconducting transition. In addition, effects that are not connected to the su
perconducting transition can be ruled out by the fact that higher temperatures
appear closely to self-subtract. This self subtraction is best at the lowest q where
phonon effects are expected to be small, and this is also where the strongest effects
at Tc appear. This means that simple phonon scattering effects cannot be in
voked to explain the increase at the higher temperatures over the low temperature
scattering; only rather complex changes in the phonon spectrum could give such
effects.
68
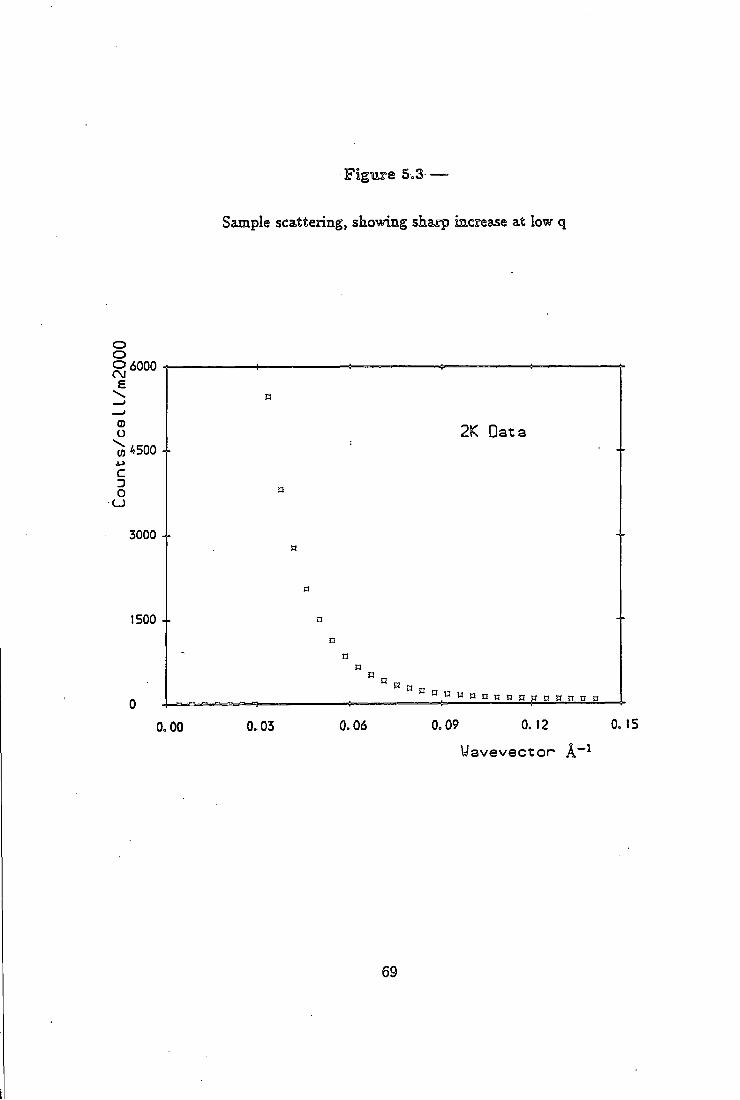
5=3 —
Sample scattering, showing sharp increase at low q
o
O6000 £
O
CO
c D o
4500 4-
3000 4-
1500 4-
0.00
2K D a t a
0.03
Ban
0.06 0.09 0.12 0.15
W a v e v e c t o r A~^
69
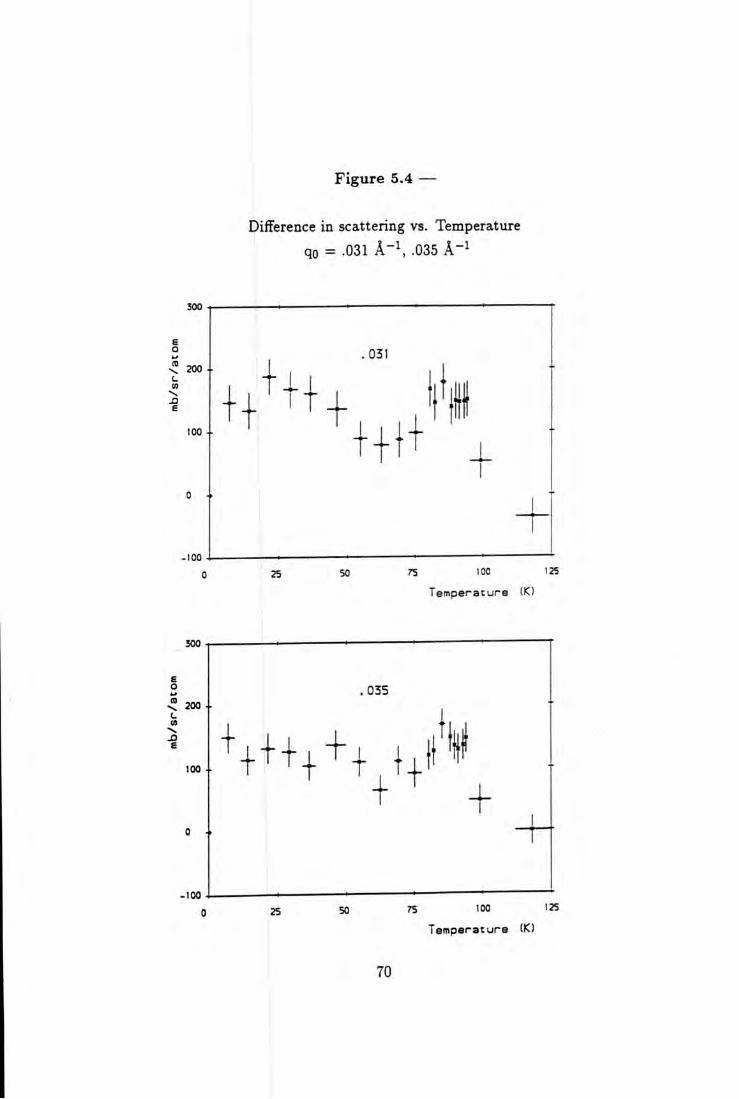
Figure 5.4
Difference in scattering vs. Temperature
qo = .031 k - \ .035 A-^
HI
-100
25 50 75 100 125
Temperature (K)
-O e
25 50 7S 100 125
Temperature (K)
70
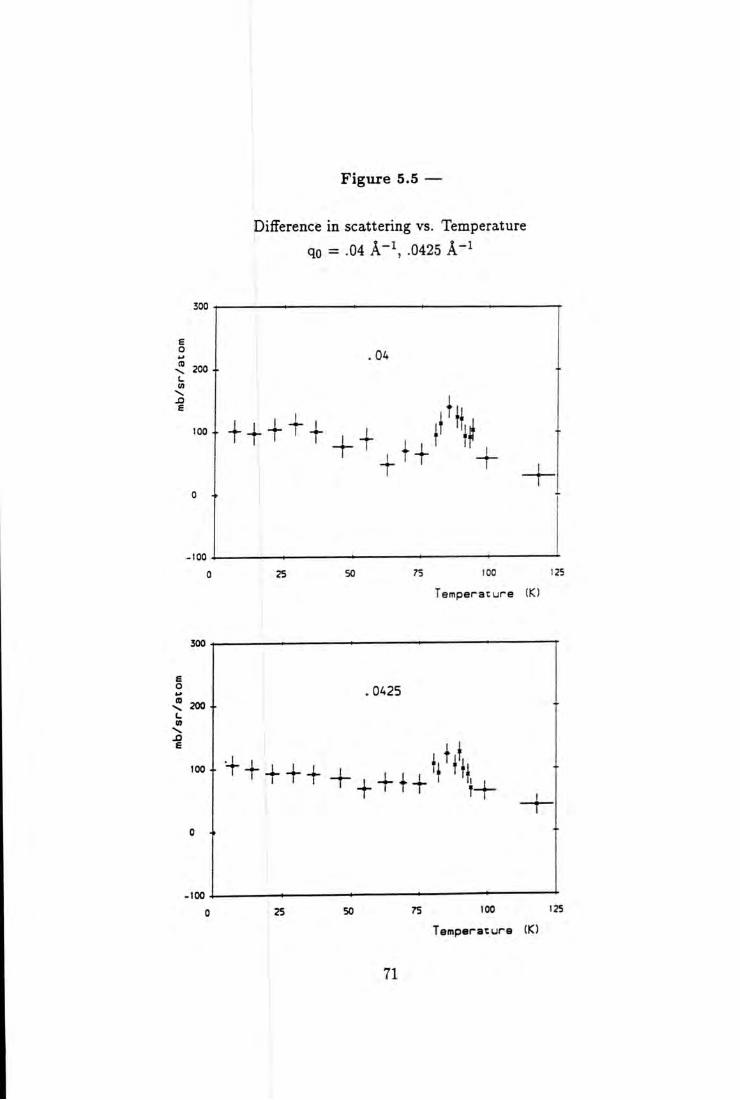
Figure 5.5 —
Difference in scattering vs. Temperature
qo = .04 A - \ .0425 A"^
25 50 75 100 125
Temperature (K)
+ + + + + + 4 . + H'*
25 50 75 100 125
Temperature (K)
71
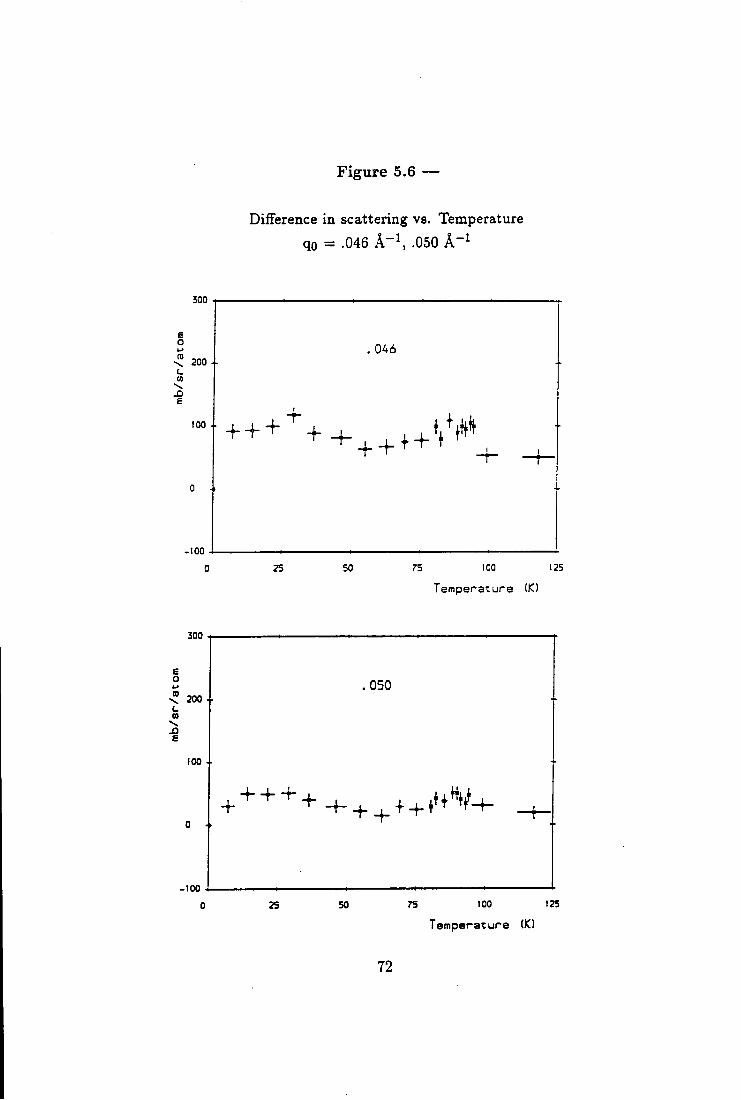
Figure 5.6 —
Difference in scattering vs. Temperature qo = .046 A - ^ .050 A"^
300
75 ICO 125
Temperature (K)
200 -i-
100 +
75 100 125
Temperature (K)
72
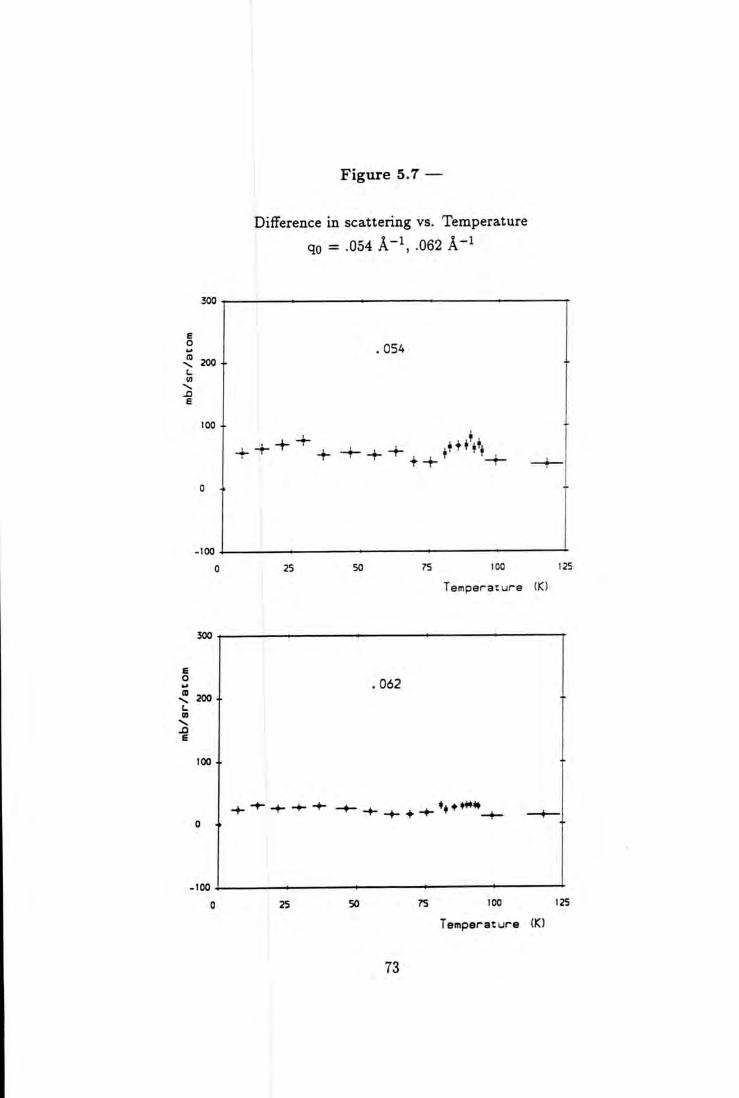
Figure 5.7 —
Difference in scattering vs. Temperature
qo = .054 A - ^ .062 A ' ^
200 4.
100 +
-100
25 50 75 100 125
Temperature (K)
300
25 50 75 100 125
Temperature (K)
73
5.3 Experiment 2 - INS
5.3.1 Motivation
In order to see whether we could confirm and extend this result, IN3 was
used to measure in the same region of q but confining the signal detected to a
single energy transfer, at the elastic position. This experiment also set out to see
whether a small magnetic field, (1.5 mT), would significantly change the result.
The result remaining unchanged would rule out explanations involving scattering
from flux lines introduced into the sample, as this would be expected to be radically
increased.
5.3.2 Descriptiom of IN3
This instrument is a standard triple axis spectrometer (TAS). See figure 5.8.
The great strength of such machines is their ability to examine a single well defined
portion of (q,a;) space with a relatively high flux and resolution. This enables them
to perform experimental scans along straiight lines in (q,w) space, making interpre
tation of the results more tractable. IN3 is situated on a thermal neutron beam,
and loses greatly in flux at 5.5 A, compared to a cold neutron beam instrument
such as IN12. IN3 was used solely because it is much easier to obtain experimental
time on this instrument.
5.3.3 Cryostat
A standard ILL "orange" cryostat with a large diameter sample tail was used, as in order to gain as much signal as possible it is necessary to use the whole size of the beam, (of order of 6 x 3 cm). This ruled out using the D l l cryostat for this experiment, as its sapphire windows are only 25mm in diameter. Standard TAS Helmholtz coils fit onto the supports of these cryostats in order to provide a magnetic field of 0 - 1.5 mT at the sample position. These coils are normally used for experiments using polarisation analysis.
5.3.4 Prittciple of Operatioe of a Triple Axis Spectirometeff
A triple axis spectrometer works by controlling the neutron beam by Bragg
reflection from suitable high quality crystals of controlled mosaic spread. The
74
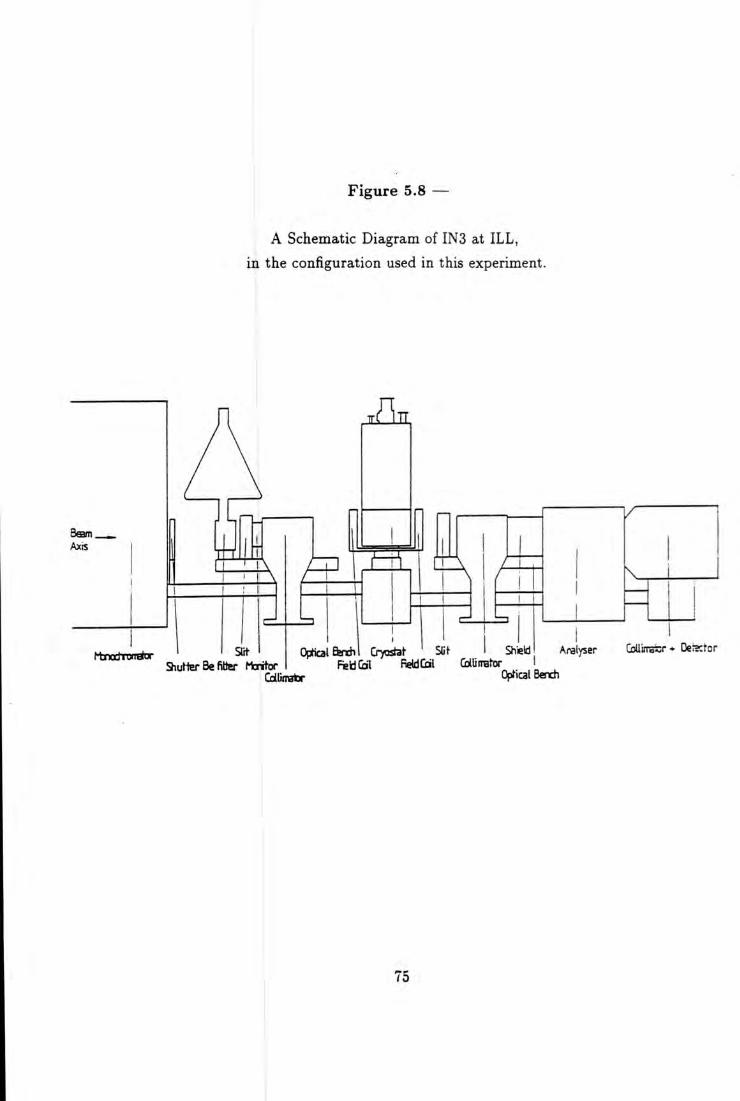
Figure 5.8 —
A Schematic Diagram of INS at ILL, in the configuration used in this experiment.
Optol&xh Siutter Be fitter Mciitor
Cdlimatr FbUCoI ReidCdl CdHmtor
Analyser CoUinojir- Oeisctor
Opfical B«xh
75
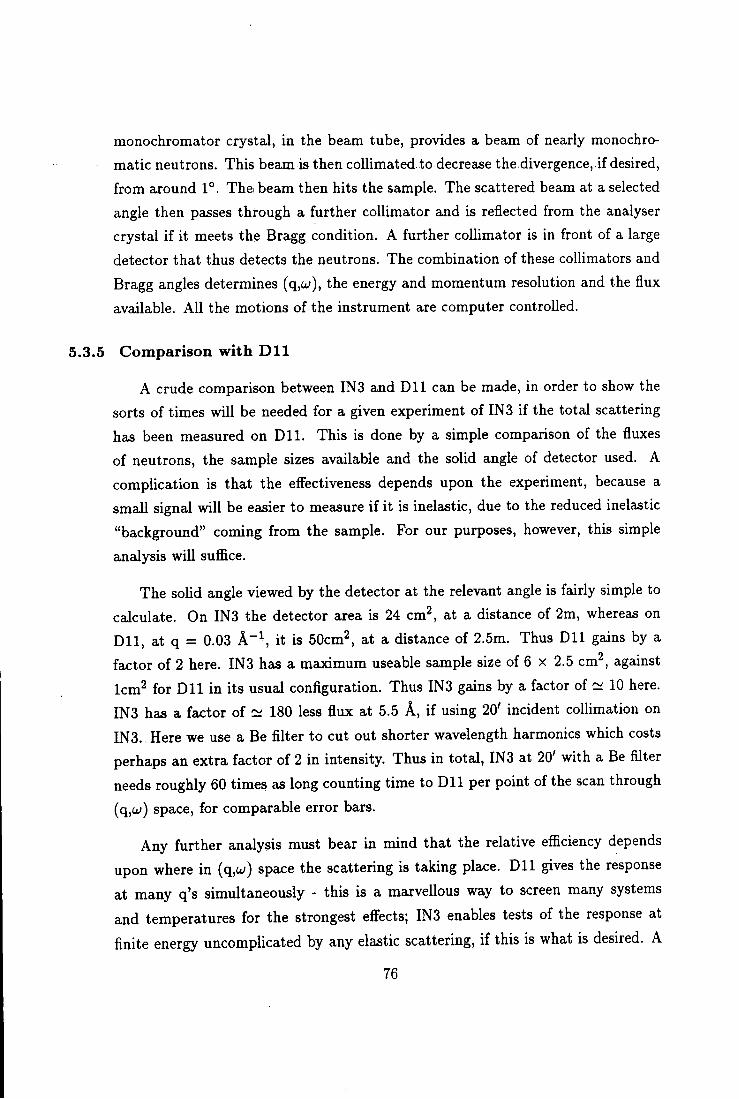
monochromator crystal, in the beam tube, provides a beam of nearly monochromatic neutrons. This beam is then colUmated to decrease the.divergence,.if desired, from around 1°. The beam then hits the sample. The scattered beam at a selected angle then passes through a further collimator and is reflected from the analyser crystal i f it meets the Bragg condition. A further coUimator is in front of a large detector that thus detects the neutrons. The combination of these collimators and Bragg angles determines (q,u;), the energy and momentum resolution and the flux available. Al l the motions of the instrument are computer controlled.
5.3.5 Comparison with D l l
A crude comparison between IN3 and D l l can be made, in order to show the sorts of times will be needed for a given experiment of IN3 i f the total scattering has been measured on D l l . This is done by a simple comparison of the fluxes of neutrons, the sample sizes available and the solid angle of detector used. A complication is that the effectiveness depends upon the experiment, because a small signal will be easier to measure i f i t is inelastic, due to the reduced inelastic "background" coming from the sample. For our purposes, however, this simple analysis will suflSce.
The soUd angle viewed by the detector at the relevant angle is fairly simple to calculate. On IN3 the detector area is 24 cm^, at a distance of 2m, whereas on D l l , at q = 0.03 A~^, it is 50cm' , at a distance of 2.5m. Thus D l l gains by a factor of 2 here. IN3 has a maximum useable sample size of 6 x 2.5 cm^, against Icm^ for D l l in its usual configuration. Thus INS gains by a factor of ~ 10 here. IN3 has a factor of ~ 180 less flux at 5.5 A, i f using 20' incident coUimation on IN3. Here we use a Be filter to cut out shorter wavelength harmonics which costs perhaps an extra factor of 2 in intensity. Thus in total, IN3 at 20' with a Be filter needs roughly 60 times as long counting time to D l l per point of the scan through (q,a;) space, for comparable error bars.
Any further analysis must bear in mind that the relative eflBciency depends
upon where in (q,w) space the scattering is taking place. D l l gives the response
at many q's simultaneously - this is a marvellous way to screen many systems
and temperatures for the strongest effects; IN3 enables tests of the response at
finite energy uncomplicated by any elastic scattering, if this is what is desired. A
76
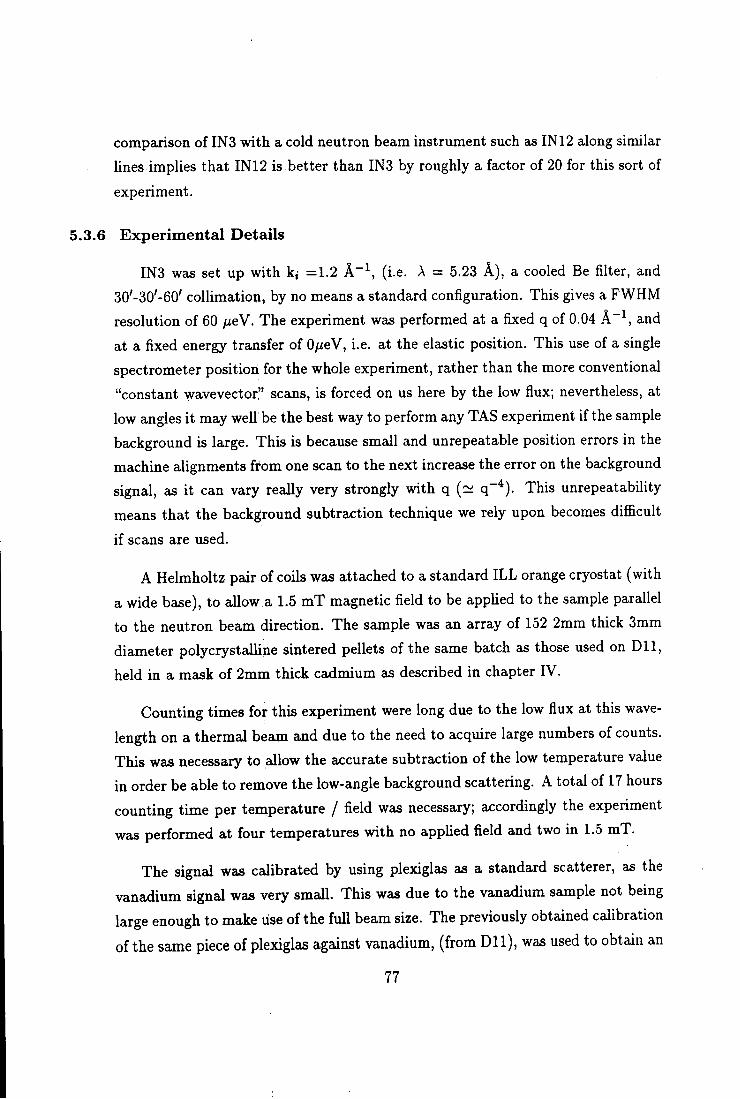
comparison of INS with a cold neutron beam instrument such as IN12 along similar
lines implies that IN12 is better than INS by roughly a factor of 20 for this sort of
experiment.
5.3.6 Experimental Details
INS was set up with =1.2 A ~ \ (i.e. A = 5.2S A) , a cooled Be filter, and
30'-S0'-60' coUimation, by no means a standard configuration. This gives a FWHM
resolution of 60 /xeV. The experiment was performed at a fixed q of 0.04 A ~ \ and
at a fixed energy transfer of 0/zeV, i.e. at the elastic position. This use of a single
spectrometer position for the whole experiment, rather than the more conventional
"constant wavevector" scans, is forced on us here by the low flux; nevertheless, at
low angles i t may well be the best way to perform any TAS experiment if the sample
background is large. This is because small and unrepeatable position errors in the
machine alignments from one scaji to the next increase the error on the background
signal, as it can vary really very strongly with q (~ q~*). This unrepeatability
means that the background subtraction technique we rely upon becomes difficult
i f scans are used.
A Helraholtz pair of coils was attached to a standard ILL orange cryostat (with a wide base), to allow a 1.5 mT magnetic field to be appUed to the sample parallel to the neutron beam direction. The sample was an array of 152 2mm thick 3mm diameter polycrystalline sintered pellets of the same batch as those used on D l l , held in a mask of 2mm thick cadmium as described in chapter IV.
Counting times for this experiment were long due to the low flux at this wave
length on a thermal beam and due to the need to acqmre large numbers of counts.
This was necessary to allow the accurate subtraction of the low temperature value
in order be able to remove the low-angle background scattering. A total of 17 hours
counting time per temperature / field was necessary; accordingly the experiment
was performed at four temperatures with no applied field and two in 1.5 mT.
The signal was calibrated by using plexiglas as a standard scatterer, as the
vanadium signal was very small. This was due to the vanadium sample not being
large enough to make lise of the ful l beam size. The previously obtained calibration
of the same piece of plexiglas against vanadium, (from D l l ) , was used to obtain an
77
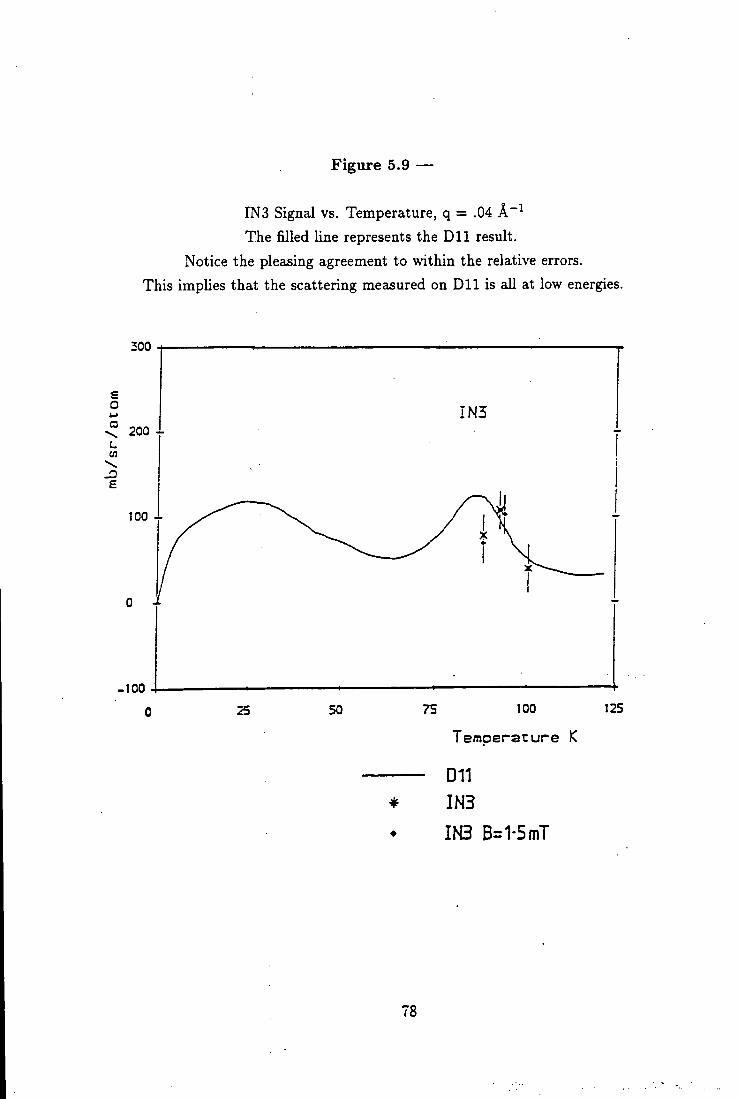
Figure 5.9 —
IN3 Signal vs. Temperature, q = .04 A~^ The filled line represents the D l l result.
Notice the pleasing agreement to within the relative errors. This implies that the scattering measured on D l l is all at low energies.
300
50 75 100 125
Temoerarure K
D11 IN3
m B=1-5mT
78
absolute calibration. In addition it would be difficult to calibrate with vanadium well at this low q, given that we can only do this at rather higher q and this means that the spectrometer is then in a different configuration from that used during the experiment.
5.3.7 Results
The results are shown in figure 5.9 and may be simply compared with the D l l data, with the D l l data shown as a filled line. The pleasing agreement with D l l both in shape and to within the relative calibration error implies that all the scattering on D l l is elastic, i.e. within 30 yaeV of zero. This is a good confirmation of the D l l data as it involves a different type of spectrometer and cryostat, implying that the signal must be from the only common element, the samples.
In addition the failure of an applied field of 1.5 mT significantly to change the
scattering implies that the scattering is unlikely to be from flux lines within the
sample.
79
5o4 Experiment 3 ° INS
5.4.1 DescriptioB off IN:5
IN5 is a time of flight inelastic scattering spectrometer with an exceptional variety of uses, due to its ability to be adjusted to suit the experiment at hand. It measures the times of arrival of scattered neutrons at many fixed angles simultaneously; the time of flight of the neutrons reveals their energy, and the combination of time and angle their wavevector. Each detector angle behaves rather like D l l , giving a constant scattering angle "scan" through (q,u>) space (figures 5.11 and 5.12). Each segment of time of the time of flight, or bin, represents a small element of this path. The flight path of the neutrons after the cryostat is 3.997 metres, through a box filled with argon to reduce the scatter inside the box. Detectors are grouped in rings and arcs for the purposes of data collection, each at a constant angle, and are available from 1.7° to 128.7°. See figure 5.10.
The strength of the machine is its multiple chopper monochromator, consisting of four rotating discs, with neutron windows allowing the beam to pass through at certain angles. The velocity and relative phases of the choppers determine the energy resolution and the wavelength of the incident beam. A high velocity gives a high resolution at no direct cost in flux as the pulses of neutrons, though narrower, arrive more often. The reduced time between pulses, falling with increasing chopper speed, means that events which scatter by large energies can arrive either with the previous or next pulse's scattered neutrons. This problem is called frame overlap. To allow the user to choose what range of energy to examine, and in order to minimise this problem, one of the choppers may run at an integer fraction of the speed of the others, cutting out all but this fraction of the pulses. This does cost in flux, obviously, so the apparent higher resolution for no cost in flux is at least in part illusory.
Another advantage of this collimation / monochromation system as opposed to other systems is that it allows study at relatively low q. The q range available depends on the wavelength chosen, but is at least comparable with D l l at 2.5 metres colUmation, for similar incident wavelengths. This is reasonable, given that larger samples are a necessity on IN5 due to the cost in flux of the high degree of monochromation and the pulsing of the beam required.
80
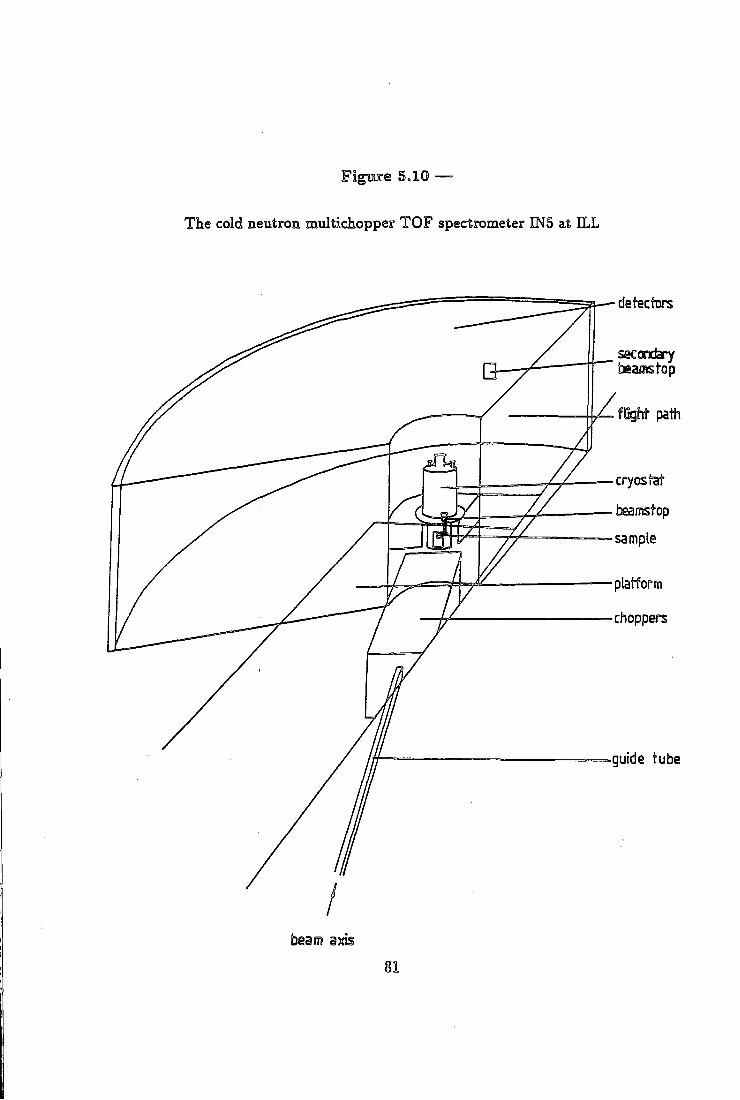
5.10 —
The cold neutron multichopper TOF spectrometer INS at ILL
detectors
secorafary beai^top
fGght patti
cryosrat
tonstop Z
choppers
guide tube
beam axis
81
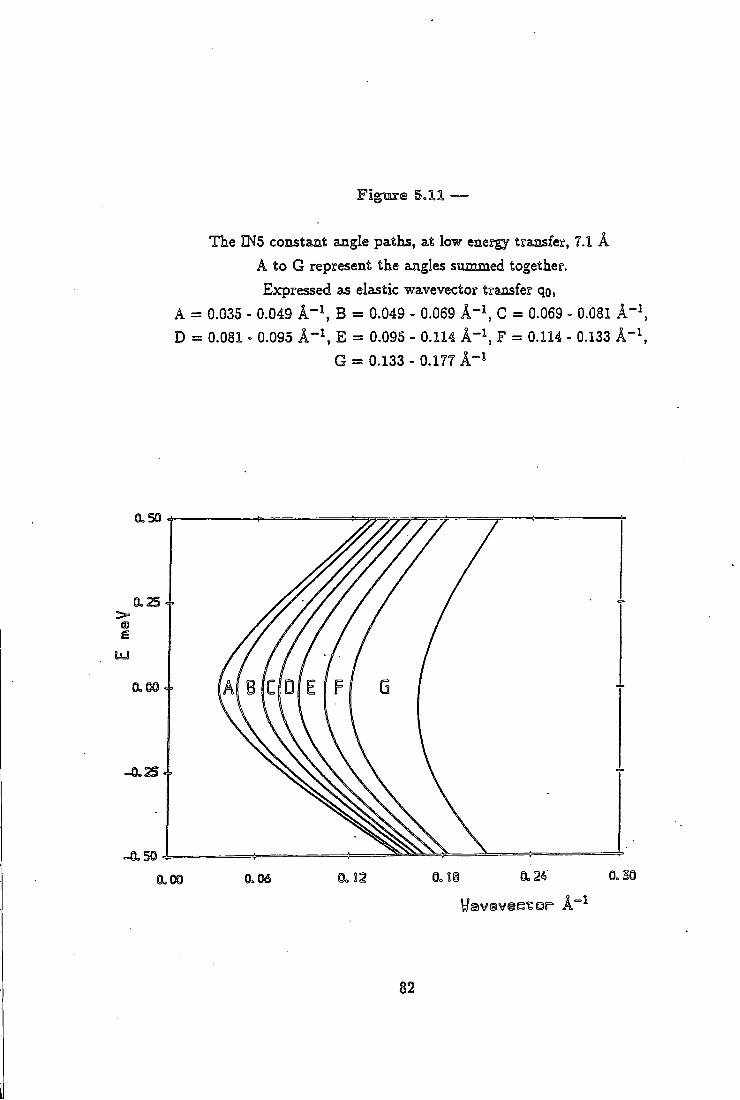
.11 —
The INS constant angle paths, at low energy transfer, 7.1 A A to G represent the angles summed together. Expressed as elastic wavevector transfer qo,
A = 0.035 - 0.049 A - ^ B = 0.049 - 0.069 A - ^ C = 0.069 - 0.081 A-\ D = 0.081 - 0.095 A - ^ E = 0.095 - 0.114 F = 0.114 - 0.133 A ' ^
G = 0.133 - 0.177 A - ^
82
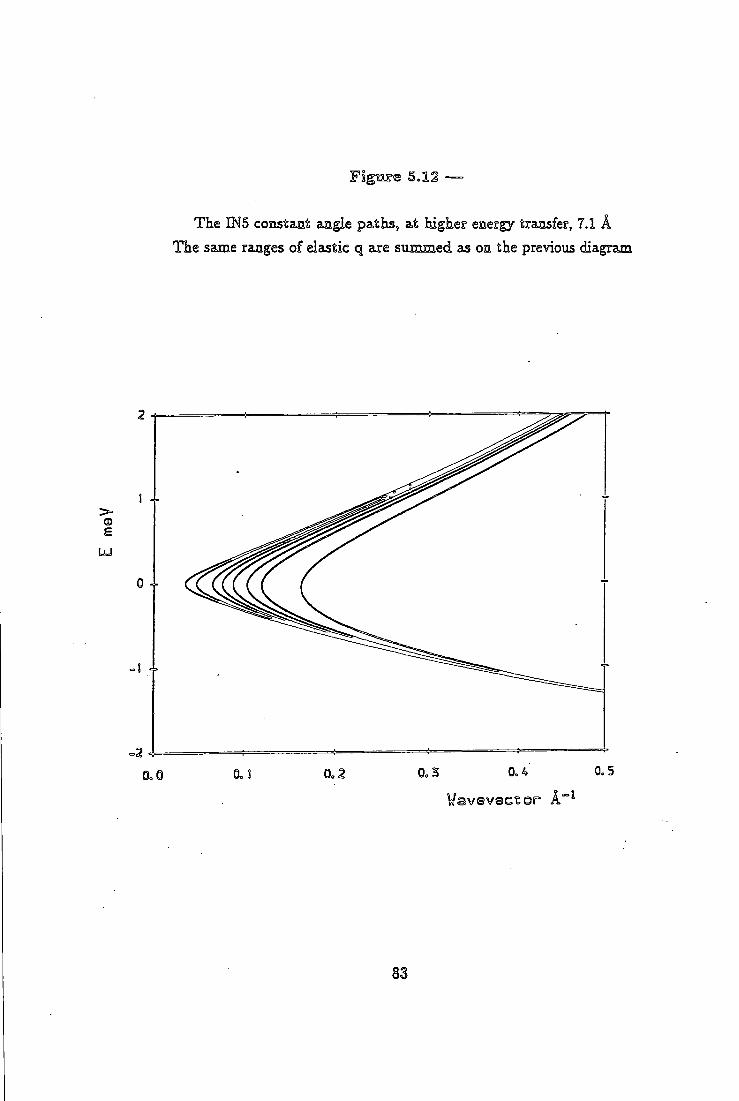
Flgm-e 5.12 —
The INS constant angle paths, at higher energy transfer, 7.1 A The same ranges of elastic q are summed as on the previous diagram
s UJ
0.4 0.5
Wavevector A~
83
5.4.2 Cryostat
There are two cryostats dedicated to the instruments IN5 and IN6. Whilst maintaining the method of operation of the ILL orange cryostat, each has an especially large sample space in order to make Bragg reflections from the cryostat walls arrive at the detectors with suitably large times of flight, due to their extra path length. Multiple reflections will of course arrive even later at the detectors. This is especially important for measuring small cross-sections at low angles, due to the possibiUty of multiple scattering apparently being single low (q,u;) events, as discused in chapter FV. These effects should be substantially independent of the sample temperature. Also, as previously discussed, the He exchange gas must be kept to a minimum - however, as each individual counting time on IN5 is relatively large, the loss in thermal response speed of the cryostat is less important. Stability of temperature is still important, of course.
5.4.3 Experimented Details
In order to examine large volumes of (q,u;) space at these low values of q, a time-of-flight experiment was performed on IN5. This used 101 pellets of the same batch of sample as D l l in a sample holder as described above. Principally this experiment was to enable an accurate measure of any scattering at low energies with an energy resolution of roughly 100 /zeV. The main configuration conditions of IN5 are summarised below.
5.4.4 Data Reduction
INS poses a series of problems concerned with data reduction and analysis, as the amount of raw data produced is very large. Each run produces approximately 0.5 Mbyte of data. The range of q usefully probed by our experiment does not however cover the whole detector bank due to the heavy shielding of the sample in its holder, which acts as a crude collimator system and removes much of the high angle scatter.
84
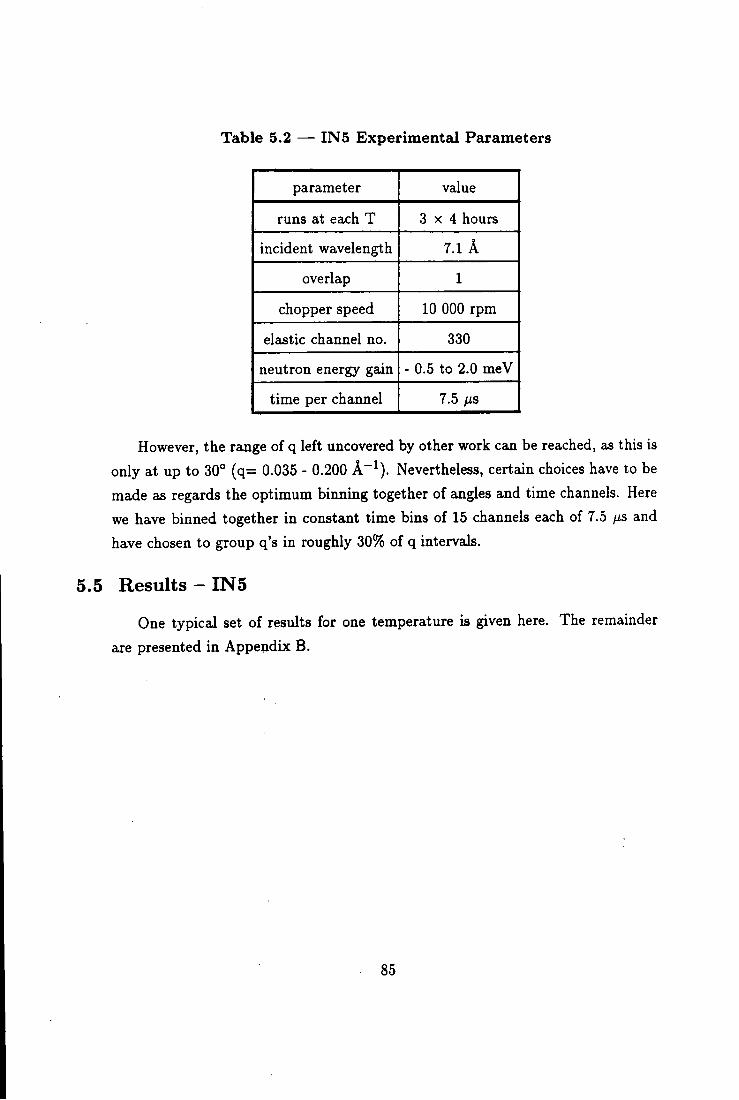
Table 5.2 — IN5 Experimental Parameters
parameter value
runs at each T 3 x 4 hours
incident wavelength 7.1 A
overlap 1
chopper speed 10 000 rpm
elastic channel no. 330
neutron energy gain - 0.5 to 2.0 meV
time per channel 7.5 us
However, the range of q left uncovered by other work can be reached, as this is only at up to 30° (q= 0.035 - 0.200 A~^) . Nevertheless, certain choices have to be made as regards the optimum binning together of angles and time channels. Here we have binned together in constant time bins of 15 channels each of 7.5 fis and have chosen to group q's in roughly 30% of q intervals.
5.5 Results - IN5
One typical set of results for one temperature is given here. The remainder
are presented in Appendix B.
85
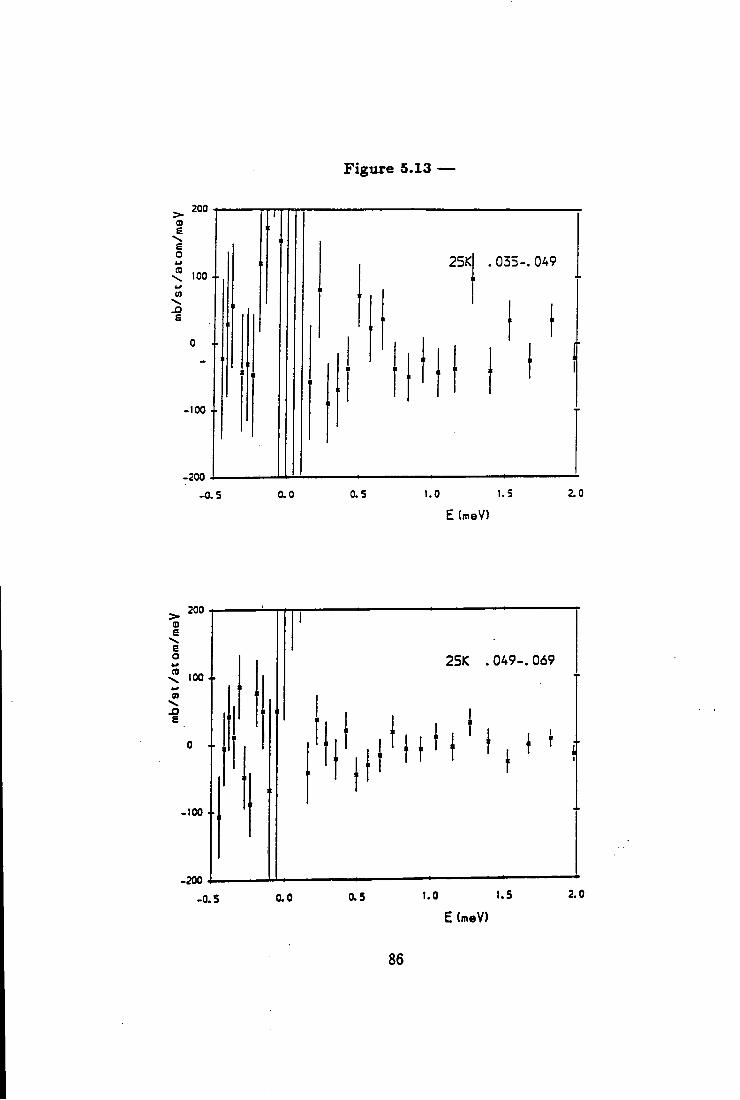
F i g u r e 5.13 —
e £ O
J3 e
200
100 4-
0 +
.100 +
-200
- 0 . 5
25K .035-. 049
0.0 0.5 1.0 1.5 2.0
E (meV)
25K . 049-. 069
100 4-
E (fneV)
86
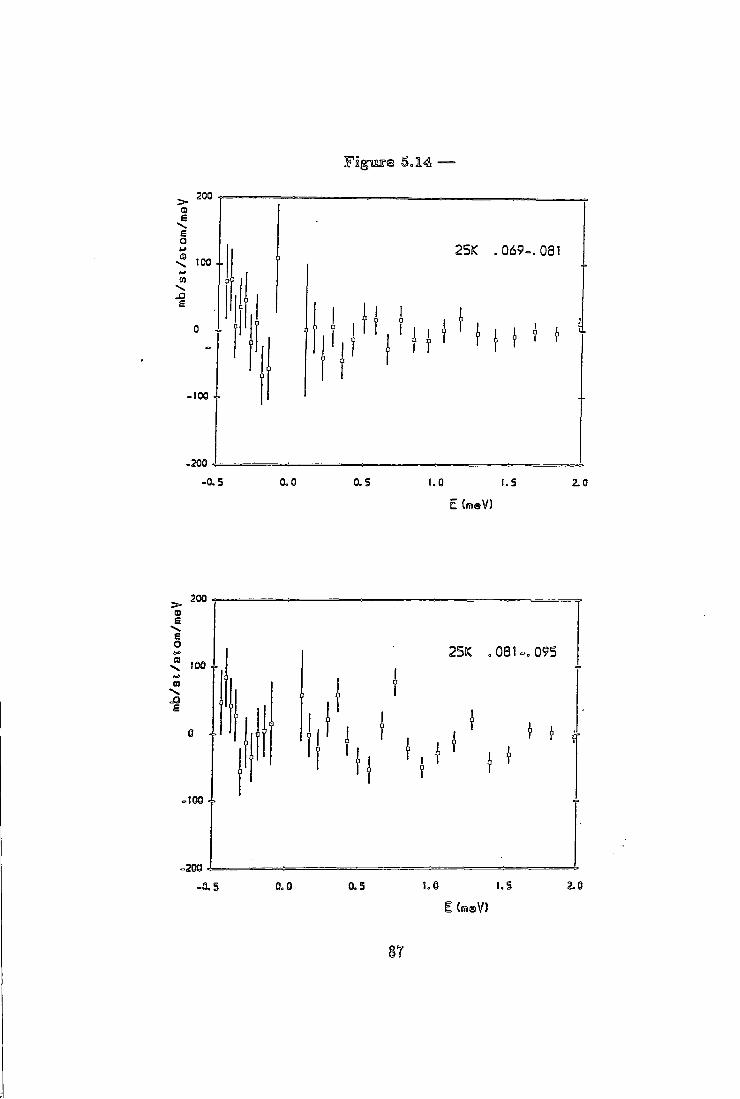
FigTOe 5.14 —
>• (D e e o
200
100 4-25K .069-, 081
J3
0 I
-100
-200
-0.5 a o 0.5 1.0 I .S 2.0
E (ineV)
200
25K .081-.095
E (msV)
8?
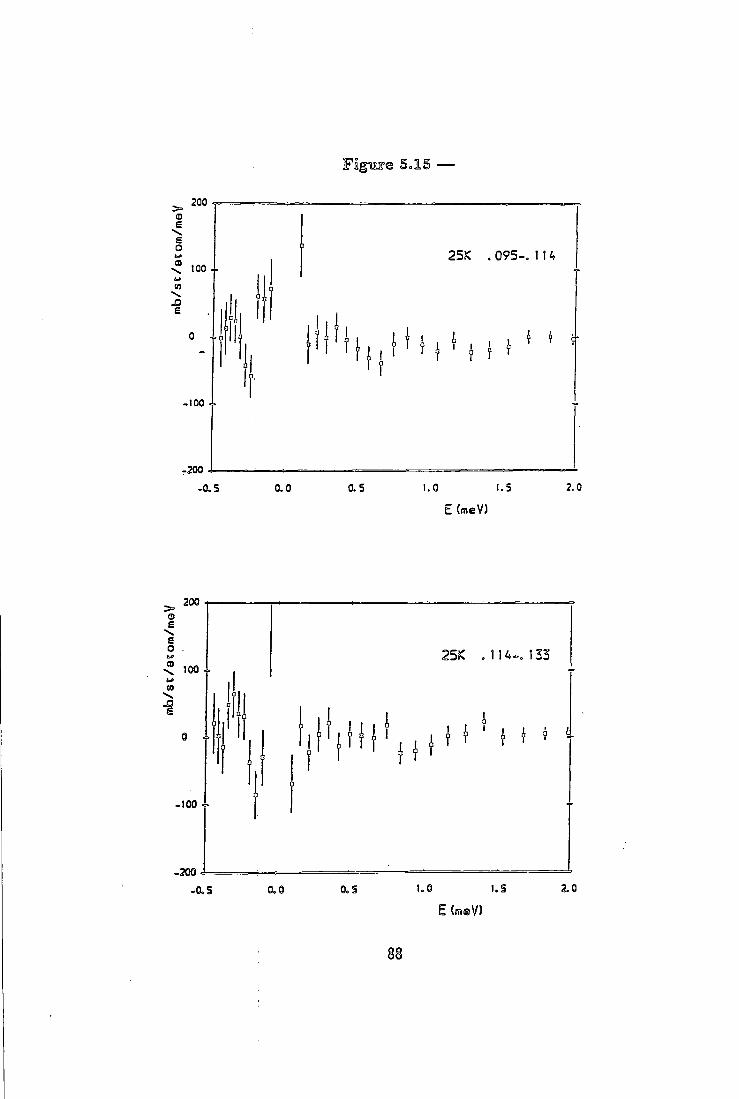
Figiare Sol5
200
25K .095 -114 00 4-
E CmeV)
£ E O
200
100
.100
25K ,114-. 133
-0.5 0.0 0.5 1.0 1.5 2.0
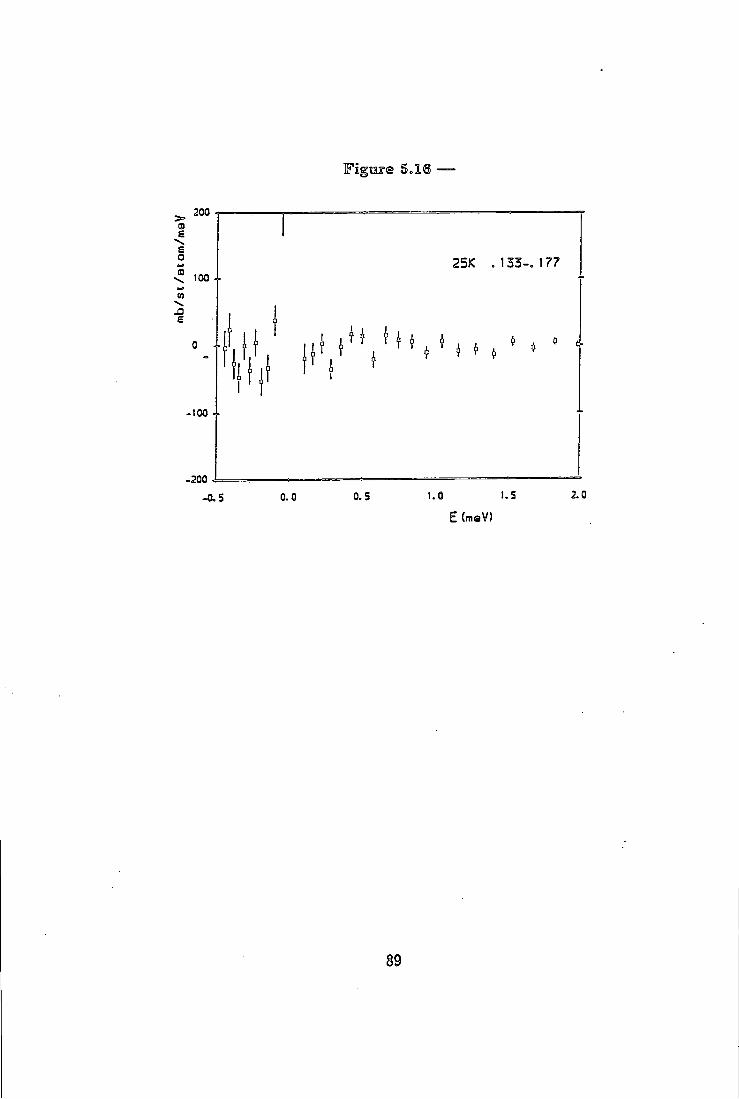
200 IB E
e o 100
e
-100
-200
Flgiire 5.16 —
25K .133-, 177
0 l i ' . H iif r ' . ' If ^ ^ M * * * « *
89
^ 5 0.0 0.5 I.Q I . S 2.0
E (meV)
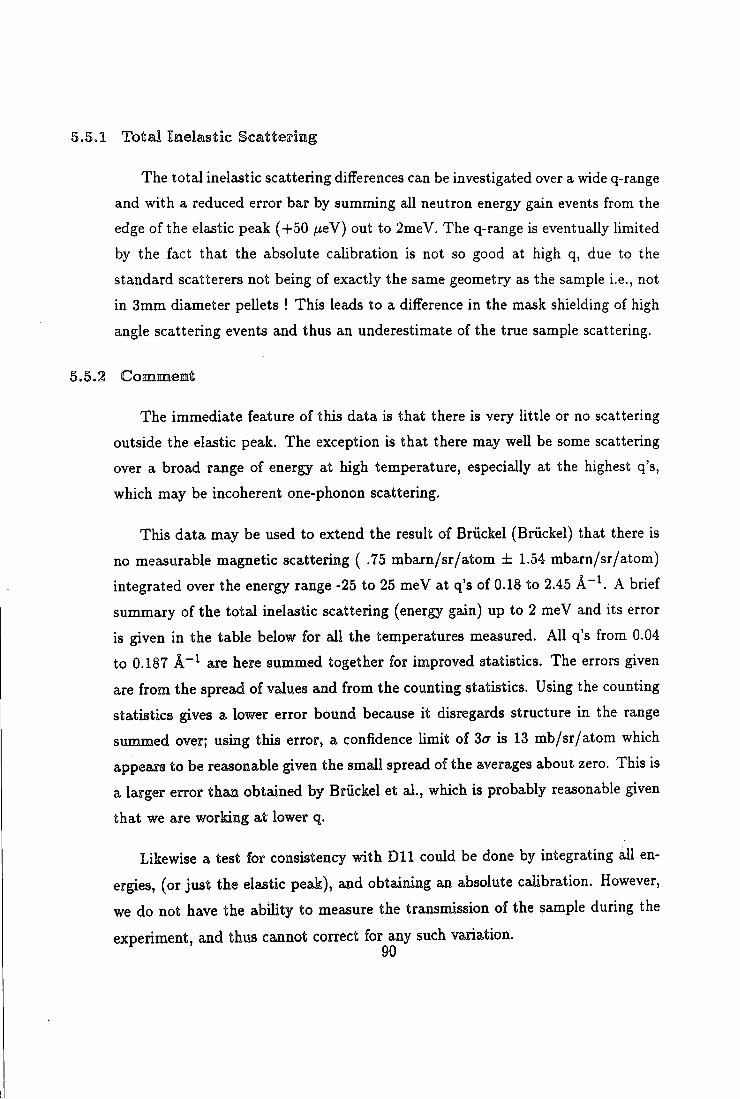
5.5.1 Total Inelastic Scatterimg
The total inelastic scattering differences can be investigated over a wide q-range and with a reduced error bar by summing all neutron energy gain events from the edge of the elastic peak (+50 /xeV) out to 2meV. The q-range is eventually limited by the fact that the absolute caUbration is not so good at high q, due to the standard scatterers not being of exactly the same geometry as the sample i.e., not in 3mm diameter pellets ! This leads to a difference in the mask shielding of high angle scattering events and thus an underestimate of the true sample scattering.
5.5.2 Commenil;
The immediate feature of this data is that there is very Uttle or no scattering outside the elastic peak. The exception is that there may well be some scattering over a broad range of energy at high temperature, especially at the highest q's, which may be incoherent one-phonon scattering.
This data may be used to extend the result of Briickel (Briickel) that there is no measurable magnetic scattering ( .75 mbarn/sr/atom ± 1.54 mbarn/sr/atom) integrated over the energy range -25 to 25 meV at q's of 0.18 to 2.45 A brief summary of the total inelastic scattering (energy gain) up to 2 meV and its error is given in the table below for all the temperatures measured. All q's from 0.04 to 0.187 are here summed together for improved statistics. The errors given are from the spread of values and from the counting statistics. Using the counting statistics gives a lower error bound because it disregards structure in the range summed over; using this error, a confidence limit of is 13 mb/sr/atom which appears to be reasonable given the small spread of the averages about zero. This is a larger error than obtained by Briickel et al., which is probably reasonable given that we are working at lower q.
Likewise a test for consistency with D l l could be done by integrating all en
ergies, (or just the elastic peak), and obtaining an absolute calibration. However,
we do not have the ability to measure the transmission of the sample during the
experiment, and thus cannot correct for any such variation. 90
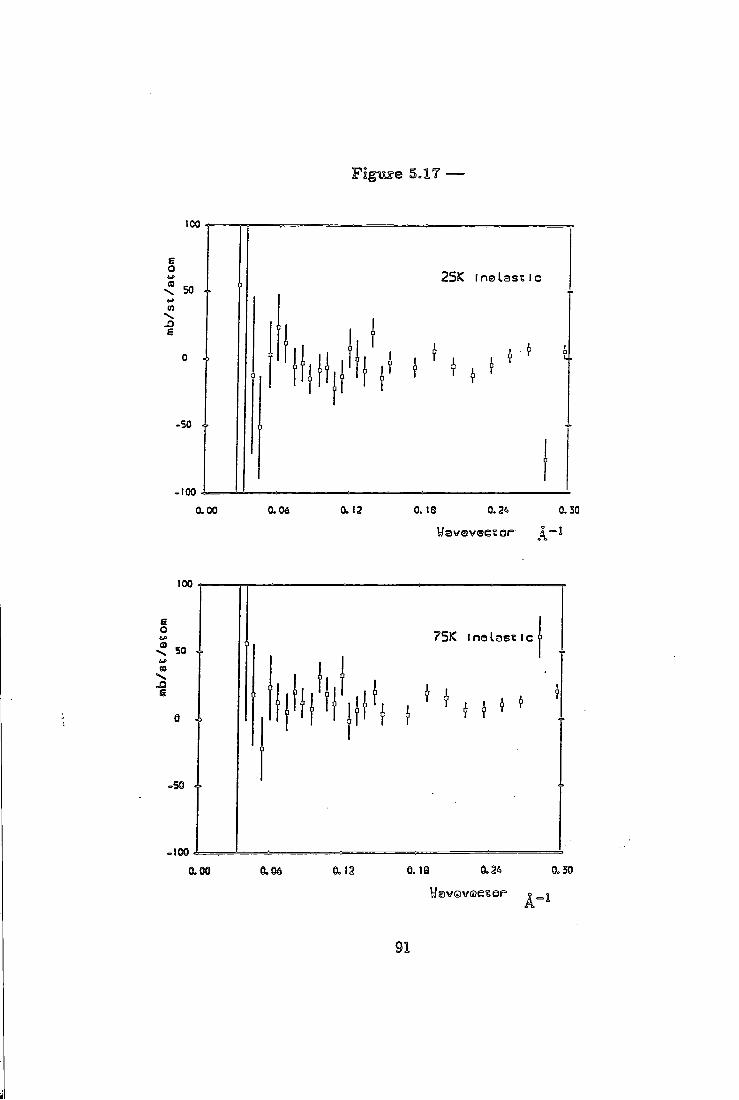
5.1T —
25K insLaseic
a 00 0.06 a 12 0. IS Q.2t> 0.30
75K I n a l a s t i e
Iff (
&00 0.06 0.13 o.ii e.2«.
91
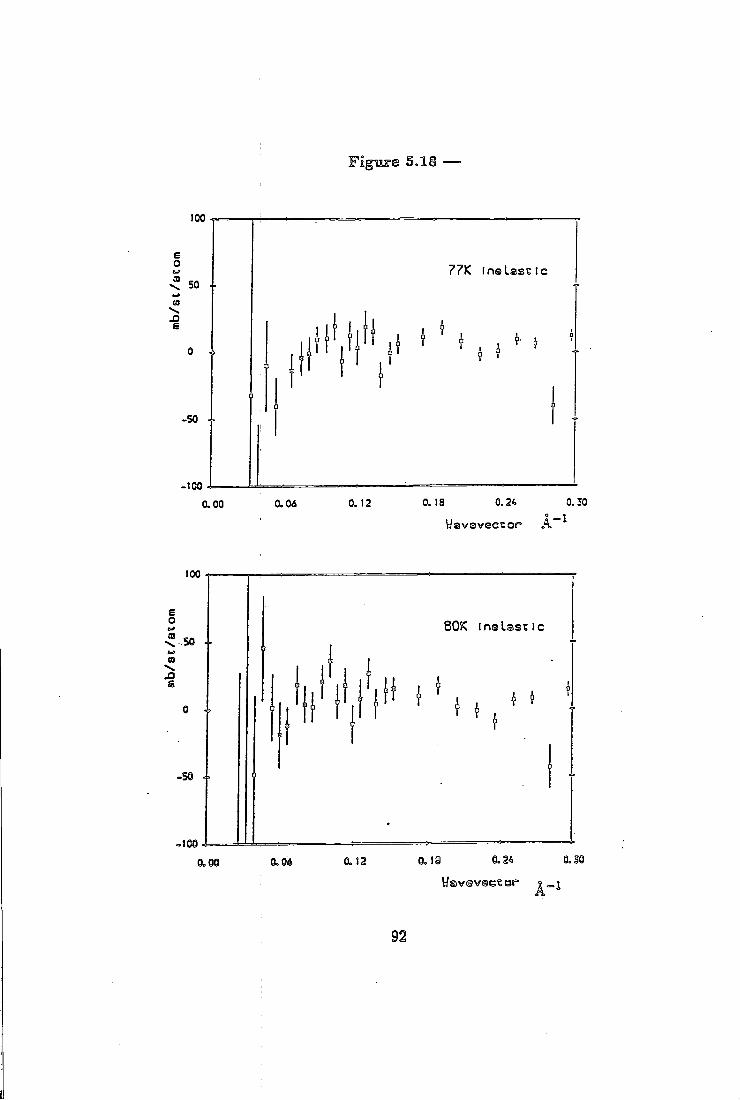
77k in®Lassie
i ' t
aoQ ao6 0.12 0. la 0.24 o.so
Wzvsveesor A
80K I n s Lassie
0.00 0.06 0.13 0.24 Q.SO
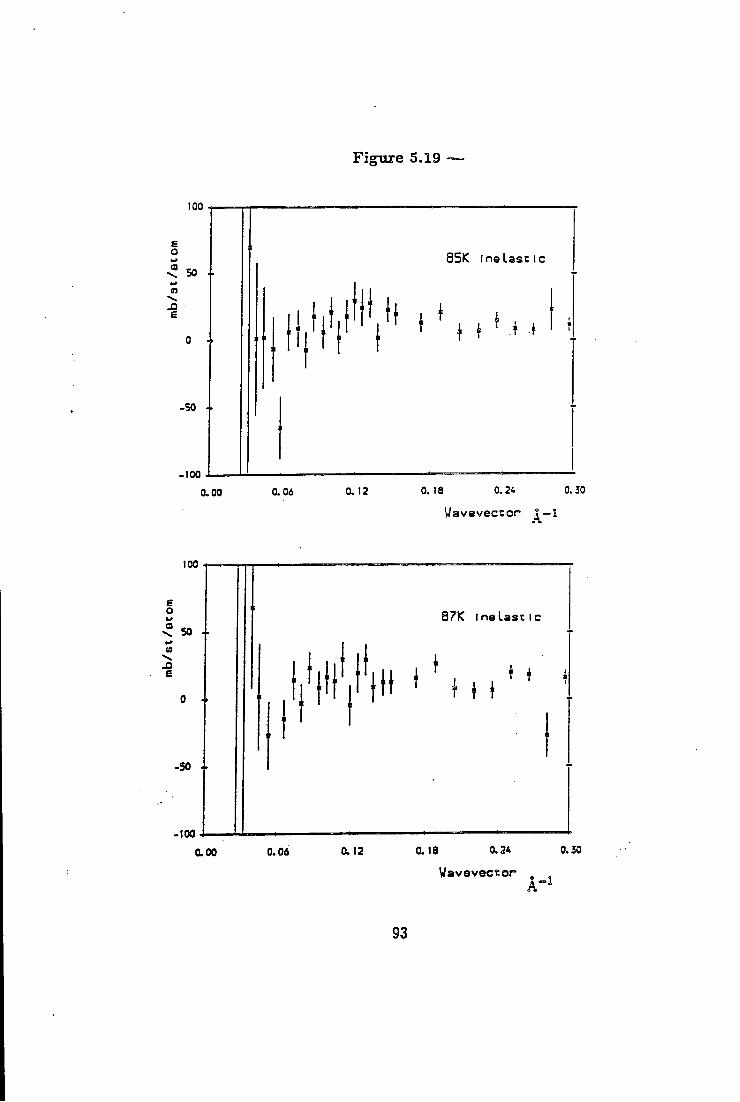
FigTire 5.19 —
85K ma Lassie
0.00 0.06 0.12 0.18 0.24 0.50
Wavevecsor ^ - l
100
e o 50 +
CO
.o
-50 +
a7K IneLassie
.100
0.00 0.06 0.12 0.18 0.2*
Wavevecsor
0.50
93
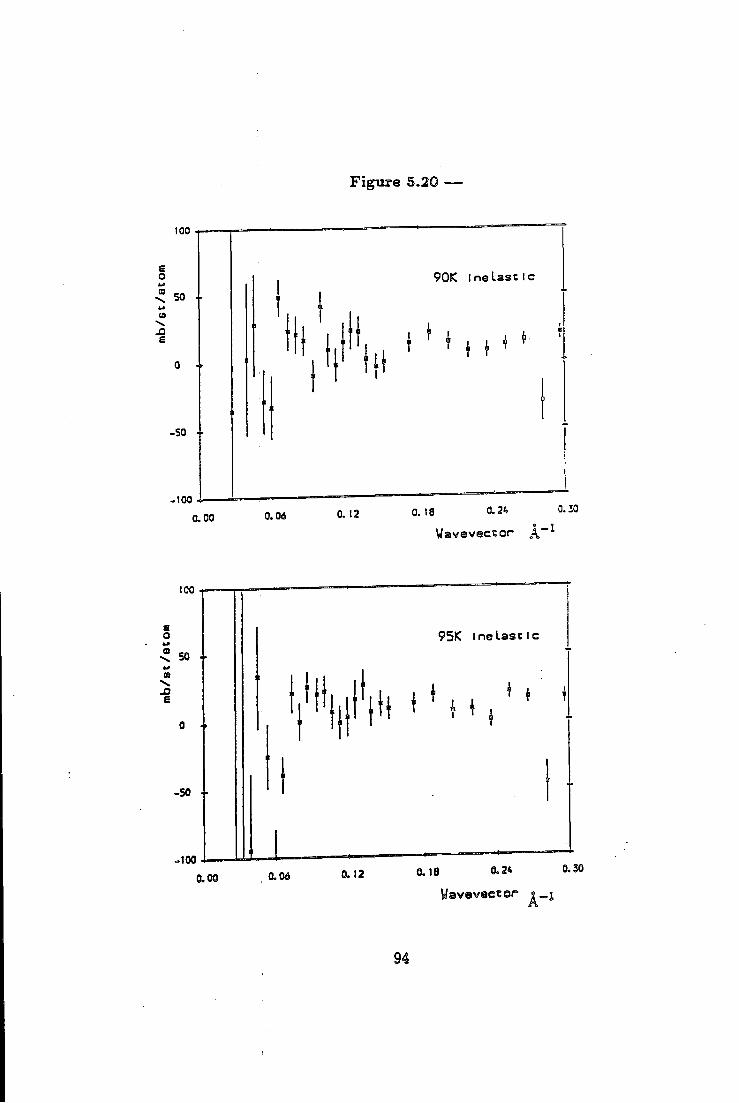
Figure 5.20 —
too
E O
50 +
J3
-SO +
-100
0.00
ft
90K IneLass i e
i ' * M t '
Wavevecsor A"
E O
50 4.
i
-50 +
.100
0.00 0.06
951C I n e Lassie
a 12 0 . t 9 0-24 0.30
W a v e v e e t e r ? „ j
94
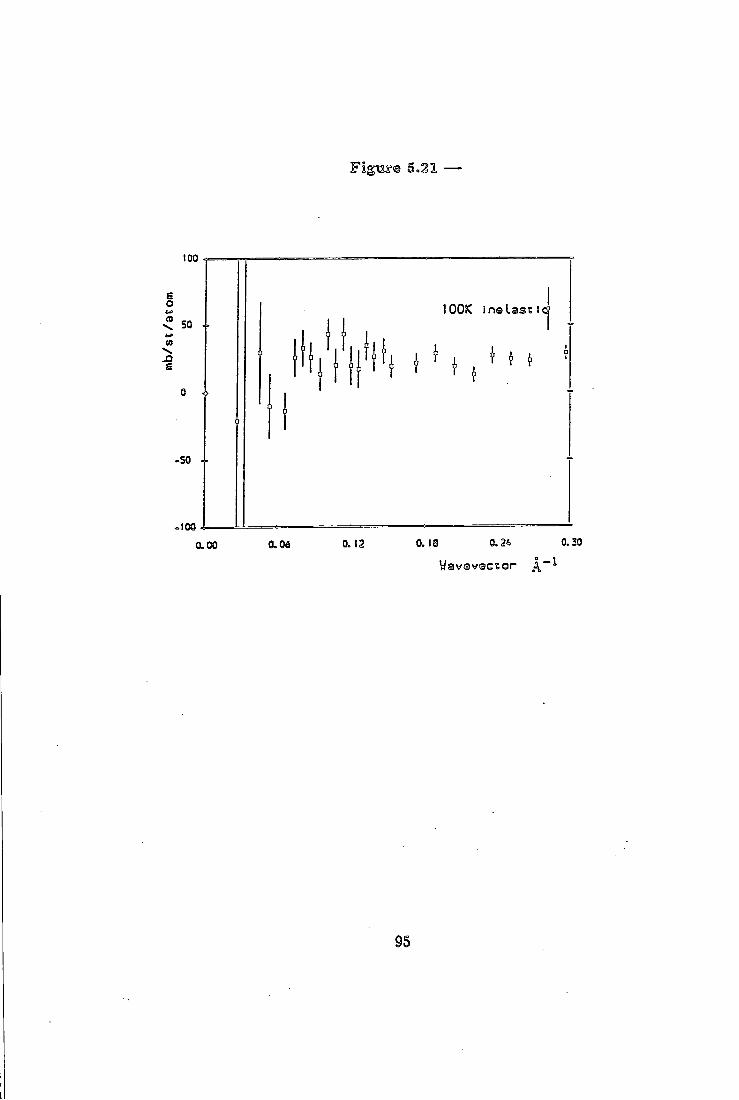
.21 —
100
E O
50
(0
- i
0 +
-50
. 1 ( »
lOOK ins Lass I
aoo 0.06 0. 12 0. 18 0.24 0.30
Wavoveeser
95
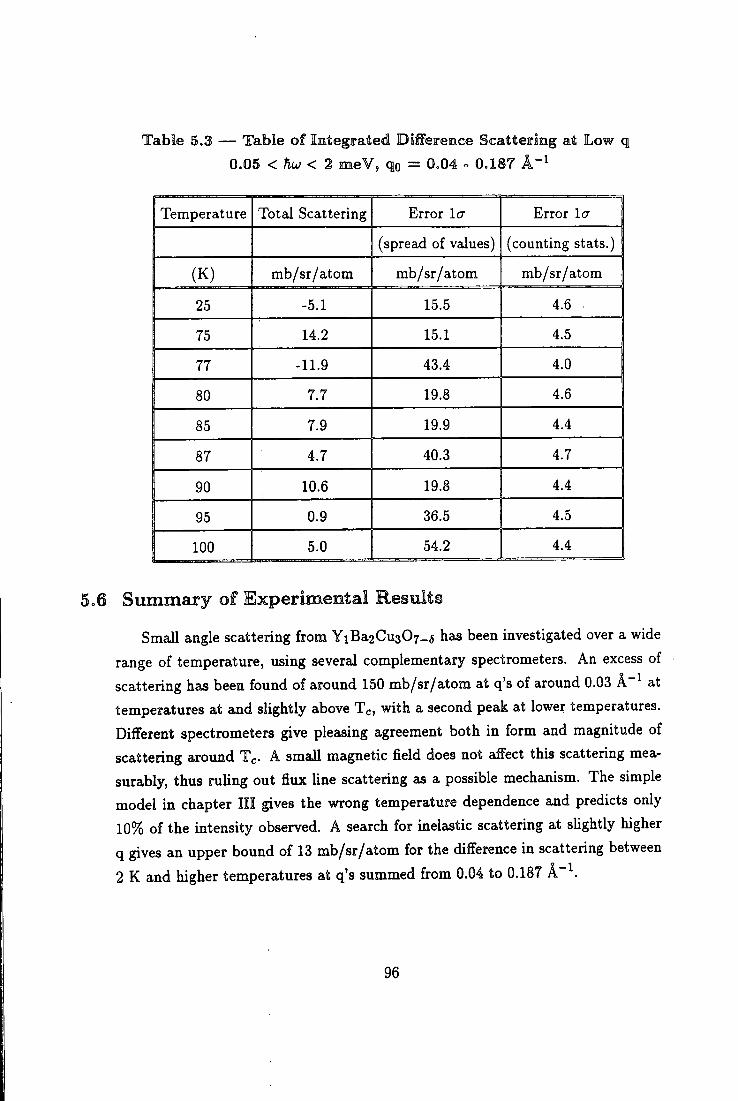
Table 5.3 — Tabie of Integrated DifFeremce Scattering at Low q 0,05 <hu < 2 meV, qn = 0.04 - 0.187 A"^
j Temperature Total Scattering Error Icr Error la
(spread of values) (counting stats.)
(K) mb/sr/atom mb/sr/atom mb/sr/atom
25 -5.1 15.5 4.6 .
75 14.2 15.1 4.5 1 77 -11.9 43.4 4.0
80 7.7 19.8 4.6
85 7.9 19.9 4.4
87 4.7 40.3 4.7
90 10.6 19.8 4.4
95 0.9 36.5 4.5
100 5.0 54.2 4.4
5,6 Summary of Experimental Results
Small angle scattering from YiBa2Cu307_5 has been investigated over a wide range of temperature, using several complementary spectrometers. An excess of scattering has been found of around 150 mb/sr/atom at q's of around 0.03 at temperatures at and slightly above Tc, with a second peak at lower temperatures. Different spectrometers give pleasing agreement both in form and magnitude of scattering around Tc. A small magnetic field does not affect this scattering measurably, thus ruling out flux Une scattering as a possible mechanism. The simple model in chapter I I I gives the wrong temperature dependence and predicts only 10% of the intensity observed. A search for inelastic scattering at slightly higher q gives an upper bound of 13 mb/sr/atom for the difference in scattering between 2 K and higher temperatures at q's summed from 0.04 to 0.187
96
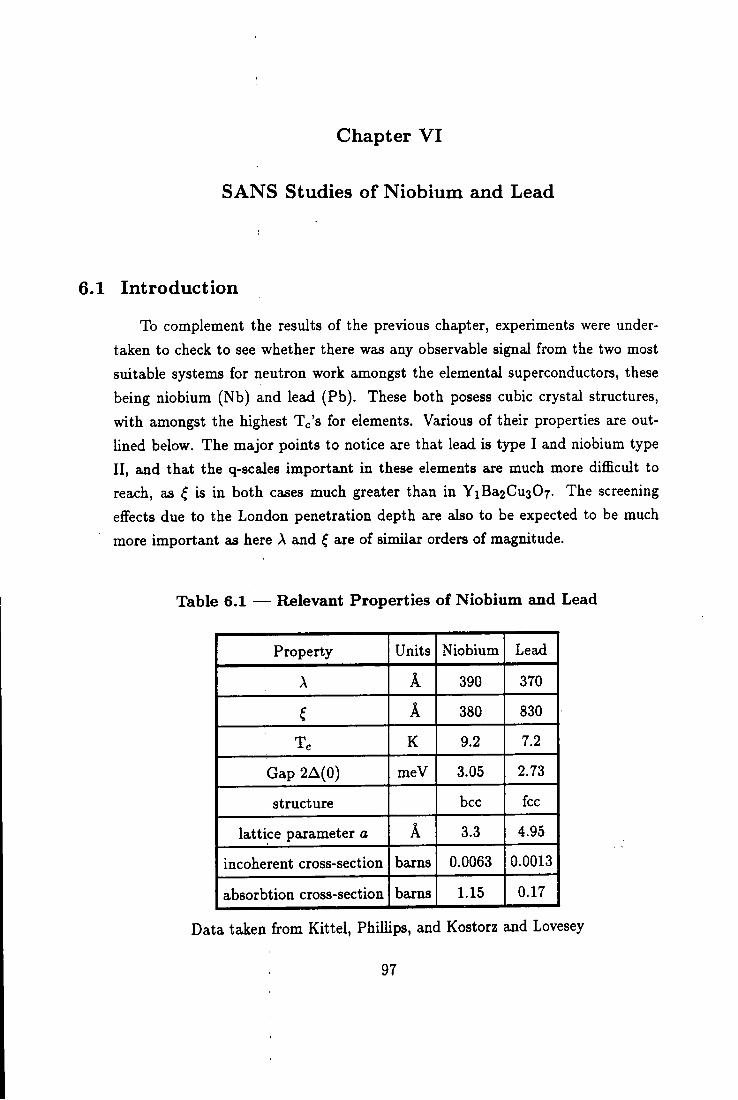
Chapter VI
SANS Studies of Niobium and Lead
6.1 Introduction
To complement the results of the previous chapter, experiments were undertaken to check to see whether there was any observable signal from the two most suitable systems for neutron work amongst the elemental superconductors, these being niobium (Nb) and lead (Pb). These both posess cubic crystal structures, with amongst the highest Tc's for elements. Various of their properties are outlined below. The major points to notice are that lead is type I and niobium type I I , and that the q-scales important in these elements are much more difficult to reach, as ^ is in both cases much greater than in YiBa2Cu307. The screening effects due to the London penetration depth are also to be expected to be much more important as here A and ^ are of similar orders of magnitude.
Table 6.1 ^ Relevant Properties of Niobium and Lead
Property Units Niobium Lead
A A 390 370
A 380 830
K 9.2 7.2
Gap 2A(0) meV 3.05 2.73
structure bcc fee
lattice parameter a A 3.3 4.95
incoherent cross-section barns 0.0063 0.0013
absorbtion cross-section barns 1.15 0.17
Data taken from Kittei, Phillips, and Kostorz and Lovesey
97
6.2 Details of Samples
The major advantage of these elements is that large single crystals can be both obtained and used in the experiment, due to the favourable absorption cross-sections. This use of good single crystals means that the low angle background can be very low indeed, as will be seen in the data obtained. This means that extremely hard experiments are possible: more importantly, as will be seen, D l l itself is capable of operating at these q ranges with an intrinsically low background.
Single crystals of these materials, as rods of length around 3 cm and diameter 1 cm were obtained from Dr A.Boothroyd and Mr T.Brown respectively. These were held in a specially made aluminium sample holder, the crystals being wrapped in very thin rolled cadmium sheet and the rest of the holder being screened at the front by a cadmium mask. This sample holder is shown in figure 6.1.
This was then mounted onto the D l l sample stick in the normal way; additionally a coil could be wrapped around the crystal in order to monitor Tc using the same temperature sensor as that for the experiment, but this was not done during the actual run, to avoid the possibility of scattering from the coil material.
6.3 Experiment 1 - Total Scattering Measurement
The first experiment used D l l with 2.5m collimation and 2.5m sample to detector distance. D l l is described in chapter IV. The experiment measured the signal through the central pinhole in the beamstop to monitor the total transmission through the sanaple as a function of temperature. This hole could perhaps be enlarged for this purpose, but the problem of saturation of the detector behind the hole would then have to be addressed. Both niobium and lead samples were investigated.
This experiment measures changes in the total cross-section (absorption -|-scattering) of the sample as a fimction of temperature. Essentially this is an integral over all (q,a;) available for neutron scattering, (the "neutron window"), except for a rather delicate region around q = 0 which will now be discussed. The point is that the detector is now effectively very small in this geometry, the pinhole being much smaller than the sample. Thus the neutrons detected have
98
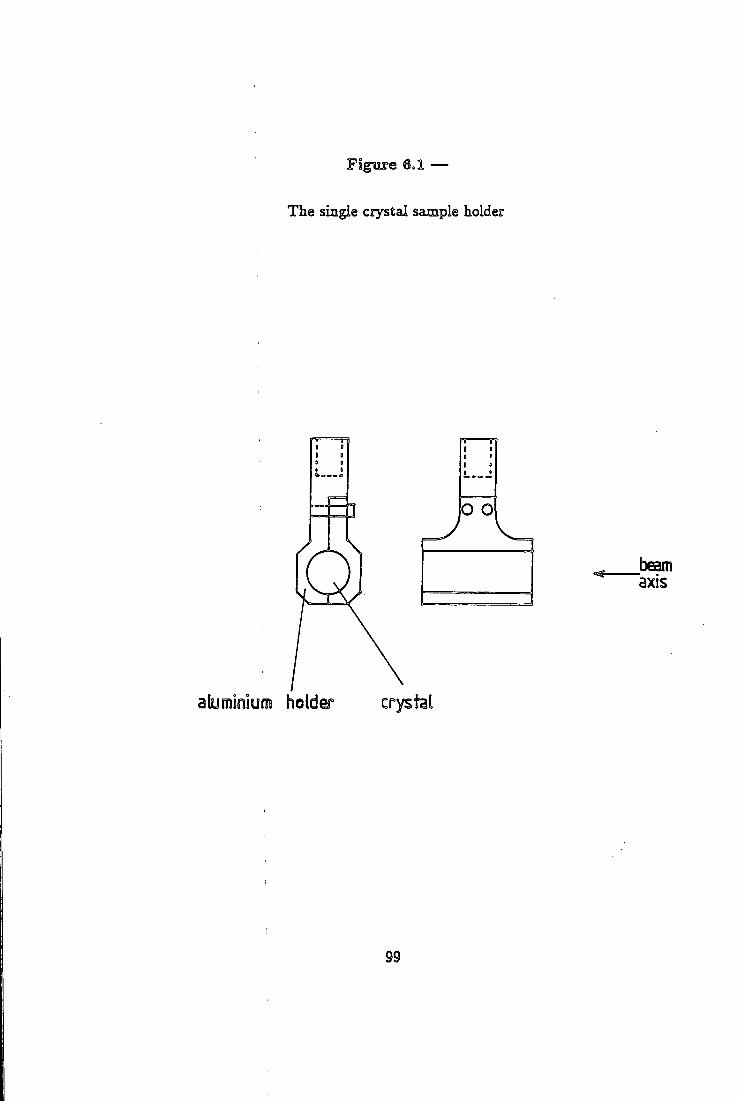
.1 —
The single crystal sample holder
beam axis
aluminium holder crystal
99
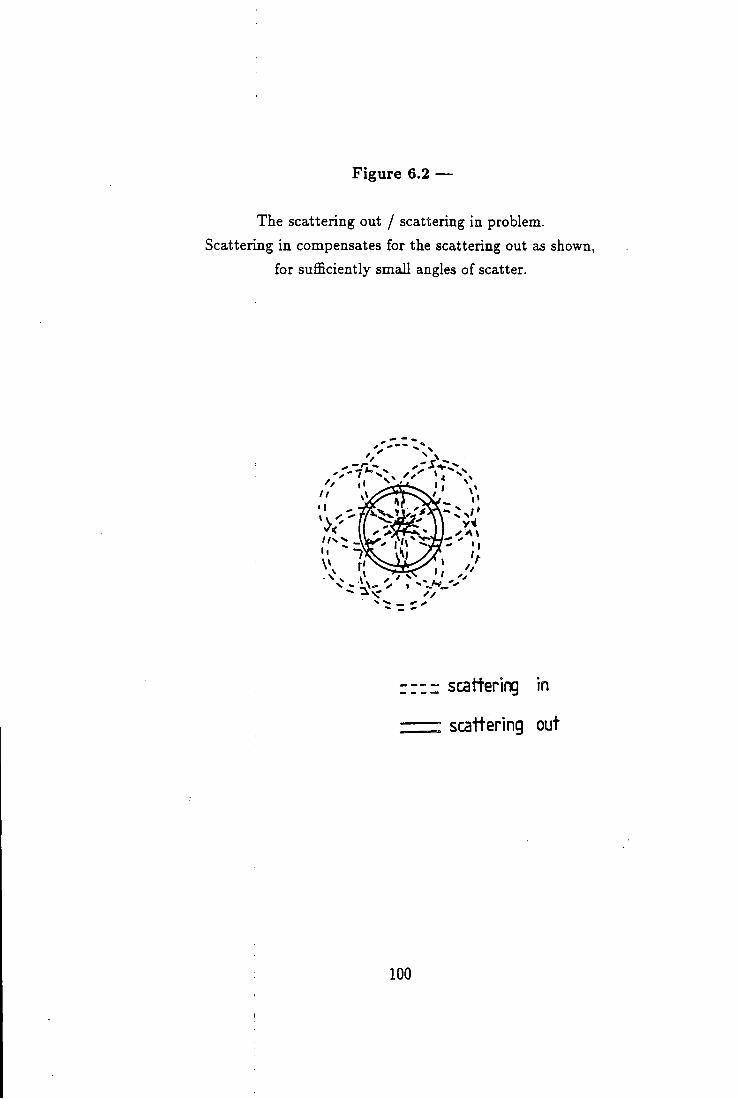
Figure 6.2 —
The scattering out / scattering in problem. Scattering in compensates for the scattering out as shown,
for sufficiently small angles of scatter.
zzzz scattering in
• scattering out
100
passed through an (imaginary) pinhole diameter tube through the sample. Now if some of these neutrons are scattered out of the beam at very small angles, (defined here as those angles which when projected onto the detector are less than the sample radius), then an equal number of neutrons will be scattered back into the detector by the other regions of the sample. This is schematically shown in figure 6.2, for six example regions scattering back into the central pinhole. Those neutrons scattered at higher angles are not compensated for in this manner, and we thus measure a decrease in the transmission. Figure 6.3 shows the total neutron window and that part which we can measure by this technique.
This is true as long as the pinhole was centred on the sample axis, but if this is not true, then at sufficiently large angles there will be insufficient weight from the scattering back into the "straight through" beam to get complete cancellation. Thus the lower cutoff for the wavevector integral detected may be rather difficult to define without a much better measure of the exact position of the pinhole. Beam divergence effects do not qualitatively change this fcict, but will again change the effective cutoff wavevector in detail, as the situation is more complicated for a now off-sample-axis neutron.
A small angle scattering instrument is good for such extensive total scattering measurements, mainly because the collimation can be suitably matched to the sample dimensions and the flux is high on such max:hines due to their rather relaxed requirements in monochromation. Notice that there is for this experiment no strict restriction upon the incident wavelength - but in practice we would ideally carry out such experiments beyond the Bragg cutoff to remove all Bragg scattering effects.
A direct test of the temperature sensor was performed separately, using the inductively measured Tc of the niobium sample in the same cryostat to check that the temperature indicated was sufficiently accurate. The Tc of niobium is 9.2 K, and the result (figure 6.4) shows that this was obtained successfully.
101
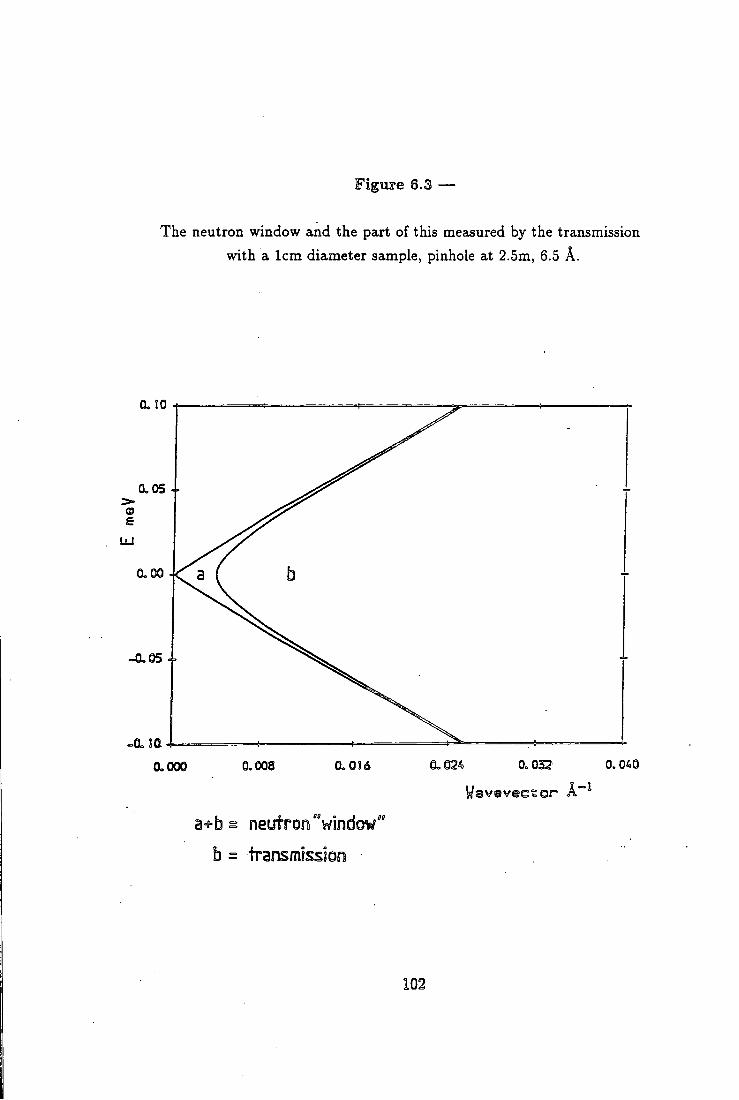
Figure 6.3 —
The neutron window and the paxt of this measured by the transmission with a 1cm diameter sample, pinhole at 2.5m, 6.5 A.
CLOS (B s
0.00
-0,05
a 000 0.008 0.016
a-f-bs neutron "window''
b = transmission
0.032 0.040
Wavevector
102
•4.1 Commeml!;
Both of these transmission graphs show some apparent feature at Tc, though
the signal in lead is very weak if at all justifiable against the statistical noise
and will not be treated further here. The niobium sample in particular shows a
noticable "dip" in transmission centred upon Tc, and with a distinct width, of
at least 0.5 K . If we average over a 0.2 K range around Tc, and compare this
with the average value excepting points within 1 K of Tc, this dip is 39 (± 8.5)
counts/cell in these units. Changes in transmission can easily be converted into
changes in total cross-section by the relation A / / / = 1 — e""* * , where n is the
nuclear number density, t the thickness, and A<7 the change in cross-section. These
calibration factors convert, for the scales used here, into 18.1 mbarn/atom per 10
counts/cell change. To obtain the measured dip in transmission, we need 71 ± 15
mbarn/atom of excess scatter at and close to Tc.
103
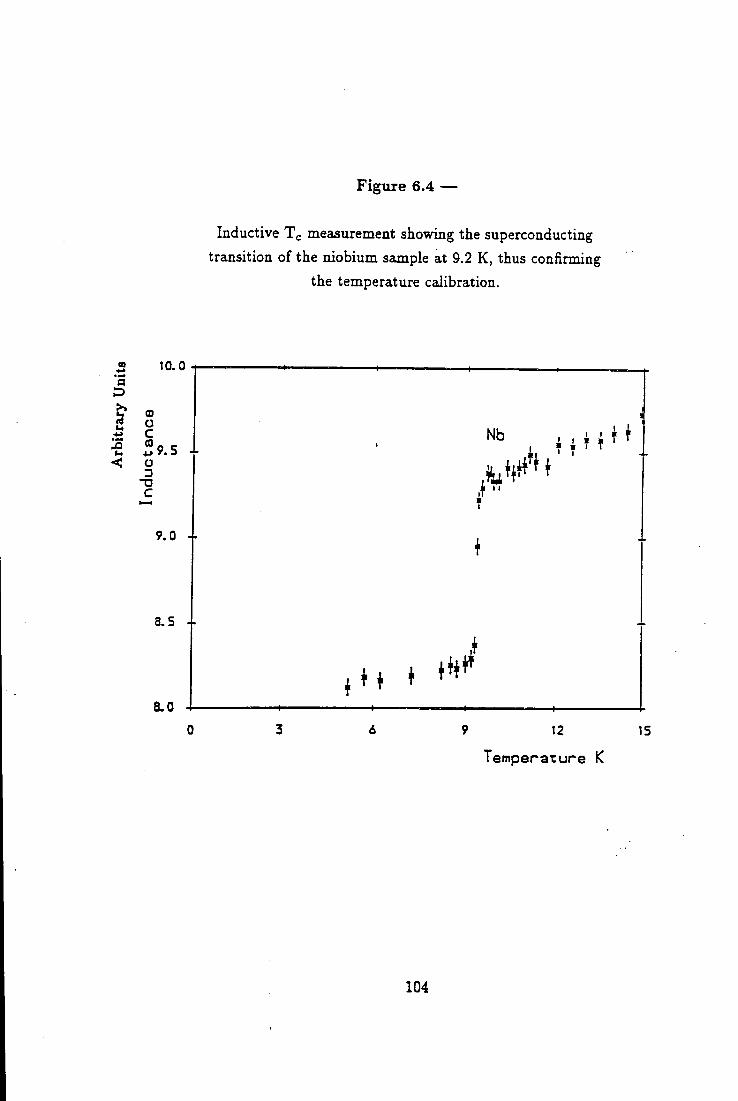
Figure 6.4 —
Inductive Tg measurement showing the superconducting transition of the niobium sample at 9.2 K, thus confirming
the temperature calibration.
10.0 a
D
u <
9 12 15
Temperature K
104
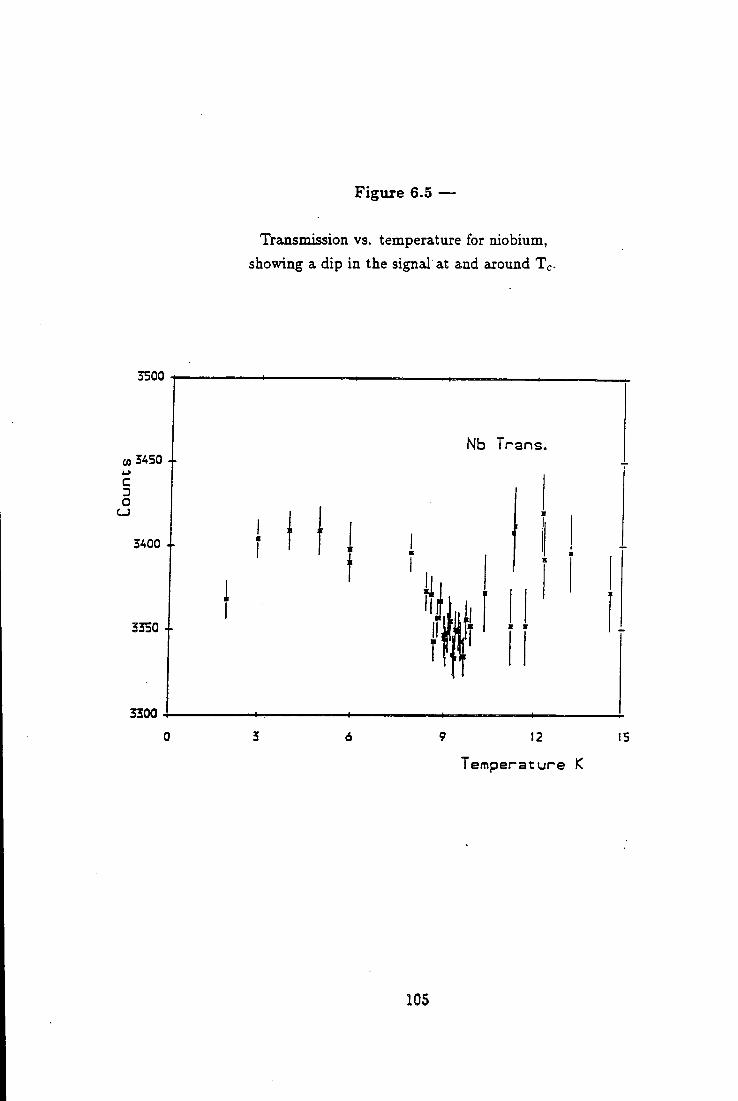
3500
3200
Figure 6.5 —
Trajismission vs. temperature for niobium, showing a dip in the signal at and around Tc
rans.
9 12 !5
Temperature K
105
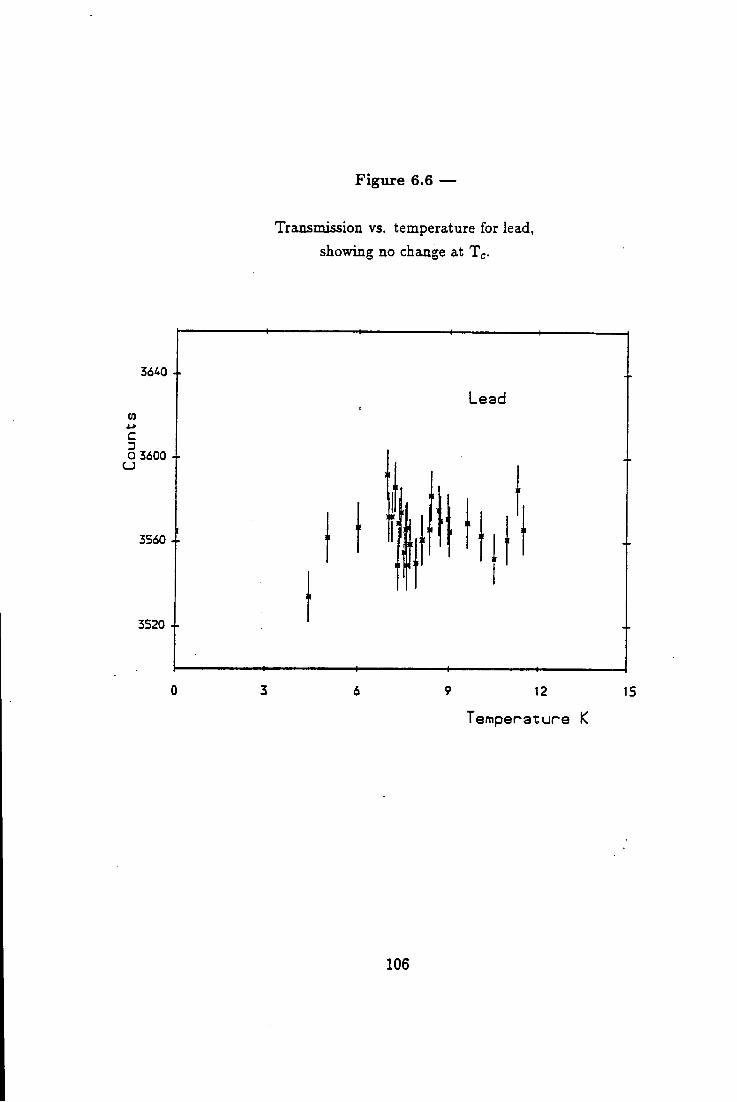
Figure 6,6 —
Transmission vs. temperature for lead, showing no chajige at Tc-
O3600
3520 +
9 12
Temperature K
15
106
6.5 Second Experiment - Direct Scattering Measurement
6.5.1 Experimental Details
This experiment set out to.measure whether this excess scatter at Tc in niobium
was at small angles. For this, the smallest practicable q (of order C(0)~^ i-e.
around .003 A~^) was sought; D U at 20m coUimation and 20m sample-detector
distance was used with a A of 6.5 A giving a q-range of 0.004 - 0.015 A ~ ^ This
collimation gives a loss in flux at the sample compared to 2.5 m coUimation of a
factor of 64 in theory, and a correspondingly smaller total solid angle viewed by
the multidetector. In fact the flux loss is not quite as bad as this, as the 17.5m of
guide tube now removed from the 2.5m setup is not perfectly efficient and we are
removing this loss mechanism. In fact we can estimate the loss from the measured
sample transmission at 20m / 20m, which gives a measured value of a factor of 38
(i.e. the guide is only 38/64 efficient).
This low flux causes reed problems; centring the beamstop, which is usually a
simple matter with a strong scatterer such as a piece of plexiglas, becomes more
difficult. A better solution is to use a stronger scatterer giving a large amount
of scatter into the very small angles most useful for centring purposes. On D U
biologists use P T F E for this purpose, and this idea we have successfully borrowed.
Notice that gravity starts to become important in the centring of the beamstop at
these collimator and sample-detector distances.
6.5.2 Calibration
The problem mentioned above causes difficulties for our calibration procedure
i.e. using vanadium as the standard scatterer. This becomes unfeasible due to
the now low flux and low solid angle viewed. We have here reverted to using
plexiglas as a secondary standard, calibrated separately against vanadium at 2.5m
/ 2.5m. In addition, the standard programs used on D U to average the counts
in the annuls constant scattering angle rings of the multidetector only work to
the nearest 0.1 counts per cell. At noise limited count rates, this can be a serious
problem as the rounding error can be significauit, and should be addressed in future
by recording all the data for the individual detector elements for such experiments.
This aside, plexiglas calibration at 20m / 20m was feasible.
107
(S.(S Resualts
Only two temperatures were investigated, 2.0 and 9.2 K, allocating 12 hours
to each run, and changing only the temperature in between runs. This was to
give the maximum possible chance to measure any scattering. Again the Bragg
cutoff wavelength was exceeded by a suitable margin. The difference in scattering
in absolute units is shown in figure 6.7.
It is apparent that there is no signal above the noise, always being within 1
standard deviation of zero. Angles which gave very low count rates for perspex at
2.5m / 2.5m have been rejected.
6.6.1 Backgronmd
The background seems to be mostly the wings of the direct beam, if allowance
for the sample transmission is made (~ 1/3). See figures 6.9 and 6.10. This
background is still rather angle dependent and implies that with our sample size,
a cross-section of abound 50 mb/sr/atom at typical q's of 0.006 - 0.015 would
be visible given 12 hours counting time at each temperature. This is about the
limit of performance of D l l , as we are rapidly approaching both the electronic
noise limit and the length of time available for any one experiment.
007 Commeeii on Both Resialts
It is perhaps not surprising that there is no transmission anomaly in lead; it is
a type I superconductor, and would not be expected to show the electromagnetic
effects discussed ia chapter I I I , as any magnetic field fluctuations will be extremely
efficiently screened even at q's approaching This argument is strongest below
Tc,- in theory, fluctuation eflfects above Tc might be visible even in a type I super
conductor due to the lack of screening effects. On the other hand there is evidence
for a transmission anomaly in Nb which implies that there is extra scattering at
and near Tc, with an integrated cross-section of 71 ± 15 mbarn/atom.
However, direct attempts to measure this scattering have failed even at q's as
low as 0.004 A"-^. This would be the wavevector scale expected if this were to be
similar in form to the scattering from YiBa2Cu307. Further, to be at even smaller
q, it would have to be concentrated in such a small volume of q space that the
108
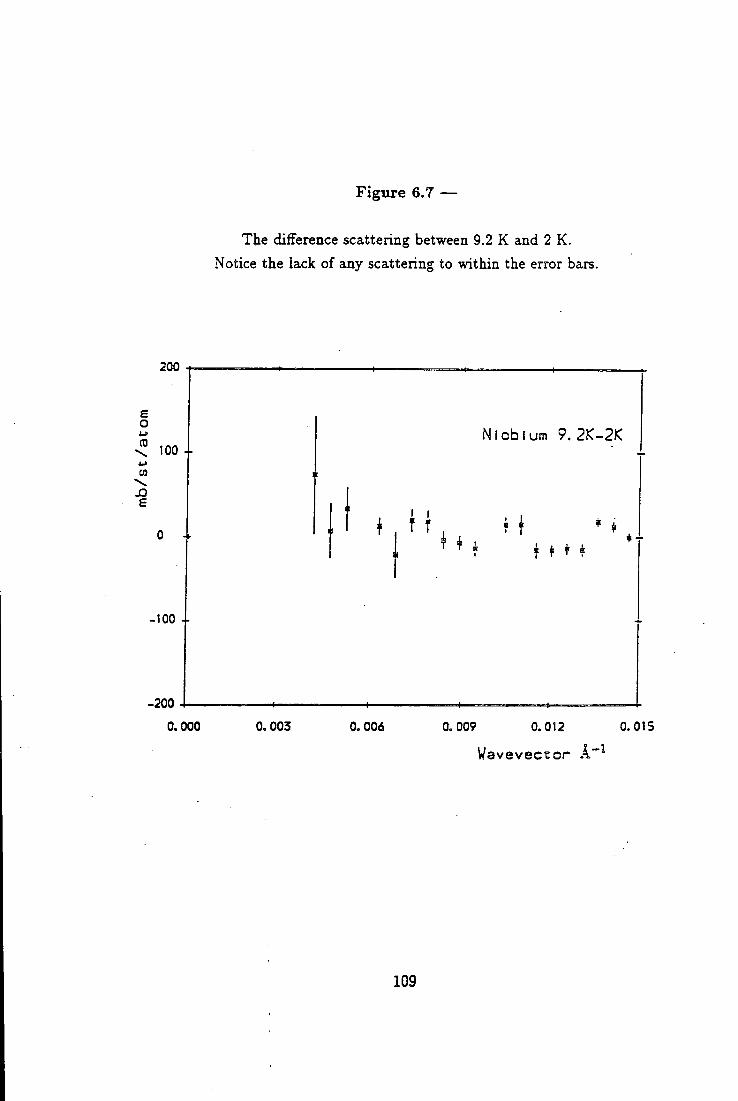
Figure 6.7 —
The difference scattering between 9.2 K and 2 K. Notice the lack of any scattering to within the error bars.
200
e o CD
W \ £
100 I
-100 4-
-200
0.000 0. 003
Niobium 9 . 2 K - 2 K
0.006
i * i
0.009 0.012 0.015
Wavevector
109
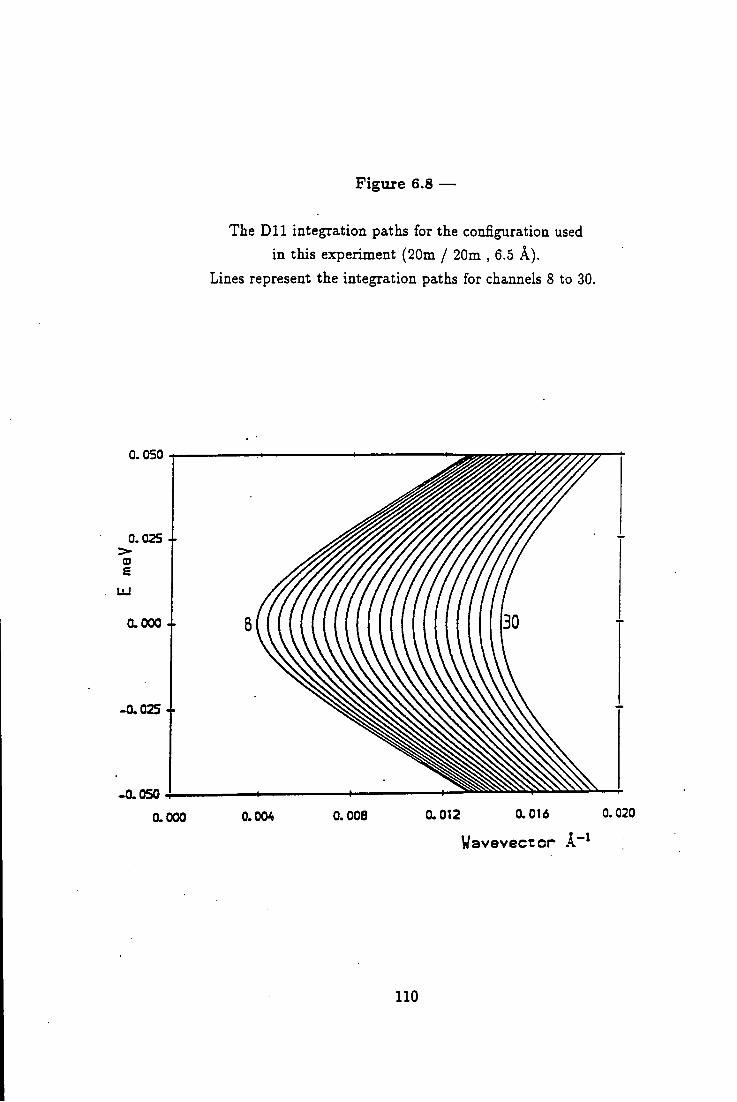
Figure 6.8 —
The D l l integration paths for the configuration used in this experiment (20m / 20m , 6.5 A) .
Lines represent the integration paths for channels 8 to 30.
0.050
0.025 +
0.000
0.025 +
-0.050
0.000 0.004 0.008 0.012 a 016 0.020
Wavevector A~
110
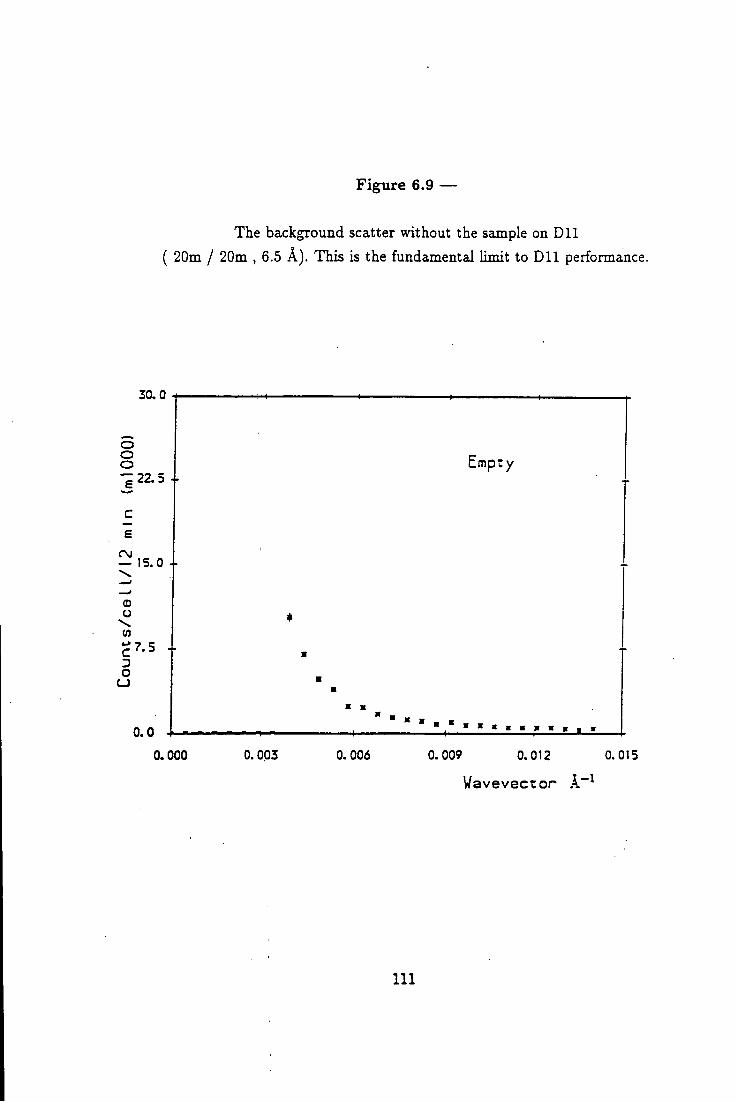
Figure 6.9 —
The background scatter without the sample on D l l ( 20m / 20m , 6.5 A ) . This is the fundamentaJ limit to D l l performance.
30.0
0.000 0.003 0. 006 0.009 0.012 0.015
Wavevector
111
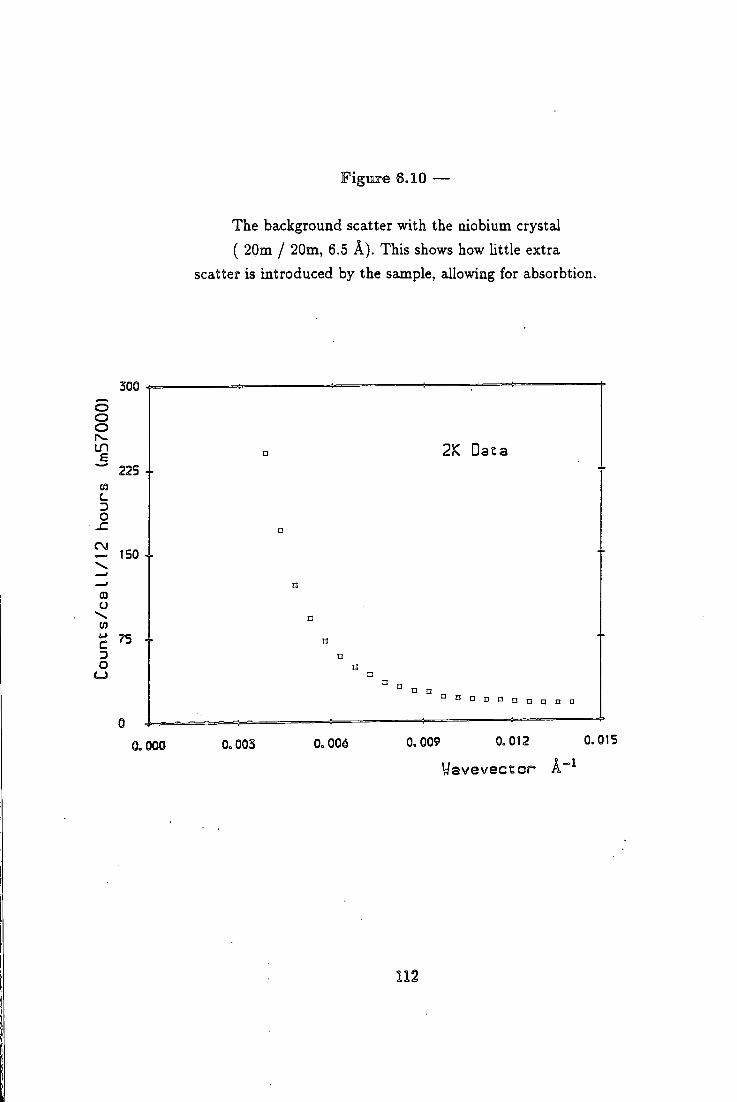
Figure 6.10 —
The background scatter with the niobium crystal ( 20m / 20m, 6.5 A). This shows how Uttle extra
scatter is introduced by the sample, allowing for absorbtion.
300 o o o ^. in £ CO
c D O
225 +
150
CD CJ
\
^ 75 C D O
C J
0.000
2K Data
0.003 0.006
n n n D ° n n o o a
0.009 0.012 0.015
Waveveetor A~
112
cross-section per steradian would be very large indeed. Also, there can be placed
stringent limits on where this scattering could be, as after all channel 8 (8-9 cm)
at 20m (q = 0.004 A~^) corresponds to channel 1 (1cm) at 2.5m. The low q limit
on the integration performed by the transmission measurement, if the pinhole in
the beamstop was perfectly centred with respect to the sample (the best case), is
at half this at around 5mm at 2.5m, as the sample is 10mm in diameter.
Thus the only consistent explanation seems to be either that the scattering
is at 0.0015 < q < 0.003 A~^ or it is at a much higher q and by a different
mechanism, e.g. a phonon. It may also be appropriate to note that there are no
neutron visible phonon anomalies at the superconducting transition in lead, but
there are in niobium as mentioned in chapter I I I (see Youngblood, Shirane).
6.7.1 Phonon Scattering Interpretation
There are two points to consider, if we think that a phonon might be responsi
ble. This effect must cause extra scattering only in the region immediately around
Tc. Thus the phonon mode concerned must in aJl probability be near to the edge
of the volume of phase space available and enter it and then leave it again below
Tc.
This is rather difficult to visualise as the phonons are usually affected in the
following way. They decrease in width (which tcikes weight spread out in u and
concentrates it) and may also decrease in energy, (soften), when below the gap
in energy. If close to the gap in energy, they are increased in width. Both the
phonon linewidth and frequency effects vary quite smoothly with temperature,
with no obvious way in which they can combine to give the required temperature
dependence.
At least in niobium, we «ire well away from the first Bragg reflection, as 100 is
forbidden in a bcc structure - the first allowed reflection is 110 (2.692 A"^). Thus
the only phonons that cut the integration paths at low energies even for scattering
at 180" (if we put the velocity of the first phonon as 10 meV A(Nakagawa)) are
at energies of > 2.6 meV. See figure 6.11. This is inside the zero temperature gap
for niobium (2A(0) = 3.05 meV), but if we use the "two-fluid" model for the gap,
it will not reach this energy until T / T c < 0.62, i.e. not until T < 5.7 K. Thus the
113
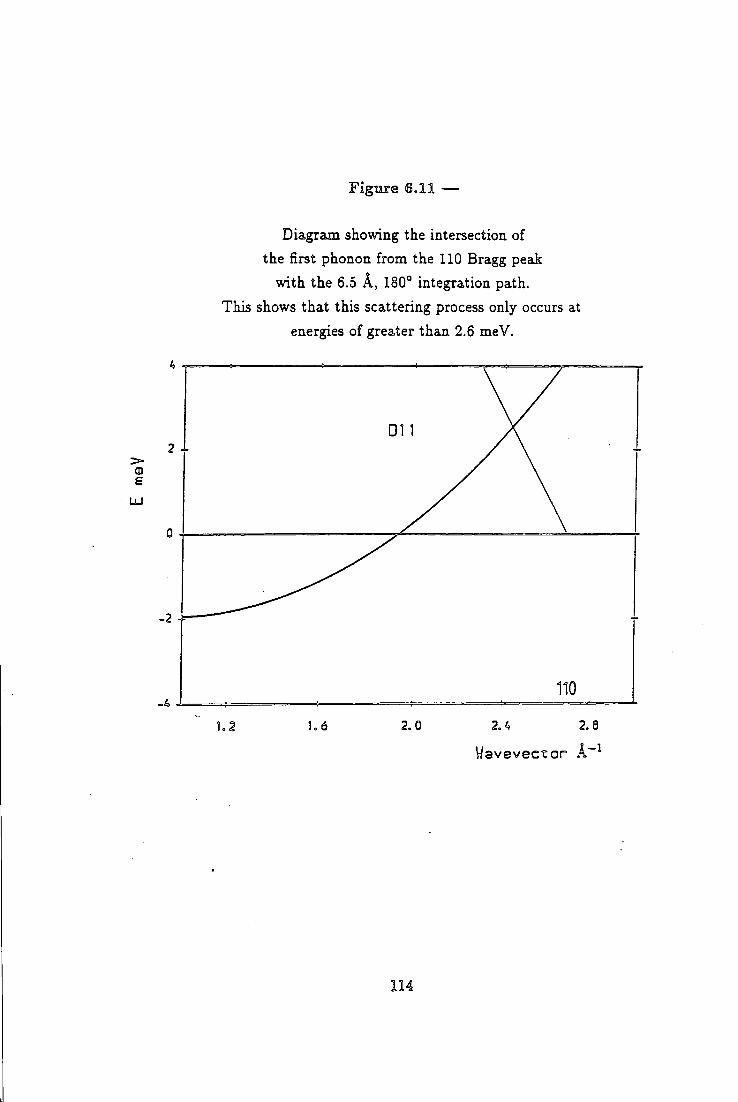
Figure 6.11 —
Diagram showing the intersection of the first phonon from the 110 Bragg peak
with the 6.5 A, 180° integration path. This shows that this scattering process only occurs at
energies of greater than 2.6 meV.
CD £
UJ
110
1.1 1.6 2. 0 2. 4 2. a Wavevector .4"
strongest effects on this phonon at these energies will not occur at Tc itself, as we
would need if this were to provide our extra scattering.
A simple test of whether this effect is due to some subtle phonon anomaly would
be to repeat the experiment with energy analysis, as a single phonon mechanism
involves energy transfer. Another instrument, such as INI 1, might be more suitable
than D l l for this experiment.
115
Chapter VII
Conclusions and Suggestions for Further Work
"When at the first I took my pen in hand,
Thus for to write, I did not understand ..."
J.Bunyan, The Pilgrims Progress, Author's apology, initial lines (1678)
7.1 Results The small-angle scattering technique especially in its quantitative form has
been shown to be useful in principle for measurements upon the superconducting
state. Extreme type I I superconductors with high Tc's appear to be the best
candidates for observing such effects, due to the small coherence lengths involved
and the long penetration depth. These allow magnetic effects at q values of order
the coherence length to be measured. The increased population of low energy
modes due to the population factor also helps make experiments on current neutron
spectrometers a practical proposition.
7.1.1 High Tc Superconductors
Experimental results on YiBa2Cu307 indicate a pecik in the scattering at small
angles at wavevectors of order .03 A~^ at and just above Tc and a further peak
at lower ten^perature. Experiments on IN3 and INS restrict the energies for this
scattering to be within -30 to -f-30 n eV and -50 to -1-50 /zeV respectively. That is
to say this scattering is indistinguishable, due to the finite experimental resolution,
from elastic scattering. There is no simple extrinsic explanation for this magnitude
of scattering.
7.1.2 Interpretation
There is no obvious way to explain the magnitude of this peak within the
framework of current theories if sensible parameters are to be used. In particular,
the theory of scattering from the orbital effects of the conductivity changes in a
116
superconductor predicts a decrease in scattering at Tc not an increase. This is the
opposite of what is observed here ! Even in the simpler case above Tc, the amount
of scattering seen is very difficult to obtain from fluctuation conductivity models.
If these events are very low-energy or elastic, we must be careful about the use of
the population factors; truly elastic (a; = 0) events should be genuinely temperature
independent unless the mechanism which is causing scattering is changing. If the
energy of these excitations is truly very low, then the assumption made that the
mode is unpopulated at low temperatures (2 K ) may not be good. Any collective
modes of the system at finite energy will, however, be required to be seen in
various other mezisurements which integrate over all available states of the system,
specifically NMR, / iSR and specific heat measurements. Although comprehensive
results for all these have not yet been obtained, initial results do not indicate
extreme behaviour in any of these. This does not however mean that these are yet
well understood.
The upper bound on inelastic scattering energies obtained using IN5, of 13
mb/sr/atom at 0.05 < huj < 2 meV and q's of 0.04 to 0.187 A-\ puts the final
nail in the coffin of theories invoking superconducting pairing by low energy ferro
magnetic correlations in this system. Any theories involving B-fields in the bulk
of the superconductor sample (e.g. Anyon theories) will also be restricted by this
result, as it measures and places a limit on the (B,B) correlation function of the
system at "macroscopic" wavevectors at finite energies. They might however take
some comfort from the very low energy or elastic effects seen here.
7.1.3 Comventiopal SnapercomdMctoirs
Measurements on single crystal niobium have shown no directly measurable ad
ditional scatter at wavevectors of .004 to .015 A~ at Tc, at the 50 mbarn/sr/atom
level. This cross section upper bound is a very restrictive limit upon the scattering
at such values of q and is unlikely to be improved without a radical improvement
upon current neutron sources. This experiment takes D l l to the electronic.noise
limited regime at 20m / 20m incident and outgoing collimation and demonstrates
the possibility of using D l l in this q range for hard experiments. Given that nio
bium is a much less type I I system than YiBa2Cu307 with a « of 1.02, this is
maybe not surprising even within the picture used above. Nevertheless, a dip in
117
the measured transmission of 6.5 A neutrons through a niobium single crystal of around 1% at Tc has been measured. This pair of results is difficult to understand simply. A similar experiment with a lead crystal gave no such result. Lead is type I and would not be expected to show any magnetic effects, with the screening effects dominating at all ranges of q below Tc.
7.2 Suggestions for Further Work
Further work in this field should involve the continuation of the experiments on YiBa2Cu307, possibly using an oriented array of flux-grown crystals. Progress on the manufacture of such crystals of sufficient size is enough to allow the D l l experiment to be repeated although sufficient sample for INS probably remains out of reach at the moment. Such work will be able to exploit the lower background from superior samples to investigate the temperature and wavevector dependence more fully. In addition, it may be possible to investigate the effects above Tc, especially at the larger wavevectors (say .045 and above) where precursor effects might be more obvious, given that fluctuation effects may well be stronger at finite q. Other High Tc systems are also worth considering, if they can be made as homogenous bulk samples with a single Tc. As yet, none cure obvious candidates, although samples of such systems may eventually overtake YiBa2Cu307 in their quality.
In conjunction with this, it is worthwhile considering looking at low Tc in-termetaUic compounds such as the cubic compound LaSn3. The study of superconductivity possesses a great advantage over magnetism in this respect as there are many more intermetallic superconductors than ferromagnets; thus a compound with especially favourable properties for neutron work can be chosen, rather than being the only candidate system ! A low incoherent scattering cross section and a low absorbtion are the most important of these, and a cubic crystal structure helps to make the Bragg cutoff wavelength small. Systems with low temperature structural anomalies, (such as the structural transitions in NbsSn and its related compounds), are however best avoided due to the possibility of small angle scattering arising from these effects swamping the signal.
A more adventurous experiment still would examine systems with other phase transitions that rcidically change the conductivity, such as metal-insulator tran-
118
sitions. However, for these experiments we need homogenous systems with no structural changes at the phase transition and with good neutron properties.
7,3 Final Remarks
Small angle scattering from superconductors is, as a field of study, restricted by two major problems. Firstly, these experiments are long and hard to perform by comparison with many other SANS experiments. The principal reason for this is that the interesting range of wavevector is extremely low , and this means small angles and long wavelengths must be used. The building of the new small angle instrument D22 at the I L L , which is optimised for longer wavelengths than D l l , may make some of these experiments more feasible.
Secondly, the interesting region of (q,a;) space is the region where q < This is a taxing theoretical problem , especially at finite temperatures. The question of what the superconductor looks like at these length scales is obviously an interesting and fundamental one. No other probe can unambiguously reach these wavevectors and energies; thus there is unfortunately little possibiUty of direct ancillary confirmation of these effects.
Neither of these two problems is in my view insurmountable. I hope that this
thesis will provoke future effort into this interesting field.
119
Bibliography
1 References for Chapter I
H.Kamerlingh Onnes, Akad. von Wetenschappen (Amsterdam) 14, 113, 818 (1911)
A. B.Pippard, I E E E Trans. Mag. MAG-23, pp371-375 (1987) and other papers
in the same volume
L.N. Cooper, I E E E Trans. Mag. MAG=23, pp376-379 (1987)
J.E.Kunzler, I E E E Trans. Mag. MAG=23, pp396-402 (1987)
E . M.Savitskii, V.V.Baron, Y.V.Efimov, M.LBychkova, and L.F.Myzenkova , "Su-_
perconducting Materials " , Plenum (1981) (trans, from Russian)
J.C.Phillips, "Physics of High Tc Superconductors" , Academic Press, (1989) ISBN
0-12-553990-8
B. T.Matthias, T.H.Geballe and V.B.Compton, Rev. Mod. Phys. 35, ppl-22
(1963)
M.Tinkham, "Introduction to Superconductivity", McGraw-Hill, New York, (1975)
Reprint 1980, R.E.Krieger Publishing, ISBN 0-89874-049-5
C. Kittel, "Introduction to Solid State Physics", John Wiley and Sons, (1953),
ISBN 0-471-49024-5
W.Meissner and R.Ochsenfeld, Naturwissenschaften 21, p787 (1933) (In German).
F. B.Silsbee, J . Wash. Acad. Sci. 6, pp597-602 (1916)
N.E.Phillips, Physical Review 114, pp676-685 (1959)
F. and H. London, Proc. Roy. Soc. (London) A14§, p72 (1935)
L.Landau, Phys. Rev. 60, pp356-358 (1941)
E.Laurmann and D.Schoenberg, Proc. Roy. Soc. (London) A198, pp560-581
(1949)
120
A.B. Pippard, Proc. Roy. Soc. (London) A216, p547 (1953)
V.L.Ginzburg, II Nuovo Cimento Serie 10 2, ppl234-1250 (1955)
L.D.Landau and V.L Ginzburg, J E T P (USSR) 20, pl064 (1950) translation in: "Men of Physics, L.D.Landau vl , Selected readings in Physics",
ed. D. ter Haar, Pergamon (1965)
L.P.Gor'kov and T.K.Melik-Barkhydarov, Soviet Physics JETP 18, pl031 (1964)
H.Trauble and U.Essmann, Phys. Stat. Sol. 25, pp373-393 (1968) (in German)
A.A.Abrikosov, Soviet Physics J E T P 5, ppll74-1182 (1957)
R.A.Craven, G.A.Thomas, and R.D.Parks, Phys. Rev. B 7, ppl57-165 (1973)
R.A.Ferrell and H.Schmidt, Physics Letters 25A, p544 (1967)
R.G.Glover, Physics Letters 25A, pp542-544 (1967)
L.N.Cooper, Phys. Rev. 104, pll89-90 (1956)
J.Bardeen, L.N.Cooper, and J.R.Schriefrer, Phys. Rev. 108, ppll75-1204 (1957)
N.N.Bogoliubov, II Nuovo Cimento V I I , pp794-805 (1958)
P.W.Anderson, Phys. Rev. 110, pp985-986 (1958)
G.Rickayzen, table on p73 in Chapter 2 of "Superconductivity" Ed. Parks, Marcel
Dekker Inc. (1969)
L.C.Hebel and C.P.SUchter, Phys. Rev. 113, ppl504-1519 (1959)
J.Bardeen and J.R.Schrieffer, Chapter 6 in Prog, in Low. Temp. Phys vol. I l l ,
(Ed. Gorter), North Holland, Amsterdam, (1961)
J.C.Phillips, Phys. Rev. Lett. 10, pp96-98 (1963)
P.C.Martin, p374 in Chapter 7 of "Superconductivity" Ed. Parks, Marcel Dekker
Inc. (1969)
P.W.Anderson, Phys. Rev. 110, pp827-835 (1958)
121
P.W.Anderson, Phys. Rev. 112, ppl900-1906 (1958)
K.Yosida, Prog. Theor. Phys. 21, pp731-744 (1959)
D.J.Thouless and D.R.Tilley, Proc. Phys. Soc. 77, ppll75-1181 (1961)
A. J.Leggett, Prog. Theor. Phys. 36, pp901-930 (1966)
D. C.Mattis and J.Bardeen, Phys. Rev. I l l , pp412-417 (1958)
M.Tinkham and R.A.FerreU, Phys. Rev. Lett. 2, pp331-333 (1959)
S.Nakajima, Prog. Theor. Phys. 22, pp430-436 (1959)
C.Kittel, "Introduction to Solid State Physics", John Wiley and Sons, (1953),.
ISBN 0-471-49024-5
2 References for Chapter II
"Ternary Superconductors ", Ed. Shenoy, Dunlap, Fradin, North Holland, (1980)
B. T.Matthias, T.H.Geballe and V.B.Compton, Rev. Mod. Phys. 35, ppl-22 and
references therein.
A.W.Sleight, J.L.Gillson and P.E.Bierstedt, Solid State Comms. 17, pp27-28
(1975)
E . M.Savitskii, V.V.Baron, Y.V.Efimov, M.I.Bychkova, and L.F.Myzenkova , "Su
perconducting Materials " , Plenum (1981) (trans, from Russian)
J.G.Bednorz and K.A.Miiller, Z. Phys B64, pl89 (1986)
J.G.Bednorz and K.A.MiiUer, Rev. Mod. Phys. 60, pp585-600 (1988)
N.B.Brandt and N.I.Ginzburg, Contemp. Phys. 10, pp355-384 (1969)
C. W.Chu, RH.Hor, R.L.Meng, L.Gao, Z.J.Huang, and Y.Q.Wang, Phys. . Rev.
Lett. 58, pp405-407 (1987)
M.K.Wu, J.R.Ashburn, C.J.Torng, RH.Hor, R.L.Meng, L.Gao, Z.J.Huang,
Y.Q.Wang and C.W.Ohu, Phys. Rev. Lett. 58, pp908-910 (1987)
122
D.G.Hinks, L.Soderholm, D.W.Capone II, J.D.Jorgensen, Ivan K.Schuller, C. U.Segre, K.Zhang, and J.D.Grace, Appl. Phys. Lett. 50, ppl688-169G (1987)
H.Maeda, Y.Tanaka, M.Fukutomi, and T.Asano, Jap. J . App. Physics 27, pp209-210
Z.Z.Sheng and A.M.Hermann, Nature 332, pp55-58 (1988)
M.B.Maple, Y.Dalichaouch, J.M.Ferreira, R.R.Hake, B.W.Lee, J.J.Neumeier,
M.S.TorikachviU, K.N.Yang, H.Zhou, R.P.Guertin and M.V.Kuric, Physica 148B,
ppl55-162 (1987)
R.J.Cava. J.J.Krajewski, W.F.Peck Jr., B.Batlogg, and L.W.Rupp Jr., Physica C
159, pp372-374 (1989)
T.Miyatake, K.Yamaguchi, T.Takata, S.Gotoh, N.Koshizuka and S.Tanaka, Phys
ica C 160, pp541-544 (1989)
D. E.Morris, J.H.Nickel, J.Y.T.Wei, N.G.Asmar, J.S.Scott, U.M.Scheven,
C. T.Hultgren, A.G.Markelz, J.E.Post, P.J.Heaney, D.R.Veblen and R.M.Hazen,
Phys. Rev. B 39, pp7347-7350 (1989)
M.Tinkham and C.J.Lobb, Solid State Physics 42, pp91-134
MRS Symposium proceedings v99, Ed. M.B.Brodsky, R.C.Dynes, K.Kitazawa,
and H.L.Tuller, (1988)
"High Temperature Superconductivity, proceedings of the Los Alamos Symposium
1989" Ed. K.S.Bedell, D.Coffey, D.E.Meltzer, D.Pines and J.R.Schrieffer, Addison-
Wesley (1990) ISBN 0-201-51249-1
D. M.Ginsberg (Ed.), "Physical properties of High Tc superconductors vol 1",
World Scientific, Singapore (1989) ISBN 9971-50-683-1
M.Ain, W.Reichardt, B.Hennion, G.Pepy, and B.M.Wanklyn, Physica C 162-164,
ppl279-1280 (1989)
R.J.Birgeneau and G.Shirane, Chapter 4 in "Physical properties of High Tc super
conductors vol 1 ",(Ed,) D.M.Ginsberg , World Scientific, Singapore (1989) ISBN
123
9971-50-683-1
K.Yvon and M.Frangois, Z.Phys B 76, pp413-444 (1989)
I.K.SchuUer and J.D.Jorgensen, MRS Bulletin, Jan 1989
G. Calestani and C.Rizzoli, Nature 328, pp606-607 (1987)
E.D.Specht, C.J.Sparks, A.G.Dhere, J.Brynestad, O.B.Cavin, D.M.Kroeger, and H. A.Oye, Phys. Rev. B 37, pp7426-7434 (1988)
Y.Kubo, Y.Nakabayashi, J.Tabuchi, T.Yoshitake, T.Manako, A.Ochi, K.Utsumi, H.Igarashi, and M.Yonezawa, Mat. Res. Soc. Symp. Proc. v99, pp89-100
U.Welp, M.Grimsditch, H.You, W.K.Kwok, M.M.Fang, G.W.Crabtree,
and J.Z.Liu, Physica C 161, ppl-5 (1989)
P.K.Gallagher, Advanced Ceramic Materials 2, No. 3B, Special Issue, pp632-648
(1987)
J.Karpinski, C.Beeli, E.Kaldis, A.Wisard, E.Jilek, Physica C 153-155, pp830-831
(1988)
J.Karpinski, K.Conder and E.Kaldis, Physica C 153-155, pp401-402 (1988)
K.N.Tu, N.C.Yeh, S.I.Park, and C.C.Tsuei, Phys. Rev. B 39, pp304-314 (1989)
B-J. Lee and D.N.Lee, J . Amer. Ceram. Soc. 72, pp314-319 (1989)
M.Maeda, M.Kadoi, and T.Ikeda, Jap. J . App. Phys. 28, ppl417-1420 (1989)
R.Beyers, B.T.Ahn, G.Gorman, V.Y.Lee, S.S.P.Parkin, M.L.Ramirez, K.P.Roche,
J.E.Vazquez, T.M.Gur and R.A.Higgins, Nature 340, pp619-621 (1989)
J.D.Jorgensen, B.W.Veal, A.P.Paulikas, L.J.Nowicki, G.W.Crabtree, H.Claus, and
W.K.Kwok, Phys. R§v. B 41, ppl863-1877 (1990)
M.R.Delap, Private Communication.
T.Penney, S.von Molnar, D.Kaiser, F.Holtzberg, and A.W.Kleinsasser, Phys. Rev.
B 38, pp2918-2921
124
H.E.Fischer, S.K.Watson and D.G.Cahill, Comments on Condensed Matter Physics
14, pp65-127 (1988)
S.W.Tozer, A.W.Kleinsasser, T.Penney, D.Kaiser, and F.Holtzberg, Phys. Rev.
Lett. 59, ppl768-1771 (1987) '
S.Martin, A.T.Fiory, R.M.Fleming, L.F.Schneemeyer, and J.V.Waszczak, Phys.
Rev. B 41, pp846-849 (1990)
E.M.Forgan, S.L.Lee, S.Sutton, F.Wellhofer, J.S.Abell, C.E.Gough, S.F.J.Cox, and
C. A.Scott, Supercond. Sci. Technol. 3, pp217-221 (1990)
M.Hikita and M.Suzuki, Phys Rev. B. 41, ppS34-837 (1990)
L.Fruchter, C.Giovannella, G.Collin, and I.A.Campbell, Physica C 156, pp69-72
(1988)
W.J.Gallagher, T .K Worthington, T.R.Dinger, F.Holtzberg, D.L.Kaiser, and
R.L.Sandstrom, Physica 148B, pp228-232 (1987)
J.S.Tsai, I.Takeuchi, J.Fujita, T.Yoshitake, S.Miura, S.Tanaka, T.Terashima,
Y.Bando, K.Iijima and K.Yamamoto, Physica C 153»155, ppl385-1386 (1988)
D. E.MacLaughlin, Solid State Physics 31, ppl-69 (1976)
S.E.Barrett, J.A.Martindale, D.J.Durand, C.H.Pennington, C.P.Slichter,
T.A.Priedmann, J.P.Rice, and D.M.Ginsberg, Phys. Rev. Lett. 66, ppl08-lll
(1991)
R.F.Kiefl, J.H.Brewer, LAffleck, J.F.Carolan, P.Dosanjh, W.N.Hardy, T.Hsu,
RKadono, J.R.Kempton, S.R.Kreitzman, Q.Li, A.H.O'Reilly, T.M.Riseman,
P.Schleger, P.C.E.Stamp, H.Zhou, L.P.Le, G.M.Luke, B.SternUeb, Y.J.Uemura,
H.R.Hart, and K.W.Lay, Phys. Rev. Lett. 64, pp2082-2085 (1990)
B.Batlogg, pp37-93 in "High Temperature Superconductivity", proceedings of the
Los Alamos Symposium 1989 Ed. K.S.Bedeil, D.CofFey, D.E.Meltzer, D.Pines and
J.R.SchriefFer, Addison-Wesley (1990) ISBN 0-201-51249-1
125
T.Timusk and D.B.Tanner, Chapter 7 in "Physical properties of High Tc super
conductors" vol 1, Ed. D.M.Ginsberg , World Scientific, Singapore (1989) ISBN
9971-50-683-1
T.Wolf, W.Goldacker, B.Obst, G.Roth, and R.Flukiger, J . Crystal Growth 96,
pplOlO-1018 (1989)
H.J.Scheel, J . of the Less Common Metals 150, p219 (1989)
Matthey Catalogue Sales, Orchard Rd., Royston, Hertfordshire SG8 5H8
Degussa Ltd., Paul Ungerer House, Earl Rd., Stanley Green, Handforth, Wilmslow,
Cheshire SK9 3RL [
Specac Ltd., Cambridge Electronic Industries pic. River House, Lagoon Rd., St.
Mary Cray, Orpington BR5 3QX
Agar Scientific Ltd., 66a Cambridge Rd., Stansted, Essex CM24 8DA
H.C.Montgomery, Jour. Appl. Phys. 42, pp2971-2975 (1971)
3 References for Chapter III
P.C.Martin, Physical Review 161, ppl43-155 (1967)
P.Burlet, A.Dinia, S.Quezel, W.A.C.Erkelens, J.Rossat-Mignod, R.Horyn, O.Pena,
C.Geantet, M.Sergent, and J.L.Genicon, Physica 148B, pp99-105 (1987)
O.Scharpf, H.Capellmann, T.Briickel, A.Comberg, and H.Passing, Z. Phys. B 78,
pp345-359 (1990)
T.Briickei, H.Capellmeinn, W.Just, O.Scharpf, S.Kemmler-Sack, R.Kiemel, and
W.Schaefer, Europhys. Lett. 4, ppll89-1194 (1987)
J.J.M.Franse, A.Menovsky, A.de Visser, C.D.Bredl, U.Gottwick, W.Lieke, .
H.M.Mayer, U.Rauchschwalbe, G.Spam, and F.StegUch, Z. Phys B 59, ppl5-19
(1985)
R.Joynt and T.M.Rice, Phys. Rev. B 38, pp2345-2353 (1988)
126
J.M.Tranquada and G.Shirane, Physica C 162-164, pp849-852 (1989)
R.J. Birgenau and G. Shirane, Chapter 4 in "Physical Properties of High Tc Superconductors vl", Ed. D.M.Ginsberg, World Scientific (1989)
J.Schelten, H.Ullmaier, and W.Schmatz, Phys. Stat. Sol. B 48, pp619-628 (1971)
D. K.Christen, H.R.Kerchner, S.T.SekuIa, and P.Thorel, Phys. Rev B 21, ppl02-
117
E . M.Forgan, D.McK.PauI, H.A.Mook, P.A.Timmins, H.Keller, S.Sutton and J.S.Abell , Nature 343, pp735-737 (1990)
A.Mansour, R.O.Hilleke, G.P.Felcher, R.B.Laibowitz, P.Chaudhari and S.S.P.Parkin , Physica B 156-157, pp867-890 (1989)
P.B.AUen, Physical Review B6, pp2577-2579 (1972)
G.Shirane, J.D.Axe, and S.M.Shapiro, Solid State Comms. 13, ppl893-1895 (1973)
RYoungblood, Y.Noda, and G.Shirane, Solid State Comms. 27, ppl433-1435
(1978)
J.D.Axe and G.Shirahe, Phys. Rev. B 8, ppl965-1977 (1973)
W.Reichardt, D.Ewert, E.Gering, F.Gompf, L.Pintschovius, B.Renker, G.Collin, A.J.Dianoux, and H.Mutka, Physica B 156 + 157, pp897-901 (1989)
K.Sasaki and Y.Obata, Supp. Prog. Theor. Phys. 69, pp406-419 (1980)
A.K.Rajagopal, S.D.Mahanti, and W.Jin, Solid State Comms. 69, pp847-849
(1989)
A.K.Rajagopal, W.Jin, and S.D.Mahanti, Physica C 162-164, pp247-248 (1989)
W.Jin, S.D.Mahanti, and A.K.Rajagopal, Solid State Comms. 71, pp967-971
(1989) •
A.Junod, A.Bezinge, T.Graf, J.L.Jorda, J.Muller, L.Antognazza, D.Cattani, J.Cors, M.Decroux, 0 .Fischer, M.Banovski, P.Genoud, L.Hoffmann, A.A.Manuel, M.Peter, E.Walker, M^Fran^ois, and K.Yvon, Europhys. Lett. 4, pp247-252 (1987)
127
N.R.Bernhoeft, Private Communication
4 References for Chapter IV
C.G.Windsor, J.Appl. Cryst. 21, pp582-588 (1988)
N.R.Bernhoeft, Ph.D. Thesis, University of Cambridge (1982)
S.W.Lovesey, pl20 in "Theory of Neutron Scattering from Condensed Matter vl",
Clarendon Press, Oxford, (1984) ISBN 0-19-852015-8
J.W.Lynn, W-H.Li, Q.Li, H.C.Ku, H.D.Yang, and R.N.Shelton, Phys Rev B, 36
pp2374-2377
L.N.Bulaevskii and A.I.Buzdin, Physica C 153-155, ppl651.1652 (1988)
L.A.Axelrod, G.P.Gordeev, I.M.Lazebnik, V.T.Lebedev, S.V.Maleyev,
A.I.Okorokov, V.V.Runov, V.N.Slyusar, B.P.Toperverg, A.D.Tretyakov, and
R.Z.Yagud, Materials Science Forum 27-28, pp273-278 (1988)
R.Kahn, A.Brulet, G.Collin, and B.Farnoux, Physica C 159, pp323-328 (1989)
G.L.Squires, "Introduction to the Theory of Thermal Neutron Scattering ", Cambridge Univ. Press, Cambridge, (1978) ISBN 0-521-21884-5
W.I.F.David, P.P.Edwards, M.RHarrison, R.Jones, and C.C.Wilson, Nature 331,
pp245-247 (1988)
5 References for Chapter V
T.Briickel, H.Capellnaann, W.Just, O.Scharpf, S.Kemmler-Sack, R.Kiemel, and
W.Schaefer, Europhys. Lett. 4, ppll89-1194 (1987)
6 References for Chapter VI
C.Kittel, Introduction to Solid State Physics (5th edition), John Wiley and sons
(1976) ISBN 0-471-49024-5
J.C.Phillips, Physics of High Tc Superconductors, Academic Press, (1989) ISBN
0-12-553990-8
128
G.Kostorz and S.W.Lovesey, Chapter 1 in Treatise on materials science and technology vl5, Neutron scattering, G.Kostorz (Ed.), Academic Press (1979) ISBN 0-12-341815-1
S.W.Lovesey, Theory of Neutron Scattering from Condensed Matter, OUP (1984) ISBN 0-19-852028-X
R.Youngblood, Y.Noda, and G.Shirane, Solid State Comms. 27, ppl433-1435 (1978)
G.Shirane, J.D.Axe, and S.M.Shapiro, SoUd State Comms. 13, ppl893-1895 (1973)
Y.Nakagawa and A.D.B.Woods, Phys. Rev. Lett. 11, pp271-274 (1963)
129
Appendix A
Neutron Cross-Section Derivation
A . l Introduction
The purpose of this appendix is to give as straightforward as possible a pre
sentation of the steps leading to the cross-section formula for neutron scattering
quoted in chapter III. This subject is fraught with subtleties and these will be
studiously avoided if at all possible: c.g.s units are used to enable comparison with
the references.
A.2 Neutron cross-section from conductivity fluctuations
The quantity we wish to calculate is the magnetic neutron scattering cross-
section for an unpolarized beam given by (e.g. Sasaki) :-
: ^ = 487r3ft2^2„^<|B(q''^)l)
where 7 is the neutron gyromagnetic ratio , n the number of atoms per unit
volume, and k and k' are the moduli of the incident and outgoing neutron wavevec
tors.
( |B(q,a')p) is the Fourier transform of the unsymmetrised magnetic field
autocorrelation function, averaged over a long time and a large volume, (see e.g.
Lovesey)
A.2.1 The Martin results
Here the paper of Martin becomes useful (Martin), as he calculates XBB for
an isotropic system in terms of the transverse conductivity ^ .
The imaginary part of XBB can be readily related to the magnetic field -
magnetic field (BB) correlation function seen above to be essentially the neutron
^ The transverse conductivity is the conductivity that enters into discussions of propagating EM waves in a medium, giving damping cind a phase shift.
130
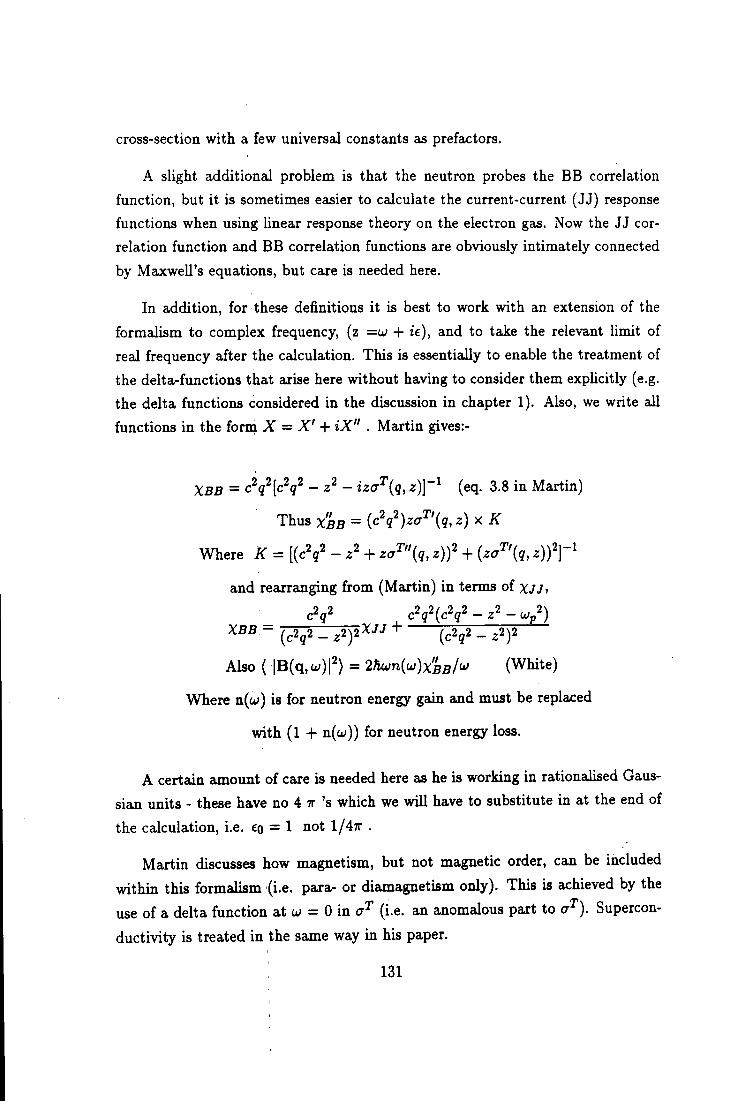
cross-section with a few universal constants as prefactors.
A slight additional problem is that the neutron probes the BB correlation function, but it is sometimes easier to calculate the current-current (JJ) response functions when using linear response theory on the electron gas. Now the JJ correlation function and BB correlation functions are obviously intimately connected by Maxwell's equations, but care is needed here.
In addition, for these definitions it is best to work with an extension of the formalism to complex frequency, (z =u) + ie), and to take the relevant limit of real frequency after the calculation. This is essentially to enable the treatment of the delta-functions that arise here without having to consider them explicitly (e.g. the delta functions considered in the discussion in chapter 1). Also, we write all functions in the fomi X = X' + iX" . Martin gives:-
XBB = c ? [c 9 - - izcT^{q, z)]~^ (eq. 3.8 in Martin)
Thusx5B = (cVW^'(9,^)x^
Where K = [(c^q^ - + z<7^"(?, z))^ + {za^'{q, z)f]-^
and rearranging from (Martin) in terms of x j j ,
_ _ c V _ ^ , c V ( c V - . ^ - V ) ~ (c2g2 _ z^)2^'^'^ ^ (c2g2 _ ^2)2
Also ( |B(q, u;)|2) = 2hun{u)xBB/^ (White)
Where n(a>) is for neutron energy gain and must be replaced
with (1 -I- n{u)) for neutron energy loss.
A certain amount of care is needed here as he is working in rationalised Gaus
sian units - these have no 4 T T ' s which we will have to substitute in at the end of
the calculation, i.e. €Q = 1 not l/47r .
Martin discusses how magnetism, but not magnetic order, can be included
within this formalism (i.e. para- or diamagnetism only). This is achieved by the
use of a delta function at a; = 0 in a- (i.e. an anomalous part to <T ). Supercon
ductivity is treated in the same way in his paper.
131
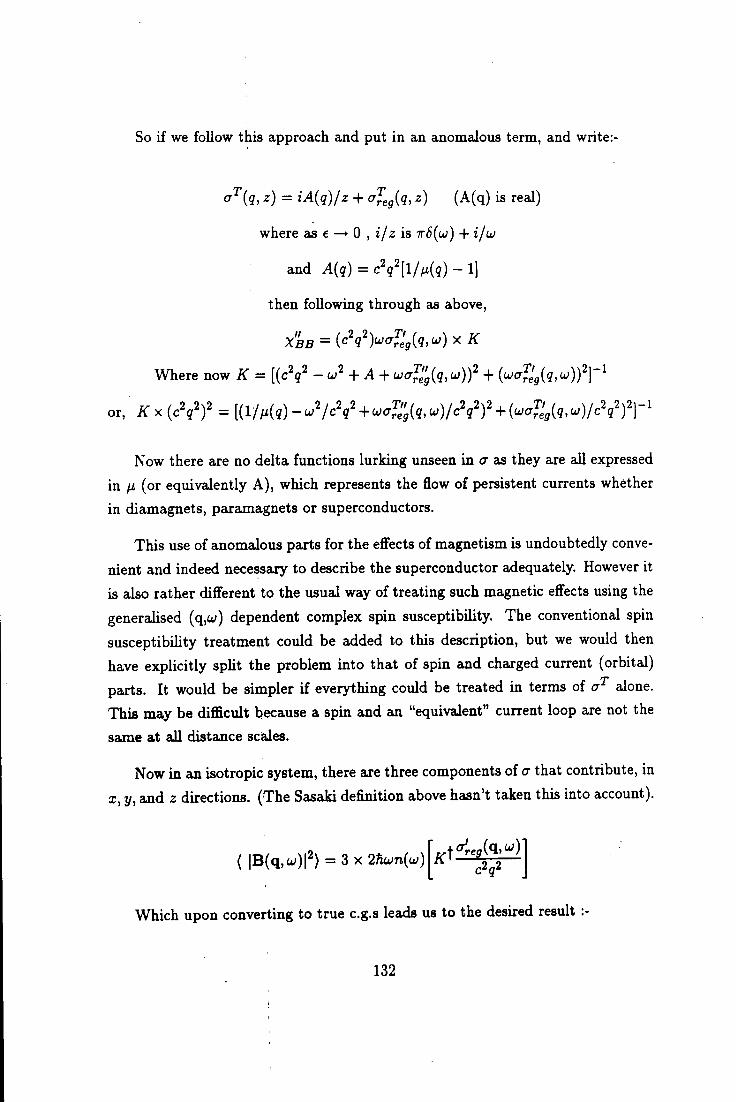
So if we follow this approach and put in an anomalous term, and write:-
a^{q, z) = iA{q)/z -h aj,g{q, z) (A(q) is real)
where as e 0 , is T r 6 { u j ) + i/u
and A{q) = c'q'[l/f,{q) - 1]
then following through as above,
X s B = (cV)'^^r%(?,U')x/f
Where now K = [{0^ - + A + u;a^^'g{q,u)f + {uj<j^lg{q,uj)f]-'
or. if x(c2g2)2 = [illj,iq)-Jlc\'^ua^l'^{q,u)lc\^^^
Now there are no delta functions lurking unseen in a as they are all expressed
in n (or equivalently A), which represents the flow of persistent currents whether
in diamagnets, paramagnets or superconductors.
This use of anomalous parts for the effects of magnetism is undoubtedly conve
nient and indeed necessary to describe the superconductor adequately. However it
is also rather different to the usual way of treating such magnetic effects using the
generalised (q,a/) dependent complex spin susceptibility. The conventional spin
susceptibility treatment could be added to this description, but we would then
have explicitly split the problem into that of spin and charged current (orbital)
parts. It would be simpler if everything could be treated in terms of alone.
This may be difficult because a spin and an "equivalent" current loop are not the
same at all distance sciaJes.
Now in an isotropic system, there are three components of <y that contribute, in
X, y, and z directions. (The Sasaki definition above hasn't taken this into account).
( \B{q,u)\^) = Sx2tiun{u)
Which upon converting to true c.g.s leads us to the desired result :-
132
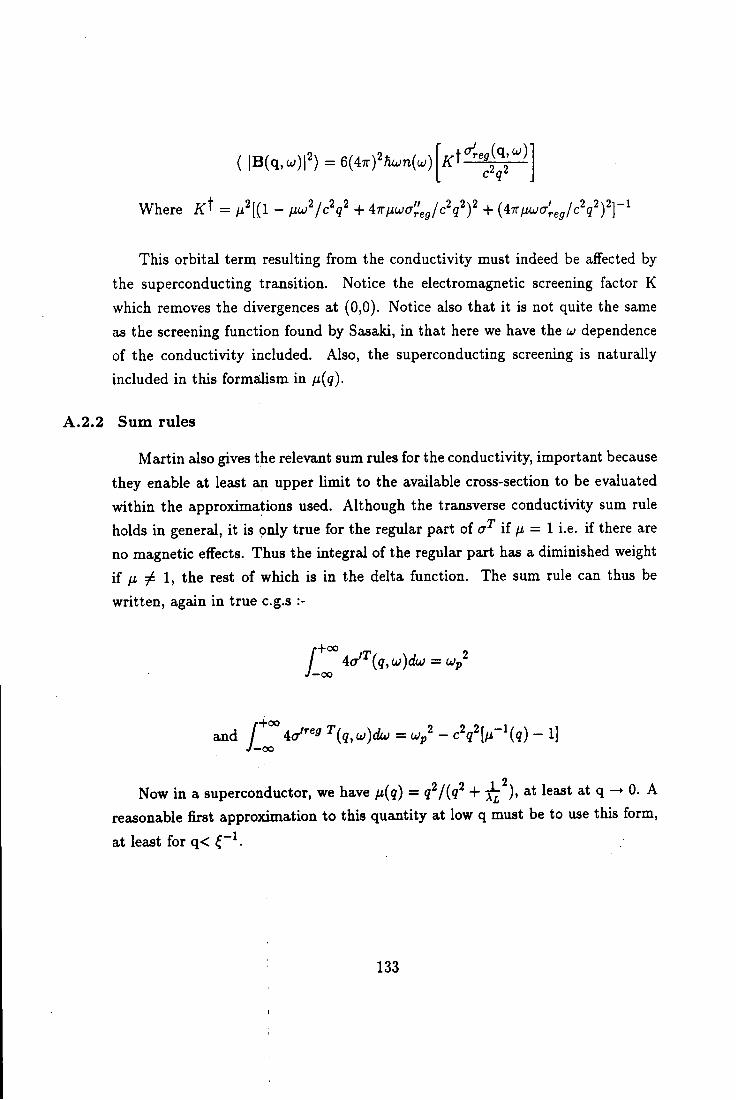
( |B(q,u;)|2) =6(47r)2^a;n(u;) '^rea(q.'^)
Where = ti'^[{l - fiu^/c^q^ + 47r/ia;<g/c2g2)2 + {^TrfMua'^^g/c\^)Y^
This orbital term resulting from the conductivity must indeed be affected by the superconducting transition. Notice the electromagnetic screening factor K which removes the divergences at (0,0). Notice also that it is not quite the same as the screening function found by Sasaki, in that here we have the w dependence of the conductivity included. Also, the superconducting screening is naturally included in this formaiJism in /x(g).
A.2.2 Sum rules
Martin also gives the relevant sum rules for the conductivity, important because they enable at least an upper limit to the available cross-section to be evaluated within the approximations used. Although the transverse conductivity sum rule holds in general, it is only true for the regular part of a-^ if fi = 1 i.e. if there are no magnetic effects. Thus the integral of the regular part has a diminished weight if fi ^ 1, the rest of which is in the delta function. The sum rule can thus be written, again in true c.g.s :-
T
4(7 (g, uj)duj = Up •oo
4a"'«f ^{q,u)clw = V - c2g2[^-i(^) _ i| •oo
Now in a superconductor, we have fi{q) = q'^/{q^ + JE^^' * at q 0. A reasonable first approximation to this quantity at low q must be to use this form, at least for q<
133
A . 3 References for this Append ix
K.Sasaki and Y.Obata, Supp. Prog. Theor. Phys. 69, pp406-419 (1980)
S.W.Lovesey, Theory of Neutron Scattering from Condensed Matter, OUP (1984) ISBN 0-19-852028-X
P.C.Martin, Physical Review 161, ppl43-155 (1967)
R.M.White, Quantum Theory of Magnetism, McGraw-Hill, New York, (1970)
134
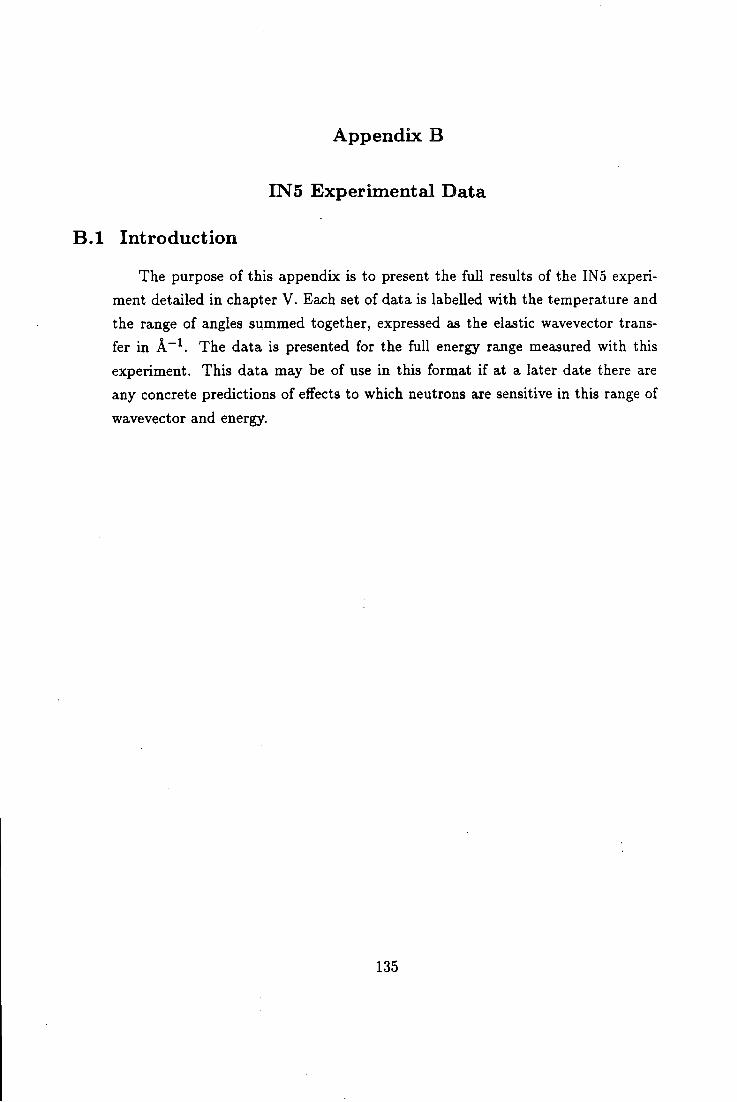
Appendix B
I N S E x p e r i m e n t a l D a t a
B . l Introduct ion
The purpose of this appendix is to present the full results of the INS experiment detailed in chapter V. Each set of data is labelled with the temperature and the range of angles summed together, expressed as the elastic wavevector transfer in A~^. The data is presented for the full energy range measured with this experiment. This data may be of use in this format if at a later date there are any concrete predictions of effects to which neutrons are sensitive in this range of wavevector and energy.
135
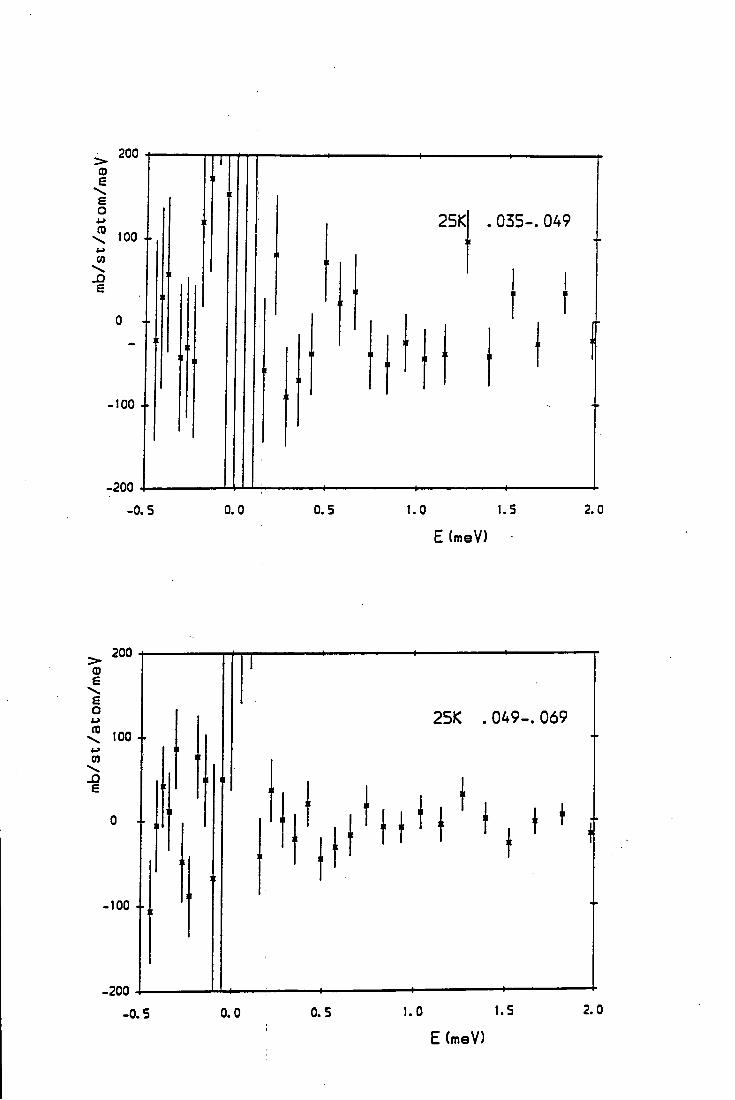
^ 200
£ e o
\ 100
(0 \
0 +
.100 +
-200
-0.5 0.0 0.5
25K . 035-. 049
1.0 1.5 2.0
E (meV)
200 (D
£ O
(0
(I)
£
25K .049-.069
100 +
E (meV)
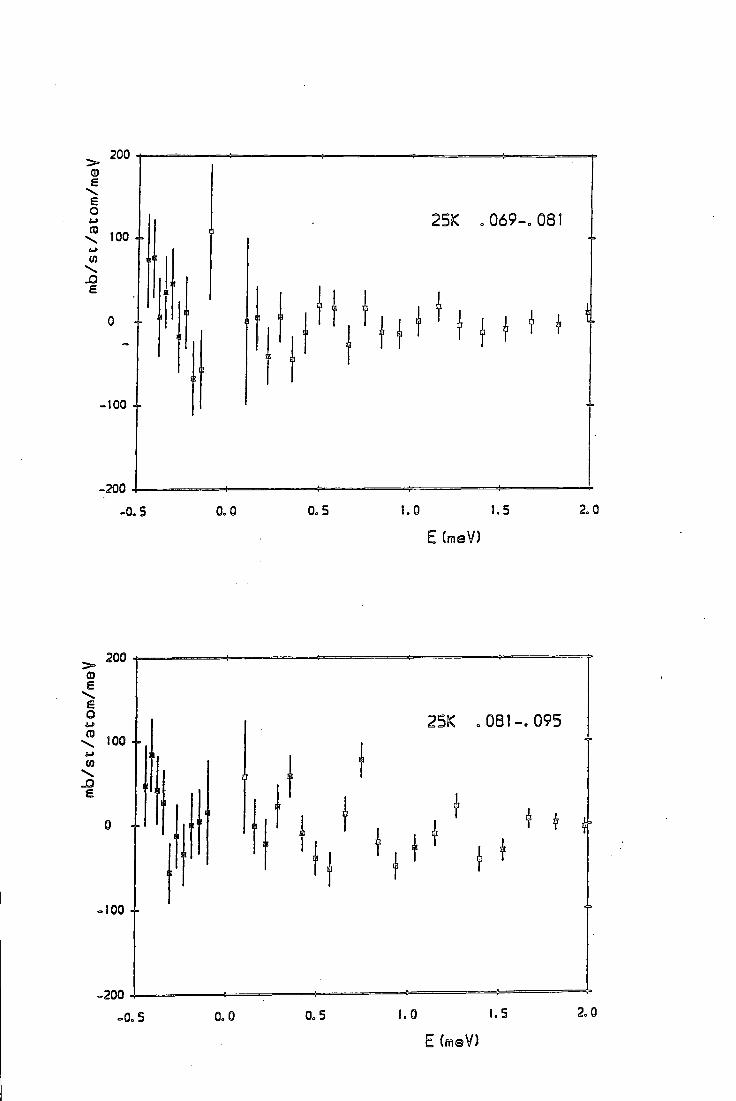
200
£
S
o CO 100
if
-100
-200
-0.5 0.0 0,5
25K ,069=. 081
| | l ' I I I M
1.0 1.5
E (meV)
2.0
e
o (D
\
cu \ J 3 e
200
100
.100
-200
-0.5
2SK o 081=0 095
^ I' } *
0.0 0.5 I.O l . S 2.0
E (m©V)
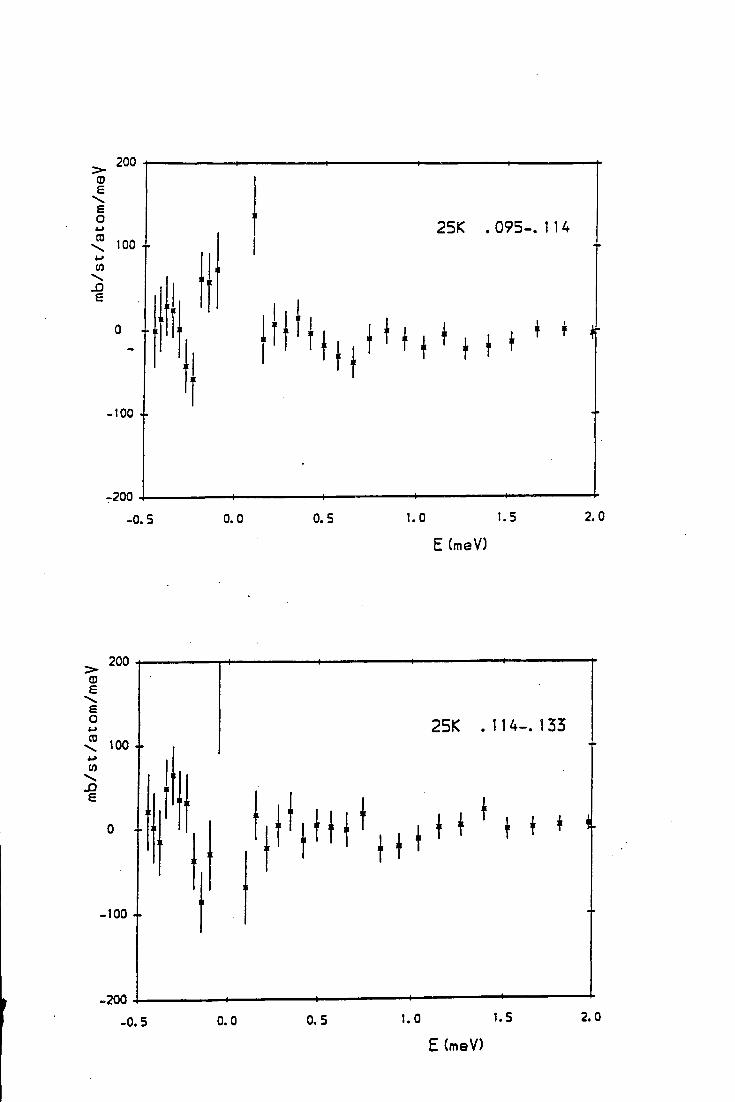
CD £
£ O
CD
CO \
£
25K .095-114
100 +
E (meV)
-200
CD £
£ O <-> CD
0) V.
£
25K .114-.133
E (meV)
-200
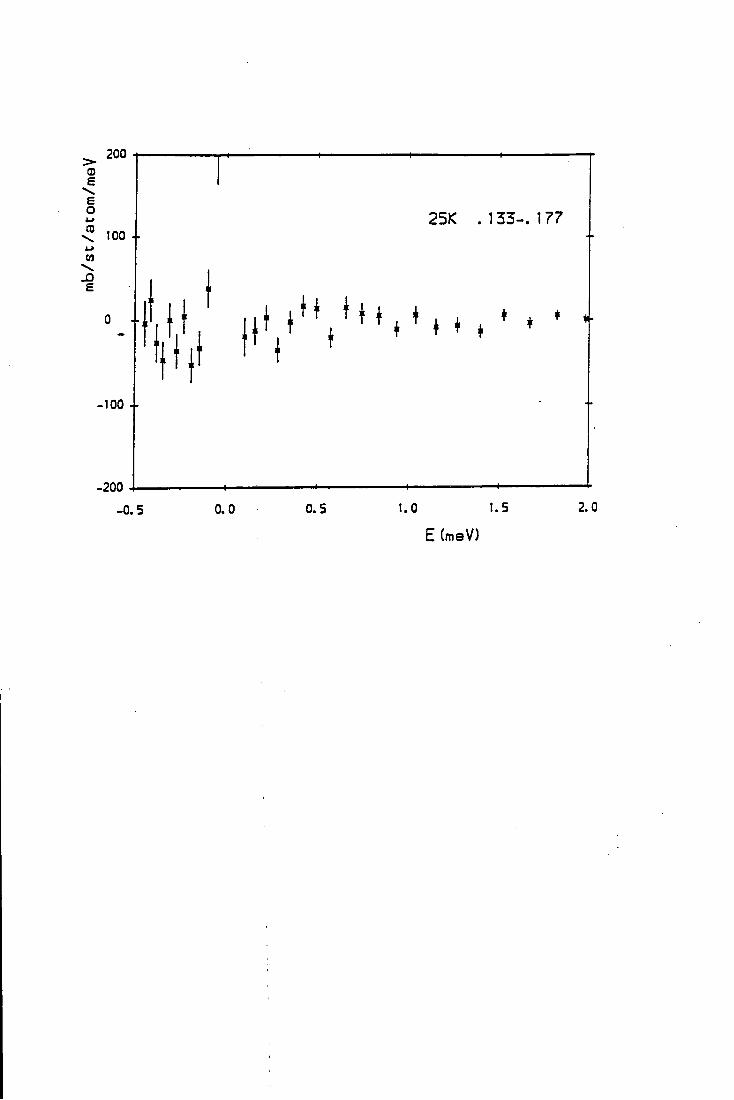
200
^ 100
w
£
0 +
.100 +
-200
25K . 1 5 3 - 1 7 7
• • •
-0.5 0.0 0.5 I.O 1.5 2.0
E (meV)
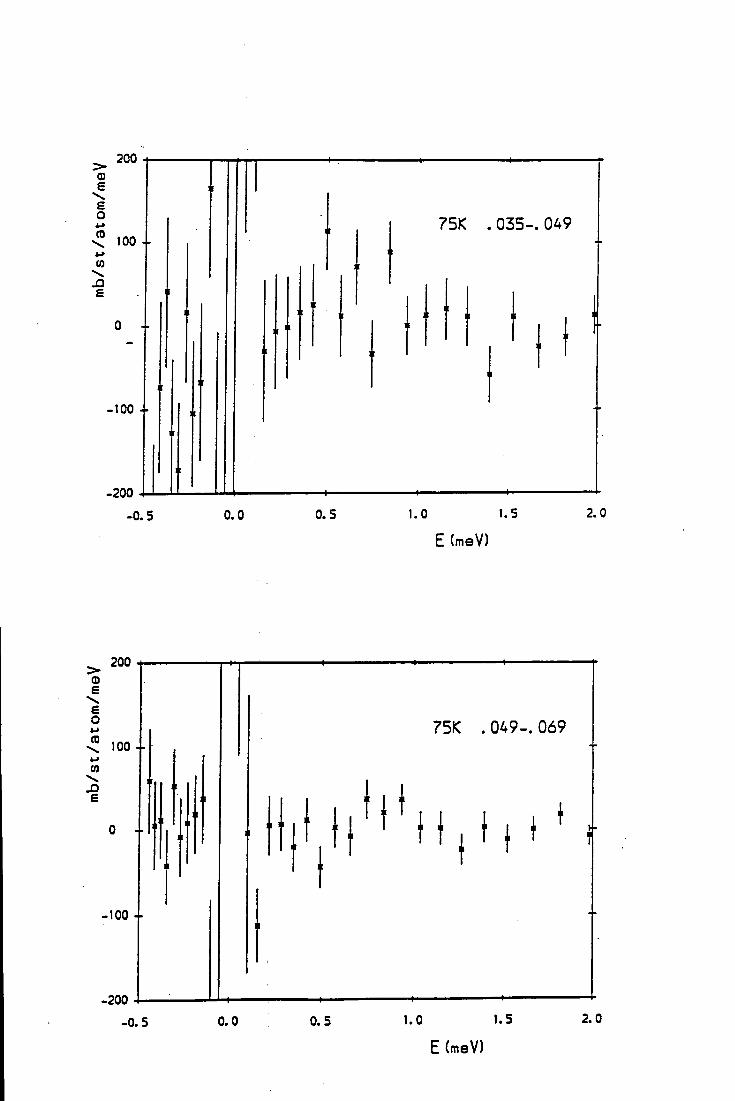
200
£ £ O
CO
CO
£
75K . 0 3 5 - 049
100 +
E (meV)
-200
200
75K . 049-. 069
100 +
E (meV)
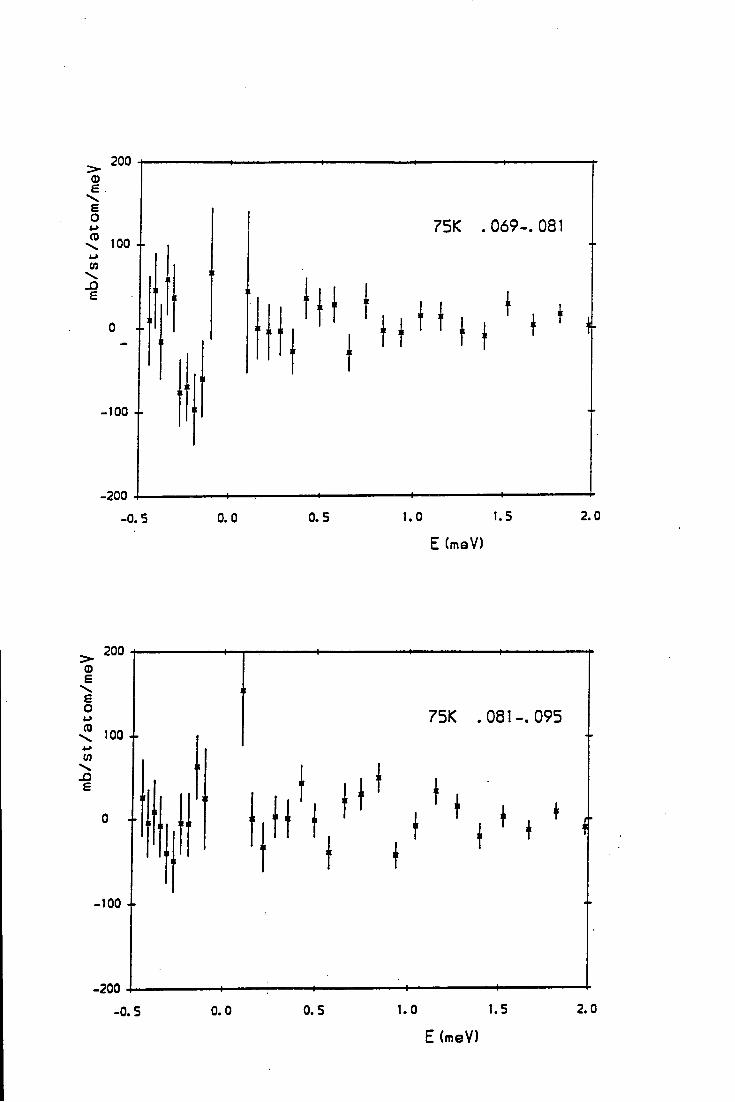
200 (D £ e o «-> CD
CO \
£
100 +
0 +
-100 +
-200
-0.5
75K .069-. 081
^ I I . j ( . , * 1 t
0. 0 0. 5 1.0 1.5 2.0
E (meV)
200 <D £
£ O
CD
CO \
£
75K .081-. 095
1 "
E (meV)
-200
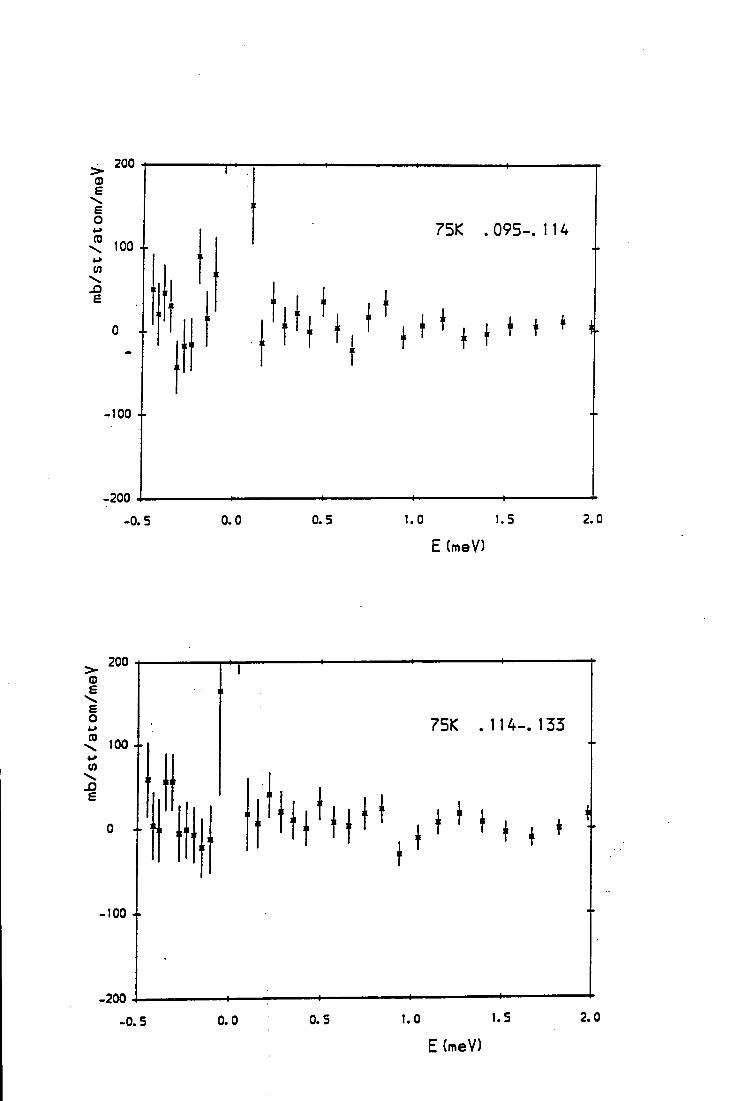
200 CO £ £ O «.> CD
\ >-> CO
\ - O
£
75K . 0 9 5 - 1 1 4
T , .
-200
-0. 5 0.0 0.5 1.0 1.5 2.0
E (meV)
£ £ O i-t CO
CO
£
75K . 1 1 4 - 1 3 3
E (meV)
-200
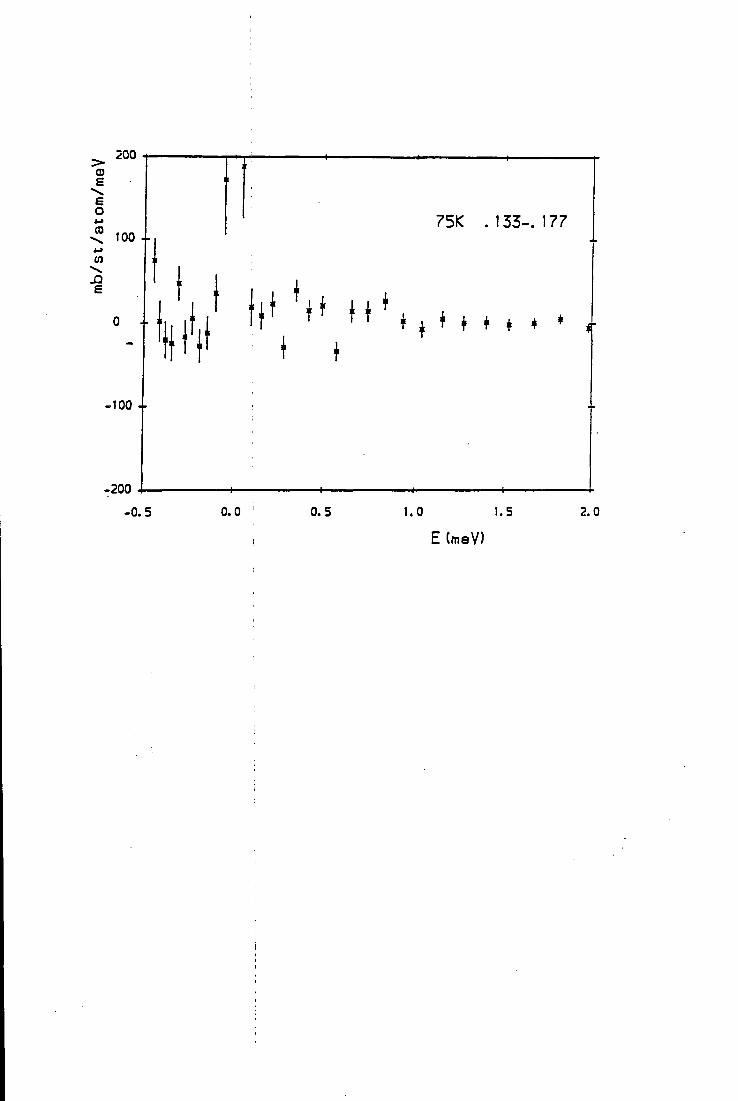
200 (D £
£ O
CO
CO
£
100
0 i
• 100 +
-200
75K .153-. 177
-0.5 0.0 ' 0.5 1.0 1.5 2.0
E (maV)
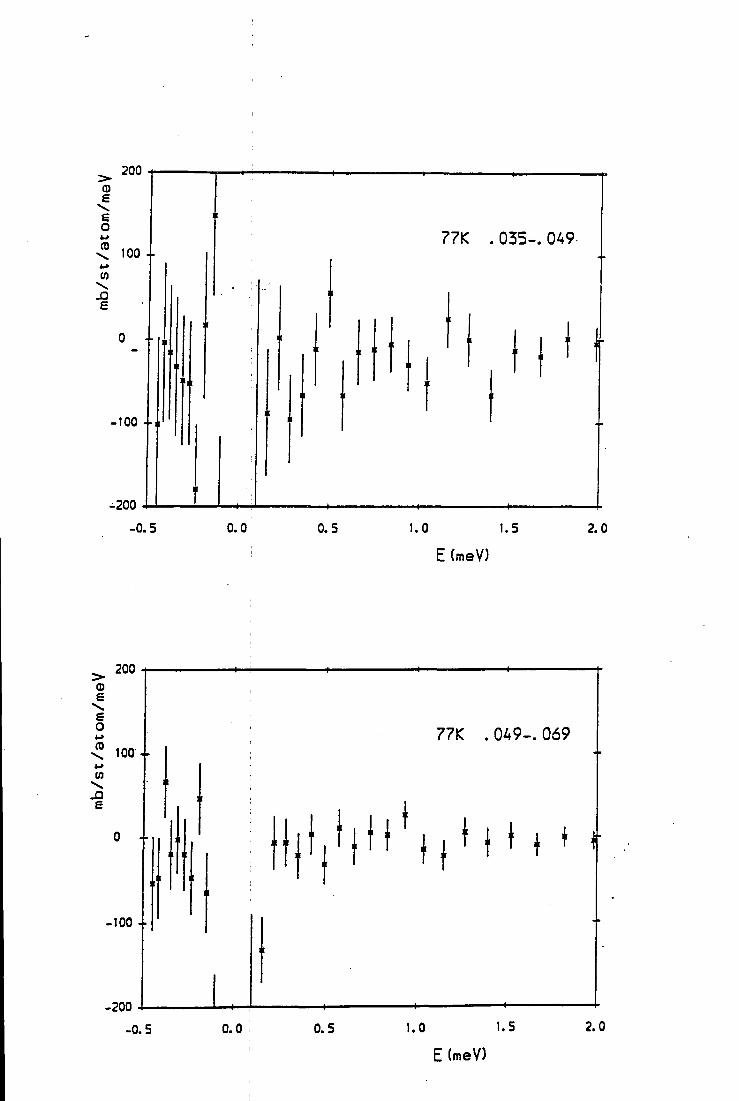
200 CD £
£ O
CD
CO \ j Q £
100
0 +
.100 +•
77K . 0 3 5 - 049-
^200
-0.5 0.0 0.5 1.0 1.5
E (meV)
2.0
77K . 0 4 9 - 069
E (meV)
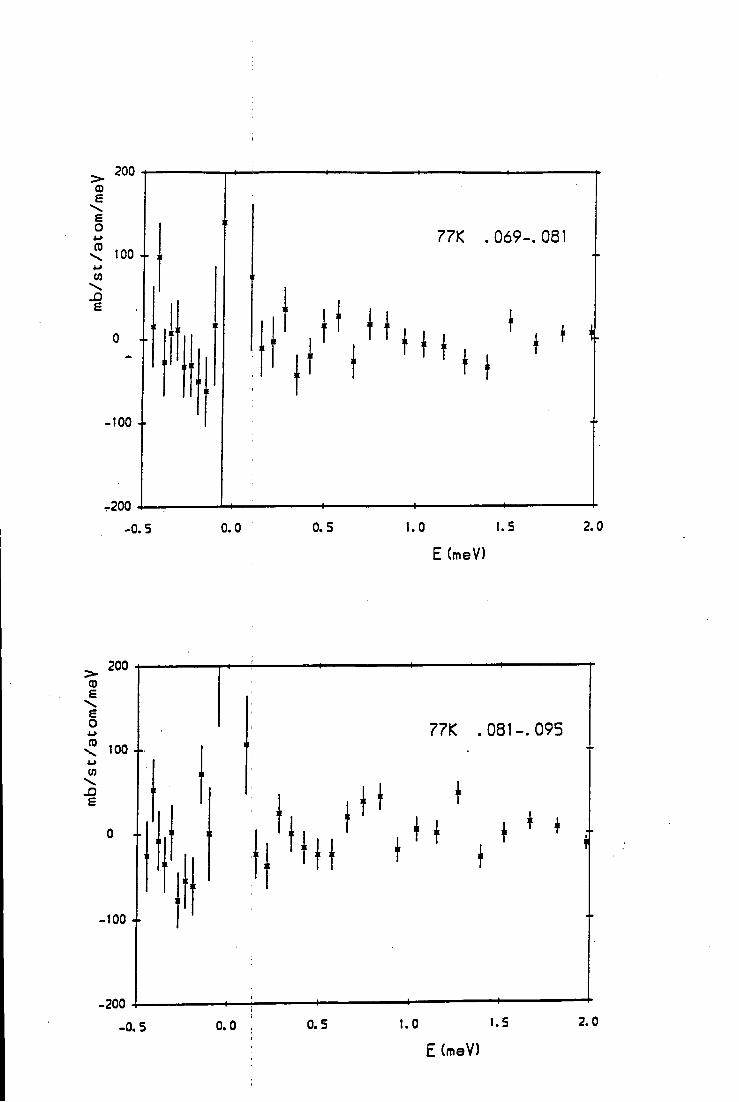
77K .069-. 081
E (meV)
77K .081-.095
\ f
100 +
E (meV)
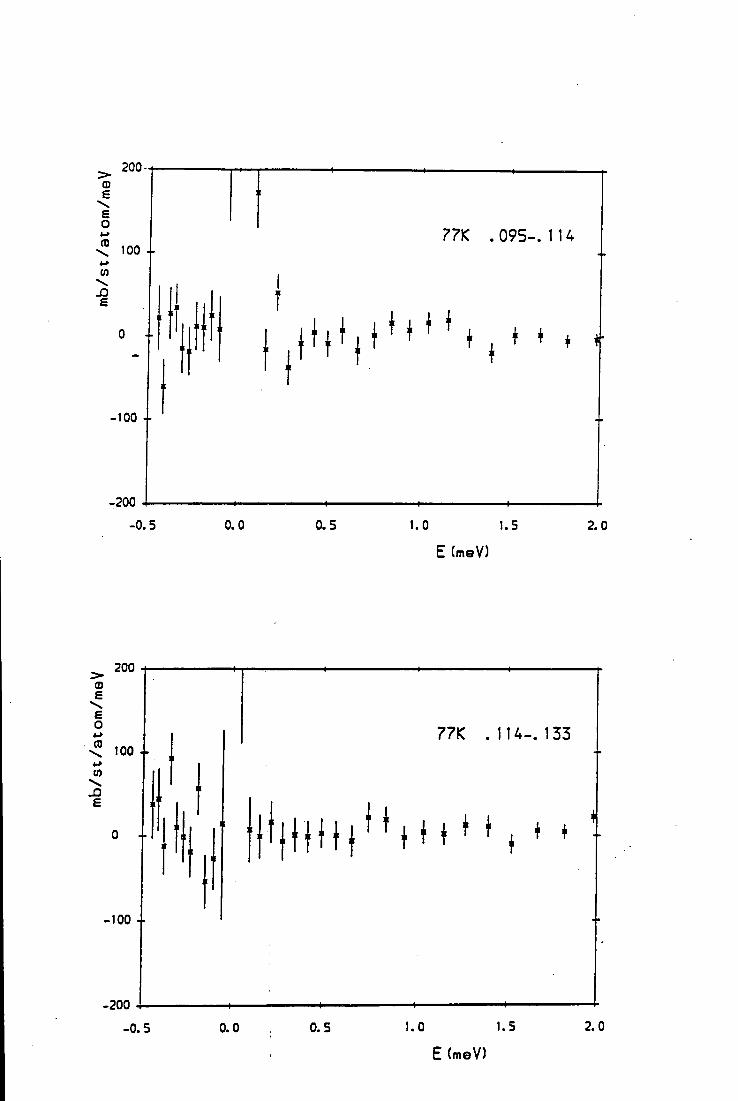
200
77K .095-. 114 <: 100
-0.5 0.0 0.5 1.0 1.5 2.0
E (meV)
200 CD £
£ O
CD
CO
£
-200
-0.5 0.0 , 0.5 1.0 1.5 2.0
E (meV)
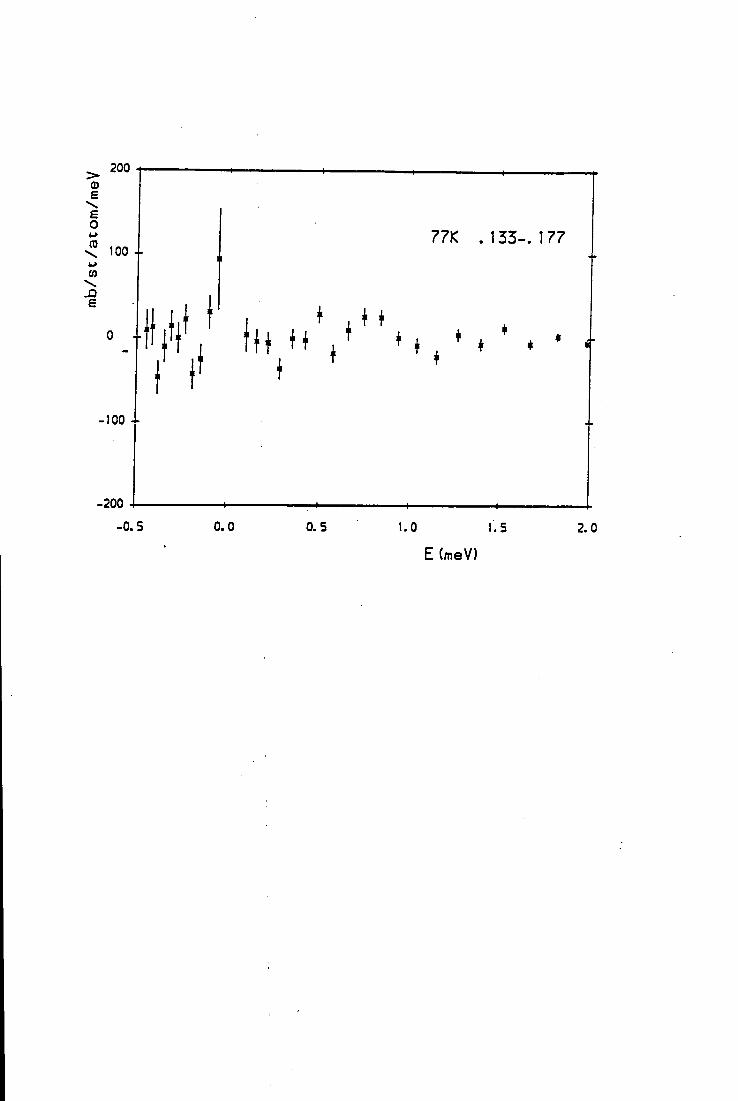
200
£ £ O
CD
CO
£
77IC .155- . 177
100 +
E (meV)
-200
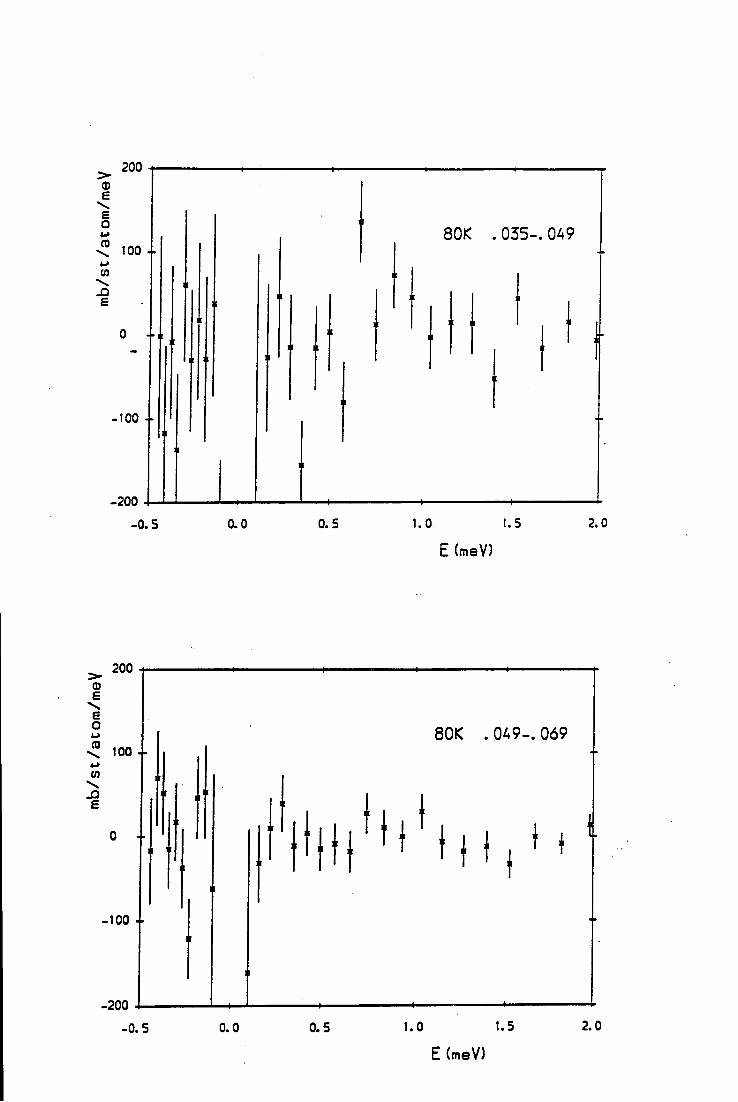
200 CD £
£ O
CD
CO
£
80K .035-.049
100 +
-200
-0.5 0.0 0.5 1.0 1.5 2.0
E (meV)
200
80K . 049-. 069
E (meV)
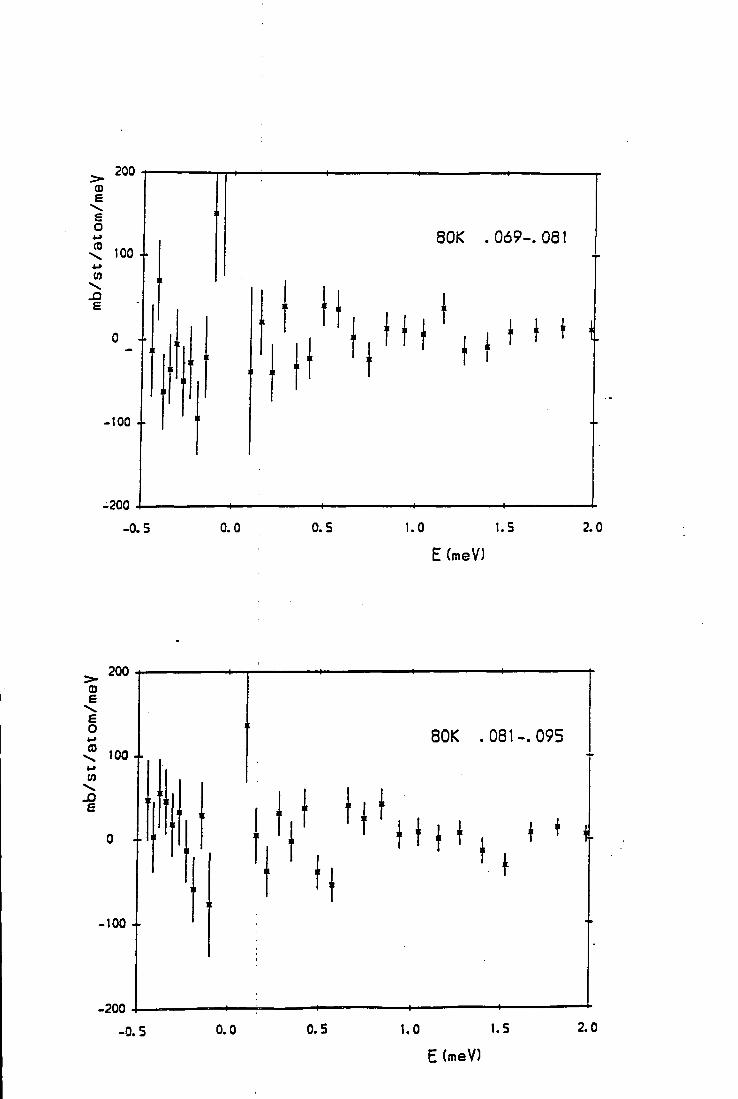
200 CD £
£ O i-> CO
CO
Si £
100 4-
0 4
.100 +
-200
80K .069-. 081
-0.5 0.0 0.5 1.0 1.5 2.0
E (meV)
200
£ £ o CD
CO
e
80K .081-.095
E (meV)
-200
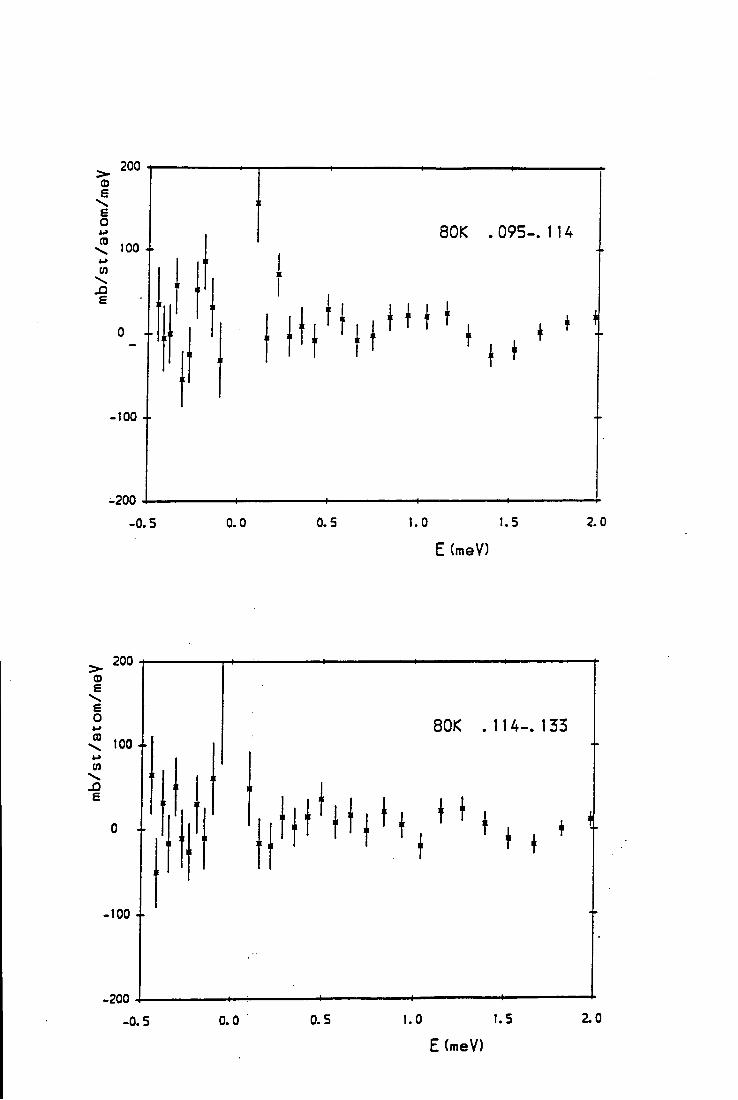
(D £ £ O CD
CO \
80K .095-114
-200 -0.5 0.0 0.5 I.O 1.5 2.0
E (meV)
£ £ O CD
CO \ JD E
80K .114-. 133
100 +
E (meV)
-200
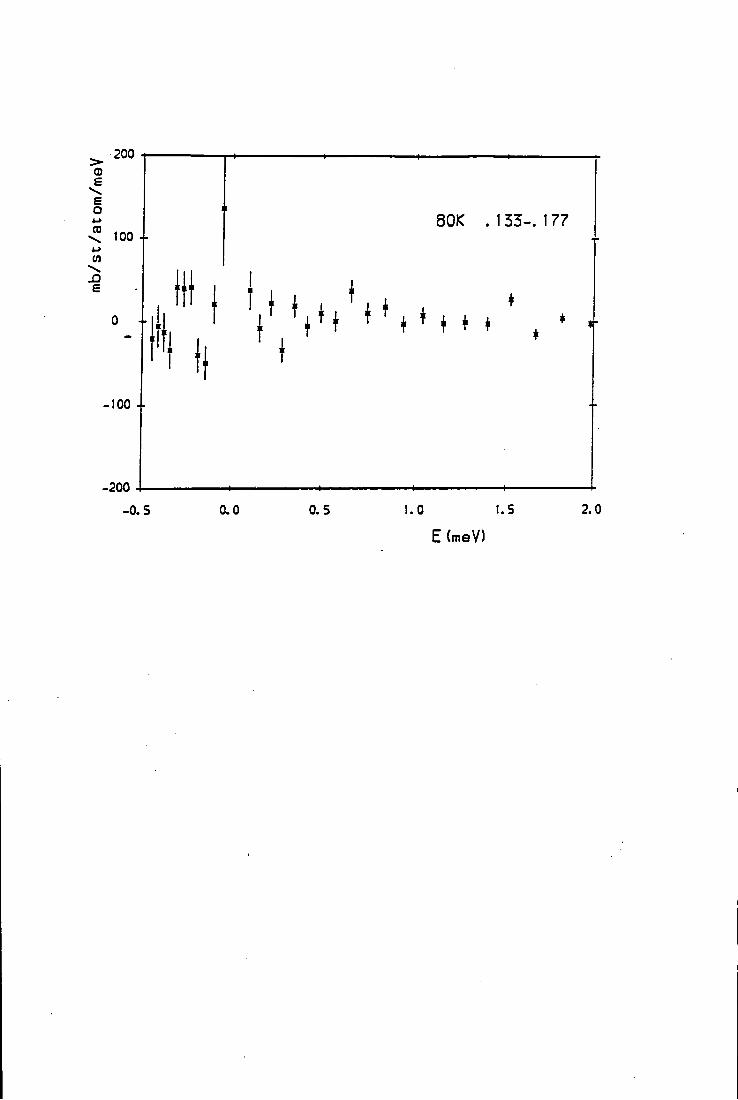
200 (D e
• \ E O <-> CD
CO 100 4-
0 4-
-100 +
-200
QQK .133-. 177
-0.5 0,0 0. 5 1.0 I.S 2.0
E (meV)
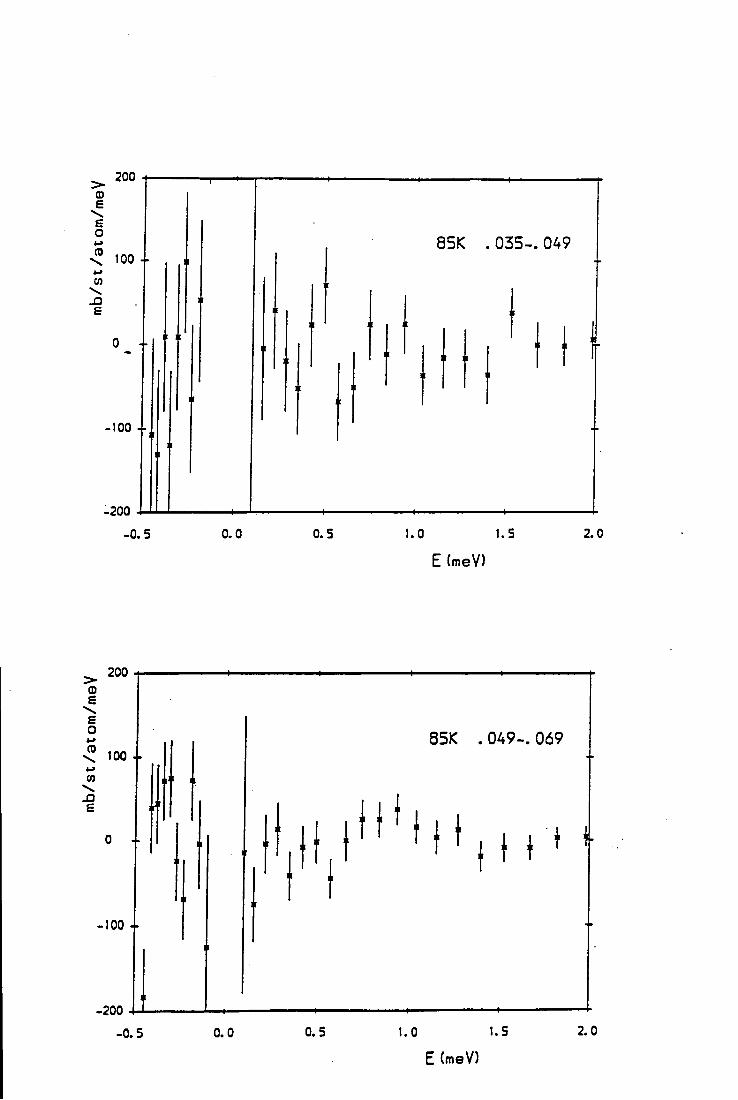
200
e o CD 85K . 035-.049
-200 -0.5 0.0 0.5 1.0 1.5
E (meV) 2.0
200
85K . 049-. 069
100 4-
E (meV)
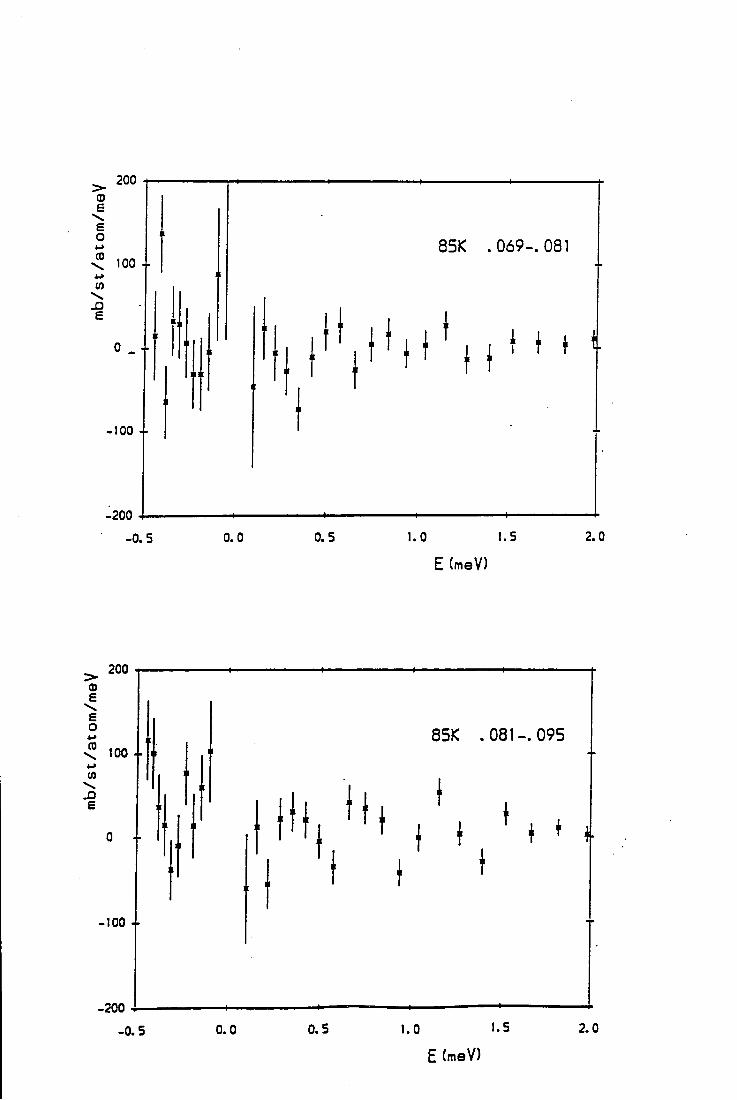
200
£ £ O CO
CO
£
85K .069-. 081
-100 +
-200 -0.5 0.0 0.5 1.0 1.5 2.0
E (meV)
200
85K .081-. 095
E (meV)
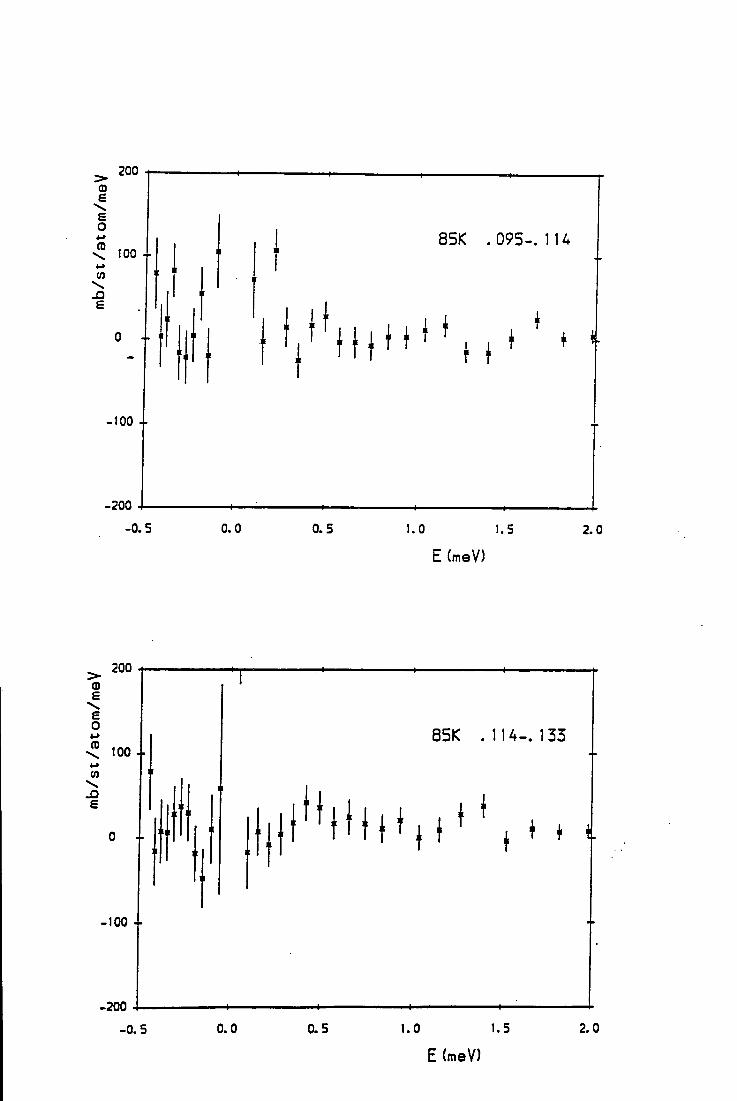
200
85K .095-. 114 <: 100
-0.5 0.0 0.5 1.0 1.5 2.0
E (meV)
85K .114-. 133
100 +
E (meV)
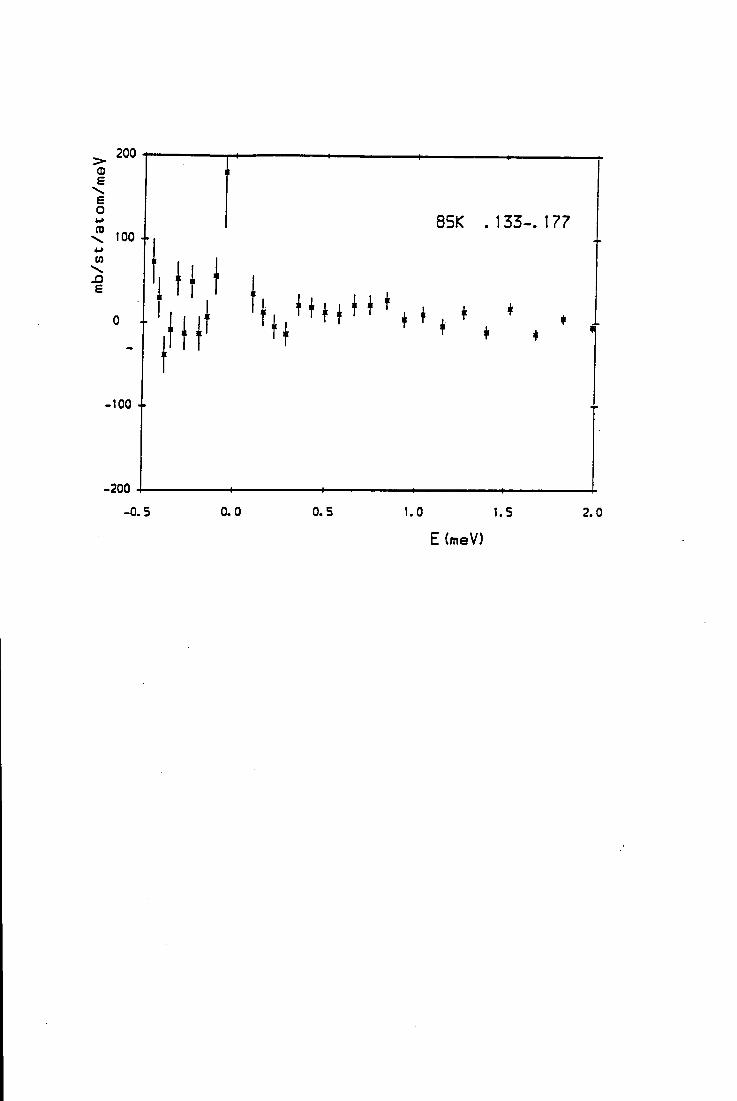
200 (D £
£ O CD
CO
£
too + 85K .133-. 177
0 4-
-100 +
-200
I I I '
-0.5 0.0 0.5 1.0 t.5 2.0
E (meV)
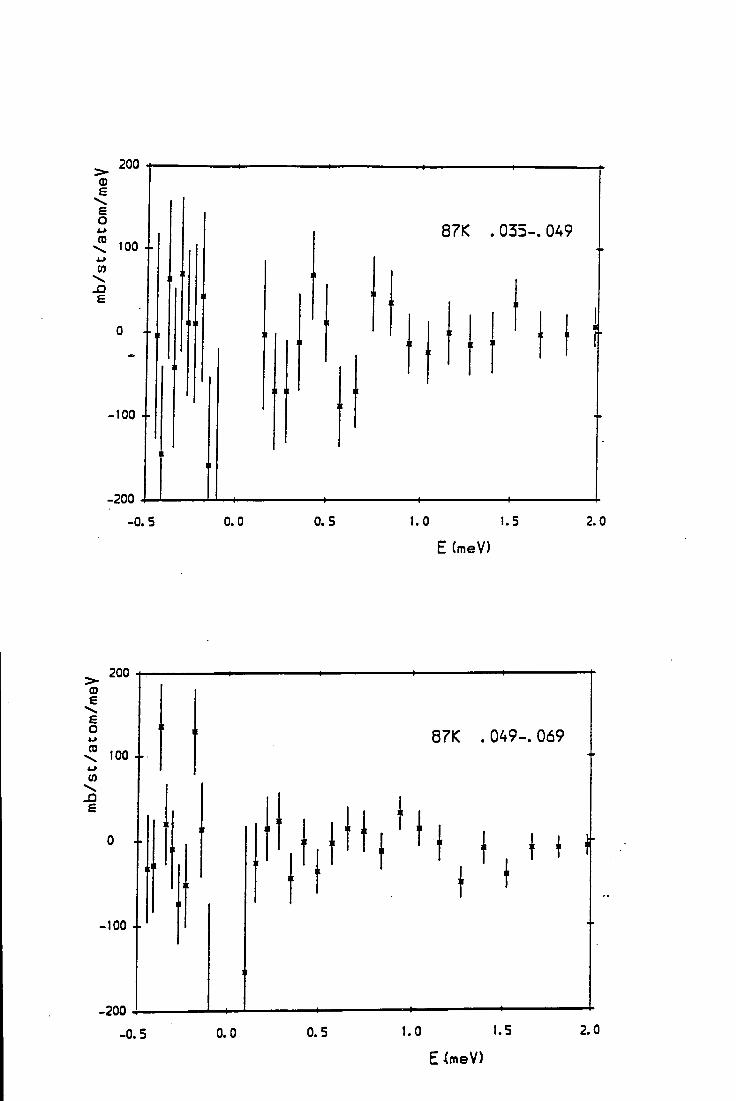
87K . 035-. 049
100 +
-0.5 0.0 0.5 1.0 1.5 2.0
E (meV)
200
£ £ O (0
CO
£
87K . 049-. 069
E^meV)
-100 +
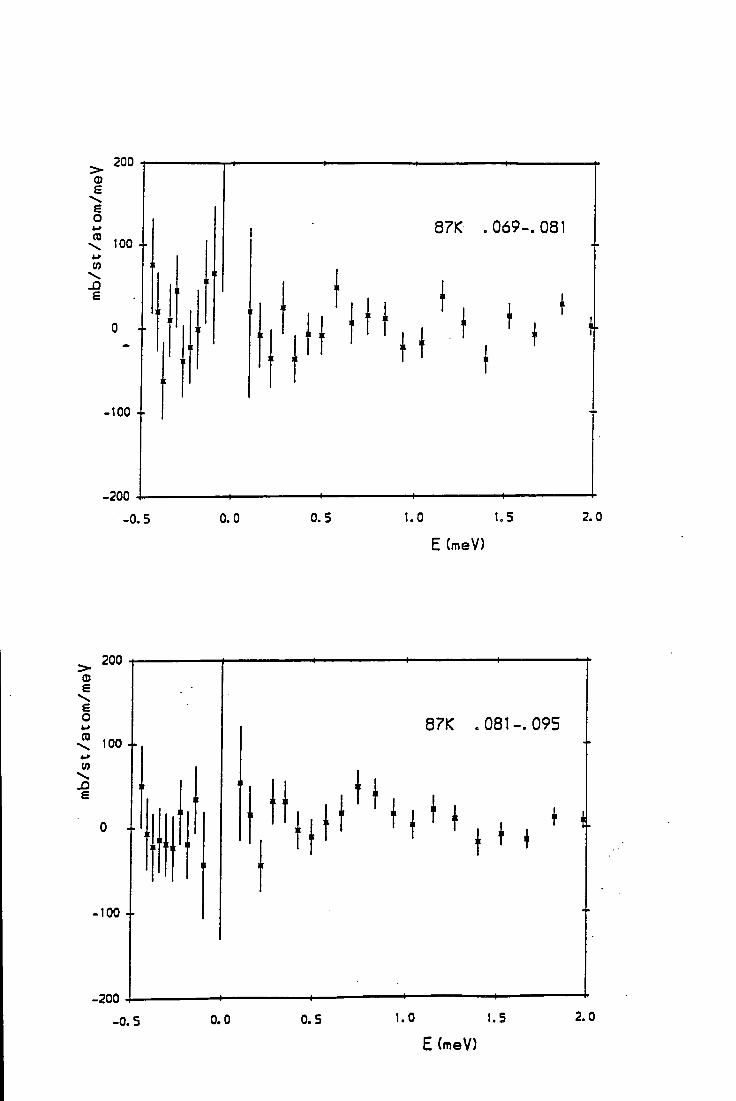
200
87K .069-. 081
100 +
E (meV)
200
87K .081-.095
•|M M t i t
E (meV)
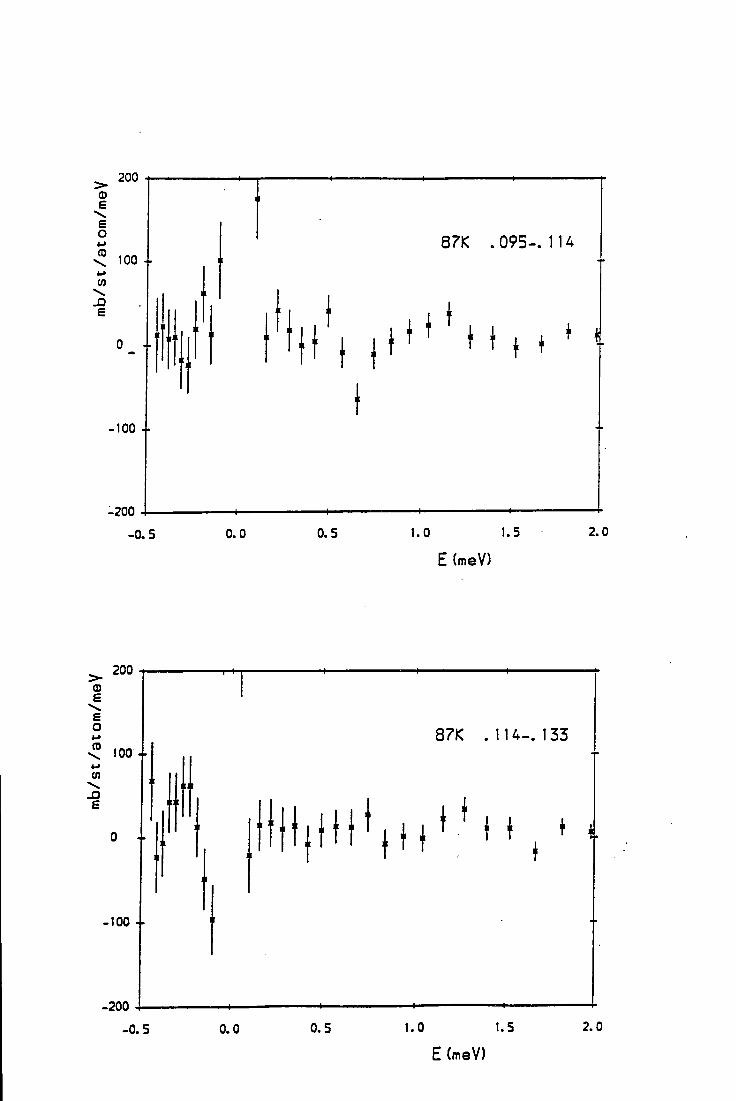
200
87K .095-114
f I
E (meV)
87K .114-. 133 100 +
100 4-
E (meV)
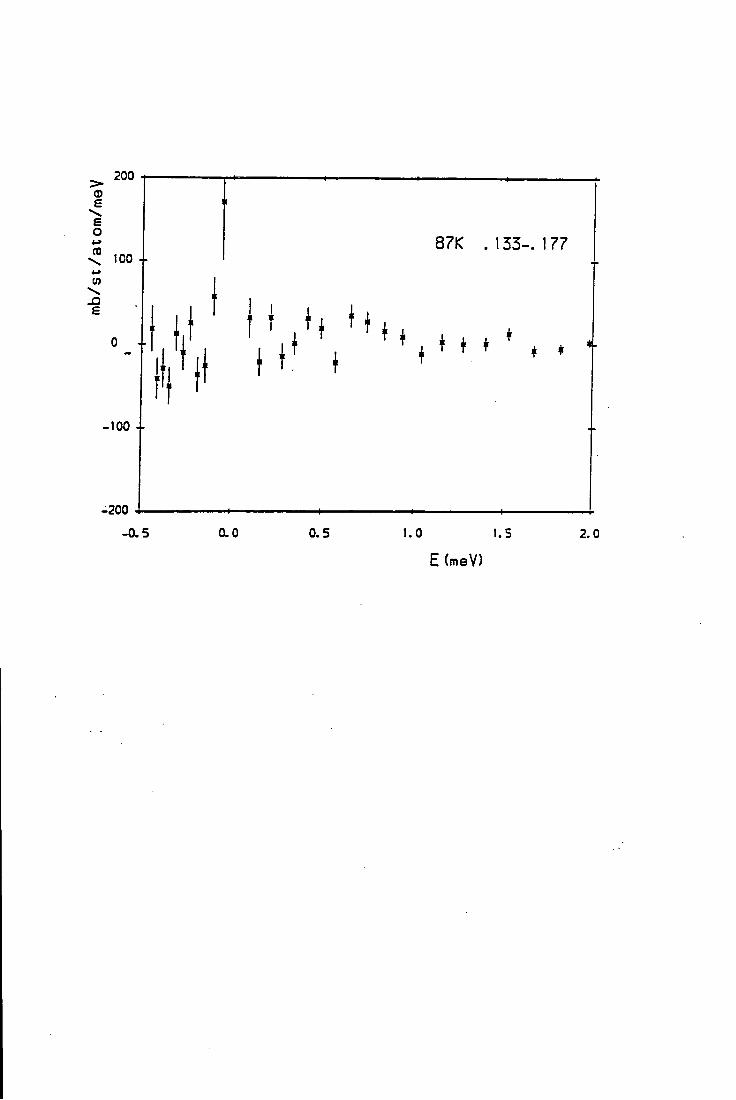
200
£ £ O CO
CO
£
87K .133-. 177
-100 +
-200 -0.5 0.0 0.5 1.0 1.5 2.0
E (meV)
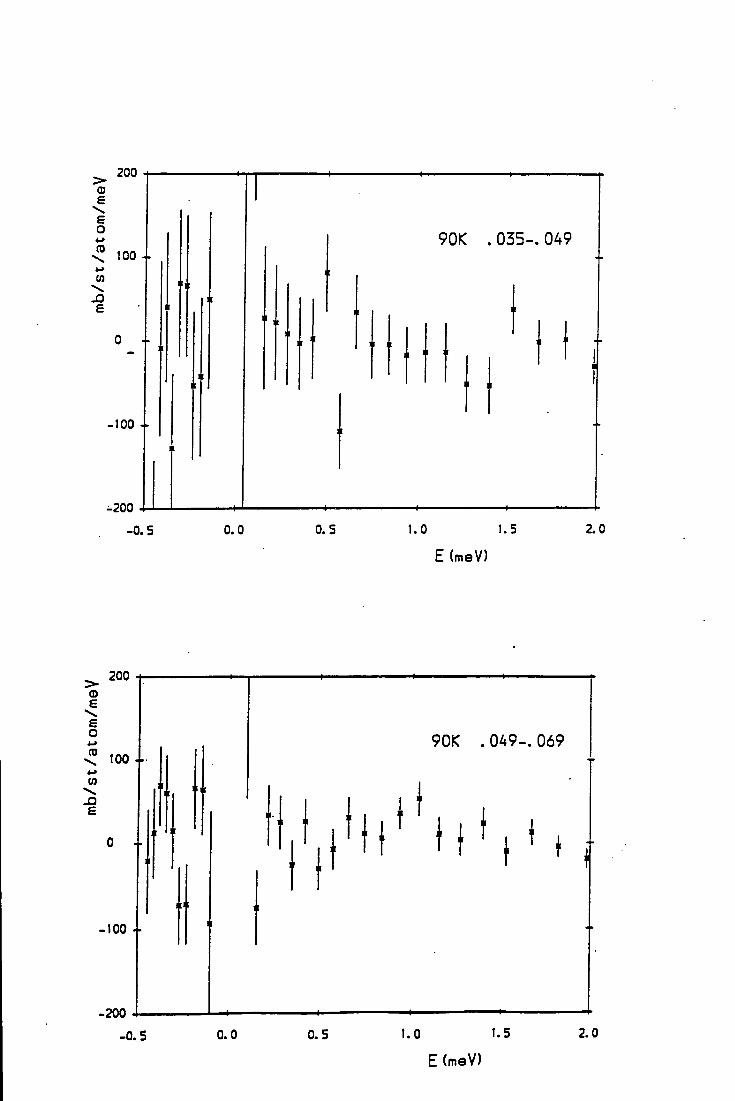
200 (D £
£ O (0
CO
\ £
90K . 035-.049
100 +
-200 -0.5 0.0 0. 5 1.0 1.5 2.0
E (meV)
200 (D £
£ O CD
CO
£
100 4-
0 i
.100 4.
-200
90K . 049-.069
' t i *
E (meV)
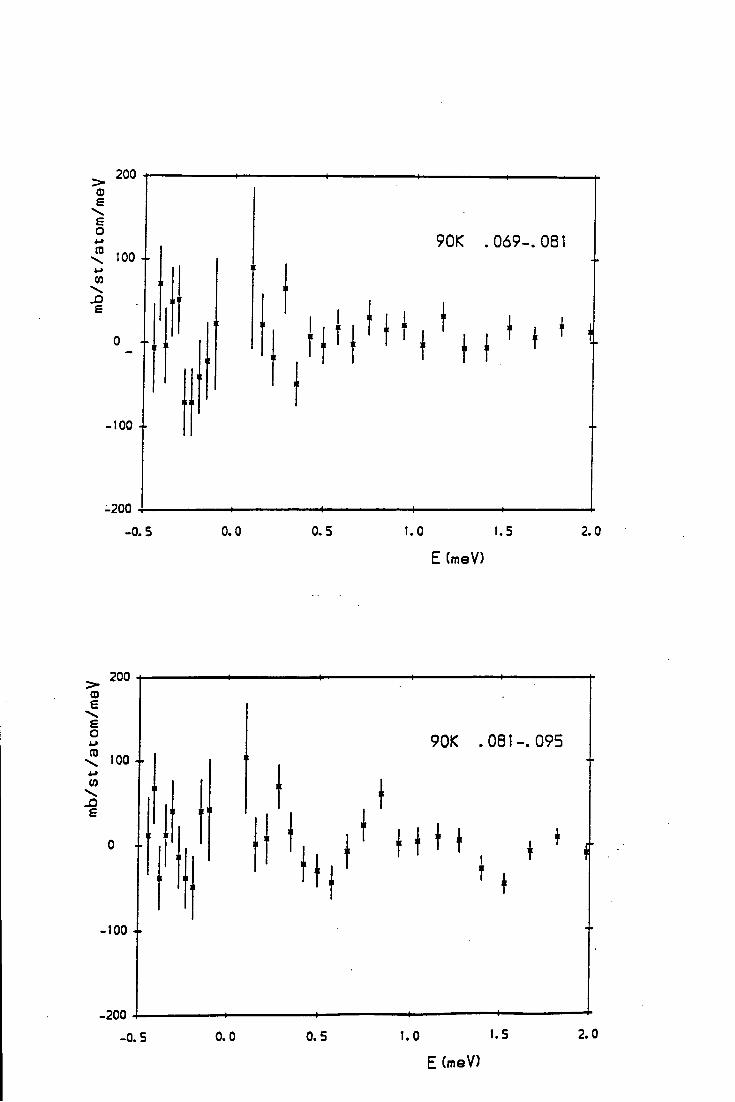
200
£ £ O CD
CO
£
100 +
0 +
•too +
-200 -0.5 0.0 0.5
90K .069-. 081
t * t I
1.0 1.5 2.0
E (meV)
£ £ O CO
CO
£
90K .081-.095
E (meV)
-200
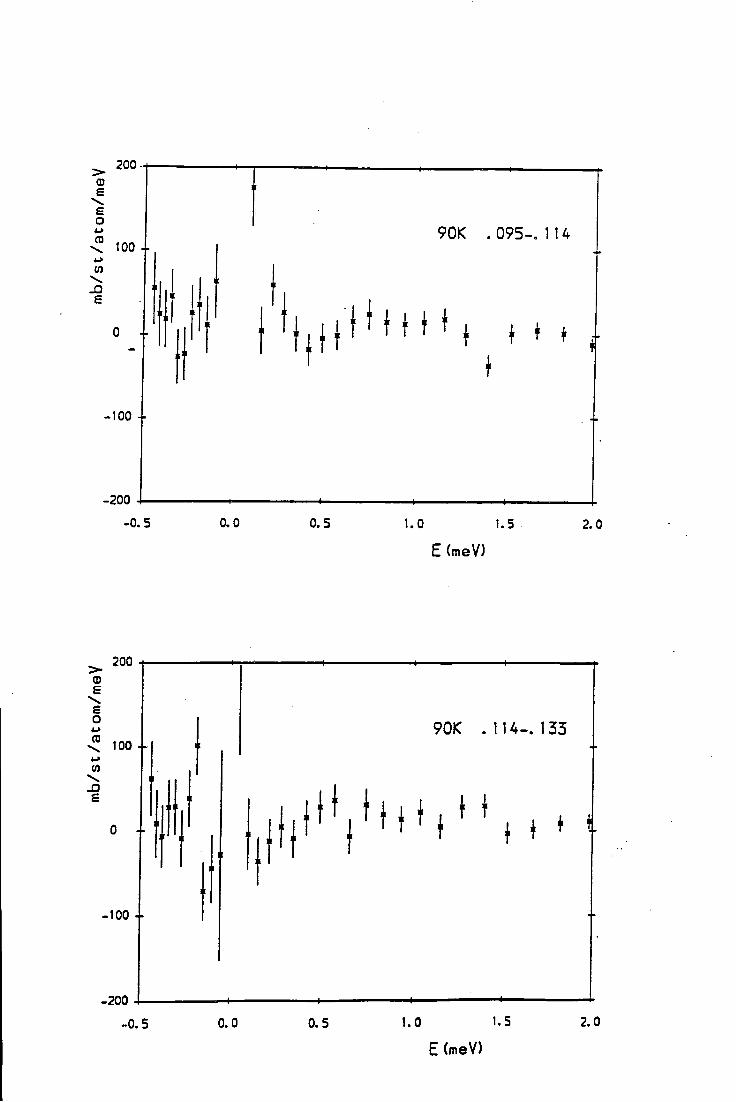
200
£ £ O CD
CO \
£
100 4-
0 i
.100 4-
-200
90K .095-. 114
-0.5 0.0 0.5 1.0 1.5 2.0
E (meV)
200
90K .114-. 133
E (meV)
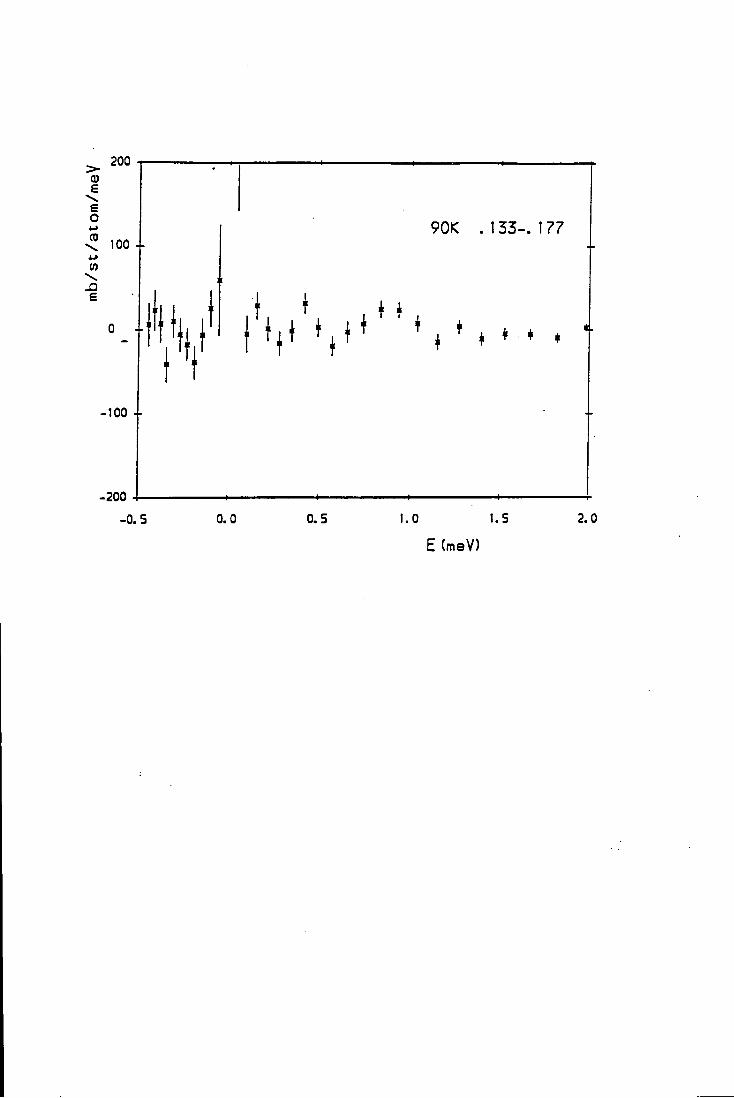
200 0) £ £ O « CO \ *-» CO \
£
90K .133-177
-200 -0.5 0.0 0.5 1.0 1.5 2.0
E (meV)
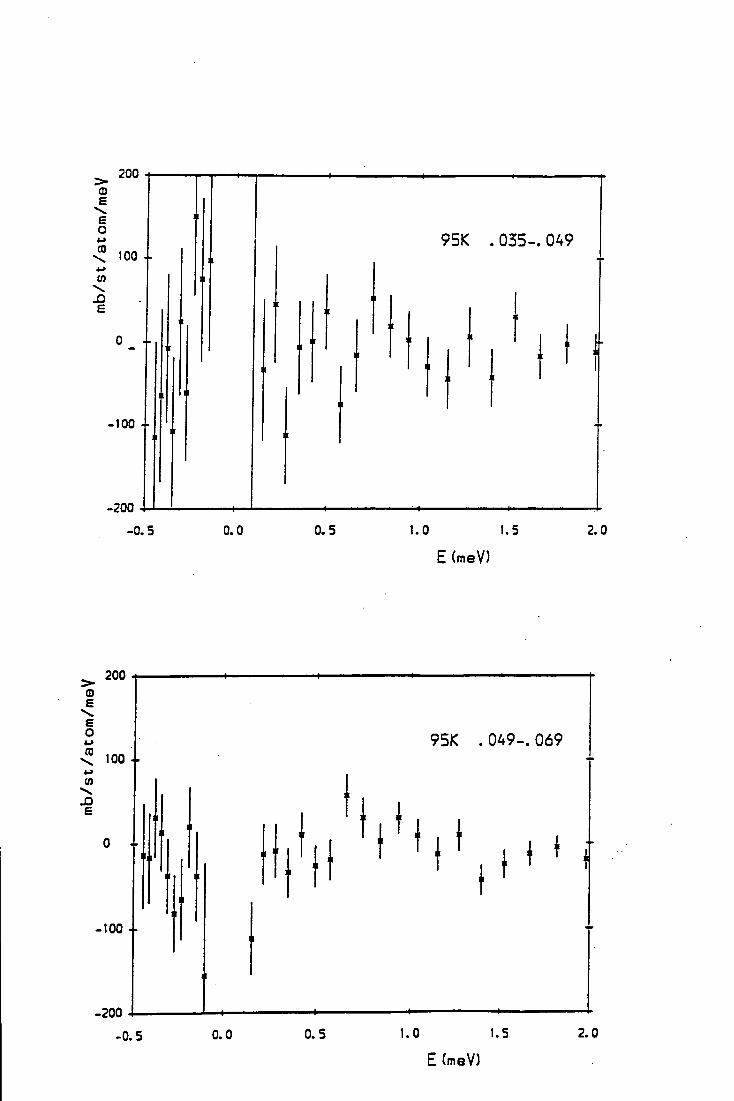
200
£ £ O CO
CO
\ £
95K . 035-. 049
-100 +
-200 -0.5 0.0 0. 5 1.0 1.5 2.0
E (meV)
200 CD £ £ O CD
CO \ J 3 E
100 I 95K . 049-. 069
1 T , t t i f
E (meV)
-100 4-
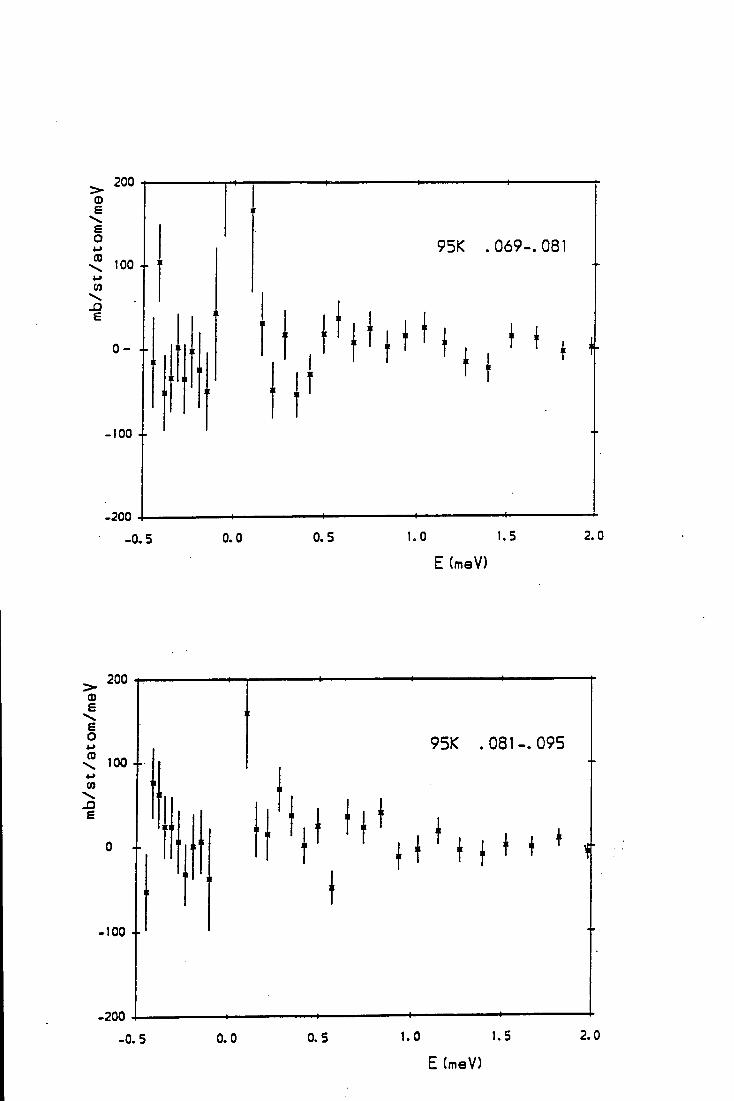
£ £ O <-> CO CO \ £
95K .069-. 081
E (meV)
-100 4-
-200
200 (D £
£ O «-> CO
CO
£
95K .081-.095
E (meV)
-200
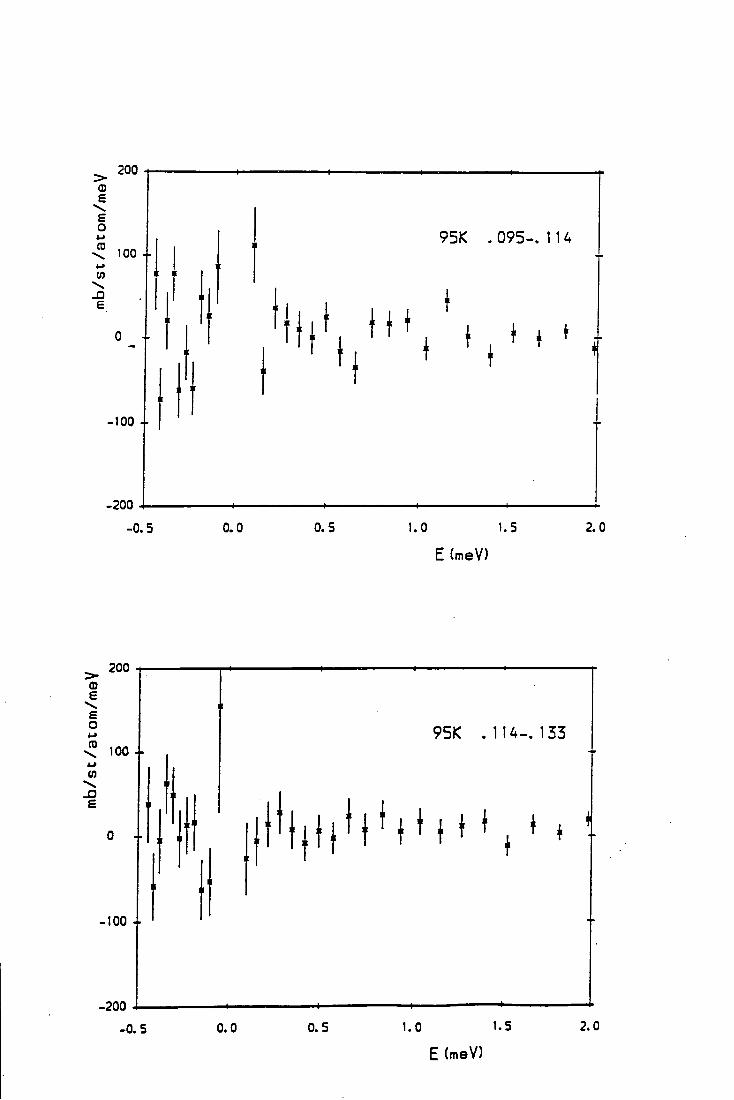
95K . 0 9 5 - . 114
100 +
-0.5 0.0 0.5 1.0 1.5 2.0
E (meV)
200
£ £ O CO
CO
95K . 1 1 4 - . 133
E (meV)
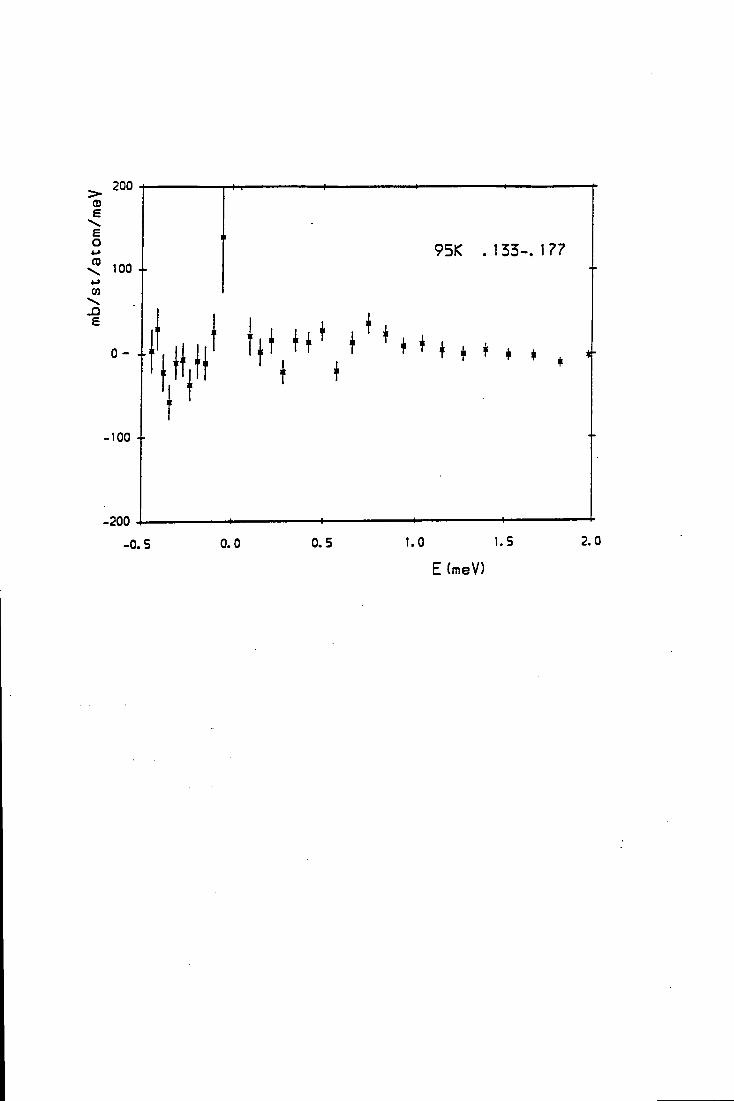
200 CO £ £ O (D 100 +
0 - +
.100 4-
-200
95K . 1 3 3 - . 177
-0.5 0.0 0.5 1.0 1.5 2.0
E (meV)
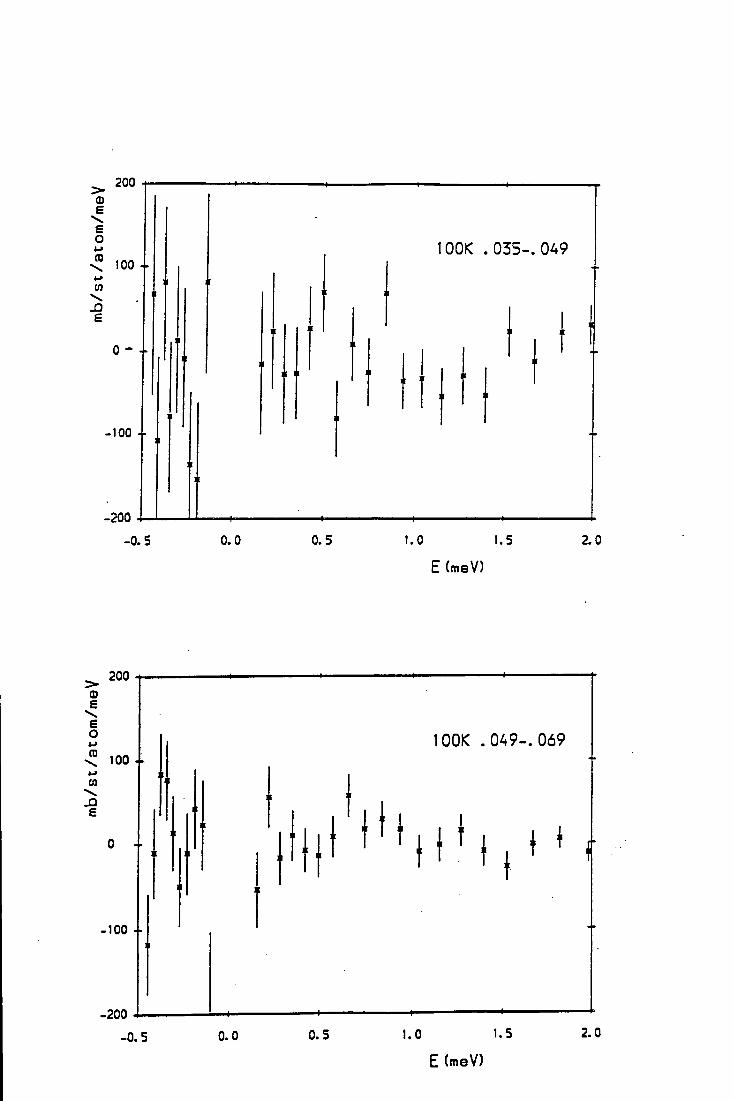
200
100K . 0 3 5 - . 049
-0.5 0.0 0.5 l.O 1.5
E (meV)
2.0
s s o <-> CO
(0
e
100K . 049- . 069
100 +
E (meV)
•200
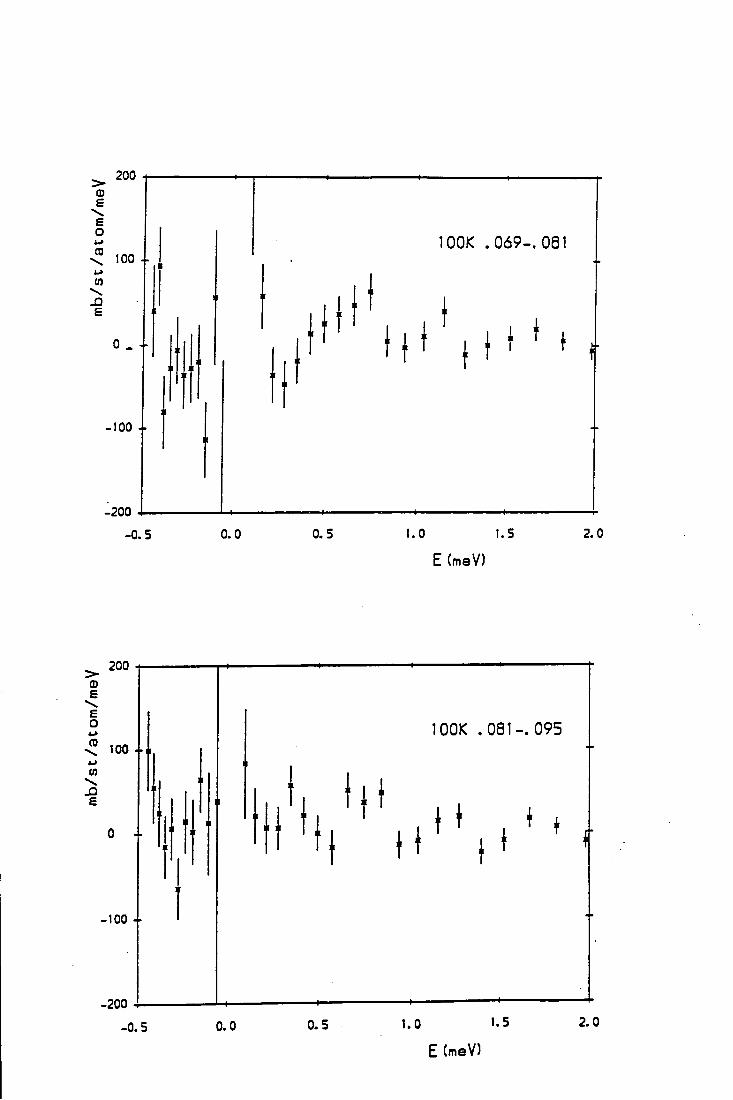
200 0 e e o
\ 4 ^ CO
\
£
100K . 0 6 9 - . 081
-100 +
-200
-0.5 0.0 0.5 1.0 1.5 2.0
E (meV)
lOOK . 0 8 1 - . 095
E (meV)
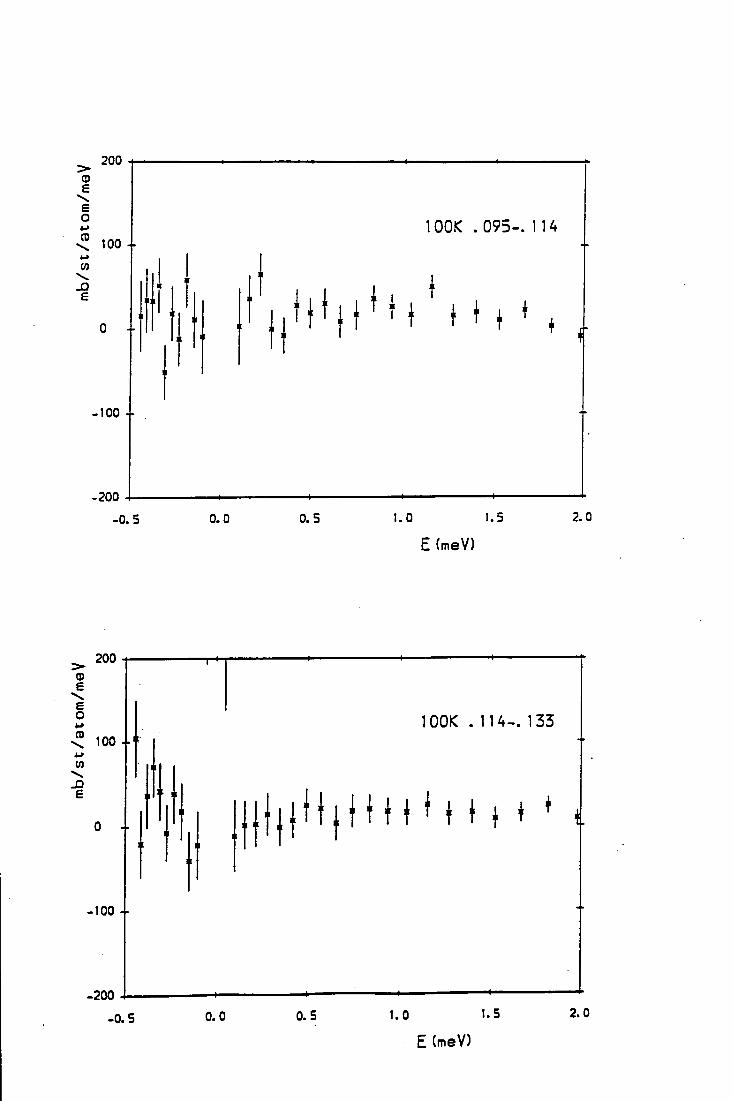
200 Q) £
£ O CO
CO \
£
100 4-
0 +
.100 +
-200
lOOK . 095- . 114
E (meV)
200 CD £ e o <-> CD \ CO \ £
100 4-
0 4-
.100 4-
-200
-0. 5 0. 0
1Q0K . 114-. 133
{ 1 1 1 f M H *
0.5 1.0 1.5 2.0
E(meV)
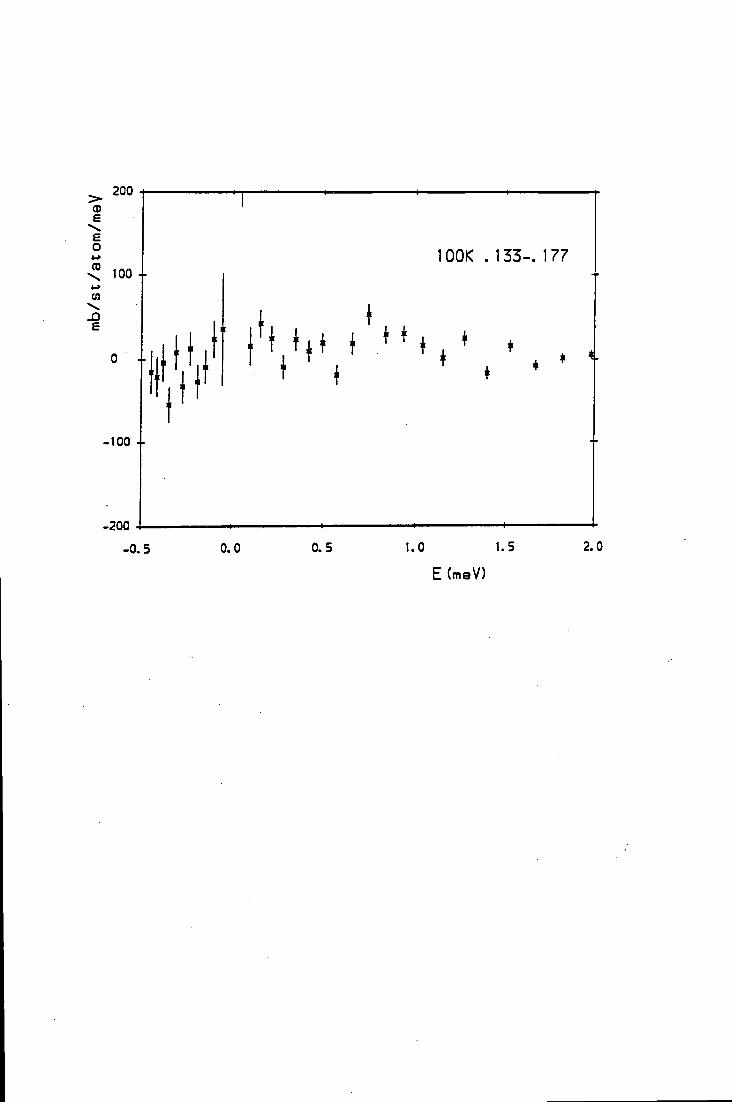
200 CD
CD
(A
£
100K . 133-. 177
' 1
E (meV)
-100 +
-200
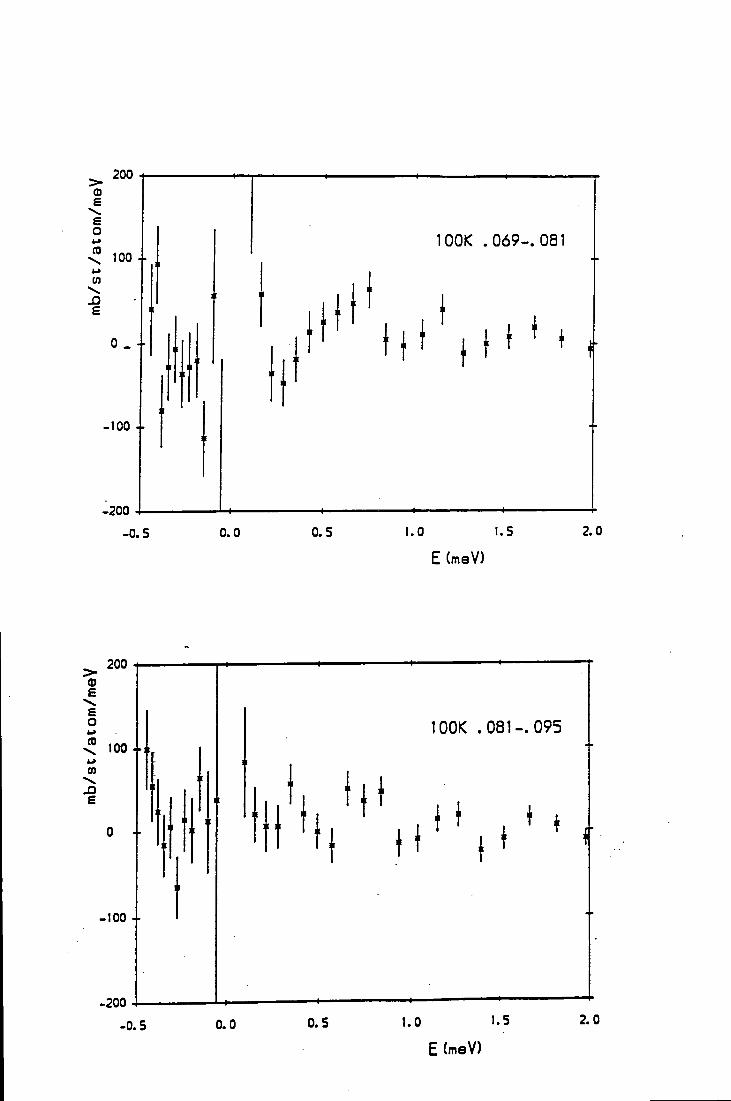
100K . 0 6 9 - . 081 100 +
-100 +
E (meV)
(D £ £ O (0 \ <.> (0 V. £
100K . 0 8 1 - 095
100 +
E (meV)
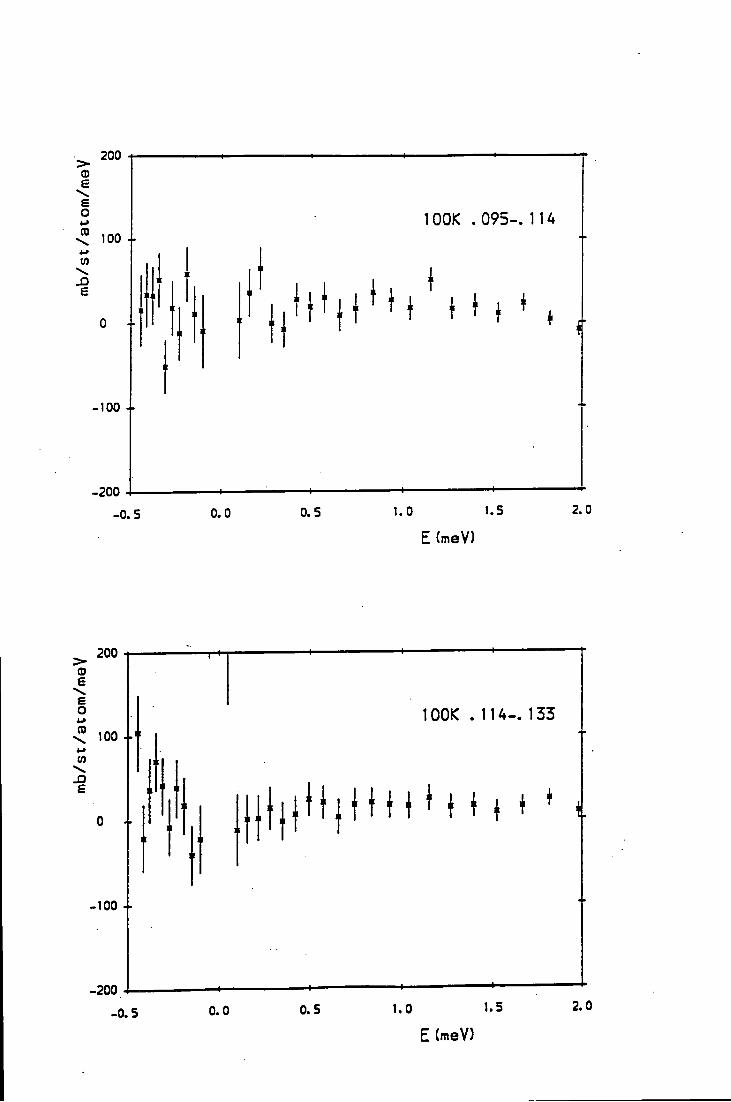
200 CD £ £ O CD
CO \ £
100 4-
0 +
-100 4-
•200
100K . 0 9 5 - 1 1 4
E (meV)
CD E £ O CO
(0
£
lOOK . 1 1 4 - 1 3 3
E (meV)
-100 4-
-200
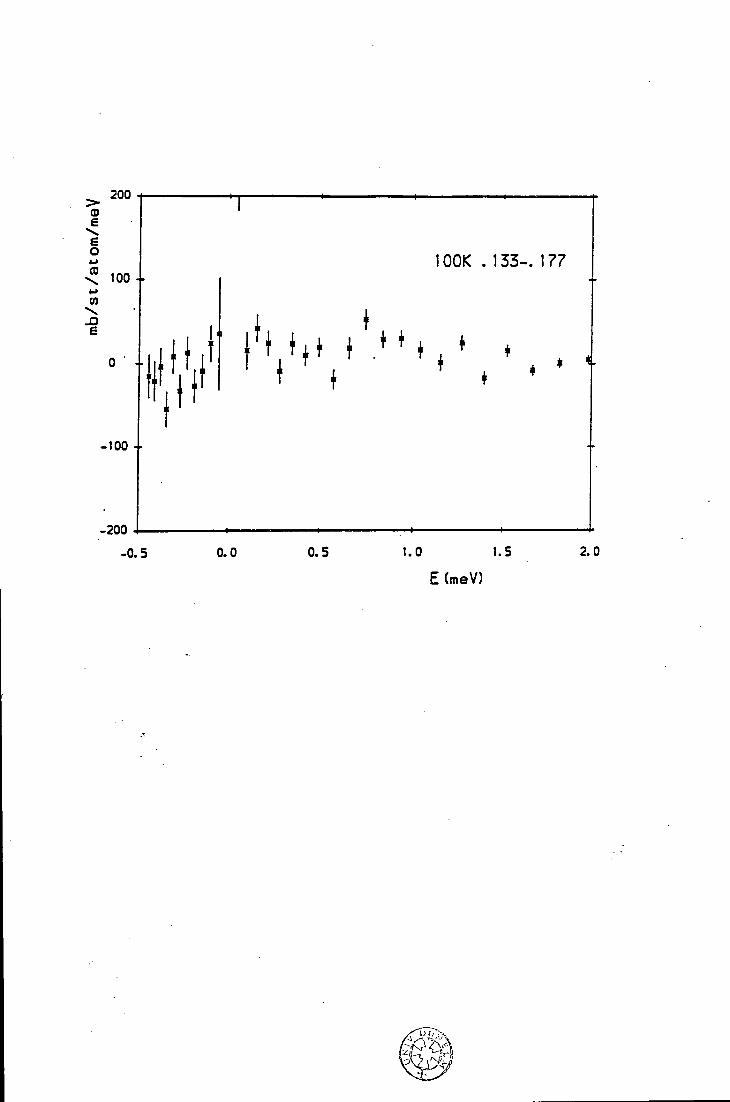
200 ca £ £ O CD
CO \ jQ £
lOOK . 133-. 177
E (meV)
-100 +


![Funny lol [from ]](https://img.pdfslide.us/doc/110x75/55c00071bb61eb4f748b45e3/funny-lol-from-wwwmetacafecom.jpg)