Embed Size (px)
Citation preview

Durability of Concrete using Recycled Aggregates
W.K. Fung
SCCT Annual Concrete Seminar 3 February 2005

Condominium Complex in Hamburg, Germany, built 50 years ago

Berendrecht Lock in Belgium 1987-1988 (C 35 recycled concrete)

Environmental Building at BRE, 1995-1996 (C25 for foundations, C35 for concrete slabs)
Durability Indicators
¨Carbonation ¨Resistance to Chloride Penetration ¨Permeability ¨Resistance to Corrosion ¨Fire Resistance ¨Alkali Aggregate Reaction

The Recycled Aggregate

Ordinary Concrete Recycled Concrete

Carbonation front in relation to permeability of the recycled aggregate and the new mortar
(a) (b) (c)
a) Permeability of the recycled aggregate > permeability of the new mortar b) Permeability of the recycled aggregate = permeability of the new mortar c) Permeability of the recycled aggregate < permeability of the new mortar

Carbonation of concrete with different recycled aggregate content, used wet or dry in air and in 3% carbon dioxide
(Second Series of Tests) (Philipp Holzmann, 1998)
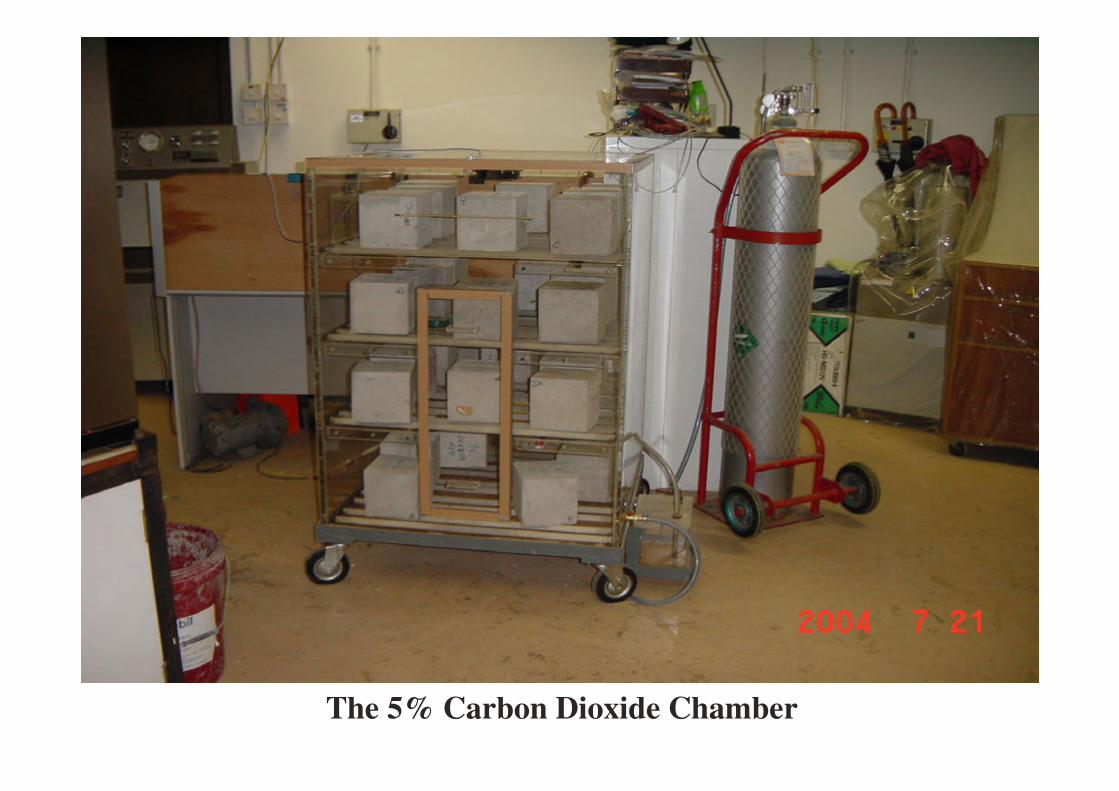
The 5% Carbon Dioxide Chamber

Measured Carbonation Depth
Uncarbonated concrete turning into pink color

Table 11.4(a) Carbonation Depths (mm)
Concrete Grade
Recycled Coarse Aggregates (%) Sample
Corner 1 Corner 2
d1 d2 d3 d1 d2 d3
30/20
Control 0
G 11 20 10 17 26 21 H 12 20 15 10 24 23
20 G 0 0 0 9 10 11 H 0 0 0 0 0 0
20 G 20 21 7 16 20 13 H 11 17 13 13 21 19
40 G 0 0 0 0 0 0 H 0 0 0 0 0 0
60 G 0 0 0 0 0 0 H 20 27 16 20 25 6
40/20
0 G 16 28 20 12 20 16 H 22 25 9 0 0 0
20 G 10 14 12 12 23 17 H 8 10 5 15 15 6
40 G 4 8 3 6 15 5 H 10 9 10 5 10 7
60 G 7 9 7 9 10 6 H 6 17 8 12 13 9
30/20 25% PFA 60
G 0 0 0 0 0 0 H 0 0 0 0 0 0
40/20 25% PFA 60
G 8 24 19 13 17 8 H 10 18 6 5 7 5
Note: d1, d2 & d3 are defined in the previous slide

0.8
50% river sand 0.6
) 75% river sand
(% 100% river sand
Chl
orid
e
0.4
0.2
reference
0 0 3 6 9 12 15 18 21 24 27 30 33 36 39 42 45 48
Depth (mm)
RECYCLED CONCRETE AGGREGATES AS REPLACEMENT FOR RIVER GRAVEL
Chloride penetration in concrete mixtures with W/C of about 0.45. In case of 75% river sand or 50% river sand in the fraction < 4mm the amount of recycled material is 25% or 50% respectively (vol/vol)
(Fraaij et al, 2002)

ASTM C 1202-97 Test Set-up

Schematic Diagram of the ASTM C 1202 – 97 Test

Results of ASTM C 1202 tests8000
¨New 6000 chart based on Table 11.3(a)
s
High
Co
ulom
b
4000
Moderate
2000 Low
1000
100 VeryLow
0 Negligible
0 10 20 30 40 50
Grade30/20Concrete 60%Replacement
Control 20%Replacement 40%Replacement 60%Replacement with25%PFA
ChlorideIonPenetrabilityTest toASTMC1202

Results of ASTM C1202 testsC
oulo
mbs
¨New chart based on Table 11.3(b)6000
High
4000
Moderate
2000 Low
1000 VeryLow
100 0 Negligible 0 10 20 30 40 50
8000
Grade40/20Concrete 60%Replacement
Control 20%Replacement 40%Replacement 60%Replacement with25%PFA
ChlorideIonPenetrabilityTesttoASTMC1202

140
6B100/100+
R
ATI
ON
, mm
120
100
80
3B0/100 4B50/50 5B100/100
W
ATE
R P
EN
ET
60
40
20
0
1B0/0 2B100/0
CONCRETE MIX
Variation of water permeability for different mixes
(Kenai et al, 2002)

Initial Surface Absorption Test

Schematic layout of the ISAT equipment

Concrete Society Technical Report 31 (1987)
Reading taken Low Average High
10 min <0.25 0.25-0.50 >0.50
30 min <0.10 0.10-0.35 >0.35
60 min <0.07 0.07-0.20 >0.20
where the numbers are in ml/m²/sec.
Classification of Initial Surface Absorption

ISAT Results Grade 30/20 Control Mix
Specimen G Specimen H
Surface A Bottom of cube
Surface B Side
Surface C Side
Surface A Bottom of cube
Surface B Side
Surface C Side
10 minutes 0.34 0.46 0.48 0.42 0.46 0.51
30 minutes 0.22 0.31 0.34 0.27 0.34 0.33
60 minutes 0.16 0.25 0.26 0.18 0.27 0.27
Permeability Average Average Average Average Average High
Grade 30/20 60% replacement 25% PFA
Specimen G Specimen H
Surface A Bottom of cube
Surface B Side
Surface C Side
Surface A Bottom of cube
Surface B Side
Surface C Side
10 minutes 0.39 0.44 0.45 0.41 0.37 0.43
30 minutes 0.23 0.25 0.25 0.25 0.23 0.22
60 minutes 0.17 0.18 0.18 0.17 0.17 0.17
Permeability Average Average Average Average Average Average

0.7 w/c = 0.55
0.6 w/c = 0.55
) 0.5
CS
E
w/c = 0.40
V
olt
s (
0.4 w/c = 0.40
0.3
Po
ten
tial
in
0.2
0.1
Conventional Concrete Recycled Aggregate Concrete
0 0 5 10 15 20 25 30 35 40
Cycles of Ponding and Drying
Half-cell potentials of steel bars embedded in specimens made from recycled and conventional aggregate
(AC I Manual , 2003)

Recycled coarse Aggregate
(%)
Recycled fine aggregate
(%)
Moisture content in concrete
(%)
Explosive fracture
Residual compressive strength (%)
0 0 4.7 No 14.5
0 30 5.7 No 12.8
30 0 5.2 No 12.2
30 30 6.2 No 13.0
0 50 6.0 No 13.5
0 100 7.1 No 13.1
Residual Compressive Strength of Concretes after Fire (Teranishi et al 1998)

2nd generation concrete with
low soluble
m/m
alkali content (S2)
Exp
ansi
on in
m
2nd generation Parent concrete with Concrete A
high soluble alkali content (S1)
Comparison of expansion of 3 concrete prisms at 40oC and 100% RH

Days
Lin
ear
expa
nsio
n [m
m/m
]
Low alkali
cement
Expansion of concrete prisms containing different percentage of recycled aggregates (Haase and Dahms, 1998)

Durability Indicators
¨Carbonation ¨Resistance to Chloride Penetration ¨Permeability ¨Resistance to Corrosion ¨Fire Resistance ¨Alkali Aggregate Reaction

Conclusion
¨From all tests which serve as indicators of durability, it is evident that:
¨Recycled Concrete is just as durable as Ordinary Concrete

Thank You