Embed Size (px)
Citation preview

Dupont/Kalorama Curbside Management: Stakeholders Meeting
May 10,2016

Meeting #1 Meeting #2 Meeting #3
Issue identification, process discussion
Data discussion, initial discussion of potential tools
Toolbox and recommendation refinement, public engagement discussion
Dupont X X
2015
Data
Col
lect
ion
Proc
ess
Nove
mbe
r 201
5 - M
arch
20
16
Previous Meetings with Dupont/Kalorama
• Review stakeholder concerns • Review updated data • Initial findings from data
2
5/13/2015 8/19/2015

Purpose of this meeting
North Dupont
South Dupont
Kalorama

Residential Parking Visitor Parking Neighborhood Commercial Parking
• Revisit RPP Program (permit distribution cost, eligibility)
• Transportation
Demand Management Strategies (TDM)
• Remove ‘free’ visitor parking
• Explore other
visitor pass distribution methods
• Improve wayfinding/signage • Revise meter operations (time
limits, rates, performance parking) • Leverage underutilized / off-street
parking • Transportation Demand
Management Strategies (TDM)
Summary of Community Curbside Management Ideas

DDOT Response - Data Collection
5
Data Collection sources: DMV, MPD, DPW, DDOT, MWCOG Data Field data collection Vehicle camera data collection Time-lapse cameras
Information derived: Parking occupancy, vehicle registrations (DC, VA,MD) RPP permit usage Parking turnover data Parking meter transactions Parking and moving violations, and crash data Travel patterns Land use and car ownership analysis

Time-lapse Photography

On-street Supply vs. RPP Demand
Oversubscription of RPP permits Permit holders vs. RPP spaces Registered vehicles in the ANC vs. RPP spaces
Ward 2 permit holders vs. RPP spaces
ANC 2B South Permit Holders
Registered Vehicles
Ward 2 Permit Holders
136: Total # of RPP Spaces
ANC 2B South
2,607: Total # of RPP Spaces
ANC 2B North Permit Holders
Registered Vehicles
Ward 2 Permit Holders
ANC 2B North
193 Embassy Parking Spaces 7 AM to 6:30 PM
ANC 2D Permit Holders
Registered Vehicles
Ward 2 Permit Holders
1,006: Total # of RPP Spaces
ANC 2D 14,933
90 Embassy Parking Spaces 7 AM to 6:30 PM
20 Embassy Parking Spaces 7 AM to 6:30 PM
North Dupont South Dupont Kalorama
North Dupont South Dupont Kalorama
4,220: Total Curbside Spaces 2,373: Total
Curbside Spaces
1,511: Total Curbside Spaces

On-street Supply vs. RPP Demand
Considerations Increased restrictive parking may not be the solution in areas
with overnight parking concerns Demand responsive permit pricing Limit number or availability of permits Manage intra-ward travel
Residential Demand: 60% to 70 % of registered vehicles obtained RPP
permits in North Dupont and Kalorama Vehicles registered to commercial uses in South
Dupont All DC registered vehicles can park in RPP blocks
after RPP restrictions ends.
Considerations Increased restrictive parking may not be
the solution in blocks with overnight high occupancy.
Transportation Demand Management Strategies (TDM)
Demand Trends (2013-2016)
RPP Inventory: 2,607 spaces
RPP Inventory: 136 spaces
RPP Inventory: 1,006 spaces
North Dupont
South Dupont
Kalorama

Demographic Measure
Dupont Kalorama District
Car free Households * 54% 27 % 34%
# of Employees 17% of the total in the District
3% of the total in the District ~770,000
2014 Area-wide Business Sales Volume
23% of the total in the District
.2 % of the total in the District ~$110 Billion
10
Dupont: 50% more car free households than the District’s average
Source: 2013 ACS five year estimates and 2015 Business data
Demographics of Residents & Businesses
Considerations • Curbside management has to balance residential and commercial demands • Enhancing TDM strategies to raise the number of car-free households and optimize
curbside use

11
Overall Occupancy Demographics
Similar weekday and weekend occupancy demographic patterns
Limited parking availability during mid-day, evenings, and weekends in Dupont
Average 30% availability in Kalorama More than half of vehicles parked in study area are
either out of state or out of ward A third of vehicles in North Dupont/Kalorama are
intra-ward plated vehicles South Dupont occupancy demographics indicative
of employment/retail centric destination
Kalo
ram
a N
orth
Dup
ont
Weekend
Sout
h Du
pont
Weekend
Weekend

Considerations Use pricing and time limits as a mechanism to manage demand
• Demand responsive meter operations • Demand responsive residential visitor permitting
Additional Note Higher presence of diplomatic plated vehicles
Typically 90 plates around Kalorama mid-day Typically 42 plates around Dupont mid-day
Overall Occupancy Demographics (continued)

13
Weekend Mid-Day Field Occupancy
Occupancy
Weekday Mid-day Field Occupancy
Overall occupancy peaks during : mid-day regardless of day of week
Higher parking occupancy throughout Dupont and east Kalorama on weekends
Considerations Coordinated enforcement Demand responsive pricing Extend meter operating hours and days Residential visitor permitting
Intra-ward travel (paired with smaller RPP Zone)
Spillover parking concerns
= 70-80% Occupancy = 80-90% Occupancy
= +90% Occupancy No color = Below 70% Occupancy

17th St. NW
Sun Mon Tue Wed Thu Fri Sat
Janu
ary
201
6
Weekend
Weekday
Parking occupancy
by day by hour
Parking turnover by day by hour
Block Level Occupancy (example)

PARC Confidential | 15
Sun Mon Tue Wed Thu Fri Sat Week of
Weekday
Weekend
Wyoming Av. NW
01/03/16
01/10/16
01/17/16
01/24/16
01/31/16
nSpots = 3

Summary of Time-Lapse Photos
16
Core Commercial Blocks: Inbound travel pattern – high mid-day occupancy High turnover Low overnight occupancy
Mixed use blocks: Inbound travel pattern – high mid-day occupancy Low/moderate turnover High overnight occupancy
Residential Blocks Neutral travel pattern – moderate mid-day occupancy Low turnover Moderate/high overnight occupancy

Reference Slide: Summary of Data
17
Collected January 2016
Group Street # Spaces Type AM Mid PM Overnight AM Mid PM Overnight
Weekday Weekend
1 1015 15th St NW 5 CIHL 75% 80% 70% 60% 70% 60% 60% 70%
1 1050 17th St NW 7 CIHL 60% 70% 50% 50% 25% 60% 60% 70%
2 1503 17th St NW 5 MILH 90% 95% 90% 99% 95% 85% 99% 99%
1 1507 Connecticut Ave NW
3 CIML 10% 80% 95% 40% 30% 85% 95% 90%
2 1522 Corcoran St NW
2 RILH 80% 85% 80% 80% 90% 99% 95% 90%
3 2242 Decatur Pl NW
4 RILL 70% 75% 70% 60% 60% 65% 60% 60%
1 1800 M St NW 5 CIHH 20% 80% 25% 80% 45% 90% 80% 80%
2 1747 S St NW 5 MOLH 80% 75% 85% 90% 90% 85% 85% 90%
2 2314 Wyoming Ave NW
3 RIHM 75% 80% 60% 75% 75% 75% 70% 80%
Group 1 – Managed Access Group 2 – Local Amenity Support Group 3 – Resident Priority

Dupont /Kalorama : Auto Trips Estimated Existing Conditions: Origins to Dupont /Kalorama area
Based on MWCOG 2015 Base Scenario Travel Demand Model Origin/Destination Table Output
18
Trips are generating from both the District and out of State
Curbside management could have regional travel pattern implications
Consideration: Transportation Demand
Management Strategies Smaller RPP zones Demand Responsive pricing
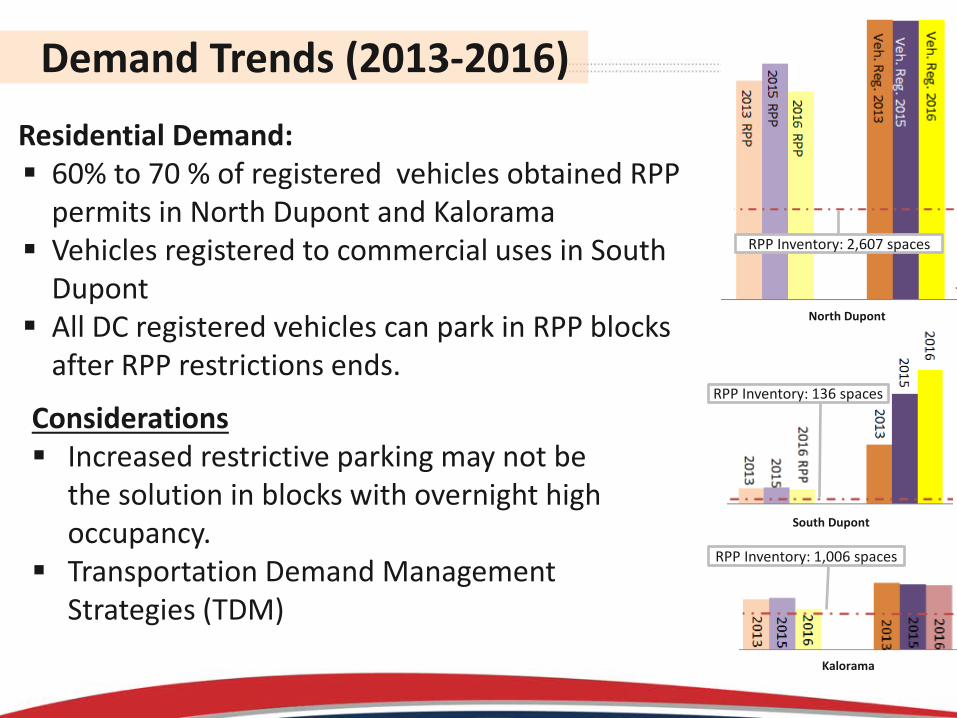
Dupont / Kalorama: Transit Trips Estimated Existing Conditions: Origins to Dupont / Kalorama area
Based on MWCOG 2015 Base Scenario Travel Demand Model Origin/Destination Table Output Degree of standard deviation of trips
19

Paid Occupancy : overall, slightly <1/3 of meter operating hours People not paying meters Parking in unmetered areas
Meter Transaction Split: 2/3 originated from Pay By Cell
Violations Trends Expired meter violations are declining Noticeable parking crunch in Dupont
North Dupont: Street cleaning, Overstay RPP, disobeying parking signs (increasing trend) South Dupont: Overtime at meters, Rush hour (increasing)
20
Overview of Meter Operations

Parking Enforcement Slight increases in meter enforcement in Scott Circle &
Pennsylvania Ave by IMF Consistent RPP enforcement throughout study area over time
21
RPP Enforcement
Meter Enforcement

Top Parking Violations (2014 vs. 2015) ANC 2B North
2014 Count 2014 % 2014 Rank 2015 Count 2015 % 2015 Rank Park at Expired Meter 21,211 25.4% 1 20,649 20.9% 1 Street Cleaning 11,336 13.6% 2 11,991 12.1% 2 Disobeying Official Sign 6,923 8.3% 3 7,456 7.6% 4 Overtime RPP Zone 5,431 6.5% 4 9,365 9.5% 3 No Parking Anytime 3,959 4.7% 5 4,781 4.8% 5
ANC 2B South 2014 Count 2014 % 2014 Rank 2015 Count 2015 % 2015 Rank
Park at Expired Meter 38,304 33.9% 1 36,909 31.4% 1 Rush Hour Restriction 15,054 13.3% 2 16,512 14.1% 2 Parking in an Alley 6,110 5.4% 3 6,093 5.2% 4 Overtime Parking 5,930 5.3% 4 9,925 8.4% 3 No Parking Anytime 4,391 3.9% 5 4,781 4.1% 7
ANC 2D 2014 Count 2014 % 2014 Rank 2015 Count 2015 % 2015 Rank
Overtime RPP Zone 3,685 41.3% 1 2,959 38.5% 1 Overtime Parking 720 8.1% 2 451 5.9% 3 No Parking Anytime 541 6.1% 3 554 7.2% 2 Park at Expired Meter 490 5.5% 4 391 5.1% 4 Disobey Official Sign 472 5.3% 5 266 3.5% 6
23
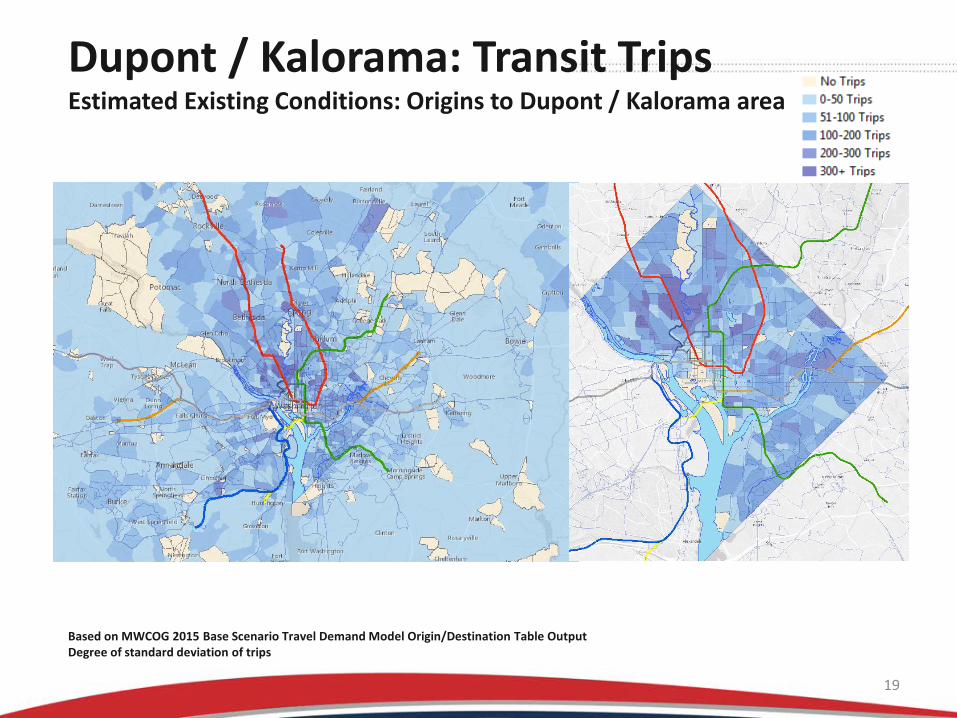
Meter Transaction Trends
Very high Pay by Cell adoption rate in the District
Consistent meter overstay patterns in several parts of Dupont Relation to adjacent land uses (i.e. restaurants, medical offices, food trucks)
Pay by Cell Overstay Trends
Multispace Over Stay
Single space Over Stay
Considerations Adjusting meter time limits Coordinated enforcement Demand responsive meter operations

Field Data Collection • Purpose to determine ‘who’ is and how many are parking on curbside parking spaces • Data collection by vehicle and on handhelds conducted on following dates/times
• Information derived from data includes: – Vehicle Count – RPP Permits
• Parked within ANC? • Parked within Walkshed?
– Visitor Parking Permit usage – Reciprocity Permit – ADA placard use – State of vehicle registration (DC, MD, VA, other)
24
Weekday AM 6 - 9 AM
Weekday Mid-Day 10 AM – 1 PM
Weekday PM 4 - 7 PM
Friday PM* 10 PM – 12 AM
Saturday Mid-Day 10 AM – 1 PM
Sunday Mid-Day 10 AM – 1 PM
10 February 2016 19 February 2016 13 February 2016 14 February 2016
23 February 2016 20 February 2016
25 February 2016
* - Vehicle Data Collection Only

Field Data Collection
25
AM Field Plate Occupancy Mid-day Field Plate Occupancy PM Field Plate Occupancy
= 70-80% Occupancy = 80-90% Occupancy
= 90-100% Occupancy = +100% Occupancy
No color = Below 70% Occupancy
Friday Late Field Plate Occupancy Saturday Mid-day Field Plate Occupancy Sunday Mid-Day Field Plate Occupancy

Vehicle Data Collection
26
AM Field LPR Occupancy Mid-day Field LPR Occupancy PM Field LPR Occupancy
Sunday Mid-Day Field LPR Occupancy
Saturday Mid-Day Field LPR Occupancy
Friday Late Field LPR Occupancy
= 70-80% Occupancy = 80-90% Occupancy
= 90-100% Occupancy = +100% Occupancy
No color = Below 70% Occupancy

Field Data Collection: Occupancy Demographics
27
AM Hours Midday Hours Evening Hours
Weekend Midday
Occupancy 63% 96% 81% 71%
Out of State 37% 54% 41% 52%
Out of Ward 45% 67% 53% 68%
Out of ANC 2B* 88% 97% 95% 97%
Out of ANC 2D* 100% 100% 100% 100%
*Only includes smaller area, not entire study area

Initial Findings Potential Solutions to Explore:
RESIDETIAL PARKING
RPP Program • Limit the number of permits per
household • Tiered pricing system for permits • Set permit pricing per vehicle size • Adjust RPP Curbside Restrictions
Transportation Demand Management Strategies (TDM) • Expand car sharing • Expand Parking Section of the
webpage (example: www. godcgo.com)
VISITOR PARKING
Diversify visitor permit distribution methods (online, pay by cell, MPD)
Setting limits on visitor permit distribution (daily pass, weekly pass, and quarterly or yearly cap on unit permits per household)
Pricing visitor permits
COMMERICAL PARKING
Establish performance pricing
Expand Parking Section of the webpage (example: www. godcgo.com)
Extend metered parking to residential streets with exemption to RPP permit holders
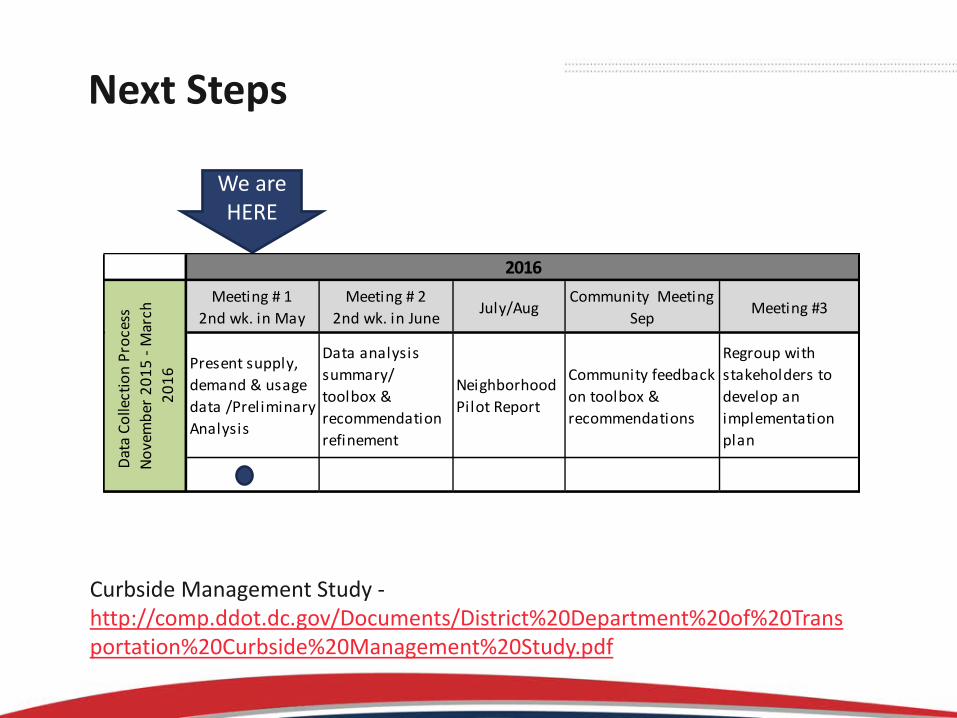
Curbside Management Study - http://comp.ddot.dc.gov/Documents/District%20Department%20of%20Transportation%20Curbside%20Management%20Study.pdf
Next Steps
We are HERE
Meeting # 1 2nd wk. in May
Meeting # 2 2nd wk. in June July/Aug
Community Meeting Sep Meeting #3
Present supply, demand & usage data /Preliminary Analysis
Data analysis summary/ toolbox & recommendation refinement
Neighborhood Pilot Report
Community feedback on toolbox & recommendations
Regroup with stakeholders to develop an implementation plan
2016
Data
Col
lect
ion
Proc
ess
Nove
mbe
r 201
5 - M
arch
20
16

GROUP DISCUSSION
30

31